Preventive lipid‐based nutrient supplements given with complementary foods to infants and young children 6 to 23 months of age for health, nutrition, and developmental outcomes
Abstract
Background
One nutritional intervention advocated to prevent malnutrition among children is lipid‐based nutrient supplements (LNS). LNS provide a range of vitamins and minerals, but unlike most other micronutrient supplements, LNS also provide energy, protein and essential fatty acids. Alternative recipes and formulations to LNS include fortified blended foods (FBF), which are foods fortified with vitamins and minerals, and micronutrient powders (MNP), which are a combination of vitamins and minerals,
Objectives
To assess the effects and safety of preventive LNS given with complementary foods on health, nutrition and developmental outcomes of non‐hospitalised infants and children six to 23 months of age, and whether or not they are more effective than other foods (including FBF or MNP).
This review did not assess the effects of LNS as supplementary foods or therapeutic foods in the management of moderate and severe acute malnutrition.
Search methods
In October 2018, we searched CENTRAL, MEDLINE, Embase, 21 other databases and two trials registers for relevant studies. We also checked the reference lists of included studies and relevant reviews and contacted the authors of studies and other experts in the area for any ongoing and unpublished studies.
Selection criteria
Randomised controlled trials (RCTs) and quasi‐RCTs that evaluated the impact of LNS plus complementary foods given at point‐of‐use (for any dose, frequency, duration) to non‐hospitalised infants and young children aged six to 23 months in stable or emergency settings and compared to no intervention, other supplementary foods (i.e. FBF), nutrition counselling or multiple micronutrient supplements or powders for point‐of‐use fortification of complementary foods.
Data collection and analysis
Two review authors independently screened studies for relevance and, for those studies included in the review, extracted data, assessed risk of bias and rated the quality of the evidence using the GRADE approach. We carried out statistical analysis using Review Manager software. We used a random‐effects meta‐analysis for combining data as the interventions differed significantly. We set out the main findings of the review in 'Summary of findings' tables,.
Main results
Our search identified a total of 8124 records, from which we included 17 studies (54 papers) with 23,200 children in the review. The included studies reported on one or more of the pre‐specified primary outcomes, and five studies included multiple comparison groups.
Overall, the majority of trials were at low risk of bias for random sequence generation, allocation concealment, blinding of outcome assessment, incomplete outcome data, selective reporting and other sources of bias, but at high risk of bias for blinding of participants and personnel due to the nature of the intervention. Using the GRADE approach, we judged the quality of the evidence for most outcomes as low or moderate.
LNS+complementary feeding compared with no intervention Thirteen studies compared LNS plus complementary feeding with no intervention. LNS plus complementary feeding reduced the prevalence of moderate stunting by 7% (risk ratio (RR) 0.93, 95% confidence interval (CI) 0.88 to 0.98; nine studies, 13,372 participants; moderate‐quality evidence), severe stunting by 15% (RR 0.85, 95% CI 0.74 to 0.98; five studies, 6151 participants; moderate‐quality evidence), moderate wasting by 18% (RR 0.82, 95% CI 0.74 to 0.91; eight studies; 13,172 participants; moderate‐quality evidence), moderate underweight by 15% (RR 0.85, 95% CI 0.80 to 0.91; eight studies, 13,073 participants; moderate‐quality evidence), and anaemia by 21% (RR 0.79, 95% CI 0.69 to 0.90; five studies, 2332 participants; low‐quality evidence). There was no impact of LNS plus complementary feeding on severe wasting (RR 1.27, 95% CI 0.66 to 2.46; three studies, 2329 participants) and severe underweight (RR 0.78, 95%CI 0.54 to 1.13; two studies, 1729 participants). Adverse effects did not differ between the groups (RR 0.86, 95% CI 0.74 to 1.01; three studies, 3382 participants).
LNS+complementary feeding compared with FBF Five studies compared LNS plus complementary feeding with other FBF, including corn soy blend and UNIMIX. We pooled four of the five studies in meta‐analyses and found that, when compared to other FBF, LNS plus complementary feeding significantly reduced the prevalence of moderate stunting (RR 0.89, 95% CI 0.82 to 0.97; three studies, 2828 participants; moderate‐quality evidence), moderate wasting (RR 0.79, 95% CI 0.65 to 0.97; two studies, 2290 participants; moderate‐quality evidence), and moderate underweight (RR 0.81, 95% CI 0.73 to 0.91; two studies, 2280 participants; moderate‐quality evidence). We found no difference between LNS plus complementary feeding and FBF for severe stunting (RR 0.41, 95% CI 0.12 to 1.42; two studies, 729 participants; low‐quality evidence), severe wasting (RR 0.64, 95% CI 0.19 to 2.81; two studies, 735 participants; moderate‐quality evidence), and severe underweight (RR 1.23, 95% CI 0.67 to 2.25; one study, 173 participants; low‐quality evidence).
LNS+complementary feeding compared with MNP Four studies compared LNS plus complementary feeding with MNP. We pooled data from three of the four studies in meta‐analyses and found that compared to MNP, LNS plus complementary feeding significantly reduced the prevalence of moderate underweight (RR 0.88, 95% CI 0.78 to 0.99; two studies, 2004 participants; moderate‐quality evidence) and anaemia (RR 0.38, 95% CI 0.21 to 0.68; two studies, 557 participants; low‐quality evidence). There was no difference between LNS plus complementary feeding and MNP for moderate stunting (RR 0.92, 95% CI 0.82 to 1.02; three studies, 2365 participants) and moderate wasting (RR 0.97, 95% CI 0.77 to 1.23; two studies, 2004 participants).
Authors' conclusions
The findings of this review suggest that LNS plus complementary feeding compared to no intervention is effective at improving growth outcomes and anaemia without adverse effects among children aged six to 23 months in low‐ and middle‐income countries (LMIC) in Asia and Africa, and more effective if provided over a longer duration of time (over 12 months). Limited evidence also suggests that LNS plus complementary feeding is more effective than FBF and MNP at improving growth outcomes.
PICO
Plain language summary
Effect of lipid‐based nutrient supplementation on infants and young children
Review question
What is the impact of lipid‐based nutrient supplements (LNS) plus complementary foods on health, nutrition and developmental outcomes among infants and young children?
Background
LNS are food products which contain energy, minerals and vitamins that can improve growth in children. LNS provide vitamins, minerals and energy in the form of protein and essential fatty acids. We sought to assess the effect of LNS given jointly with complementary feeding, compared to no intervention, micronutrient powders (MNP; a mixture of vitamins and minerals that is sprinkled onto food) and other fortified blended food (FBF) products in healthy children.
Study characteristics
This review includes 17 studies (from 54 reports) with 23,200 children. Four of the included studies were conducted in Malawi, three in Bangladesh, two in Ghana and one each in Burkina Faso, Haiti, Honduras, Chad, Congo, Kenya, Niger, Peru, Guatemala, and Indonesia. Four included studies enrolled pregnant women and provided LNS plus complementary feeding during pregnancy and post‐partum, followed by infant supplementation starting at six months of age. The other studies provided LNS plus complementary feeding to children after six months of age. None of the included studies were conducted in emergency settings.
Key results
Findings of this review suggest that LNS plus complementary feeding is probably an effective intervention for improving growth outcomes and reducing the occurrence of children who are of short stature for their age (stunting), have low weight for their age (moderate underweight), have low weight for their height (moderate wasting) and anaemia. Additionally, LNS plus complementary feeding probably improves height and weight for age as well as mid‐upper arm circumference without adverse effects among children aged six to 23 months. The intervention seems to be more effective if provided for a duration longer than 12 months.
Evidence also suggests that LNS plus complementary probably reduces moderate stunting, moderate wasting and moderate underweight, compared to other FBF.
Furthermore, LNS plus complementary feeding is probably more effective than MNP at reducing moderate underweight and improving height and weight.
Quality of evidence
Overall, we considered most studies to be at high risk of bias for blinding of participants and personnel due to the nature of intervention. We rated the quality of the evidence for most outcomes as either low or moderate.
Currentness of evidence
The evidence is current to October 2018.
Authors' conclusions
Summary of findings
| LNS plus complementary feeding compared with no intervention | ||||||
| Patient or population: children aged 6 to 23 months Settings: community Intervention: LNS plus complementary feeding Comparison: no intervention | ||||||
| Outcomes | Illustrative comparative risks* (95% CI) | Relative effect | Number of participants | Quality of the evidence | Comments | |
| Assumed risk | Corresponding risk | |||||
| No intervention | LNS plus complementary feeding | |||||
| Stunting | ||||||
| Moderate stunting Measured as height‐for‐age z score < −2 SD Measured at 12, 18 and 24 months of age | 2618/7137 | 2353/7060 | RR 0.93 (0.88 to 0.98) | 13,372 | ⊕⊕⊕⊝ | 2 studies, Kumwenda 2014 and Mangani 2015, contributed data to multiple comparisons; total number of comparisons = 13 |
| Severe stunting Measured as height‐for‐age z score < −3 SD Measured at 12, 18 and 24 months of age | 471/4188 | 290/2868 | RR 0.85 (0.74 to 0.98) | 6151 (5 studies) | ⊕⊕⊕⊝ | 2 studies, Kumwenda 2014 and Mangani 2015, contributed data to multiple comparisons; total number of comparisons = 9 |
| Wasting | ||||||
| Moderate wasting Measured as weight‐for‐height z score < −2 SD Measured at 12, 18 and 24 months of age | 695/6213 | 624/6959 | RR 0.82 (0.74 to 0.91) | 13,172 (8 studies) | ⊕⊕⊕⊝ | 1 study, Kumwenda 2014, contributed data to 2 comparisons; total number of comparisons = 11 |
| Severe wasting Measured as weight‐for‐height z score < −3 SD Measured at 12 and 18 months of age | 18/1636 | 21/1663 | RR 1.27 (0.66 to 2.46) | 2329 (3 studies) | ⊕⊕⊕⊕ | 1 study, Kumwenda 2014, contributed data to 4 comparisons; total number of comparisons = 6 |
| Underweight | ||||||
| Moderate underweight Measured as weight‐for‐age z score < −2 SD Measured at 12, 18 and 24 months of age | 1723/7013 | 1525/6861 | RR 0.85 (0.80 to 0.91) | 13,073 (8 studies) | ⊕⊕⊕⊝ | 1 study, Kumwenda 2014, contributed data to 4 comparisons; total number of comparisons = 11 |
| Severe underweight Measured as weight‐for‐age z score < −3 SD Measured at 12 and 18 months of age | 62/1224 | 50/1258 | RR 0.78 (0.54 to 1.13) | 1729 (2 studies) | ⊕⊕⊕⊕ | 1 study, Kumwenda 2014, contributed data to 4 comparisons; total number of comparisons = 5 |
| Anaemia Measured as haemoglobin < 10 g/dL Measured at 12, 18 and 24 months of age | 697/1359 | 558/973 | RR 0.79 (0.69 to 0.90) | 2332 (5 studies) | ⊕⊕⊝⊝ | ‐ |
| Adverse effects Defined as deaths, hospitalisations, congenital abnormalities and life‐threatening conditions requiring an immediate hospital visit Assessed at 12 and 18 months of age | 314/1369 | 401/2333 | RR 0.86 (0.74 to 1.01) | 3382 (3 studies) | ⊕⊕⊕⊝ | 1 study, Kumwenda 2014, contributed data to 2 comparisons; total number of comparisons = 4 |
| *The basis for the assumed risk (e.g. the median control group risk across studies) is provided in footnotes. The corresponding risk (and its 95% CI) is based on the assumed risk in the comparison group and the relative effect of the intervention (and its 95% CI). CI: confidence interval; LNS: lipid‐based nutrient supplement; RR: risk ratio; SD: standard deviation | ||||||
| GRADE Working Group grades of evidence | ||||||
| aDowngraded one level due to study limitations: high risk of selection bias (inadequate sequence generation process) in one study (Adu‐Afarwuah 2007); high risk of performance bias in seven studies (Adu‐Afarwuah 2016; Ashorn 2015; Christian 2015; Dewey 2017; Hess 2015; Luby 2018; Null 2018); and high risk of detection bias in one study (Christian 2015). | ||||||
| LNS plus complementary feeding compared with fortified blended food (FBF) | ||||||
| Patient or population: children aged 6 to 23 months Settings: community Intervention: LNS plus complementary feeding Comparison: FBF | ||||||
| Outcomes | Illustrative comparative risks* (95% CI) | Relative effect | Number of participants | Quality of the evidence | Comments | |
| Assumed risk | Corresponding risk | |||||
| FBF | LNS plus complementary feeding | |||||
| Stunting | ||||||
| Moderate stunting Measured as height‐for‐age z score < −2 SD Measured at 12 months and 18 months of age | 461/1048 | 735/1829 | RR 0.89 (0.82 to 0.97) | 2828 | ⊕⊕⊕⊝ | 1 study, Phuka 2008, contributed data to 2 comparisons; total number of comparisons = 4 |
| Severe stunting Measured as height‐for‐age z score < −3 SD Measured at 12 months and 18 months of age | 43/292 | 53/493 | RR 0.41 (0.12 to 1.42) | 729 (2 studies) | ⊕⊕⊕⊝ | 1 study, Phuka 2008, contributed data to 2 comparisons; total number of comparisons = 3 |
| Wasting | ||||||
| Moderate wasting Measured as weight‐for‐height z score < −2 SD Measured at 12 months and 18 months of age | 145/886 | 195/1462 | RR 0.79 (0.65 to 0.97) | 2290 (2 studies) | ⊕⊕⊕⊝ | 1 study, Phuka 2008, contributed data to 2 comparisons; total number of comparisons = 3 |
| Severe wasting Measured as weight‐for‐height z score < −3 SD Measured at 12 months and 18 months of age | 5/296 | 5/497 | RR 0.64 (0.19 to 2.18) | 735 (2 studies) | ⊕⊕⊕⊝ | 1 study, Phuka 2008, contributed data to 2 comparisons; total number of comparisons = 3 |
| Underweight | ||||||
| Moderate underweight Measured as weight‐for‐age z score < −2 SD Measured at 12 months and 18 months of age | 355/876 | 478/1457 | RR 0.81 (0.73 to 0.91) | 2280 (2 studies) | ⊕⊕⊕⊝ | 1 study, Phuka 2008, contributed data to 2 comparisons; total number of comparisons = 3 |
| Severe underweight Measured as weight‐for‐age z score < −3 SD Measured at 12 months of age | 34/722 | 60/1505 | RR 1.23 (0.67 to 2.25) | 173 (1 study) | ⊕⊕⊝⊝ | 1 study, Phuka 2008, contributed data to 2 arms to this analysis; total number of comparisons = 2 |
| Anaemia | None of the included studies reported this outcome | |||||
| Adverse effects | None of the included studies reported this outcome | |||||
| *The basis for the assumed risk (e.g. the median control group risk across studies) is provided in footnotes. The corresponding risk (and its 95% CI) is based on the assumed risk in the comparison group and the relative effect of the intervention (and its 95% CI). CI: Confidence interval; LNS: lipid‐based nutrient supplements; RR: Risk Ratio; SD: Standard deviation. | ||||||
| GRADE Working Group grades of evidence | ||||||
| aDowngraded one level due to study limitations: high risk of performance bias in two studies (Christian 2015; Phuka 2008). | ||||||
| LNS plus complementary feeding compared with micronutrient powders (MNP) | ||||||
| Patient or population: children aged 6 to 23 months Settings: community Intervention: LNS plus complementary feeding Comparison: MNP | ||||||
| Outcomes | Illustrative comparative risks* (95% CI) | Relative effect | Number of participants | Quality of the evidence | Comments | |
| Assumed risk | Corresponding risk | |||||
| MNP | LNS plus complementary feeding | |||||
| Moderate stunting Measured as height‐for‐age z score < −2 SD Measured at 12 months and 24 months of age | 421/1059 | 336/945 | RR 0.92 (0.82 to 1.02) | 2365 | ⊕⊕⊕⊝ | ‐ |
| Moderate wasting Measured as weight‐for‐height z score < −2 SD Measured at 12 months and 24 months of age | 133/1059 | 115/945 | RR 0.97 (0.77 to 1.23) | 2004 | ⊕⊕⊕⊝ | ‐ |
| Moderate underweight Measured as weight‐for‐age z score < −2 SD Measured at 12 months and 24 months of age | 376/1059 | 292/945 | RR 0.88 (0.78 to 0.99) | 2004 | ⊕⊕⊕⊝ | ‐ |
| Anaemia Measured as haemoglobin < 10 g/dL Measured at 12 months of age | 18/98 | 10/98 | RR 0.38 (0.21 to 0.68) | 557 | ⊕⊕⊝⊝ | ‐ |
| Adverse effects | None of the included studies reported this outcome | |||||
| *The basis for the assumed risk (e.g. the median control group risk across studies) is provided in footnotes. The corresponding risk (and its 95% CI) is based on the assumed risk in the comparison group and the relative effect of the intervention (and its 95% CI). CI: Confidence interval; LNS: Lipid‐based nutrient supplements; RR: Risk ratio; SD: Standard deviation. | ||||||
| GRADE Working Group grades of evidence | ||||||
| aDowngraded one level due to study limitations: high risk of performance bias in two studies (Adu‐Afarwuah 2016; Dewey 2017). | ||||||
Background
Description of the condition
Each year, malnutrition − including fetal growth restriction, stunting, wasting and micronutrient deficiencies −and suboptimum breastfeeding underlie nearly 3.1 million deaths of children under the age of five years worldwide, accounting for 45% of all deaths in this age group (Liu 2012). Globally in 2011, at least 165 million children were stunted (below −2 standard deviations (SD) from median height for age of reference population) and 52 million were wasted (below − 2 SD from median weight for height of reference population). Although the prevalence of stunting has decreased during the past two decades, it remains higher in South Asia (27%) and Sub‐Saharan Africa (36%) compared to high‐income countries (7%) (Black 2013; WHO 2014). Micronutrient deficiencies are also prevalent in children and these deficiencies are associated with learning disability, impaired work capacity and increased morbidity and mortality in adulthood (Black 2013). Undernutrition among children has also been associated with delayed or compromised motor and cognitive development, decreased school achievement, and consequently, reduced economic productivity (The World Bank 2006).
Disruption and displacement of populations in emergency situations pose an added threat to the existing situation of malnutrition among children. Women and children represented over three‐quarters of the estimated 80 million people in need of humanitarian assistance in 2014, and many countries with high maternal, newborn and child mortality rates are affected by humanitarian emergencies (UNICEF 2014). Malnutrition has been recorded as either a direct or an underlying cause of child mortality in emergencies (UNICEF 2014).
In order for countries to meet global targets for improved maternal, infant and child nutrition, there is a need to emphasise early prevention to address general deprivation and inequity for sustainable reductions in malnutrition (WHO 2014). Prevention is emphasised because the extent to which the effects of early damage are reversible is a complex area of ongoing research (Victora 2008). The concept of a preventive role of nutrition interventions is complex in settings with existing widespread and chronic undernutrition. However, the preventive approach aims to improve the daily nutritional intake by providing required calories, minerals and vitamins, and hence preventing undernutrition among children in vulnerable settings.
Description of the intervention
Ideally, infants are breastfed for two years or longer, with complementary food introduced at six months of age (WHO 2014). Diets of infants and young children aged six to 23 months need to include a variety of nutrient‐dense foods, preferably from local sources, to ensure their nutrient needs are met (WHO 2014). However, children's diets are likely to be deficient in macronutrients and micronutrients, specifically essential fatty acids, when nutrient‐rich diets are not available to them in resource‐poor settings (Arimond 2015). Various interventions are recommended, or have been used, to improve child malnutrition, including improved maternal nutrition, promotion of breast feeding, appropriate complementary feeding and prophylactic vitamin A and zinc supplementation in children, along with other indirect interventions, including agricultural and financial interventions (Bhutta 2013).
Supplementary feeding is a strategy that includes provision of extra food to children beyond the normal ration of their home diets and is aimed at improving the nutritional status or preventing the nutritional deterioration of the target population. One of the nutritional interventions advocated to address malnutrition among children is lipid‐based nutrient supplements (LNS). LNS are a family of products designed to deliver nutrients to vulnerable people. They are considered 'lipid‐based' because most of the energy provided by these products is from lipids (fats). All LNS provide a range of vitamins and minerals, but unlike most other micronutrient supplements, LNS also provide energy, protein and essential fatty acids (Chaparro 2010; Ilins 2015). LNS recipes can include a variety of ingredients, but typically have included vegetable fat, peanut or groundnut paste, milk powder and sugar. Based on the energy content, LNS can be small quantity (SQ LNS) providing ˜ 110 to 120 kcal/day (20 g dose), medium quantity (MQ LNS) providing ˜ 250 to 500 kcal/day (45 g to 90 g dose) or large‐quantity (LQ LNS) providing more than 280 kcal/day (> 90 g dose) (WHO 2012; WHO 2013). LNS are nutrient dense, require no cooking before use, and can be stored for months even in warm conditions (Phuka 2008).
Alternative recipes and formulations, other than LNS, are currently being explored using cereals mixed with other ingredients, including whey, soy protein isolate, dried skimmed milk, and sesame, cashew and chickpea paste, among others (Pee 2008). These are fortified with vitamins and minerals and are commonly called fortified blended foods (FBF). An example of a commonly used FBF is corn soy blend plus (CSB ++), which is a cooked blend of milled, heat‐treated corn and soybeans that is fortified with a vitamin and mineral premix. Multiple micronutrient powders (MNP) are also an alternative way of providing micronutrients. These are single‐dose packets of vitamins and minerals in powder form that can be sprinkled onto any ready to eat semi‐solid food consumed at home, school or any other point of use. The World Health Organization (WHO) recommends home fortification of foods with multiple MNP to improve iron status and reduce anaemia among infants and children aged six to 23 months of age where the prevalence of anaemia in children under five years of age is 20% or higher (WHO 2011). Besides complementary and supplementary feeding interventions, nutrition education and counselling provided to caregivers on the feeding of young children also have the potential to improve the nutritional status of children in developing countries (Lassi 2013). Nutrition education alone for improving complementary feeding practices in both food‐secure and food‐insecure populations has been shown to improve feeding practices and improve growth and anthropometric measures (Lassi 2013).
Though LNS or any other fortified food is not a replacement for breast milk or a diverse diet of local foods, the use of LNS for point‐of‐use fortification of complementary foods in infants aged six to 23 months has been proposed as a promising intervention for the prevention of malnutrition in vulnerable settings. LNS products are specifically designed to ensure nutrient adequacy (energy, protein and essential fatty acids), while simultaneously upholding other complementary feeding practices such as breastfeeding and dietary diversity.
How the intervention might work
The scope of this review is limited to assessing the effects of LNS for the prevention of malnutrition when given to children aged six to 23 months in addition to complementary foods. We did not assess the role of LNS as supplementary foods or therapeutic foods for the management of moderate and severe acute malnutrition.
LNS work by supplementing children with the required nutrients, mainly from lipids, and include energy, protein, essential fatty acids, and micronutrients in addition to the normal home diet. They provide calories as well as micronutrients. The doses and formulations of LNS can be modified according to the needs of the specific target group and, to date, there is no standard formulation (Dewey 2012). The supplements can be modified by adjusting the macronutrient content to maximise palatability and texture, and adding flavours according to regional taste preferences. It is further suggested that LNS are provided in single‐serving sachets to encourage thinking of it as a condiment, a medicine or a special food for a special group. Serving LNS in a single serving also prevents interfamily sharing since programmatic findings from studies suggest that there are issues with redistribution of the supplement within the family when feeding is home‐delivered, and much less leakage when delivered in day care centres (Kristjansson 2015). During manufacture, international guidelines need to be followed to prevent faecal contamination and fat oxidation to enhance shelf life (WHO 2012). The most commonly used formulations of fortified complementary food supplementation are Nutributter® (20 g or 108 kcal per day) and Plumpy'doz® (46 g or 246 kcal per day), both of which are produced by Nutriset, Malaunay, France, and ‘fortified spreads’ (25g to 75g or 128 to 384 kcal per day).
Studies have also explored the acceptability of LNS among infants (Adu‐Afarwuah 2011; Arimond 2015; Hess 2011), and suggest that mothers found it convenient to use, as it could be mixed with any food they preferred, and that the use of LNS could be made simpler by packaging the supplement in convenient daily doses. This shows that acceptability of LNS is similar to that of MNP, but that LNS can potentially also address general calorie deficit.
Why it is important to do this review
Recent research on smaller doses of LNS for the prevention of malnutrition has created interest in their potential use to ensure a nutritionally adequate ration for the most vulnerable groups, including children between six and 23 months of age (Chaparro 2010; Dewey 2012). Studies have shown mixed results for the impact of LNS on growth and development in infants and young children (Huybregts 2012; Iannotti 2013; Maleta 2015; Mangani 2013; Mangani 2015; Prado 2016; Thakwalakwa 2012; Thakwalakwa 2015). Furthermore, there could be potential concerns relating to LNS safety in areas where infections are common (De‐Regil 2013). A study from Malawi suggested that LNS containing iron did not increase morbidity in children and also did not affect guardian‐reported illness episodes, but may have increased malaria‐related non‐scheduled visits in one of the intervention groups (Bendabenda 2016). Other studies have suggested perceived benefits of LNS by care providers, including acceptability, adherence and willingness to pay (Iuel‐Brockdorf 2015; Segrè 2015). Several countries are implementing large‐scale projects that involve the provision of LNS as part of the interventions. An implementation survey of these interventions identified 20 projects providing LNS interventions, mostly in Sub‐Saharan Africa (UNICEF 2013). Of these, 17 were currently distributing LNS in 13 countries and three were planning to start distribution within the next 12 months. More than half (around 53%) of the implemented projects providing LNS aimed to improve complementary feeding or to prevent and treat moderate acute malnutrition (MAM), while 41% had an objective to prevent and control micronutrient malnutrition and 35% aimed to reduce stunting. Most of the planned LNS interventions that aimed to improve complementary feeding were integrated with existing infant and young child feeding programs, micronutrient prevention and control programs, humanitarian response programs and programs designed to prevent MAM (UNICEF 2013).
Reviews have evaluated supplementary feeding for children in the form of added meals, drinks or snacks, and suggest some benefit on child growth and psychosocial outcomes (Kristjansson 2015; Kristjansson 2016; Sguassero 2012). These reviews have assessed the effectiveness of community‐based supplementary feeding interventions among children under five years of age in disadvantaged population groups. Findings from one review on supplementary feeding suggested that the key for successful feeding programs for young children in low‐ and middle‐income countries (LMIC) is good implementation (Kristjansson 2015). To date, the benefits and harms of preventive LNS in infants and young children aged six to 23 months have not been systematically assessed. LNS products are more expensive to produce, transport and store compared to routine complementary food because of their composition, weight, and size. Hence, research is needed to determine the added benefit of LNS products for improved health and functional outcomes (UNICEF 2013), and studies are also needed to compare its effectiveness against natural local food sources. The retrieval, summary and assessment of the evidence for LNS compared to other supplements will assist international organisations and countries to make informed decisions about the benefits and harms of LNS in infants and young children when given with complementary foods. We have also developed a companion review on the effectiveness and safety of LNS when given to women during pregnancy on maternal, birth and infant outcomes (Das 2018), which will also guide policy makers in making informed decisions about the effectiveness and safety of LNS in pregnant women.
Objectives
To assess the effects and safety of preventive lipid‐based nutrient supplements (LNS) given with complementary foods on health, nutrition and developmental outcomes of non‐hospitalised infants and children six to 23 months of age, and whether or not LNS are more effective than other foods (including fortified blended foods (FBF) or multiple micronutrient powders (MNP)).
This review did not assess the effects of LNS as supplementary foods or therapeutic foods in the management of moderate and severe acute malnutrition.
Methods
Criteria for considering studies for this review
Types of studies
Randomised controlled trials (RCTs) and quasi‐RCTs.
Types of participants
All non‐hospitalised infants and young children aged six to 23 months of age in stable (i.e. not in any emergency‐affected country or emergency settings according to WHO definition (Wisner 2002). We did not include infants under six months of age, as exclusive breastfeeding is recommended from birth to six months. We included studies of apparently healthy children* from the general population, although some might be at risk of having highly prevalent diseases such as malaria, diarrhoea or even malnutrition. We did not exclude studies with infants and children with HIV infection, unless they were hospitalised or had a clinical condition.
*Apparently health children are children who were described by the study authors as being healthy. We did not include studies specifically undertaken with diseased or undernourished populations.
Types of interventions
All infants and young children who were not wasted and who were given LNS with complementary food at point‐of‐use for any dose, frequency and duration compared to no intervention, placebo, or compared with other foods/supplements or nutrition intervention. Specifically, we made the following comparisons.
-
Provision of LNS versus no intervention or placebo
-
Provision of LNS versus other supplementary foods (i.e. FBF)
-
Provision of LNS versus nutritional counselling (counselling to mothers and caregivers for appropriate feeding of infants and young children)
-
Provision of LNS versus provision of multiple micronutrient supplements or powders for point‐of‐use fortification of complementary foods
We included interventions that combined provision of LNS with co‐interventions, such as education or other approaches, if the other co‐interventions were the same in both the intervention and comparison groups.
Types of outcome measures
Primary outcomes
-
Stunting (moderate: height/length‐for‐age (HFA) < −2 standard deviations (SD); severe: HFA < −3 SD)
-
Wasting (moderate: weight‐for‐height/length (WFH) < −2 SD; severe: WFH < −3 SD)
-
Underweight (moderate: weight‐for‐age (WFA) < −2 SD; severe: WFA < −3 SD)
-
Anaemia (as defined by trialists)
-
Psychomotor development outcomes (as defined by trialists)
-
Neuro‐developmental outcomes (as defined by trialists)
-
Any adverse effects, including allergic reactions, as diagnosed by clinical assessment (atopic dermatitis, urticaria, oedema (oral), ophthalmic pruritus, allergic rhinitis, asthma, anaphylaxis)
Secondary outcomes
-
Mid‐upper arm circumference (MUAC; the circumference of the left upper arm, measured at the mid‐point between the tip of the shoulder and the tip of the elbow)
-
Haemoglobin (g/L)
-
Morbidity (incidence of diarrhoea, acute respiratory illness (ARI) and fever, as defined by trialists)
-
Mortality
Explanatory secondary outcomes
-
Height/length‐for‐age z score (HAZ)
-
Weight‐for‐age z score (WAZ)
-
Weight‐for‐height/length z score (WHZ)
Search methods for identification of studies
Electronic searches
We searched the sources listed below for intervention studies in March 2017, June 2018 and October 2018. On 5 March 2019, shortly before publication, we searched MEDLINE, Embase and the Retraction Watch Database retractiondatabase.org/RetractionSearch.aspx? to identify any retraction statements or errata relating to the included studies. These searches are reported in Appendix 1
International databases
-
Cochrane Central Register of Controlled Trials (CENTRAL; 2017, Issue 2) in the Cochrane Library, and which includes the Cochrane Developmental, Psychosocial and Learning Problems Specialised Register (searched 16 October 2018).
-
MEDLINE Ovid (1946 to 15 October 2018).
-
MEDLINE In‐Process and Other Non‐Indexed Citations Ovid (searched 15 October 2018).
-
MEDLINE E‐pub ahead of print Ovid (searched 15 October 2018).
-
Embase Ovid (1974 to 2018 week 42).
-
CINAHL EBSCOhost (Cumulative Index to Nursing and Allied Health Literature; 1937 to 16 October 2018).
-
Science Citation Index Web of Science (SCI; 1970 to 16 October 2018).
-
Social Sciences Citation Index Web of Science (SSCI; 1970 to 16 October 2018).
-
Conference Proceedings Citation Index ‐ Science Web of Science (CPCI‐S; 1990 to 16 October 2018).
-
Conference Proceedings Citation Index ‐ Social Science & Humanities Web of Science (CPCI‐SS&H; 1990 to 16 October 2018).
-
Cochrane Database of Systematic Reviews (CDSR; 2018, Issue 10), part of the Cochrane Library.
-
Database of Abstracts of Reviews of Effect (DARE; 2015, Issue 2) in the Cochrane Library. DARE ceased publication in 2015 (searched on 23 March 2017).
-
Epistemonikos (epistemonikos.org; searched 20 October 2018).
-
POPLINE (www.popline.org; searched 20 October 2018).
-
ClinicalTrials.gov (clinicaltrials.gov; searched 20 October 2018)
-
World Health Organization International Clinical Trials Registry Platform (WHO ICTRP; who.int/trialsearch; searched 20 October 2018).
Regional databases
-
IBECS (Índice Bibliográfico Español en Ciencias de la Salud;ibecs.isciii.es/cgi‐bin/wxislind.exe/iah/online/?IsisScript=iah/iah.xis&base=IBECS&lang=p&form=F; searched 19 October 2018).
-
SciELO (Scientific Electronic Library Online; www.scielo.br; searched 19 October 2018).
-
AIM (Africa Global Index Medicus; search.bvsalud.org/ghl/?lang=en&submit=Search&where=REGIONAL; searched 19 October 2018).
-
IMEMR (Index Medicus for the Eastern Mediterranean Region Global Index Medicus ; search.bvsalud.org/ghl/?lang=en&submit=Search&where=REGIONAL; searched 19 October 2018).
-
LILACS (Latin American and Caribbean Health Science Information database; lilacs.bvsalud.org/en; searched 19 October 2018).
-
PAHO/WHO Institutional Repository for Information Sharing (iris.paho.org/xmlui; searched 19 October 2018).
-
WHOLIS Global Index Medicus (WHO Library Database; search.bvsalud.org/ghl/?lang=en&submit=Search&where=REGIONAL; searched 19 October 2018).
-
WPRIM Global Index Medicus(Western Pacific Index Medicus; search.bvsalud.org/ghl/?lang=en&submit=Search&where=REGIONAL; searched 19 October 2018).
-
IMSEAR Global Index Medicus (Index Medicus for the South‐East Asian Region; search.bvsalud.org/ghl/?lang=en&submit=Search&where=REGIONAL; searched 19 October 2018).
-
IndMED (indmed.nic.in/indmed.html; searched 19 October 2018).
-
Native Health Research Database (hscssl.unm.edu/nhd; searched 19 October 2018).
We searched using both keywords and controlled vocabulary (when available), using the search strategies in Appendix 2. We did not apply language or date restrictions for any source. If we identified studies written in a language other than English, we commissioned their translation into English. If necessary, we would have recorded any such studies as 'Studies awaiting classification' until a translation became available.
Searching other resources
We checked the reference lists of included studies and relevant reviews for further studies. We contacted authors of eligible studies and other relevant persons for information about ongoing or unpublished studies we might have missed or, where necessary, to provide missing data (Dewey 2016 [pers comm]; Dewey 2017 [pers comm]; Stewart 2017 [pers comm]).
Data collection and analysis
Selection of studies
Two review authors independently assessed for inclusion all records generated by the search strategy. First, they screened titles and abstracts of all records retrieved, and short‐listed those deemed relevant. Next, they obtained and assessed the full texts of all potentially relevant records, assessing each one against the inclusion criteria (Criteria for considering studies for this review), before deciding on the final list of studies to be included in the review. Both review authors resolved any disagreements regarding eligibility at each stage of the selection process through discussion or, if required, in consultation with a third author. We recorded our decisions in a PRISMA diagram (Moher 2009).
Data extraction and management
We designed a data extraction form specifically for this review (Appendix 3). Two review authors used the form to extract data on study methods, participants, intervention, control, reported outcomes, source of funding and potential conflict of interest statements from all included studies. If studies reported outcomes at multiple time points, we extracted data for each time point and pooled studies reporting similar outcomes at similar time points. When information was unclear, we attempted to contact the authors of the original report to request they provide further details. We used these details, which are presented in the Characteristics of included studies tables, to explore and make inferences for the results.
Two review authors entered the data into Review Manager 5 (RevMan 5) (Review Manager 2014), and a third review author checked the data entry for accuracy by entering the data into a separate file and comparing the results.
We resolved discrepancies at all stages through discussion or, if required, through consultation with a third review author.
Assessment of risk of bias in included studies
Randomised studies
Two review authors independently assessed the risk of bias of each included study using the criteria outlined in the Cochrane Handbook for Systematic Reviews of Interventions (Higgins 2011a) and set out in Appendix 4. We rated each study at high, low or unclear risk of bias, across each of the following domains: random sequence generation; allocation concealment; blinding of participants and personnel; blinding of outcome assessment; incomplete outcome data; selective outcome reporting; and other potential sources of bias. Both review authors resolved any disagreement by discussion or by involving a third review author.
Overall risk of bias
We summarised the overall risk of bias at two levels: within studies (across domains), and across studies using the GRADE approach (Balshem 2010, GRADEpro GDT 2015). The GRADE findings are summarised in summary of findings Table for the main comparison, summary of findings Table 2 and summary of findings Table 3.
We assessed the likely magnitude and direction of bias in each of the above‐mentioned domains, if they were likely to impact the findings. We considered studies at high risk of overall bias if they were at high risk of bias for sequence generation, allocation concealment and blinding of outcome assessment. We considered studies at low risk of bias if they were at low risk of bias for sequence generation, allocation concealment and blinding of outcome assessment. We explored the impact of the level of bias through a Sensitivity analysis.
Measures of treatment effect
Dichotomous data
For dichotomous data, we presented results as a risk ratio (RR) with 95% confidence intervals (CI).
Continuous data
For continuous data, we used the mean difference (MD) with 95% CI if outcomes were measured in the same way between studies. We used the standardised mean difference (SMD) with 95% CI to combine studies that measured the same outcome but used different measurement methods.
When some studies reported endpoint data and others reported change from baseline data (with errors), we combined these in the meta‐analysis if the outcomes were reported using the same scale.
Please refer to our protocol, Das 2017, and Table 1 for methodology for rate data, archived for use in future updates of this review.
| Method | Approach |
| Measures of treatment effects | Rates If rates represent events that could occur more than once per participant, we will report the rate difference using the methodologies described in Deeks 2011. |
| Unit of analysis issues | Cluster‐randomised trials We will follow the methods described in theCochrane Handbook for Systematic Reviews of Interventions (Higgins 2011b), and adjust the sample sizes or standard errors of cluster‐randomised trials by using an estimate of the intra‐cluster correlation co‐efficient (ICC) derived from the study (if possible), from a similar trial or from a study of a similar population. If we use ICCs from other sources, we will report this in the results section, and conduct sensitivity analyses to investigate the effect of variation in the ICC. We will acknowledge heterogeneity in the randomisation unit and perform a sensitivity analysis to investigate the effects of the randomisation unit in the future updates of the review, if applicable. |
| Dealing with missing data | If we find studies with high levels of missing data, we will explore the effect in the overall assessment of treatment effect by removing such studies and conducting a sensitivity analysis. |
| Assessment of reporting bias | If we include 10 or more studies in a meta‐analysis, we will investigate reporting biases (such as publication bias) using funnel plots. We will assess funnel plot asymmetry visually, and use formal tests for funnel plot asymmetry. For continuous outcomes, we will use the test proposed by Egger 1997. For dichotomous outcomes, we will use the test proposed by Harbord 2006. If asymmetry is detected in any of these tests or is suggested by a visual assessment, we will perform exploratory analyses to investigate it. |
| Subgroup analysis and investigation of heterogeneity | We will conduct exploratory subgroup analyses on the primary outcomes, irrespective of heterogeneity, when there are more than three studies contributing data. We will conduct the following analyses.
|
| Sensitivity analysis | We will carry out a sensitivity analysis to examine:
|
ICC: Intra‐class correlation coefficient; WHO: World Health Organization.
Unit of analysis issues
Cluster‐randomised trials
All included cluster‐randomised trials reported cluster‐adjusted estimates. We combined the results from the individually‐randomised and cluster‐randomised trials. We considered it reasonable to combine the results from both when there was little heterogeneity between the study designs and the interaction between the effect of intervention and the choice of randomisation unit was considered unlikely.
Trials with more than two treatment groups
For trials with more than two intervention groups (multi‐arm trials), we included the directly relevant arms only. If we identified trials with various relevant arms, we combined the groups to form a single pair‐wise comparison (Higgins 2011b), and included the disaggregated data in the corresponding subgroup category. If the control group was shared by two or more study arms, we divided the control group (events and total population) over the number of relevant subgroup categories to avoid double counting the participants. We noted the details of all the intervention and control arms in the Characteristics of included studies tables.
Dealing with missing data
We attempted to obtain missing data from the study investigators. If this was not possible, we reported the data as missing and did not attempt to impute values.
We described missing data, including dropouts (attrition), in the 'Risk of bias' tables. Differential dropout rates can lead to biased estimates of the effect size, and bias may arise if the reasons for dropping out differ across groups. We reported the reasons for dropout, where available. If data were missing for some cases, or if the reasons for dropping out were not reported, we contacted the study authors and documented if the authors could not be contacted or did not respond.
For all outcomes, we carried out analyses, as far as possible, on an intention‐to‐treat basis (i.e. we attempted to include all participants randomised to each group in the analyses, and all participants were analysed in the group to which they were allocated, regardless of whether or not they received the allocated intervention). The denominator for each outcome in each trial was the number randomised minus any participants whose outcomes were known to be missing.
Assessment of heterogeneity
We assessed methodological heterogeneity by examining the methodological characteristics and risk of bias of the included trials, and clinical heterogeneity by examining the similarity between the types of participants, interventions and outcomes.
For statistical heterogeneity, we examined the forest plots from meta‐analyses to look for heterogeneity among trials, and used the I2 statistic, Tau2 and Chi2 test to quantify the level of heterogeneity among the trials in each analysis. If we identified moderate or substantial heterogeneity, we explored it by pre‐specified subgroup analysis (see Subgroup analysis and investigation of heterogeneity).
We advise caution in the interpretation of analyses with high degrees of heterogeneity (I2 > 50%). Where applicable, we have downgraded the quality of the evidence based on heterogeneity.
Assessment of reporting biases
We did not find 10 or more studies reporting on a single similar outcome, hence we could not assess for reporting bias. For the methodology to assess reporting bias in future updates of this review, please refer to our protocol, Das 2017, and Table 1.
Data synthesis
We carried out statistical analysis using RevMan 5 (Review Manager 2014). We used a random‐effects model as our primary analysis for combining data, considering the differences in the intervention, and tested the robustness of this decision by re‐analysing the data using a fixed‐effect model and comparing the results (see Sensitivity analysis). We used the generic inverse‐variance method for analyses that included cluster‐randomised trials; for those that did not, we used the Mantel‐Haenszel method.
In the Effects of interventions section, we list the primary outcomes for each comparison with estimates of relative effects, along with the number of participants and trials contributing data for each outcome. We present results as the average treatment effect with 95% CIs, and estimates of I2 (Deeks 2011).
We treated the random‐effects summary as the average range of possible treatment effects and we discussed the clinical implications of treatment effects differing between trials in the Discussion section (Summary of main results; Overall completeness and applicability of evidence).
'Summary of findings'
For the assessment across included trials, we set out the main findings of the review in 'Summary of findings' tables, prepared using GRADE software (GRADEpro GDT 2015). For each comparison (as mentioned in the Types of interventions section), we listed the primary outcomes (stunting, wasting, underweight, anaemia, adverse effects), assessed at 12, 18 and/or 24 months of age, with estimates of relative effects, along with the number of participants and trials contributing data for each outcome.
For each individual outcome, we assessed the quality of the evidence using the GRADE approach (Balshem 2010). This involves consideration of within‐study risk of bias (methodological quality), directness of evidence, heterogeneity, precision of effect estimates and risk of publication bias, and results in one of four quality ratings (high, moderate, low or very low).
Subgroup analysis and investigation of heterogeneity
We conducted the following exploratory subgroup analyses on the primary outcomes (where possible), irrespective of heterogeneity, and when there were more than three studies contributing data.
-
Energy content/formulation of product provided (SQ LNS providing ˜ 110 to 120 kcal per day; MQ LNS providing ˜ 250 to 280 kcal per day; LQ LNS providing > 280 kcal per day)
-
Duration of the intervention (up to six months versus six to 12 months versus more than 12 months duration)
-
Age at follow‐up (at 12 months versus at 18 months versus at 24 months versus at 36 months of age)
We assessed differences between subgroups by inspection of the subgroups’ CI; a non‐overlapping CI indicated a statistically significant difference in treatment effect between the subgroups. We also applied interaction tests, when possible.
Sensitivity analysis
We carried out sensitivity analyses to determine:
-
the effects of removing trials at high risk of bias (trials with poor or unclear allocation concealment and either blinding or high or imbalanced loss to follow‐up) from the analysis;
-
the effects of removing non‐randomised studies from the analysis;
-
the robustness of the results when using a fixed‐effect model;
-
the effects of different intraclass correlation coefficients (ICCs) for cluster‐randomised trials (where these were included); and
-
the effects of removing trials that also supplemented pregnant women with LNS in addition to children.
Results
Description of studies
Results of the search
Our searches identified a total of 14,390 potentially relevant titles from the electronic searches and 67 records from searching other sources . After removing duplicates, we screened 8124 records for eligibility and excluded 8036 on the basis of title and abstract. We obtained the full‐text reports of the remaining 88 records, and of these, excluded 29 reports (26 studies) and included 54 reports (17 studies) in the review. We also identified five ongoing studies. Figure 1 depicts the search flow diagram.
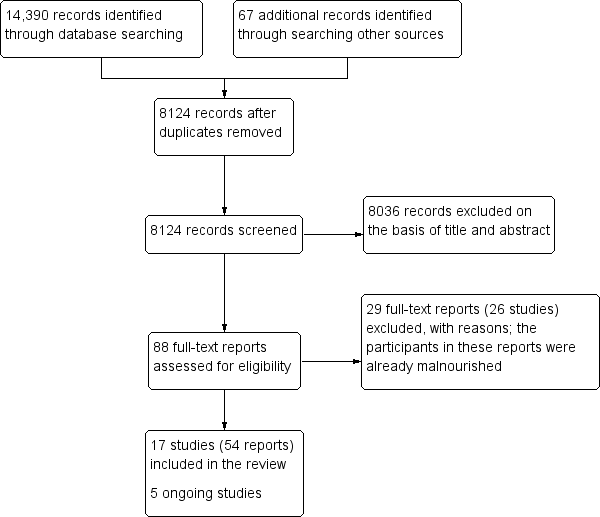
Study flow diagram.
Included studies
This review includes 17 studies (from 54 reports) with 23,200 children (Adu‐Afarwuah 2007; Adu‐Afarwuah 2016; Ashorn 2015; Bisimwa 2012; Christian 2015; Dewey 2017; Hess 2015; Huybregts 2012; Iannotti 2014; Kumwenda 2014; Luby 2018; Mangani 2015; Matias 2017; Null 2018; Olney 2018; Phuka 2008; Siega‐Riz 2014). All included studies were randomised controlled trials (RCTs) and published after the year 2007. See Characteristics of included studies tables.
Settings
Four studies were conducted in Malawi (Ashorn 2015; Kumwenda 2014; Mangani 2015; Phuka 2008), three in Bangladesh (Christian 2015; Dewey 2017; Luby 2018), two in Ghana (Adu‐Afarwuah 2007; Adu‐Afarwuah 2016), and one each in Burkina Faso (Hess 2015), Chad (Huybregts 2012), Congo (Bisimwa 2012), Guatemala (Olney 2018), Haiti (Iannotti 2014), Honduras (Siega‐Riz 2014), Kenya (Null 2018) and Peru (Matias 2017).
None of the included studies were conducted in emergency settings.
Participants
Most studies included children aged six months to 18 months (Adu‐Afarwuah 2007; Adu‐Afarwuah 2016; Ashorn 2015; Bisimwa 2012; Christian 2015; Hess 2015; Iannotti 2014; Kumwenda 2014; Mangani 2015; Matias 2017; Phuka 2008; Siega‐Riz 2014). Four studies included children aged six to 24 months (Dewey 2017; Olney 2018; Luby 2018; Null 2018) and one study included children aged six to 36 months (Huybregts 2012).
Four included studies enrolled pregnant women and provided lipid‐based nutrient supplements (LNS) plus complementary feeding during pregnancy and post‐partum, followed by infant supplementation at six months of age (Adu‐Afarwuah 2016; Ashorn 2015; Dewey 2017; Olney 2018). However, Dewey 2017 had an intervention arm in which only children were supplemented, hence we only used the data from that arm in the analysis in this review. The other studies provided LNS plus complementary feeding to children after six months of age.
Interventions
Ten studies provided small quantity lipid‐based nutrient supplements (SQ LNS) (Adu‐Afarwuah 2007; Adu‐Afarwuah 2016; Ashorn 2015; Dewey 2017; Hess 2015; Iannotti 2014; Luby 2018; Matias 2017; Null 2018; Olney 2018). Four studies provided MQ LNS (Bisimwa 2012; Huybregts 2012; Mangani 2015; Siega‐Riz 2014). Two studies provided both SQ LNS and MQ LNS (Kumwenda 2014; Phuka 2008), and one study provided SQ LNS to children aged six to 12 months and MQ LNS to children aged 12 to 18 months (Christian 2015). Table 2 provides further details on the composition of the LNS used in the included studies.
| Study | Total energy | Lipid content | Protein Content | Micronutrients |
| 108 kcal (20 g/day) | linoleic acid (1.29 g); linolenic acid (0.29 g) | Not specified | Carotene (400 μg RE); vitamin C (30 mg); folic acid (80 g); thiamine (0.3 mg); riboflavin (0.4 mg); vitamin B3 (4 mg); pantothenic acid (1.8 mg); vitamin B6 (0.3 mg); vitamin B12 (0.5 g); iron sulphate (9 mg); zinc sulphate (4 mg); calcium phosphate (100 mg); potassium (152 mg); copper sulphate (0.2 mg); sodium selenite (10 ug); potassium iodate (90 ug); phosphate (82 mg); magnesium (16 mg); manganese (0.08 mg); phytate (82 mg) | |
| 118 kcal (20 g/day) | 9.6 g | 2.6 g | Linoleic acid (4.46 g); α‐linolenic acid (0.58 g); vitamin A (400 mg retinol equivalents); thiamine (0.3 mg); riboflavin (0.4 mg); niacin (4 mg); vitamin B6 (0.3 mg); vitamin B12 (0.5 mg); vitamin C (30 mg); vitamin D (5 mg); vitamin E (6 mg); vitamin K (30 mg); folic acid (80 mg); pantothenic acid (1.8 mg); iron (6 mg); zinc (8 mg); copper (0.34 mg); calcium (280 mg); phosphorus (190 mg); potassium (200 mg); magnesium (40 mg); selenium (20 mg); iodine (90 mg); manganese (1.2 mg) | |
| 118 kcal (20 g/day) | 9.6 g | 2.6 g | Linoleic acid (4.46 g); a‐linolenic acid (0.58 g); vitamin A (400 mg RE); vitamin C (30 mg); vitamin B1 (0.3 mg); vitamin B2 (0.4 mg); niacin (4 mg); folic acid (80 mg); pantothenic acid (1.8 mg); vitamin B6 (0.3 mg); vitamin B12 (0.5 mg); vitamin D (5 mg); vitamin E (6 mg); vitamin K (30 mg); iron (6 mg); zinc (8 mg); copper (0.34 mg); calcium (280 mg); phosphorus (190 mg); potassium (200 mg); magnesium (40 mg); selenium (20 mg); iodine (90 mg); manganese (1.2 mg) | |
| 275 kcal (50 g/day) | Not specified | Not specified | Vitamin A (412 IU); vitamin D (307 IU); vitamin C (75 mg); thiamine (0.7 mg); riboflavin (1.0 mg); vitamin B12 (1.0 μg); pyridoxine (0.24 mg); niacin (10.3 mg); pantothenic acid (3.8 mg); folic acid (0.07 mg); vitamin K (0.01 mg); calcium (514 mg); phosphorus (265 mg); iron (9.5 mg); zinc (8.3 mg); copper (0.3 mg); iodine (0.07 mg); selenium (0.003 mg); magnesium (23.4 mg); phytic acid (0.425 mg2); phytic acid:iron molar ratio2 (2.1); phytic acid:zinc molar ratio2 (1.9) | |
| 250 kcal (46 g/day) | Not specified | Not specified | Not specified | |
| 118 kcal (20 g/day) | 9.6 g | 2.6 g | Linoleic acid (4.46 g); α‐linolenic acid (0.58 g); vitamin A (400 mg RE); thiamine (0.5 mg); riboflavin (0.5 mg); niacin (6 mg); folic acid (150 mg); pantothenic acid (2 mg); vitamin B6 (0.5 mg); vitamin B12 (0.9 mg); vitamin C (30 mg); vitamin D (5 mg); vitamin E (6 mg); vitamin K (30 mg); calcium (280 mg); copper (0.34 mg); iodine (90 mg); iron (9 mg); magnesium (40 mg); manganese (1.2 mg); phosphorus (190 mg); potassium (200 mg); selenium (20 mg); zinc (8 mg) | |
| 118 kcal (20 g/day) | 9.6 g | 2.6 g | Linoleic acid (4.46 g); α‐Linolenic acid (0.58 g); vitamin A (400 mg); thiamine (0.3 mg); riboflavin (0.4 mg); niacin (4 mg); pantothenic acid (1.8 mg); vitamin B6 (0.3 mg); vitamin B12 (0.5 mg); folic acid (80 mg); vitamin C (30 mg); vitamin D (5 mg); vitamin E (6 mg); vitamin K (30 mg); calcium (280 mg); copper (0.34 mg); iodine (90 mg); iron (6 mg); magnesium (40 mg); manganese (1.2 mg); phosphorus (190 mg); potassium (200 mg); selenium (20 μg); zinc (0 mg) | |
| 247 kcal (46 g/day) | 16 g | 5.9 g | Linoleic acid (2 g); α‐linolenic acid (0.3 g); vitamin A (400 mg); vitamin E (6 mg); thiamine (0.5 mg); niacin (6 mg); pantothenic acid (2 mg); vitamin B6 (0.5 mg); folic acid (160 mg); vitamin B12 (0.9 mg); vitamin C (30 mg); magnesium (60 mg); zinc (4 mg); iron (9 mg); copper (0.3 mg); potassium (310 mg); calcium (387 mg); phosphorus (275 mg); selenium (17 mg); manganese (0.17 mg); iodine (90 mg) | |
| 108 kcal (20 g/day) | 7.08 g | 2.56 g | Linoleic acid (1.29 g); α‐linoleic acid (0.29 g); vitamin A (400 mg); thiamine (0.3 mg); riboflavin (0.4 mg); niacin (4 mg); pantothenic acid (1.8 mg); vitamin B6 (0.3 mg); vitamin B12 (0.5 mg); folic acid (80 mg); vitamin C (30 mg); calcium (100 mg); copper (0.2 mg); iodine (90 mg); iron (9 mg); magnesium (16 mg); manganese (0.08 mg); phosphorus (82.2 mg); potassium (152 mg); selenium (10 mg); zinc (4 mg) | |
| 55 kcal (10 g/day) | 4.7 g | 1.3 g | Linoleic acid (2.22 g); α‐linolenic acid (0.29 g); vitamin A (400 μg RE); vitamin C (30 mg); vitamin B1 (0.3 mg); vitamin B2 (0.4 mg); niacin (4 mg); folic acid (80 μg); pantothenic acid (1.8 mg); vitamin B6 (0.3 mg); vitamin B12 (0.5 μg); vitamin D (200 IU); vitamin E (6 6 mg); vitamin K (30 μg); iron (6 mg); zinc (8 mg); copper (0.34 mg); calcium (240 mg); phosphorus (208 mg); potassium (265 mg); magnesium (50 mg); selenium (20 μg); iodine (90 μg); manganese (1.2 mg); phytate (28 mg) | |
| 17 kcal (20 g/day) | 9.5 g | 2.5 g | Linoleic acid (4.44 g); α‐linolenic acid (0.58 g); vitamin A (400 μg RE); vitamin C (30 mg); vitamin B1 (0.3 mg); vitamin B2 (0.4 mg); niacin (4 mg); folic acid (80 μg); pantothenic acid (1.8 mg); vitamin B6 (0.3 mg); vitamin B12 (0.5 μg); vitamin D (200 IU); vitamin E (6 6 mg); vitamin K (30 μg); iron (6 mg); zinc (8 mg); copper (0.34 mg); calcium (240 mg); phosphorus (208 mg); potassium (265 mg); magnesium (50 mg); selenium (20 μg); iodine (90 μg); manganese (1.2 mg); phytate (56 mg) | |
| 241 kcal (40 g/day) | 18.9 g | 5 g | Linoleic acid (8.88 g); α‐linolenic acid (1.16 g); vitamin A (400 μg RE); vitamin C (30 mg); vitamin B1 (0.3 mg); vitamin B2 (0.4 mg); niacin (4 mg); folic acid (80 μg); pantothenic acid (1.8 mg); vitamin B6 (0.3 mg); vitamin B12 (0.5 μg); vitamin D (200 IU); vitamin E (6 6 mg); vitamin K (30 μg); iron (6 mg); zinc (8 mg); copper (0.34 mg); calcium (240 mg); phosphorus (208 mg); potassium (265 mg); magnesium (50 mg); selenium (20 μg); iodine (90 μg); manganese (1.2 mg); phytate (112 mg) | |
| 118 kcal (20 g/day) | 9.6 g | 2.6 g | Linoleic acid (4.46 g); Alpha‐linolenic acid (0.58 g); Vitamin A (400 μg); Vitamin D (5 μg); Vitamin E (6 mg); Vitamin K (30 μg); Vitamin C (30 mg) Folic acid (150 μg); Thiamine (B1) (0.5 mg); Riboflavin (B2) (0.5 mg); Niacin (6 mg); Pantothenic acid (B5) (2 mg); Vitamin B6 (0.5 mg); Vitamin B12 (0.9 μg); Calcium (280 mg); Copper (0.34 mg); Iodine (90 μg); Iron (9 mg); Magnesium (40 mg); Manganese (1.2 mg); Phosphorous (190 mg); Potassium (200 mg); Selenium (20 μg); Zinc (8 mg) | |
| Milk‐LNS 284.8 kcal (54 g/day) | 17.9 g | 8.2 g | Retinol (400 μg RE); folate (160 μg); niacin (6 mg); pantothenic acid (2 mg); riboflavin (0.5 mg); thiamine (0.5 mg); vitamin B6 (0.5 mg); vitamin B12 (0.9 μg); vitamin C (30 mg); vitamin D (5 μg); calcium (366 mg); copper (0.4 mg); iodine (90 μg); iron (6 mg); magnesium (78.5 mg); selenium (20 μg); zinc (6.0 mg); phosphorus (185.6 mg); potassium (318.6 mg); manganese (0.60 mg) | |
| Soy‐LNS 276.1 kcal (54 g/day) | 18.5 g | 7.5 g | Retinol (400 μg RE); folate (160 μg); niacin (6 mg); pantothenic acid (2 mg); riboflavin (0.5 mg); thiamine (0.5 mg); vitamin B6 (0.5 mg); vitamin B12 (0.9 μg); vitamin C (30 mg); vitamin D (5 μg); calcium (366 mg); copper (0.4 mg); iodine (90 μg); iron (6 mg); magnesium (78.5 mg); selenium (20 μg); zinc (6.0 mg); phosphorus (185.6 mg); potassium (307.3 mg); manganese (0.60 mg) | |
| 110 kcal (20 g/day) | 7 g | 2.6 g | Linoleic acid (1.29 g); α‐linolenic acid (0.29 g); folic acid (80 μg); niacin (4 mg); pantothenic acid (1.8 mg); riboflavin (0.4 mg); thiamine (0.3 mg); vitamin A (400 μg); vitamin B12 (0.5 μg); vitamin B6 (0.3 mg); vitamin C (30 mg); calcium (100 mg); copper (0.2 mg); iodine (90 μg); iron (9 mg); magnesium (16 mg); manganese (0,08 mg); phosphorous (82 mg); potassium (152 mg); selenium (10 μg); zinc (4 mg) | |
| 118 kcal (20 g/day) | 9.6 g | 2.6 g | Linoleic acid (4.46 g); Alpha‐linolenic acid (0.58 g); Vitamin A (400 μg); Vitamin D (5 μg); Vitamin E (6 mg); Vitamin K (30 μg); Vitamin C (30 mg) Folic acid (150 μg); Thiamine (B1) (0.5 mg); Riboflavin (B2) (0.5 mg); Niacin (6 mg); Pantothenic acid (B5) (2 mg); Vitamin B6 (0.5 mg); Vitamin B12 (0.9 μg); Calcium (280 mg); Copper (0.34 mg); Iodine (90 μg); Iron (9 mg); Magnesium (40 mg); Manganese (1.2 mg); Phosphorous (190 mg); Potassium (200 mg); Selenium (20 μg); Zinc (8 mg) | |
| 118 kcal (20 g/day) | 9.6 g | 2.6 g | Linoleic acid (4.5 g); α‐linolenic acid (0.6 g); vitamin A (400 μg); vitamin C (30 mg); vitamin D (5 mg); vitamin E (6 mg); vitamin K (30 mg); thiamine (0.5 mg); riboflavin (0.5 mg); niacin (6 mg); pantothenic acid (2 mg); vitamin B6 (0.5 mg); folic acid (150 μg); vitamin B12 (0.9 μg); iron (9 mg); zinc (8 mg); copper (0.3 mg); selenium (20 μg); iodine (90 μg); calcium (280 mg); magnesium (40 mg); manganese (1.2 mg); phosphorus (190 mg); potassium (200 mg) | |
| 130 kcal (25 g/day) | 8.3 g | 3.8 g | Retinol (400 mg RE); folate (160 mg); niacin (6 mg); pantothenic acid (2 mg); riboflavin (0.5 mg); thiamine (0.5 mg); vitamin B 6 (0.5 mg); vitamin B12 (0.9 mg); vitamin C (30 mg); vitamin D (5 mg); calcium (283 mg); copper (0.5 mg); iodine (90 mg); iron (8 mg); magnesium (60 mg); selenium (17 mg); zinc (8.4 mg) | |
| 264 kcal (50 g/day) | 16.5 g | 7.6 g | Retinol (400 mg RE); folate (160 mg); niacin (6 mg); pantothenic acid (2 mg); riboflavin (0.5 mg); thiamine (0.5 mg); vitamin B6 (0.5 mg); vitamin B12 (0.9 mg); vitamin C (30 mg); vitamin D (5 mg); calcium (366 mg); copper (0.4 mg); iodine (90 mg); iron (8 mg); magnesium (60 mg); selenium (17 mg); zinc (8.4 mg) | |
| 247 kcal (46.4 g/day) | 16 g | 5.9 g | Vitamin A (400 μg); vitamin B12 (0.9 μg); iron (9 mg); zinc (9 mg) |
g: gram;
LNS: lipid‐based nutrient supplements
mg: milligram
Five studies provided other co‐interventions along with the LNS: Christian 2015 provided nutrition education and counselling; Hess 2015 provided malaria and diarrhoea treatment; Huybregts 2012 and Olney 2018 provided general food distribution; and Siega‐Riz 2014 provided food vouchers and nutrition education.
The duration of the intervention ranged from a minimum of three months (Iannotti 2014) to a maximum of 18 months (Dewey 2017; Luby 2018; Null 2018; Olney 2018).
Comparisons
Five of the 17 studies contributed data into multiple comparison groups (Adu‐Afarwuah 2007; Christian 2015; Dewey 2017; Mangani 2015; Olney 2018)
Thirteen studies compared LNS plus complementary feeding with no intervention (Adu‐Afarwuah 2007; Adu‐Afarwuah 2016; Ashorn 2015; Christian 2015; Dewey 2017; Hess 2015; Huybregts 2012; Iannotti 2014; Kumwenda 2014; Luby 2018; Mangani 2015; Null 2018; Siega‐Riz 2014). Four studies compared LNS plus complementary feeding with micronutrient powders (MNP) (Adu‐Afarwuah 2007; Dewey 2017; Matias 2017; Olney 2018). Five studies compared LNS plus complementary feeding with fortified blended foods (FBF), including corn soy blend and UNIMIX (Bisimwa 2012; Christian 2015; Mangani 2015; Olney 2018; Phuka 2008).
We did not find any study comparing LNS plus complementary feeding with nutritional counselling.
Outcome
One or more of the pre‐specified primary and secondary outcomes were reported by the studies included in the review.
Among the primary outcomes, nine studies reported stunting and wasting (Adu‐Afarwuah 2016; Ashorn 2015; Christian 2015; Dewey 2017; Hess 2015; Kumwenda 2014; Luby 2018; Mangani 2015; Null 2018); eight studies reported underweight (Adu‐Afarwuah 2016; Ashorn 2015; Christian 2015; Dewey 2017; Hess 2015; Kumwenda 2014; Luby 2018; Null 2018); five studies reported anaemia (Adu‐Afarwuah 2007; Dewey 2017; Hess 2015; Huybregts 2012; Siega‐Riz 2014), and three studies reported adverse events (Adu‐Afarwuah 2016; Ashorn 2015; Kumwenda 2014). Although 11 studies reported on psychomotor and/or neuro‐developmental outcomes (Adu‐Afarwuah 2007; Adu‐Afarwuah 2016; Ashorn 2015; Dewey 2017; Hess 2015; Kumwenda 2014; Luby 2018; Mangani 2015; Matias 2017; Null 2018; Phuka 2008), we were unable to combine the data from these studies in meta‐analyses, due to variances in the comparisons and reported outcomes.
Among the secondary outcomes, six studies reported mid‐upper arm circumference (MUAC) (Adu‐Afarwuah 2016; Ashorn 2015; Dewey 2017; Hess 2015; Huybregts 2012; Kumwenda 2014); four studies reported haemoglobin levels (Adu‐Afarwuah 2007; Hess 2015; Huybregts 2012; Siega‐Riz 2014); Seven studies reported on morbidity (Christian 2015; Hess 2015; Huybregts 2012; Kumwenda 2014; Mangani 2015; Luby 2018; Null 2018); however, we were unable to combine the data from these studies in meta‐analyses, due to variances in the comparisons and reported outcomes; and three studies reported mortality (Adu‐Afarwuah 2016; Ashorn 2015; Kumwenda 2014). Twelve studies also reported on our explanatory secondary outcomes of height‐for‐age z score (HAZ), weight‐for‐age z score (WAZ) and weight‐for‐height/length z score (WHZ) (Adu‐Afarwuah 2007; Adu‐Afarwuah 2016; Ashorn 2015; Christian 2015; Dewey 2017; Hess 2015; Huybregts 2012; Iannotti 2014; Kumwenda 2014; Luby 2018; Mangani 2015; Null 2018).
Most studies (n = 14) measured outcomes at 12 months (nine studies: Adu‐Afarwuah 2007; Bisimwa 2012; Iannotti 2014; Kumwenda 2014; Luby 2018; Matias 2017; Null 2018; Phuka 2008; Siega‐Riz 2014), and 18 months of age (five studies: Adu‐Afarwuah 2016; Ashorn 2015; Christian 2015; Hess 2015; Mangani 2015). Four studies measured outcomes at 24 months of age (Dewey 2017; Luby 2018; Null 2018; Olney 2018).
Funding sources
Most studies (n = 13) were funded non‐commercially, through not‐for‐profit organisations, university grants and ministries (Adu‐Afarwuah 2016; Ashorn 2015; Bisimwa 2012; Dewey 2017; Hess 2015; Huybregts 2012; Iannotti 2014; Kumwenda 2014; Luby 2018; Mangani 2015; Null 2018; Olney 2018; Siega‐Riz 2014). A further two studies received funds from non‐commercial entities but the LNS was provided by commercial entities (Christian 2015; Matias 2017). Two studies, Adu‐Afarwuah 2007 and Phuka 2008, were funded by commercial entity.
Further details on funding sources and the specific funding agencies are specified in the Characteristics of included studies tables.
Excluded studies
We excluded 26 studies (from 29 reports) (Ackatia‐Armah 2015; Adams 2017; Adams 2018; Ahmed 2014; Arimond 2017; Cercamondi 2013; Defourney 2009; Flax 2010; Flax 2013; Heidkamp 2012; Isanaka 2009; Iuel‐Brockdorf 2015; Kuusipalo 2006; LaGrone 2012; Langendorf 2014; Maleta 2004; Maryam 2015; Muslihah 2016; Rantesalu 2017; Schlossman 2017; Style 2017; Thakwalakwa 2010; Thakwalakwa 2012; Thakwalakwa 2015; Unger 2017; Vargas‐Vásquez 2015). We excluded most studies because participants were malnourished at the time of recruitment. The key reasons for exclusion of studies are described in the Characteristics of excluded studies tables.
Ongoing studies
We included five ongoing studies (Borg 2017; Fernald 2016; Huybregts 2017; ISRCTN94319790; SHINE trial 2015), which could potentially be included in the future update of this review. All five studies are RCTs.
-
The Borg 2017 study compares LNS with corn soy blend plus (CSB ++), Sprinkles or no intervention. The main outcome of interest is anthropometric status (i.e. HAZ, WHZ and WAZ).
-
The MAHAY study (Fernald 2016) is a multi‐arm trial comparing: an existing program with monthly growth monitoring and nutritional/hygiene education; home visits for intensive nutrition counselling within a behavior change framework; LNS for children aged six to 18 months; LNS supplementation of pregnant/lactating women; and an intensive home visiting program to support child development. The primary outcomes include growth and child development (mental, motor and social development), while the secondary outcomes include caregiver‐reported child morbidity, household food security and diet diversity, micro‐nutrient status, maternal knowledge of child care and feeding practices, and home stimulation practices.
-
The Prevention of Childhood Malnutrition (PROMIS) multi‐country study evaluates the prevention (through age‐stratified behaviour change communication targeted to the caregivers of the beneficiary children and the distribution of preventive doses of SQ LNS), screening, and referral of cases of acute malnutrition (Huybregts 2017). The primary outcomes include the incidence of acute malnutrition, monthly acute malnutrition screening coverage, and acute malnutrition treatment compliance.
-
The ISRCTN94319790 study is a community‐based, cluster‐controlled trial to evaluate the effectiveness of LNS and the proportional contribution of multisectoral interventions in the prevention of stunting among children under five years of age in Kurram Agency, Pakistan.
-
The Sanitation Hygiene Infant Nutrition Efficacy study is a 2 × 2 factorial, cluster‐randomised, community‐based trial conducted in two rural districts of Zimbabwe (SHINE trial 2015). The study comprises of four arms: water, sanitation, and hygiene (WASH) intervention; infant and young child feeding (IYCF) intervention; sanitation/hygiene and nutrition (WASH + IYCF); and standard care. The primary outcomes are HAZ and haemoglobin level at 18 months of age.
For further detail, see Characteristics of ongoing studies tables.
Risk of bias in included studies
A graphical summary of the results of the 'Risk of bias’ assessment is provided in Figure 2 and Figure 3. Overall, most trials were at low risk of bias for random sequence generation, allocation concealment, blinding of outcome assessment, incomplete outcome data, selective reporting and other sources of bias. We considered most trials to be at high risk of bias for blinding of participants and personnel due to the nature of the intervention.

'Risk of bias' graph: review authors' judgements about each risk of bias item presented as percentages across all included studies.
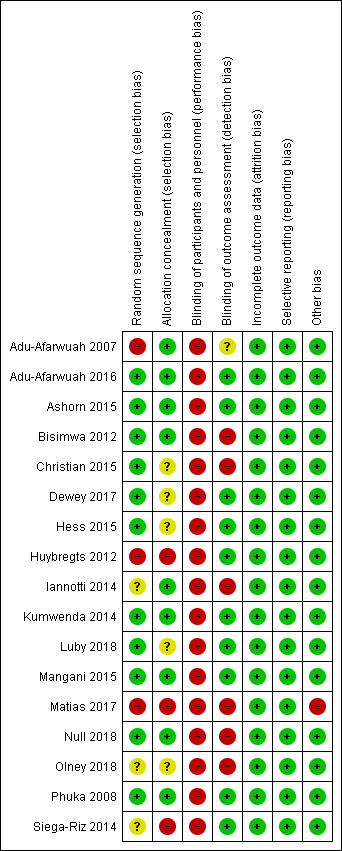
'Risk of bias' summary: review authors' judgements about each risk of bias item for each included study.
Allocation
Random sequence generation
For this domain, we rated three studies at high risk of bias since the methods used to sequence generation were not adequate (Adu‐Afarwuah 2007; Huybregts 2012; Matias 2017); three studies at unclear risk of bias since they did not specify the actual methods used for random sequence generation (Iannotti 2014; Olney 2018; Siega‐Riz 2014), and the remaining 11 studies at low risk of bias as they used adequate mechanisms for random sequence generation (Adu‐Afarwuah 2016; Ashorn 2015; Bisimwa 2012; Christian 2015; Dewey 2017; Hess 2015; Kumwenda 2014; Luby 2018; Mangani 2015; Null 2018; Phuka 2008).
Allocation concealment
Three studies did not conceal the allocation so we rated them at high risk of bias (Huybregts 2012; Matias 2017; Siega‐Riz 2014). We rated a further five studies at unclear risk of bias since they did not specify clearly the methods for allocation concealment (Christian 2015; Dewey 2017; Hess 2015; Luby 2018; Olney 2018). We considered the remaining nine trials to be at low risk of bias since the allocation was adequately concealed (Adu‐Afarwuah 2007; Adu‐Afarwuah 2016; Ashorn 2015; Bisimwa 2012; Iannotti 2014; Kumwenda 2014; Mangani 2015; Null 2018; Phuka 2008).
Blinding
Blinding of participants and personnel
We judged all 17 included studies to be at high risk of performance bias since participants and personnel were not blinded (Adu‐Afarwuah 2007; Adu‐Afarwuah 2016; Ashorn 2015; Bisimwa 2012; Christian 2015; Dewey 2017; Hess 2015; Huybregts 2012; Iannotti 2014; Kumwenda 2014; Luby 2018; Mangani 2015; Matias 2017; Null 2018; Olney 2018; Phuka 2008; Siega‐Riz 2014).
Blinding of outcome assessment
We rated 10 studies at low risk of detection bias as outcome assessors were adequately blinded to the allocated intervention (Adu‐Afarwuah 2016; Ashorn 2015; Dewey 2017; Hess 2015; Huybregts 2012; Kumwenda 2014; Luby 2018; Mangani 2015; Phuka 2008; Siega‐Riz 2014); six studies at high risk of detection bias as the outcome assessors were not blinded to the intervention allocation (Bisimwa 2012; Christian 2015; Iannotti 2014; Matias 2017; Null 2018; Olney 2018), and one study at unclear risk of detection bias as it did not clearly specify whether the outcome assessor was blinded to the intervention allocation (Adu‐Afarwuah 2007).
Incomplete outcome data
All included studies provided reasons for loss to follow‐up.
We rated all 17 studies to be at low risk of attrition bias because they did not have high rates of loss to follow‐up (Adu‐Afarwuah 2007; Adu‐Afarwuah 2016; Ashorn 2015; Bisimwa 2012; Christian 2015; Dewey 2017; Hess 2015; Huybregts 2012; Iannotti 2014; Kumwenda 2014; Luby 2018; Mangani 2015; Matias 2017; Null 2018; Olney 2018; Phuka 2008; Siega‐Riz 2014).
Selective reporting
We looked for published protocols and trial registration records to assess for selective reporting. With the exception of one study (Christian 2015), we found published protocols or trial registration records for all included studies. We judged all 17 included studies to be at low risk of reporting bias since the outcomes pre‐specified in the protocols were reported (Adu‐Afarwuah 2007; Adu‐Afarwuah 2016; Ashorn 2015; Bisimwa 2012; Dewey 2017; Hess 2015; Huybregts 2012; Iannotti 2014; Kumwenda 2014; Luby 2018; Mangani 2015; Matias 2017; Null 2018; Olney 2018; Phuka 2008; Siega‐Riz 2014). For Christian 2015, although we did not find the published protocol or trial registration record, the outcomes specified in the methodology section were reported in the paper. Hence, we judged Christian 2015 at low risk of reporting bias also.
Other potential sources of bias
We judged one study, Matias 2017, at high risk of other bias since it specified that the supplement was unavailable for a period of two months during the study, and during that time the probability of being enrolled in each group differed, but that those already enrolled in the LNS group continued receiving their monthly LNS supply. None of the other included studies reported any other potential sources of bias, so we rated those at low risk of other bias (Adu‐Afarwuah 2007; Adu‐Afarwuah 2016; Ashorn 2015; Bisimwa 2012; Christian 2015; Dewey 2017; Hess 2015; Huybregts 2012; Iannotti 2014; Kumwenda 2014; Luby 2018; Mangani 2015; Null 2018; Olney 2018; Phuka 2008; Siega‐Riz 2014).
Effects of interventions
See: Summary of findings for the main comparison ; Summary of findings 2 ; Summary of findings 3
Comparison 1: LNS versus no intervention
Thirteen studies compared LNS plus complementary feeding with no intervention (Adu‐Afarwuah 2007; Adu‐Afarwuah 2016; Ashorn 2015; Christian 2015; Dewey 2017; Hess 2015; Huybregts 2012; Iannotti 2014; Kumwenda 2014; Luby 2018; Mangani 2015; Null 2018; Siega‐Riz 2014). The included studies reported on one or more of the primary outcomes.
We rated the quality of the evidence for all outcomes as low or moderate, as per GRADE criteria. We downgraded the quality of the evidence due to study limitations, inconsistency and imprecision. See summary of findings Table for the main comparison.
Primary outcomes
Stunting: pooled study results
Compared to no intervention, LNS plus complementary feeding reduced the prevalence of moderate stunting by 7% (risk ratio (RR) 0.93, 95% confidence interval (CI) 0.88 to 0.98; nine studies; 13 comparisons, 13,372 participants; I2 = 25%; Tau2 = 0.00; Chi2 = 15.90; moderate‐quality evidence; Analysis 1.1; Figure 4) and severe stunting by 15% (RR 0.85, 95% CI 0.74 to 0.98; five studies (two of which contributed data to multiple comparisons; total number of comparisons = nine), 6151 participants, I2= 0%; Tau2 = 0.00; Chi2 = 3.70; moderate‐quality evidence; Analysis 1.2).
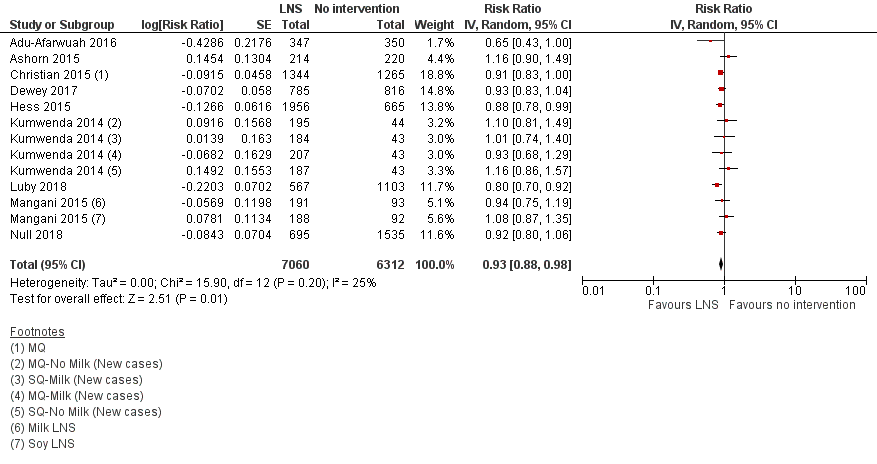
Forest plot of comparison: 1 LNS versus no intervention, outcome: 1.1 Moderate stunting.
We conducted a sensitivity analysis by removing trials that also supplemented pregnant women with LNS in addition to children (Adu‐Afarwuah 2016; Ashorn 2015), and found no significant difference in the outcome (Analysis 1.3; Analysis 1.4).
Wasting: pooled study results
Compared to no intervention, LNS plus complementary feeding reduced the prevalence of moderate wasting by 18% (RR 0.82, 95% CI 0.74 to 0.91; eight studies; 11 comparisons), 13,172 participants; I2= 0%; Tau2 = 0.00; Chi2 = 4.22; moderate‐quality evidence; Analysis 1.5; Figure 5), but had no effect on the prevalence of severe wasting (RR 1.27, 95% CI 0.66 to 2.46; three studies (two of which contributed data to multiple comparisons; total number of comparisons = seven), 2329 participants; I2 = 0%; Tau2 = 0.00; Chi2 = 4.52; moderate‐quality evidence; Analysis 1.6).

Forest plot of comparison: 1 LNS versus no intervention, outcome: 1.5 Moderate wasting.
We conducted sensitivity analysis after removing trials that also supplemented pregnant women with LNS in addition to children (Adu‐Afarwuah 2016; Ashorn 2015), and found no significant difference in the outcome (Analysis 1.7; Analysis 1.8).
Underweight: pooled study results
Compared to no intervention, LNS plus complementary feeding significantly reduced the prevalence of moderate underweight by 15% (RR 0.85, 95% CI 0.80 to 0.91; eight studies; 11 comparisons), 13,073 participants; I2= 0%; Tau2 = 0.00; Chi2 = 9.44; moderate‐quality evidence; Analysis 1.9), but had no effect on the prevalence of severe underweight (RR 0.78, 95% CI 0.54 to 1.13; two studies (one of which contributed data to four comparisons; total number of comparisons = five), 1729 participants; I2= 0%; Tau2 = 0.00; Chi2 = 0.97; moderate‐quality evidence; Analysis 1.10).
We conducted sensitivity analysis after removing trials that also supplemented pregnant women with LNS in addition to children (Adu‐Afarwuah 2016; Ashorn 2015) and found no significant difference in the outcome (Analysis 1.11; Analysis 1.12).
Anaemia: pooled study results
Compared to no intervention, LNS plus complementary feeding significantly reduced anaemia by 21% (RR 0.79, 95% CI 0.69 to 0.90; five studies, 2332 participants; I2= 66%; Tau2 = 0.01; Chi2 = 11.75; low‐quality evidence; Analysis 1.13).
Psychomotor development and neuro‐developmental outcomes: single study results
Nine studies reported data on psychomotor and neuro‐developmental outcomes (Adu‐Afarwuah 2007; Adu‐Afarwuah 2016; Ashorn 2015; Dewey 2017; Hess 2015; Kumwenda 2014; Luby 2018; Mangani 2015; Null 2018). Most of the studies reported data on gross motor development; however, we were unable to combine these data in a meta‐analysis due to variations in definitions and measurements. Hence, we have provided a narrative description of the findings for these outcomes directly below.
Adu‐Afarwuah 2007 reported that children in the LNS plus complementary feeding group "walked independently at 12 months" significantly earlier than the children in the no‐intervention group (RR 3.4, 95% CI 1.67 to 6.43), while there was no difference between the groups for "standing alone at 12 months".
Adu‐Afarwuah 2016 reported a significantly higher proportion of children "walking alone" in the LNS plus complementary feeding group at 12 months of age than in the no‐intervention group (RR 1.23, 95% CI 1.02 to 1.49). However, there were no differences between the groups for the other motor, language, socio‐emotional and executive function outcomes at 18 months of age.
Ashorn 2015 reported that children in the LNS plus complementary feeding group "walked alone" (B (beta) 0.53, 95% CI 0.11 to 0.94) and "waved goodbye" (B 0.60, 95% CI 0.12 to 1.08) earlier than children in the no‐intervention group. At 12 months age, more children in the LNS plus complementary feeding group "walked alone" than in the no‐intervention group. There were no differences between the groups for any of the other outcomes, including motor, language, socio‐emotional and executive function skills, at 18 months of age.
Dewey 2017 reported improved motor development (using the Developmental Milestones Checklist II (DMC‐II) with minor adaptations) in the LNS plus complementary feeding group compared to the no intervention group at 18 and 24 months of age. Receptive language scores were also reported to be higher for the LNS plus complementary feeding group at 18 and 24 months of age. There were no differences between the groups for expressive language scores (using a vocabulary inventory based on the principles of the MacArthur Communicative Development Inventories (CDI), personal‐social development scores (assessed by DMC‐II with minor adaptations) and executive function scores (with the use of the A‐not‐B task) at 18 or 24 months of age.
Hess 2015 reported that children in the LNS plus complementary feeding group had better motor (mean difference (MD) 0.34 points, 95% CI 0.21 to 0.46), language (MD 0.30 points, 95% CI 0.15 to 0.44), and personal social development scores (MD 0.32 points, 95% CI 0.16 to 0.48) than children in the no‐intervention group at 18 months of age (all assessed by DMC‐II), with no impact on caregiver‐child interaction.
Kumwenda 2014 and Mangani 2015 did not find any significant impact of LNS plus complementary feeding on any of the psychomotor and neuro‐developmental outcomes; including motor development, language development, socio‐emotional development and executive function development measured at 18 months of age.
Luby 2018 reported improved motor milestone attainment for 'walking alone' in the nutrition group compared to the control group after one year of intervention (hazard ratio (HR): 1·32; 95% CI 1·07 to 1·62). After two years of intervention, nutrition group had improved communication Z score (MD: 0·19; 95% CI 0·10 to 0·28); gross motor Z score (MD: 0·19; 95% CI 0·08 to 0·30); personal social Z score (MD: 0·22; 95% CI: 0·11 to 0·33); combined Z score (MD: 0·28; 95% CI 0·18 to 0·37); comprehension score (MD: 0·19; 95% CI 0·08 to 0·29); and expressive language score (MD: 0·18; 95% CI 0·07 to 0·29) compared to the control group. There was no effect on any other motor milestone attainment after one year of intervention and executive function scores after two years of intervention.
Null 2018 reported no impact on any of the motor milestone attainment, communication, gross motor, personal social, and combined scales of the Extended Ages and Stages
Questionnaire in the nutrition group compared to the control group.
Any adverse effects: pooled study results
The authors of the three studies reporting on adverse effects defined adverse effects as a cumulative number of serious adverse events that included deaths, hospitalisations, congenital abnormalities and life‐threatening conditions requiring an immediate hospital visit (Adu‐Afarwuah 2016; Ashorn 2015; Kumwenda 2014). We found no differences in adverse effects reported in the LNS plus complementary feeding group compared to the no‐intervention group (RR 0.86, 95% CI 0.74 to 1.01; three studies; 3382 participants; moderate‐quality evidence; I2= 30%; Tau2 = 0.01; Chi2 = 4.30; Analysis 1.14).
We conducted sensitivity analysis after removing trials that also supplemented pregnant women with LNS in addition to children (Adu‐Afarwuah 2016; Ashorn 2015), and found significantly reduced adverse events in the LNS group plus complementary feeding group compared to the no‐intervention group (RR 0.76, 95% CI 0.60 to 0.95; one study (two comparisons; total number of comparisons = 2); 1772 participants; I2= 17%; Tau2 = 0.00; Chi2 = 1.21; Analysis 1.15).
None of the included trials reported allergies as an adverse effect.
Secondary outcomes
MUAC: pooled study results
Compared to no intervention, LNS plus complementary feeding significantly improved MUAC (standardised mean difference (SMD) 0.13, 95% CI 0.05 to 0.22; six studies (one of which contributed data to four comparisons; total number of comparisons = nine), 8187 participants; I2 = 70%; Tau2 = 0.01; Chi2 = 26.47; I2 = 70%; low‐quality evidence; Analysis 1.16).
Haemoglobin: pooled study results
Compared to no intervention, LNS plus complementary feeding significantly improved serum haemoglobin (MD 5.78 g/L, 95% CI 2.27 to 9.30; four studies, 4518 participants; I2 = 96%; Tau2 = 11.66; Chi2 = 78.77; low‐quality evidence; Analysis 1.17).
Morbidity: single study results
Seven studies reported on morbidity (Christian 2015; Hess 2015; Huybregts 2012; Kumwenda 2014; Mangani 2015; Luby 2018; Null 2018); however, we could not pool the outcomes in a meta‐analysis, since they were not consistently reported across these seven studies.
Christian 2015 reported no differences in the incidence of pneumonia (RR 0.98, 95% CI 0.80 to1.20), diarrhoea (RR 0.97, 95% CI 0.85 to 1.10) and diarrhoeal dysentery (RR 1.03, 95% CI 0.90 to 1.19) in the intervention and control groups.
Hess 2015 reported no differences in the incidence of diarrhoea (P = 0.59) and malaria (P = 0.88) in the intervention and control groups.
Huybregts 2012 reported decreased reported episodes of diarrhoea (incidence rate ratio 0.71, 95% CI 0.63 to 0.80) and fever (incidence rate ratio 0.77, 95% CI 0.70 to 0.86) in the LNS plus complementary feeding group compared to the no intervention group.
Kumwenda 2014 reported no differences between the intervention and control groups for guardian‐reported illnesses (incidence rate ratio 1.05, 95% CI 0.93 to 1.19); however, malaria‐related, non‐scheduled visits were reported to be higher in the MQ LNS group (incidence rate ratio 1.21, 95% CI 1.00 to 1.46).
Mangani 2015 reported no differences between children in the LNS plus complementary feeding and no‐intervention groups for malaria (incidence per child year of 0.51 in the LNS plus complementary feeding group compared to 0.64 in the no‐intervention group) and clinical pneumonia (incidence per child year of 0.91 in the LNS plus complementary feeding group compared to 0.96 in the no‐intervention group).
Luby 2018 reported reduced prevalence of diarrhoea in the nutrition group compared to the control group (prevalence ratio: 0·64; 95% CI 0·49 to 0·85).
Null 2018 reported no difference in diarrhoea prevalence between the nutrition and the control group (prevalence ratio: 0·96; 95% CI: 0·86 to 1·08).
Mortality: pooled study results
Compared to no intervention, LNS plus complementary feeding did not have any impact on mortality (RR 0.93, 95% CI 0.63 to 1.37; three studies (one of which contributed data to two comparisons; total number of comparisons = four), 3321 participants; I2 = 10%; Tau2 = 0.02; Chi2 = 3.32; moderate‐quality evidence; Analysis 1.18).
Explanatory secondary outcomes
HAZ: pooled study results
Compared to no intervention, LNS plus complementary feeding improved HAZ (SMD 0.11, 95% CI 0.05 to 0.16; 12 studies; 15,795 participants; I2 = 65%; Tau2 = 0.01; Chi2 = 43.43; low‐quality evidence; Analysis 1.19).
WAZ: pooled study results
Compared to no intervention, LNS plus complementary feeding improved WAZ (SMD 0.09, 95% CI 0.02 to 0.16; 10 studies, 12,188 participants; I2 = 65%; Tau2 = 0.01; Chi2 = 37.11; low‐quality evidence; Analysis 1.20).
WHZ: pooled study results
Compared to no intervention, LNS plus complementary feeding improved WHZ (SMD 0.08, 95% CI 0.04 to 0.13; 10 studies, 12,894 participants; I2 = 40%; Tau2 = 0.00; Chi2 = 21.83; moderate‐quality evidence; Analysis 1.21).
Subgroup analysis
Energy content/formulation of product provided
None of the studies included in this comparison provided LQ LNS.
Primary outcomes
A subgroup analysis by energy content suggested a marginally statistically significant impact of SQ LNS on the prevalence of severe stunting (RR 0.83, 95% CI 0.70 to 0.99; four studies; 5 comparisons), 4956 participants), while the impact of MQ LNS was not significant (RR 0.88, 95% CI 0.69 to 1.12; two studies; 4 comparisons ), 1195 participants). See Analysis 2.1.
There were no differences between SQ LNS and MQ LNS for the other primary outcomes: moderate stunting (Analysis 2.2); moderate wasting (Analysis 2.3) and severe wasting (Analysis 2.4); moderate underweight (Analysis 2.5) and severe underweight (Analysis 2.6); anaemia (Analysis 2.7); and adverse effects (Analysis 2.8).
Secondary outcomes
A subgroup analysis by energy content suggested an impact of MQ LNS on MUAC (SMD 0.17, 95% CI 0.08 to 0.26; two studies; 3 comparisons); 1641 participants; Analysis 2.9), and a marginal impact for SQ LNS (SMD 0.12, 95% CI −0.00 to 0.24; five studies; 6 comparisons); 6546 participants; Analysis 2.9).
There were no differences between SQ LNS and MQ LNS for serum haemoglobin and mortality ( Analysis 2.10; Analysis 2.11).
Explanatory secondary outcomes
There was no difference between SQ LNS and MQ LNS on HAZ (Analysis 2.12) and WHZ (Analysis 2.13). There was a significant impact of SQ LNS on WAZ (SMD: 0.11, 95% CI: 0.02 to 0.19; nine studies; ten comparisons; 10,959 participants; Analysis 2.14) while the impact of MQ LNS was not significant (SMD: 0.05; 95% CI ‐0.04 to 0.14; two studies; four comparisons; 1229 participants; Analysis 2.14).
Duration of intervention (up to six months; six to 12 months; more than 12 months)
Primary outcomes
A subgroup analysis by duration of intervention suggested that a duration of more than 12 months reduced the prevalence of moderate stunting (RR 0.89, 95% CI 0.81 to 0.97; three studies, 5501 participants; Analysis 3.1) and severe stunting (RR 0.80, 95% CI 0.64 to 0.99; two studies, 3900 participants; Analysis 3.2), while a duration of six to 12 months had no impact on both moderate (RR 0.96, 95% CI 0.89 to 1.03; six studies; 10 comparisons); 7871 participants; Analysis 3.1) and severe stunting (RR 0.89, 95% CI 0.74 to 1.07; three studies; 7 comparisons); 2251 participants; Analysis 3.2).
There was no difference between duration of six to 12 months and more than 12 months on the prevalence of moderate wasting (Analysis 3.3).. All studies reporting on severe wasting provided intervention for six to 12 months only; there was no impact on severe wasting (RR 1.27, 95% C: 0.66 to 2.46; three studies; 7 comparisons); 2329 participants; Analysis 3.4).
There was no difference in the impact of six to 12 months supplementation and more than 12 months supplementation for any of the other primary outcomes: moderate underweight (Analysis 3.5) and severe underweight (Analysis 3.6); anaemia (Analysis 3.7); and adverse effects (Analysis 3.8).
Secondary outcomes
A subgroup analysis by duration of intervention suggested that a duration of six to 12 months supplementation improved MUAC compared to a duration of less than six months and more than 12 months (SMD 0.18, 95% CI 0.10 to 0.26; three studies; 6 comparisons); 5114 participants; Analysis 3.9).
There was no difference in the impact of up to six months and 6 to 12 months supplementation for haemoglobin (Analysis 3.10).
All the studies reporting mortality provided intervention for six to 12 months suggesting no impact on mortality (RR 0.93, 95% CI 0.63 to 1.37; three studies (one of which contributed data to two comparisons; total number of comparisons = four), 3321 participants; Analysis 3.11).
Explanatory secondary outcomes
An intervention duration of up to six months (SMD 0.19, 95% CI 0.01 to 0.36; three studies; 1510 participants; Analysis 3.12) and more than 12 months improved HAZ (SMD: 0.14; 95% CI: 0.03 to 0.25; three studies; 5501 participants; Analysis 3.12), but had no impact on HAZ at six to 12 months..
An intervention duration of more than 12 months improved WAZ (SMD 0.13, 95% CI 0.03 to 0.24; three studies; 5541 participants; Analysis 3.13), but had no impact on WAZ at up to six months and six to 12 months.
An intervention duration of more than 12 months improved WHZ (SMD: 0.09; 95% CI 0.01 to 0.17; three studies; 5503 participants; Analysis 3.14) while there was no impact of an intervention duration of up to six months and six to 12 months on WHZ (Analysis 3.14).
Age at follow‐up (at 12 months; at 18 months; at 24 months; at 36 months)
Primary outcomes
A subgroup analysis by age at follow‐up suggested a significant impact at 24 months of age on the prevalence of moderate stunting (RR 0.89, 95% CI 0.81 to 0.97, three studies, 5501 participants; Analysis 4.1) and severe stunting (RR 0.80, 95% CI 0.64 to 0.99; two studies, 3900 participants; Analysis 4.2), while there was no impact at the 12‐ and 18‐month follow‐up periods.
There was no difference between follow‐up at 18 months of age and follow‐up at 12 months for moderate wasting(Analysis 4.3) compared to follow‐up at 12 months. There was no difference at 12 and 18 months of follow‐up for severe wasting (Analysis 4.4).
There were no differences at 18 and 24 months of follow‐up for moderate underweight (Analysis 4.5), or at 18 months follow‐up for severe underweight (Analysis 4.6).
The impact on anaemia was also significant at follow‐up at 18 months of age (RR 0.80, 95% CI 0.71, 0.91; three studies, 1156 participants; Analysis 4.7) compared to follow‐up at 12 months of age.
There were no differences for adverse effects at 18 months follow‐up (Analysis 4.8).
Secondary outcomes
A subgroup analysis by age at follow‐up suggested significant impact of LNS plus complementary feeding on MUAC at 12‐month follow‐up (SMD 0.15, 95% CI 0.06 to 0.24; one study; four comparisons); 1193 participants; Analysis 4.9), but not at the 18‐ or 24‐month follow‐up periods.
There was no difference at 12 months, 18 months and 36 months for haemoglobin (Analysis 4.10). There was no effect on mortality in any of the follow‐up subgroups (Analysis 4.11).
Explanatory secondary outcomes
There was a significant impact on HAZ at 24 months follow‐up (SMD: 0.14; 95% CI: 0.03 to 0.25; three studies; 5501 participants; Analysis 4.12) and at 36 months follow‐up (SMD 0.27, 95% CI 0.10 to 0.44; one study, 1038 participants; Analysis 4.12), but no impact at 12 to 15 and 18 months follow‐up.
There was a significant impact on WAZ at 24 months follow‐up (SMD 0.13, 95% CI 0.03 to 0.23; three studies; 5541 participants; Analysis 4.13), but no impact at 12 to 15 months and 18 months follow‐up.
There was a significant impact on WHZ at 24 months follow‐up (SMD: 0.09; 95% CI 0.01 to 0.17; three studies; 5503 participants; Analysis 4.14). There was no impact on WHZ at 12 to 15, 18 or 36 months follow‐up (Analysis 4.14).
Comparison 2: LNS versus FBF
Five studies with 12,135 participants compared LNS plus complementary feeding with FBF, including corn soy blend and UNIMIX (Bisimwa 2012; Christian 2015; Mangani 2015; Olney 2018; Phuka 2008). Of these, Olney 2018 did not contribute data towards meta‐analysis, as it only reported outcomes according to age groups.
We rated the quality of the evidence for all outcomes as low or moderate, as per GRADE criteria. We downgraded the quality of the evidence due to study limitations, imprecision and small sample size. See summary of findings Table 2.
We did not conduct any subgroup analyses for this comparison due to insufficient data.
Primary outcomes
Stunting: pooled study results
Compared to FBF, LNS plus complementary feeding significantly reduced the prevalence of moderate stunting (RR 0.89, 95% CI 0.82 to 0.97; three studies; 4 comparisons), 2828 participants; I2 = 0%; Tau2 = 0.00; Chi2 = 2.01; moderate‐quality evidence; Analysis 5.1).
There was no difference between LNS plus complementary feeding and FBF for severe stunting (RR 0.41, 95% CI 0.12 to 1.42; two studies; 3 comparisons), 729 participants; I2 = 57%; Tau2 = 0.68; Chi2 = 4.68; low‐quality evidence; Analysis 5.2).
Wasting: pooled study results
When compared to FBF, LNS plus complementary feeding significantly reduced the prevalence of moderate wasting (RR 0.79, 95% CI 0.65 to 0.97; two studies; 3 comparisons), 2290 participants; I2 = 0%; Tau2 = 0.00; Chi2 = 1.09; moderate‐quality evidence; Analysis 5.3).
There was no difference between LNS plus complementary feeding and FBF for severe wasting (RR 0.64, 95% CI 0.19 to 2.18; two studies; 3 comparisons), 735 participants; I2 = 0%; Tau2 = 0.00; Chi2 = 0.32; moderate‐quality evidence; Analysis 5.4).
Underweight
Pooled study results
Compared to FBF, LNS plus complementary feeding significantly reduced the prevalence of moderate underweight (RR 0.81, 95% CI 0.73 to 0.91; two studies; 3 comparisons), 2280 participants; I2 = 0%; Tau2 = 0.00; Chi2 = 0.00; moderate‐quality evidence; Analysis 5.5).
Single study results
One study with two arms, Phuka 2008, reported no difference between LNS plus complementary feeding and FBF for severe underweight (RR 1.11, 95% CI 0.46 to 2.66; 173 participants; low‐quality evidence; Analysis 5.6).
Psychomotor and neuro‐developmental outcomes: single study results
One study, Phuka 2008, reported comparable developmental outcomes in children given LNS plus complementary feeding and those given FBF and the outcome was rated to be of low quality.
None of the included studies reported data on other primary outcomes: anaemia and adverse effects.
Secondary outcomes
MUAC: pooled study results
There was no difference between LNS plus complementary feeding and FBF for MUAC (SMD 0.02, 95% CI −0.08 to 0.12; two studies; 3 comparisons), 1512 participants; I2 = 0%; Tau2 = 0.00; Chi2 = 0.07; moderate‐quality evidence; Analysis 5.7).
Haemoglobin: single study results
One study, Phuka 2008, which contributed data to two comparisons, found no difference between LNS plus complementary feeding and FBF for serum haemoglobin (MD 0.29, 95% CI −6.00 to 6.59; 182 participants; low‐quality outcome; Analysis 5.8).
None of the included studies reported data on our other secondary outcomes: morbidity and mortality.
Explanatory secondary outcomes
HAZ: pooled study results
There was no difference between LNS plus complementary feeding and FBF for HAZ (SMD 0.06, 95% CI 0.00 to 0.13; four studies; 5 comparisons), 4047 participants; I2 = 2%; Tau2 = 0.00; Chi2 = 4.07; moderate‐quality evidence; Analysis 5.9).
WAZ: pooled study results
There was no difference between LNS plus complementary feeding and FBF for WAZ (MD 0.05, 95% CI −0.04 to 0.14; three studies; 4 comparisons), 1933 participants; I2 = 5%; Tau2 = 0.00; Chi2 = 3.17; ; moderate‐quality evidence; Analysis 5.10).
WHZ: pooled study results
There was no difference between LNS plus complementary feeding and FBF for WHZ (SMD 0.07, 95% CI −0.02 to 0.16; three studies; 4 comparisons), 1933 participants; I2 = 0%; Tau2 = 0.00; Chi2 = 2.17; moderate‐quality evidence; Analysis 5.11).
Comparison 3: LNS versus nutritional counselling
We did not find any study comparing LNS with nutritional counselling.
Comparison 4: LNS versus micronutrient powders (MNP)
Four studies with 9036 participants compared LNS plus complementary feeding with MNP (Adu‐Afarwuah 2007; Dewey 2017; Matias 2017; Olney 2018). Of these, one study did not contribute data towards the meta‐analysis, as it only reported outcomes according to age groups (Olney 2018).
We rated the quality of the evidence for all outcomes as low or moderate, as per GRADE criteria. We downgraded the quality of the evidence due to study limitations and small sample size. See summary of findings Table 3.
We did not conduct any subgroup analyses for this comparison due to insufficient data.
Primary outcomes
Stunting: pooled study results
There was no difference between LNS plus complementary feeding and MNP on the prevalence of moderate stunting (RR 0.92, 95% CI 0.82 to 1.02; three studies, 2365 participants; I2 = 0%; Tau2 = 0.00; Chi2 = 1.58; moderate‐quality evidence; Analysis 6.1).
Wasting: pooled study results
There was no difference between LNS plus complementary feeding and MNP on the prevalence of moderate wasting (RR 0.97, 95% CI 0.77 to 1.23; two studies, 2004 participants; I2 = 0%; Tau2 = 0.00; Chi2 = 0.58; moderate‐quality evidence; Analysis 6.2).
Underweight: pooled study results
Compared to MNP, LNS plus complementary feeding significantly reduced the prevalence of moderate underweight (RR 0.88, 95% CI 0.78 to 0.99; two studies, 2004 participants; I2 = 0%; Tau2 = 0.00; Chi2 = 0.31; moderate‐quality evidence; Analysis 6.3).
Anaemia: pooled study results
Two studies (557 participants) assessed this outcome (Adu‐Afarwuah 2007; Matias 2017). We combined the data in a meta‐analysis and found that, compared to MNP, LNS plus complementary feeding significantly reduced the prevalence of anaemia (RR 0.38, 95% CI 0.21 to 0.68; I2 = 53%; Tau² = 0.10; Chi² = 2.14; low‐quality evidence; Analysis 6.4).
We conducted a sensitivity analysis by removing Matias 2017 due to high risk of bias. We found that the effect on anaemia was no longer significant (RR 0.56, 95% CI 0.27 to 1.14; Analysis 6.5); however, the evidence is from one study only.
Psychomotor development neuro‐developmental outcomes: single study results
One study with 422 participants (Matias 2017), reported on this outcome and found that, compared to MNP, the provision of LNS plus complementary feeding was associated with higher problem‐solving task scores (P = 0.04) and increased odds of achieving this cognitive task (OR 1.6, 95% CI 1.0 to 2.7). They observed no significant differences on receptive language or gross motor development.
Any adverse effects
None of the included studies reported data on adverse effects.
Secondary outcomes
Haemoglobin: pooled study results
Two studies (557 participants) reported data on haemoglobin (Adu‐Afarwuah 2007; Matias 2017). We combined the data in a meta‐analysis and found evidence of significantly higher haemoglobin in the LNS plus complementary feeding group compared to the MNP group (MD 5.13 g/L, 95% CI 2.00 to 8.26; I2 = 25%; Tau2 = 1.28; Chi2 = 1.33; low‐quality evidence; Analysis 6.6).
We conducted a sensitivity analysis by removing Matias 2017 due to high risk of bias. The effect on haemoglobin was no longer significant (MD 3.60 g/L, 95% CI −0.13 to 7.33; Analysis 6.7); however, the evidence is from only one study.
None of the included studies reported data on our other secondary outcomes: MUAC; morbidity and mortality.
Explanatory secondary outcomes
HAZ: pooled study results
There was no difference between LNS plus complementary feeding and MNP for HAZ (SMD 0.10, 95% CI −0.08 to 0.27; three studies, 2362 participants; I2 = 63%; Tau2 = 0.02; Chi2 = 5.47; moderate‐quality evidence; Analysis 6.8).
We conducted a sensitivity analysis by removing Matias 2017 due to high risk of bias and found that the effect on HAZ became significant (SMD 0.16, 95% CI 0.03 to 0.28; I2 = 19%; Tau2 = 0.00; Chi2 = 1.23; Analysis 6.9).
WAZ: pooled study results
Compared to MNP, LNS plus complementary feeding improved WAZ (SMD 0.12, 95% CI 0.02 to 0.21; three studies, 2362 participants; I2 = 10%; Tau2 = 0.00; Chi2 = 2.23; moderate‐quality evidence; Analysis 6.10).
We conducted a sensitivity analysis by removing Matias 2017 due to high risk of bias and found that the effect on WAZ remained significant (SMD 0.14, 95% CI 0.05 to 0.23; I2 = 0%; Tau2 = 0.00; Chi2 = 0.73; Analysis 6.11).
WHZ: pooled study results
There was no difference between LNS plus complementary feeding and MNP for WHZ (SMD 0.05, 95% CI −0.06 to 0.17; three studies, 2362 participants; I2 = 29%; Tau2 = 0.00; Chi2 = 2.80; moderate‐quality evidence; Analysis 6.12).
We conducted a sensitivity analysis by removing Matias 2017 due to high risk of bias and found that the effect on WHZ became significant (SMD 0.10, 95% CI 0.01 to 0.18; I2 = 0%; Tau2 = 0.00; Chi2 = 0.09; Analysis 6.13).
Discussion
Summary of main results
This review summarises findings from 17 studies with 23,200 children. Each included study provided data on at least one of the primary outcomes.
Thirteen studies compared lipid‐based nutrient supplements.(LNS) plus complementary feeding with no intervention. We included all 13 studies in meta‐analyses We found evidence to suggest that LNS plus complementary feeding is effective in improving growth outcomes among children aged six to 23 months of age compared to complementary feeding alone. LNS plus complementary feeding significantly reduced the prevalence of moderate stunting by 7% (2% to 12%), severe stunting by 15% (2% to 26%), moderate wasting by 18% (9% to 26%), moderate underweight by 15% (9% to 20%) and anaemia by 21% (10% to 31%). LNS plus complementary feeding also improved mid‐upper arm circumference (MUAC), serum haemoglobin, height‐for‐age z score (HAZ), weight‐for‐age z score (WAZ) and weight‐for‐height/length z score (WHZ). We found no impact of LNS plus complementary feeding on severe wasting, severe underweight and mortality. We rated the quality of the evidence as moderate to low for most outcomes, largely downgrading for lack of blinding, although this was expected due to the nature of the intervention. Adverse effects did not differ between the groups, suggesting that LNS plus complementary feeding is safe; however, studies did not report data on allergic reactions (including atopic dermatitis, urticaria, oedema, ophthalmic pruritus, allergic rhinitis, asthma, anaphylaxis). Although the data on psychomotor and neuro‐developmental outcomes are scarce, a few studies found a positive impact of LNS plus complementary feeding on psychomotor outcomes (walking independently) compared to no intervention. We conducted subgroup analyses to explore the impact of energy content, duration of intervention and age at follow‐up on the results. The subgroup analysis by energy content has limited clinical significance due to limited number of studies in each subgroup. The subgroup analysis by duration of intervention suggested that an intervention duration of more than 12 months reduced moderate stunting and severe stunting, while the subgroup analysis by age at follow‐up suggested a significant impact on moderate stunting and severe stunting at 24 months follow‐up and on moderate wasting at 18 months follow‐up.
Four studies compared LNS plus complementary feeding with micronutrient powders (MNP). We combined data from three of these studies in meta‐analyses. We found that LNS plus complementary feeding significantly reduced moderate underweight and anaemia and improved haemoglobin and WAZ. We found no difference between LNS plus complementary feeding and MNP for any of the other primary outcomes, including stunting, wasting and adverse effects. We rated the quality of the evidence for most outcomes as moderate to low, largely downgrading for lack of blinding. One study reported on psychomotor and neuro‐developmental outcomes, suggesting that provision of LNS plus complementary feeding was associated with higher problem‐solving task scores and increased odds of achieving this cognitive task compared to MNP; however, there was no difference in receptive language or gross motor development.
Five studies compared LNS plus complementary feeding with other fortified blended foods (FBF), including corn soy blend and UNIMIX (UNICEF's supplementary feeding food). We were able to include four of these studies in meta‐analyses. We found that LNS plus complementary feeding reduced moderate stunting, moderate wasting and moderate underweight. We found no difference between LNS plus complementary feeding and other FBF for severe stunting, severe wasting and severe underweight. We rated the quality of the evidence for most outcomes as moderate to low, largely downgrading for lack of blinding. One study reported comparable developmental outcomes in the LNS plus complementary feeding group compared to the FBF group.
We did not find any study comparing LNS alone with nutritional counselling alone to mothers and caregivers for appropriate feeding of infants and young children.
Overall completeness and applicability of evidence
This review summarises findings from 17 studies. All studies were published recently with the oldest one published in 2007. All studies were conducted in low‐ and middle‐income countries (LMIC) in Sub‐Saharan Africa and South Asia; none were conducted in emergency settings. Most studies compared LNS plus complementary feeding with no intervention, though some included MNP and other FBF as comparison groups. We did not find any study comparing LNS alone with nutritional counselling alone to mothers and caregivers for appropriate feeding of infants and young children. Studies assessing the impact of LNS plus complementary feeding on psychomotor and neuro‐developmental outcomes used various outcome definitions and measurement tools and hence could not be pooled together. Most studies used small quantity lipid‐based nutrient supplements (SQ LNS), though a few studies also used medium quantity (MQ LNS) (MQ LNS). Four of the 17 included studies provided LNS plus complementary feeding to pregnant women and their infants (Adu‐Afarwuah 2016; Ashorn 2015; Dewey 2017; Olney 2018). However, in one of these studies, there was also a group in which pregnant women did not receive LNS plus complementary feeding but the children did (Dewey 2017); we used the data from the group in which only children were provided with LNS plus complementary feeding compared to controls. We conducted a sensitivity analysis by removing studies in which pregnant women were also supplemented and found no difference in the estimates. We also conduced sensitivity analyses to assess the effects of removing trials at high risk of bias and the robustness of the results when using a fixed‐effect model; there were no major changes in the estimates.
The findings of this review are generalisable to apparently healthy and non‐hospitalised children in LMIC settings in Asia and Africa, although some children may be at risk of having highly prevalent diseases such as malaria, diarrhoea or even malnutrition. Use of LNS in the studies included in this review is limited for preventive purposes, and hence this review does not evaluate their effectiveness in treating any form of malnutrition.
Quality of the evidence
Overall, we considered most studies to be at low risk of bias for random sequence generation, allocation concealment, blinding of outcome assessment, incomplete outcome data and selective reporting, however, given inconsistency and imprecision of results, high risk of detection bias and lack of blinding the resulting judgements made using the Grade tool were that the quality of the evidence for those outcomes reported in the 'Summary of findings' tables was either low or moderate.
Potential biases in the review process
We were aware of the possibility of introducing bias at every stage of the reviewing process. In this review, we tried to minimise bias in a number of ways; two review authors independently assessed study eligibility for inclusion, carried out data extraction and assessed risk of bias and the quality of the evidence. While we attempted to be as inclusive as possible in our searches, the literature we identified was predominantly written in English. Although we attempted to assess reporting bias, this assessment relied largely on information available in the published studies and thus, reporting bias was not usually apparent.
Agreements and disagreements with other studies or reviews
To our knowledge, this is the first review assessing the impact of preventive LNS plus complementary feeding on children. The Kristjansson 2015 and Kristjansson 2016 review assessed the effectiveness of supplementary feeding interventions, alone or with a co‐intervention, for improving the physical and psychosocial health of disadvantaged children aged three months to five years and suggested some positive impact of feeding on growth and moderate positive effects on psychomotor development. The review by Sguassero 2012 evaluated the effectiveness of community‐based supplementary feeding for promoting the physical growth of children under five years of age in LMIC, highlighting the scarcity of evidence in reaching any firm conclusions. The review by Larson 2017 on nutrition interventions on mental development of children under two years of age in LMIC suggested small effects of nutrition interventions on mental development.

Study flow diagram.

'Risk of bias' graph: review authors' judgements about each risk of bias item presented as percentages across all included studies.

'Risk of bias' summary: review authors' judgements about each risk of bias item for each included study.

Forest plot of comparison: 1 LNS versus no intervention, outcome: 1.1 Moderate stunting.
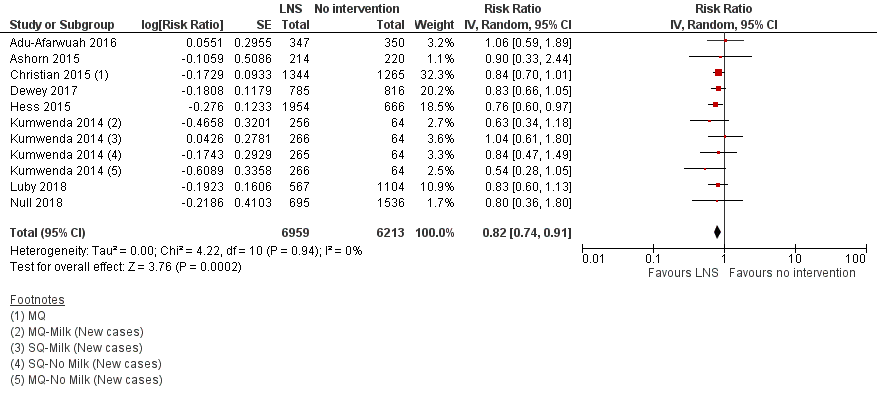
Forest plot of comparison: 1 LNS versus no intervention, outcome: 1.5 Moderate wasting.

Comparison 1 LNS versus no intervention, Outcome 1 Moderate stunting.

Comparison 1 LNS versus no intervention, Outcome 2 Severe stunting.

Comparison 1 LNS versus no intervention, Outcome 3 Moderate stunting: Sensitivity analysis.
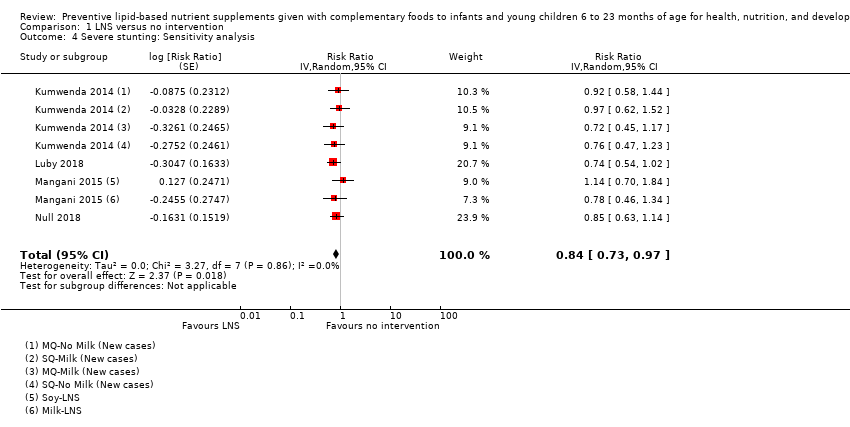
Comparison 1 LNS versus no intervention, Outcome 4 Severe stunting: Sensitivity analysis.

Comparison 1 LNS versus no intervention, Outcome 5 Moderate wasting.
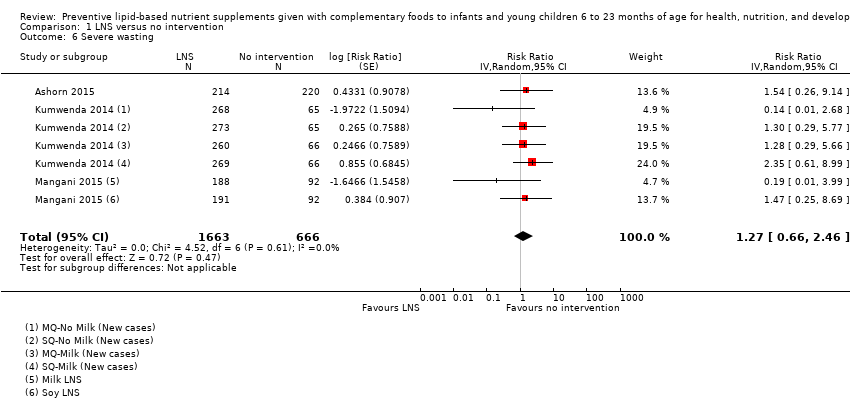
Comparison 1 LNS versus no intervention, Outcome 6 Severe wasting.

Comparison 1 LNS versus no intervention, Outcome 7 Moderate wasting: Sensitivity analysis.

Comparison 1 LNS versus no intervention, Outcome 8 Severe wasting: Sensitivity analysis.

Comparison 1 LNS versus no intervention, Outcome 9 Moderate underweight.
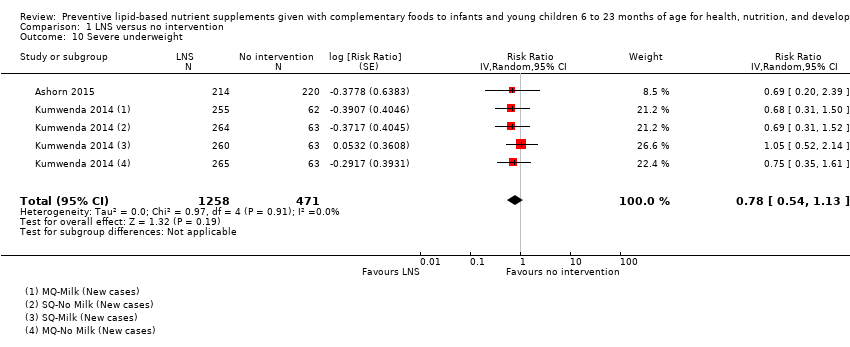
Comparison 1 LNS versus no intervention, Outcome 10 Severe underweight.

Comparison 1 LNS versus no intervention, Outcome 11 Moderate underweight: Sensitivity analysis.
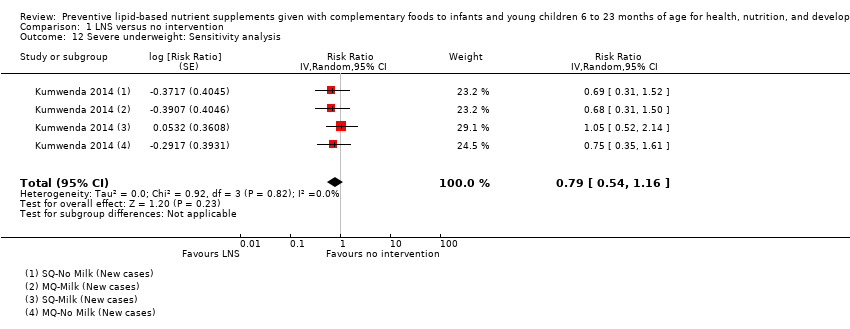
Comparison 1 LNS versus no intervention, Outcome 12 Severe underweight: Sensitivity analysis.

Comparison 1 LNS versus no intervention, Outcome 13 Anaemia.

Comparison 1 LNS versus no intervention, Outcome 14 Adverse effects.
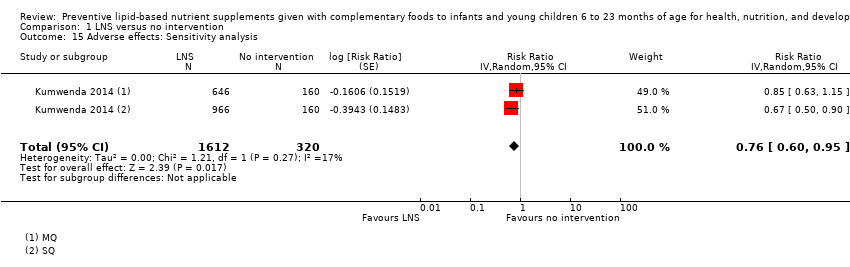
Comparison 1 LNS versus no intervention, Outcome 15 Adverse effects: Sensitivity analysis.
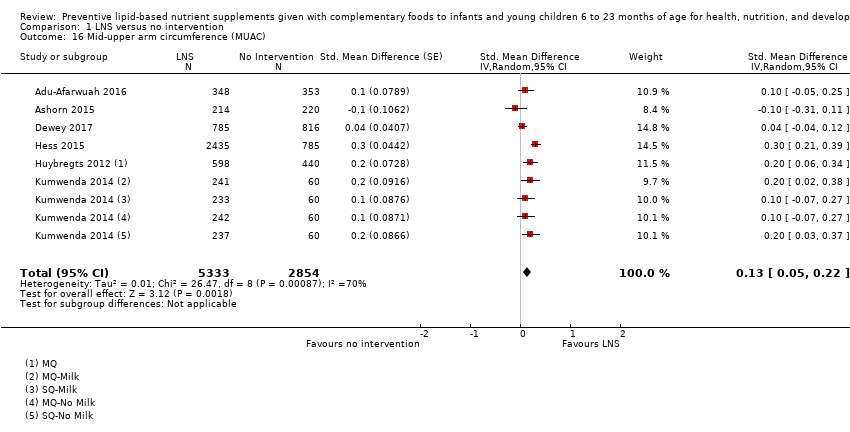
Comparison 1 LNS versus no intervention, Outcome 16 Mid‐upper arm circumference (MUAC).
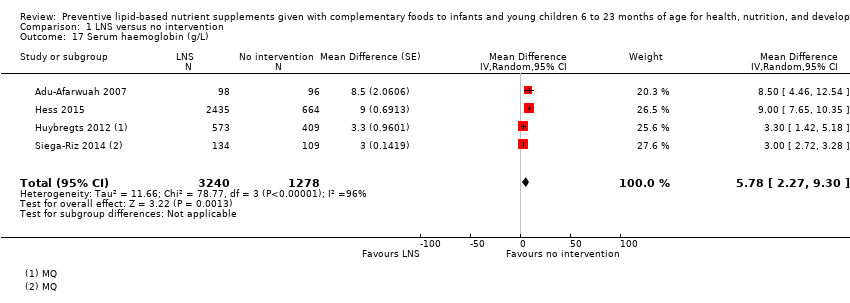
Comparison 1 LNS versus no intervention, Outcome 17 Serum haemoglobin (g/L).
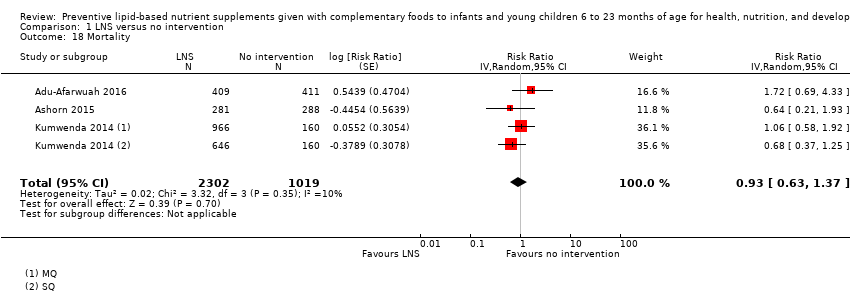
Comparison 1 LNS versus no intervention, Outcome 18 Mortality.

Comparison 1 LNS versus no intervention, Outcome 19 HAZ.

Comparison 1 LNS versus no intervention, Outcome 20 WAZ.

Comparison 1 LNS versus no intervention, Outcome 21 WHZ.

Comparison 2 LNS versus no intervention: Subgroup analysis by energy content/formulation of product provided, Outcome 1 Severe stunting.

Comparison 2 LNS versus no intervention: Subgroup analysis by energy content/formulation of product provided, Outcome 2 Moderate stunting.

Comparison 2 LNS versus no intervention: Subgroup analysis by energy content/formulation of product provided, Outcome 3 Moderate wasting.
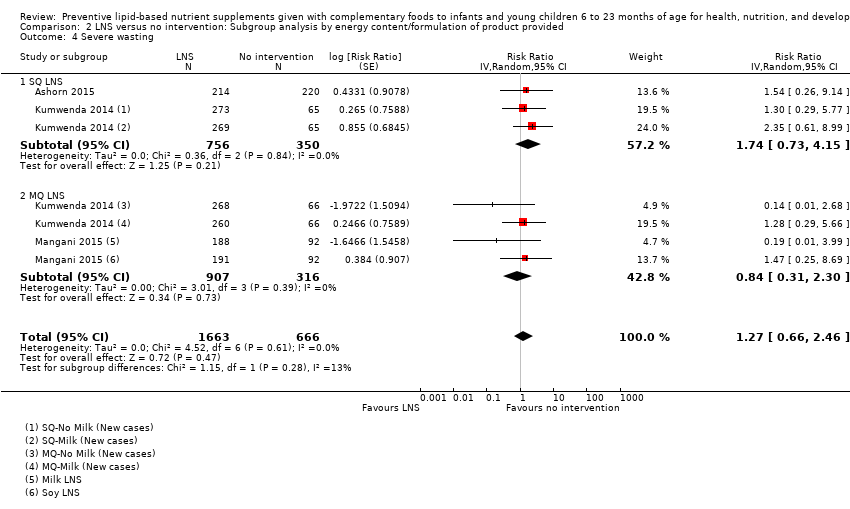
Comparison 2 LNS versus no intervention: Subgroup analysis by energy content/formulation of product provided, Outcome 4 Severe wasting.
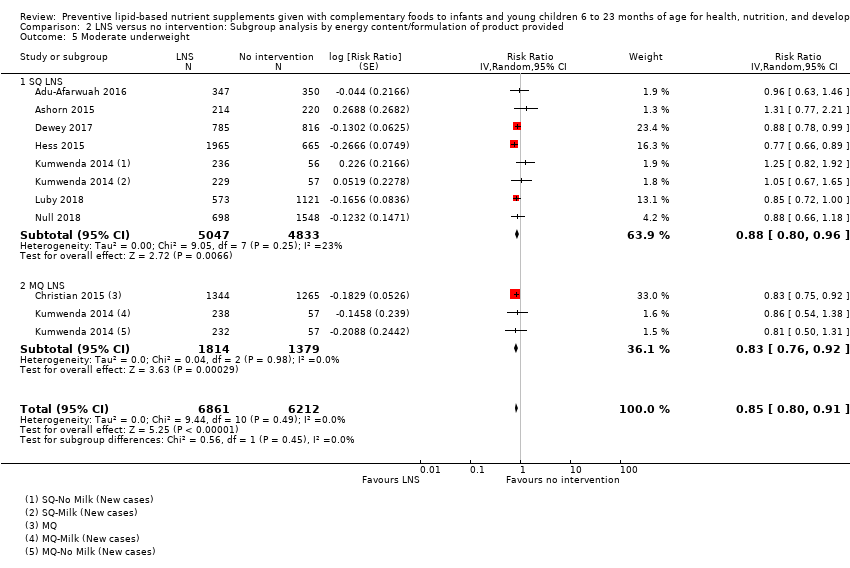
Comparison 2 LNS versus no intervention: Subgroup analysis by energy content/formulation of product provided, Outcome 5 Moderate underweight.

Comparison 2 LNS versus no intervention: Subgroup analysis by energy content/formulation of product provided, Outcome 6 Severe underweight.

Comparison 2 LNS versus no intervention: Subgroup analysis by energy content/formulation of product provided, Outcome 7 Anaemia.

Comparison 2 LNS versus no intervention: Subgroup analysis by energy content/formulation of product provided, Outcome 8 Adverse effects.

Comparison 2 LNS versus no intervention: Subgroup analysis by energy content/formulation of product provided, Outcome 9 Mid‐upper arm circumference (MUAC).

Comparison 2 LNS versus no intervention: Subgroup analysis by energy content/formulation of product provided, Outcome 10 Serum haemoglobin (g/L).

Comparison 2 LNS versus no intervention: Subgroup analysis by energy content/formulation of product provided, Outcome 11 Mortality.

Comparison 2 LNS versus no intervention: Subgroup analysis by energy content/formulation of product provided, Outcome 12 HAZ.

Comparison 2 LNS versus no intervention: Subgroup analysis by energy content/formulation of product provided, Outcome 13 WHZ.

Comparison 2 LNS versus no intervention: Subgroup analysis by energy content/formulation of product provided, Outcome 14 WAZ.
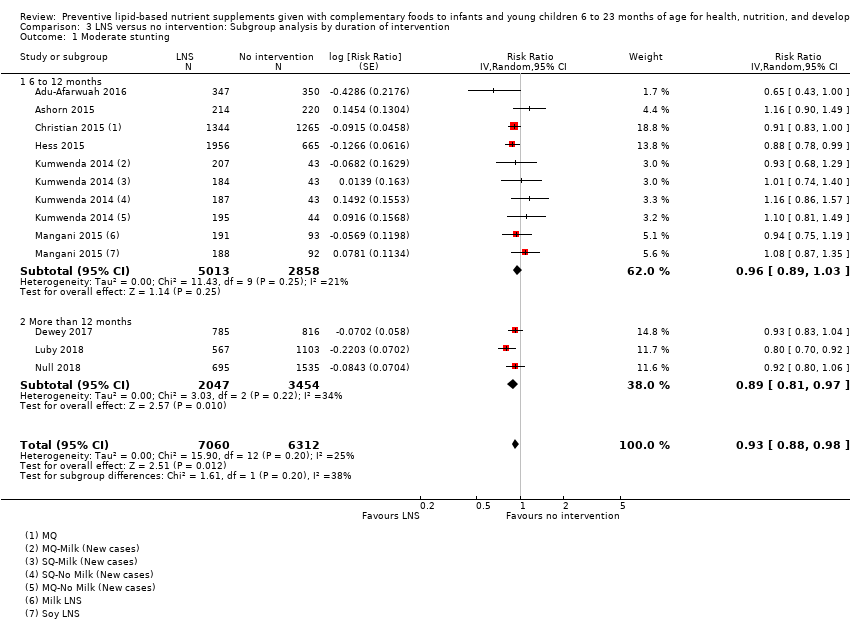
Comparison 3 LNS versus no intervention: Subgroup analysis by duration of intervention, Outcome 1 Moderate stunting.

Comparison 3 LNS versus no intervention: Subgroup analysis by duration of intervention, Outcome 2 Severe stunting.

Comparison 3 LNS versus no intervention: Subgroup analysis by duration of intervention, Outcome 3 Moderate wasting.
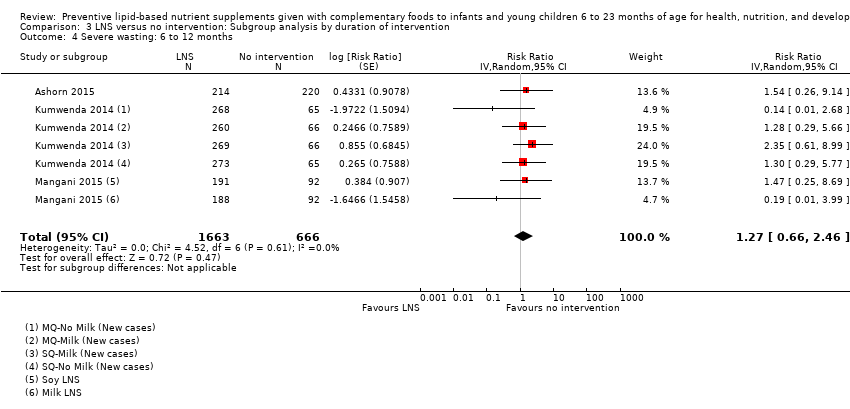
Comparison 3 LNS versus no intervention: Subgroup analysis by duration of intervention, Outcome 4 Severe wasting: 6 to 12 months.

Comparison 3 LNS versus no intervention: Subgroup analysis by duration of intervention, Outcome 5 Moderate underweight.
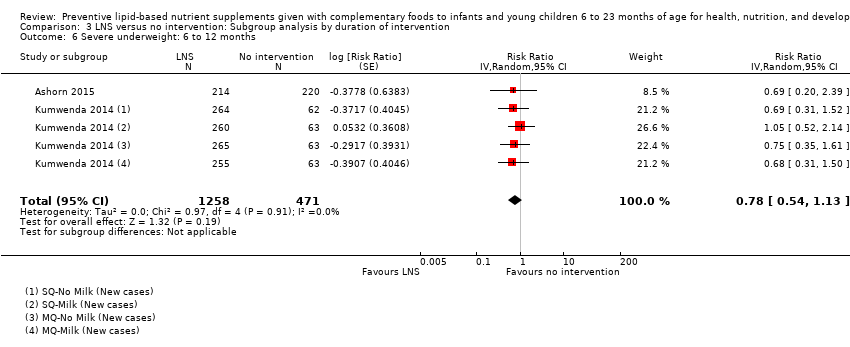
Comparison 3 LNS versus no intervention: Subgroup analysis by duration of intervention, Outcome 6 Severe underweight: 6 to 12 months.
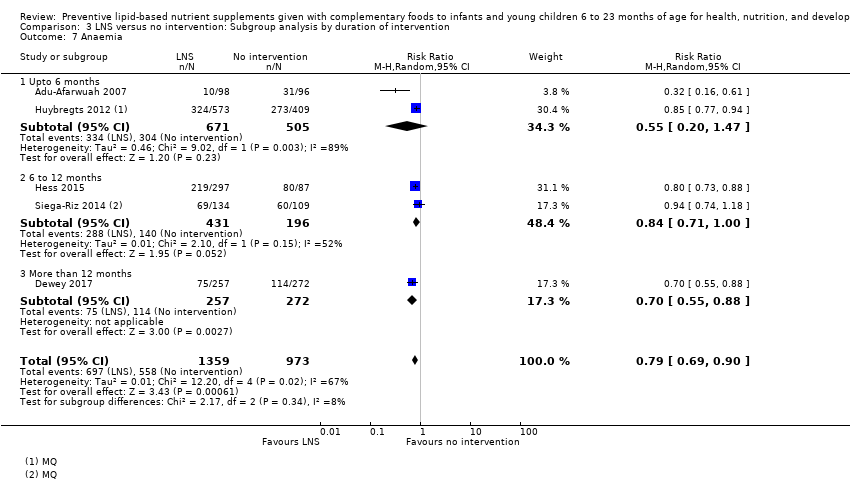
Comparison 3 LNS versus no intervention: Subgroup analysis by duration of intervention, Outcome 7 Anaemia.
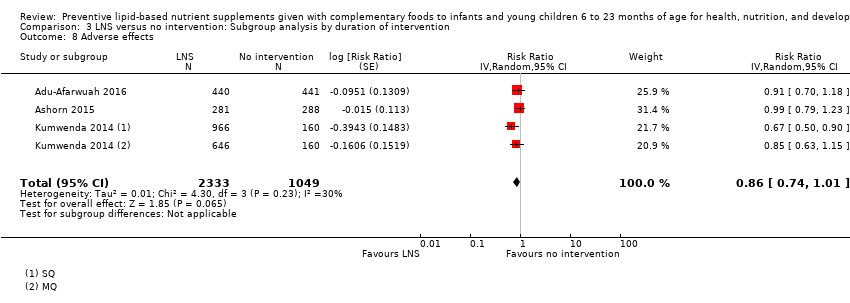
Comparison 3 LNS versus no intervention: Subgroup analysis by duration of intervention, Outcome 8 Adverse effects.
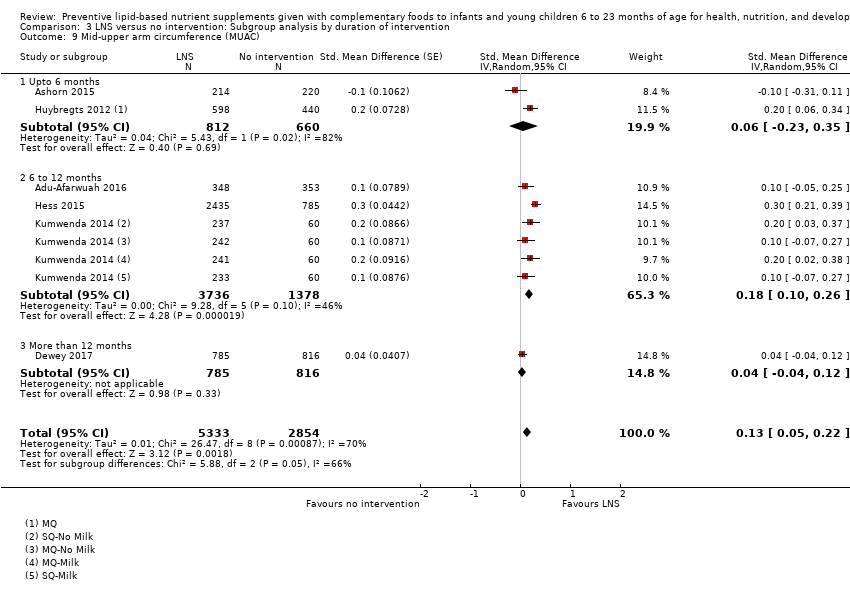
Comparison 3 LNS versus no intervention: Subgroup analysis by duration of intervention, Outcome 9 Mid‐upper arm circumference (MUAC).

Comparison 3 LNS versus no intervention: Subgroup analysis by duration of intervention, Outcome 10 Serum haemoglobin (g/L).
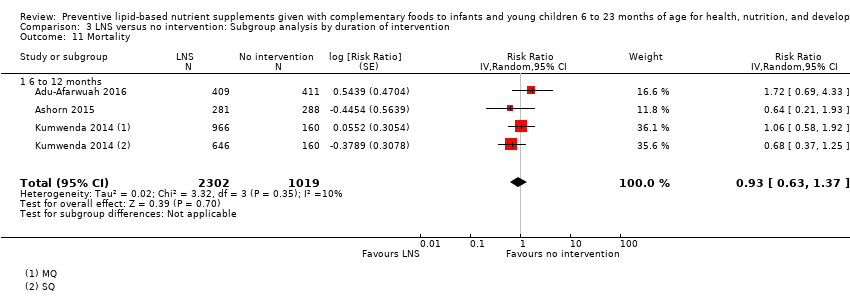
Comparison 3 LNS versus no intervention: Subgroup analysis by duration of intervention, Outcome 11 Mortality.

Comparison 3 LNS versus no intervention: Subgroup analysis by duration of intervention, Outcome 12 HAZ.
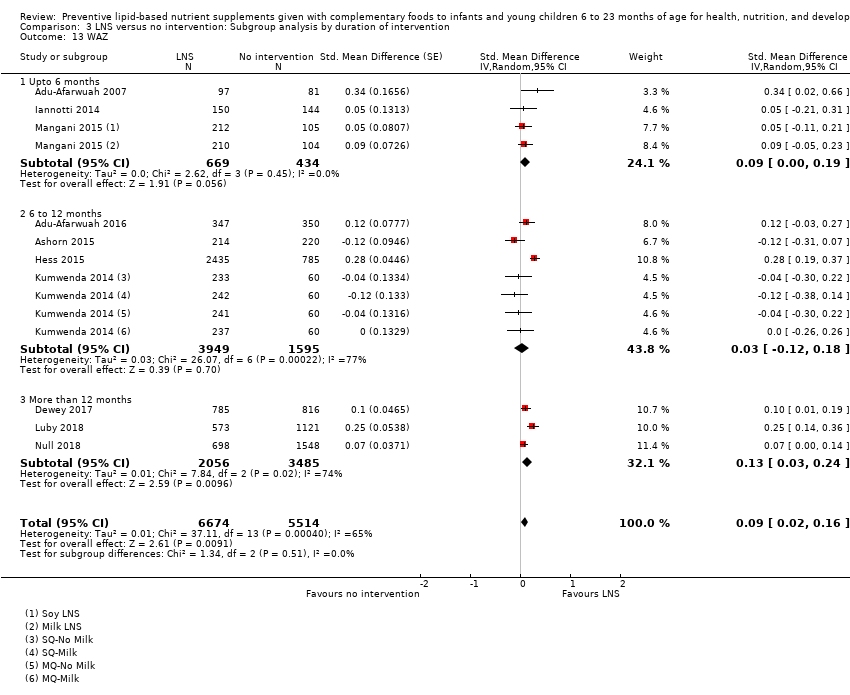
Comparison 3 LNS versus no intervention: Subgroup analysis by duration of intervention, Outcome 13 WAZ.
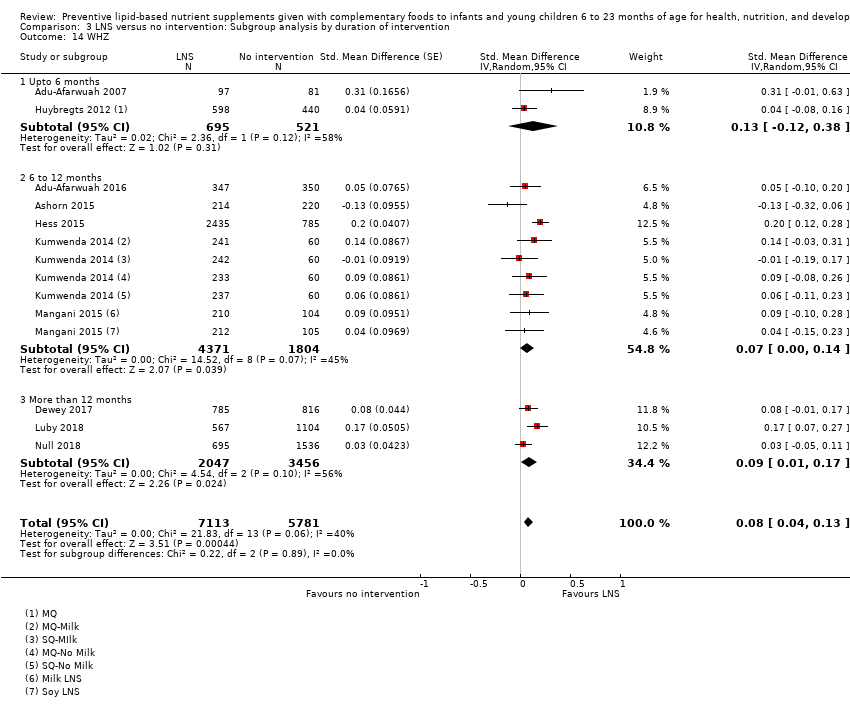
Comparison 3 LNS versus no intervention: Subgroup analysis by duration of intervention, Outcome 14 WHZ.
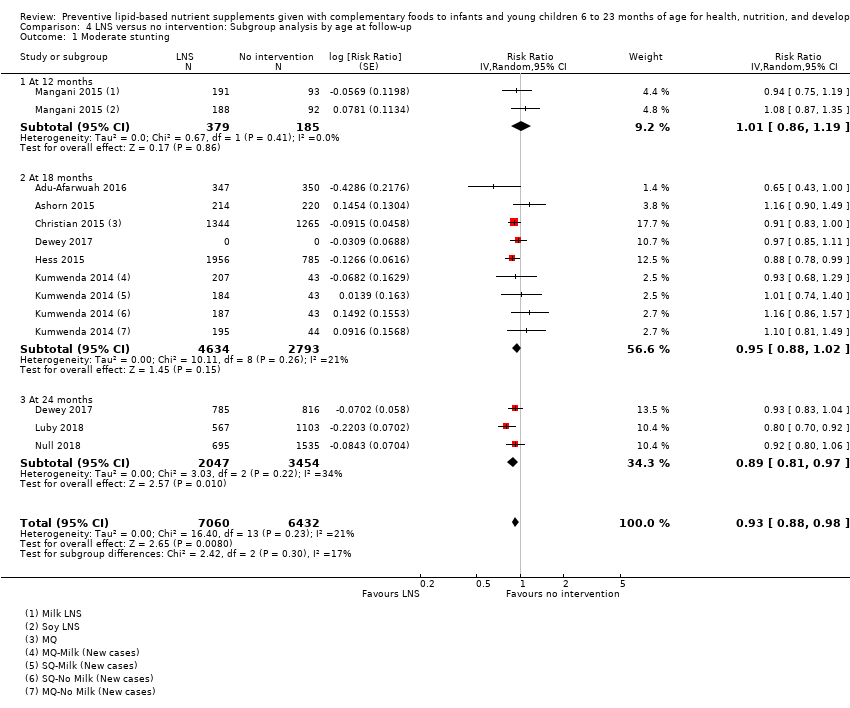
Comparison 4 LNS versus no intervention: Subgroup analysis by age at follow‐up, Outcome 1 Moderate stunting.

Comparison 4 LNS versus no intervention: Subgroup analysis by age at follow‐up, Outcome 2 Severe stunting.

Comparison 4 LNS versus no intervention: Subgroup analysis by age at follow‐up, Outcome 3 Moderate wasting.
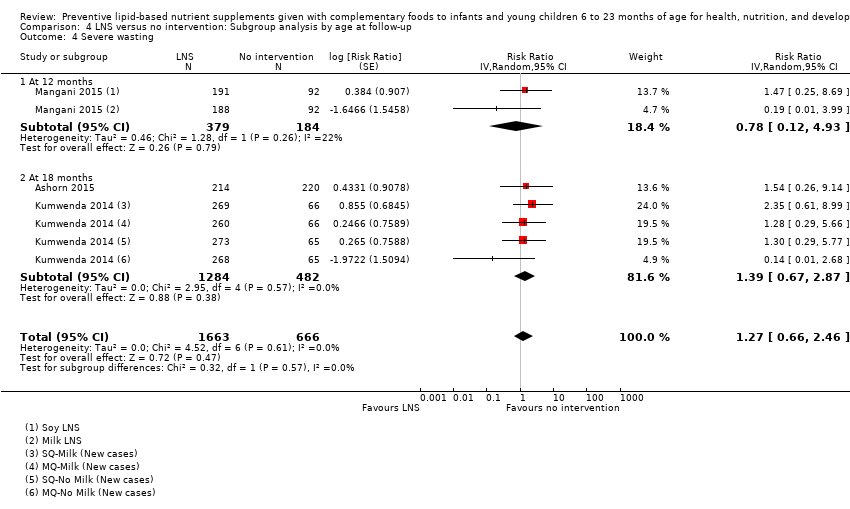
Comparison 4 LNS versus no intervention: Subgroup analysis by age at follow‐up, Outcome 4 Severe wasting.

Comparison 4 LNS versus no intervention: Subgroup analysis by age at follow‐up, Outcome 5 Moderate underweight.
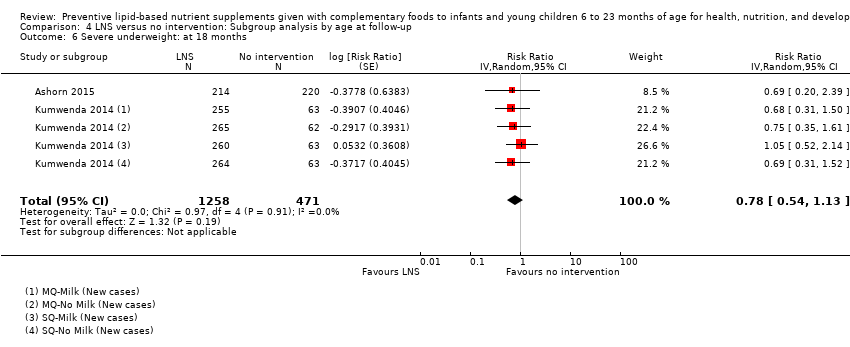
Comparison 4 LNS versus no intervention: Subgroup analysis by age at follow‐up, Outcome 6 Severe underweight: at 18 months.

Comparison 4 LNS versus no intervention: Subgroup analysis by age at follow‐up, Outcome 7 Anaemia.
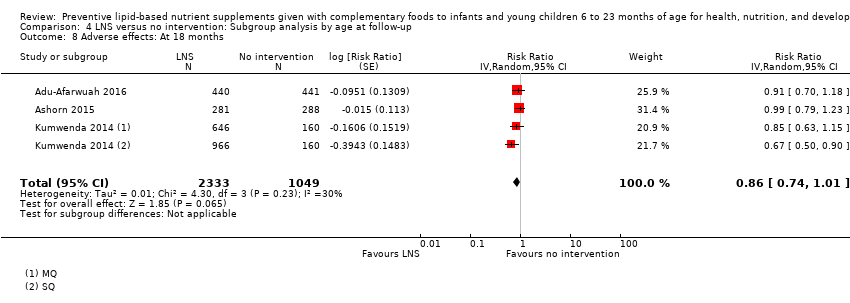
Comparison 4 LNS versus no intervention: Subgroup analysis by age at follow‐up, Outcome 8 Adverse effects: At 18 months.

Comparison 4 LNS versus no intervention: Subgroup analysis by age at follow‐up, Outcome 9 Mid‐upper arm circumference (MUAC).

Comparison 4 LNS versus no intervention: Subgroup analysis by age at follow‐up, Outcome 10 Serum haemoglobin (g/L).
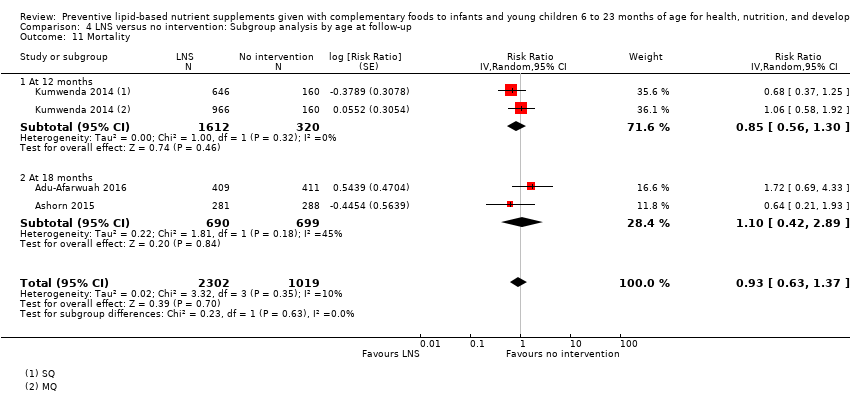
Comparison 4 LNS versus no intervention: Subgroup analysis by age at follow‐up, Outcome 11 Mortality.
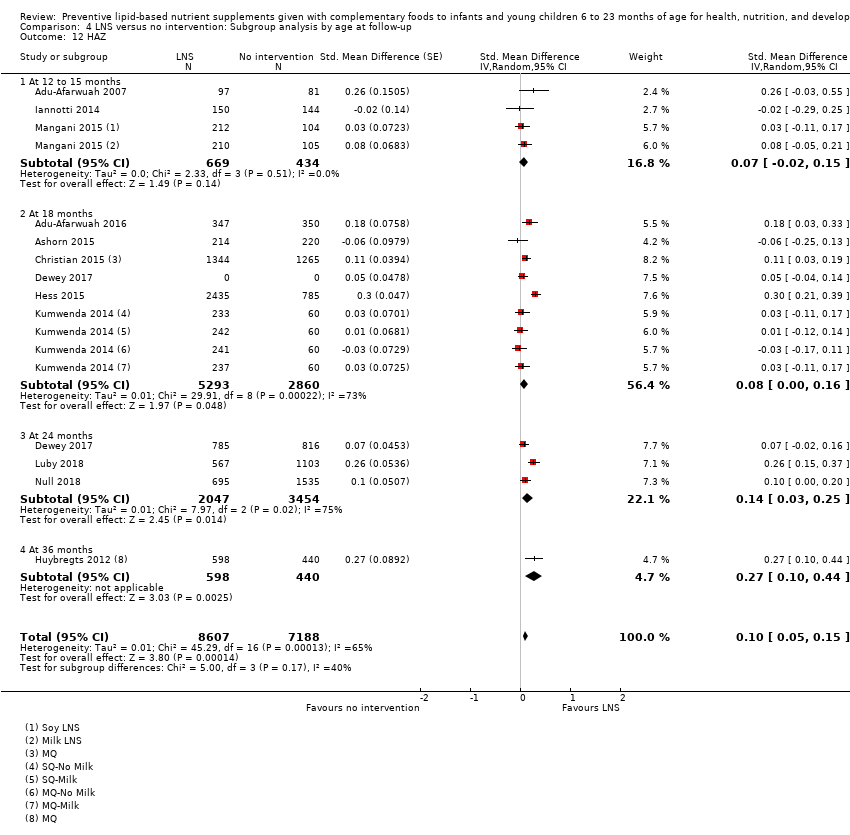
Comparison 4 LNS versus no intervention: Subgroup analysis by age at follow‐up, Outcome 12 HAZ.
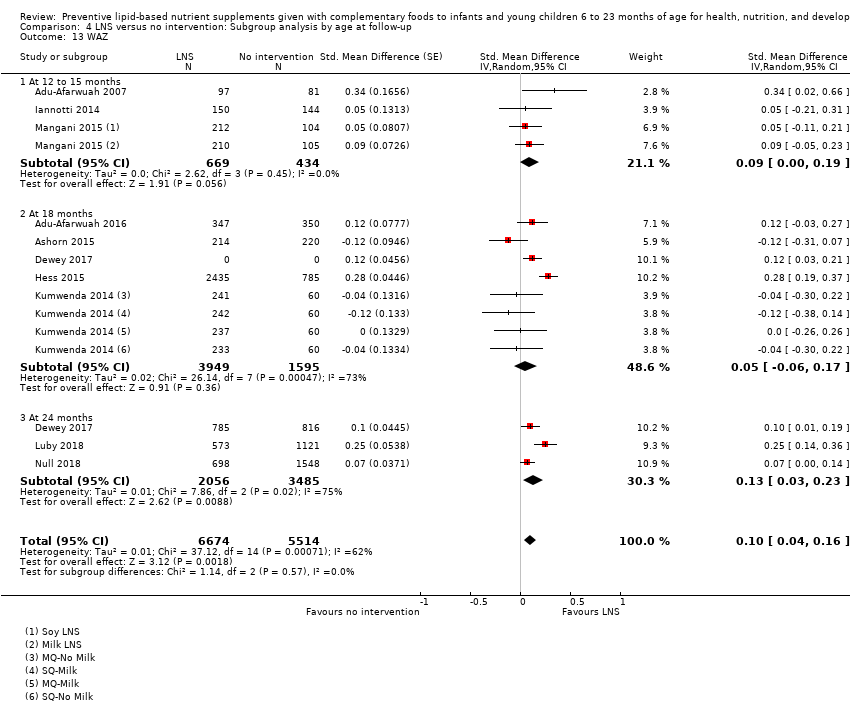
Comparison 4 LNS versus no intervention: Subgroup analysis by age at follow‐up, Outcome 13 WAZ.

Comparison 4 LNS versus no intervention: Subgroup analysis by age at follow‐up, Outcome 14 WHZ.

Comparison 5 LNS versus fortified blended food (FBF), Outcome 1 Moderate stunting.
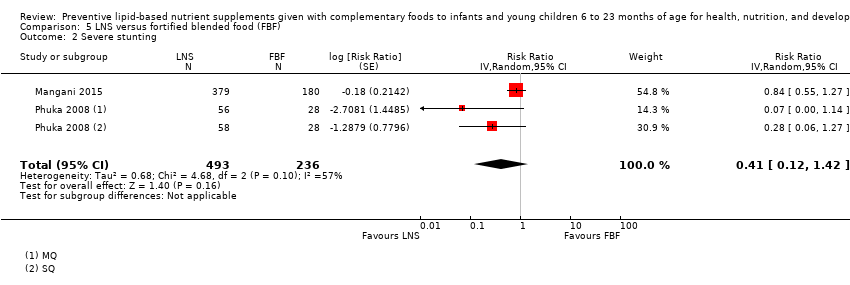
Comparison 5 LNS versus fortified blended food (FBF), Outcome 2 Severe stunting.
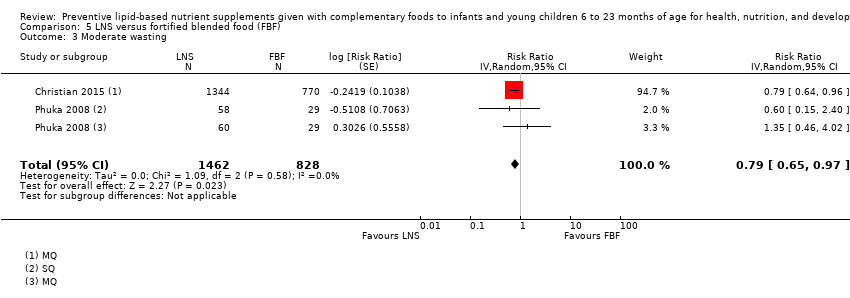
Comparison 5 LNS versus fortified blended food (FBF), Outcome 3 Moderate wasting.

Comparison 5 LNS versus fortified blended food (FBF), Outcome 4 Severe wasting.

Comparison 5 LNS versus fortified blended food (FBF), Outcome 5 Moderate underweight.
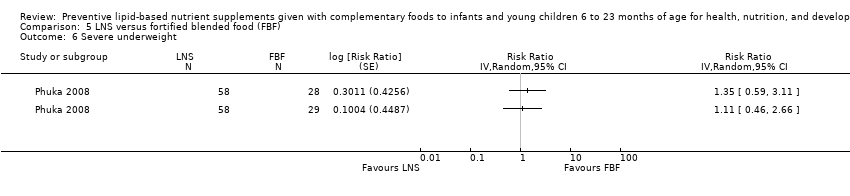
Comparison 5 LNS versus fortified blended food (FBF), Outcome 6 Severe underweight.

Comparison 5 LNS versus fortified blended food (FBF), Outcome 7 MUAC.

Comparison 5 LNS versus fortified blended food (FBF), Outcome 8 Haemoglobin (g/L).

Comparison 5 LNS versus fortified blended food (FBF), Outcome 9 HAZ.

Comparison 5 LNS versus fortified blended food (FBF), Outcome 10 WAZ.

Comparison 5 LNS versus fortified blended food (FBF), Outcome 11 WHZ.

Comparison 6 LNS versus micronutrient powders (MNP), Outcome 1 Moderate stunting.
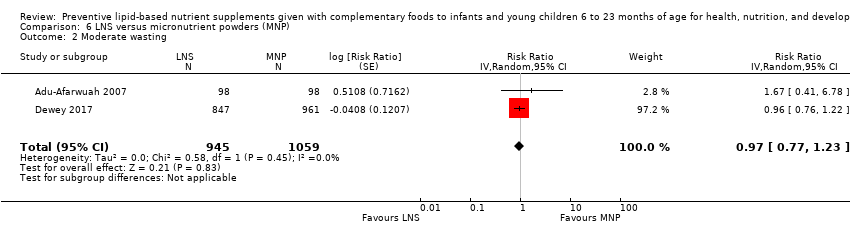
Comparison 6 LNS versus micronutrient powders (MNP), Outcome 2 Moderate wasting.

Comparison 6 LNS versus micronutrient powders (MNP), Outcome 3 Moderate underweight.

Comparison 6 LNS versus micronutrient powders (MNP), Outcome 4 Anaemia.
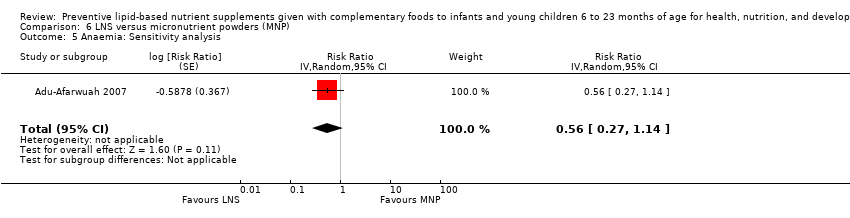
Comparison 6 LNS versus micronutrient powders (MNP), Outcome 5 Anaemia: Sensitivity analysis.

Comparison 6 LNS versus micronutrient powders (MNP), Outcome 6 Serum haemoglobin (g/L).

Comparison 6 LNS versus micronutrient powders (MNP), Outcome 7 Serum haemoglobin (g/L): Sensitivity analysis.
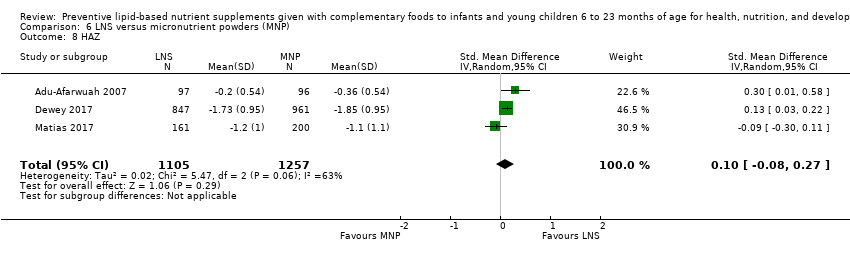
Comparison 6 LNS versus micronutrient powders (MNP), Outcome 8 HAZ.

Comparison 6 LNS versus micronutrient powders (MNP), Outcome 9 HAZ: Sensitivity analysis.

Comparison 6 LNS versus micronutrient powders (MNP), Outcome 10 WAZ.

Comparison 6 LNS versus micronutrient powders (MNP), Outcome 11 WAZ: Sensitivity analysis.

Comparison 6 LNS versus micronutrient powders (MNP), Outcome 12 WHZ.

Comparison 6 LNS versus micronutrient powders (MNP), Outcome 13 WHZ: Sensitivity analysis.
| LNS plus complementary feeding compared with no intervention | ||||||
| Patient or population: children aged 6 to 23 months Settings: community Intervention: LNS plus complementary feeding Comparison: no intervention | ||||||
| Outcomes | Illustrative comparative risks* (95% CI) | Relative effect | Number of participants | Quality of the evidence | Comments | |
| Assumed risk | Corresponding risk | |||||
| No intervention | LNS plus complementary feeding | |||||
| Stunting | ||||||
| Moderate stunting Measured as height‐for‐age z score < −2 SD Measured at 12, 18 and 24 months of age | 2618/7137 | 2353/7060 | RR 0.93 (0.88 to 0.98) | 13,372 | ⊕⊕⊕⊝ | 2 studies, Kumwenda 2014 and Mangani 2015, contributed data to multiple comparisons; total number of comparisons = 13 |
| Severe stunting Measured as height‐for‐age z score < −3 SD Measured at 12, 18 and 24 months of age | 471/4188 | 290/2868 | RR 0.85 (0.74 to 0.98) | 6151 (5 studies) | ⊕⊕⊕⊝ | 2 studies, Kumwenda 2014 and Mangani 2015, contributed data to multiple comparisons; total number of comparisons = 9 |
| Wasting | ||||||
| Moderate wasting Measured as weight‐for‐height z score < −2 SD Measured at 12, 18 and 24 months of age | 695/6213 | 624/6959 | RR 0.82 (0.74 to 0.91) | 13,172 (8 studies) | ⊕⊕⊕⊝ | 1 study, Kumwenda 2014, contributed data to 2 comparisons; total number of comparisons = 11 |
| Severe wasting Measured as weight‐for‐height z score < −3 SD Measured at 12 and 18 months of age | 18/1636 | 21/1663 | RR 1.27 (0.66 to 2.46) | 2329 (3 studies) | ⊕⊕⊕⊕ | 1 study, Kumwenda 2014, contributed data to 4 comparisons; total number of comparisons = 6 |
| Underweight | ||||||
| Moderate underweight Measured as weight‐for‐age z score < −2 SD Measured at 12, 18 and 24 months of age | 1723/7013 | 1525/6861 | RR 0.85 (0.80 to 0.91) | 13,073 (8 studies) | ⊕⊕⊕⊝ | 1 study, Kumwenda 2014, contributed data to 4 comparisons; total number of comparisons = 11 |
| Severe underweight Measured as weight‐for‐age z score < −3 SD Measured at 12 and 18 months of age | 62/1224 | 50/1258 | RR 0.78 (0.54 to 1.13) | 1729 (2 studies) | ⊕⊕⊕⊕ | 1 study, Kumwenda 2014, contributed data to 4 comparisons; total number of comparisons = 5 |
| Anaemia Measured as haemoglobin < 10 g/dL Measured at 12, 18 and 24 months of age | 697/1359 | 558/973 | RR 0.79 (0.69 to 0.90) | 2332 (5 studies) | ⊕⊕⊝⊝ | ‐ |
| Adverse effects Defined as deaths, hospitalisations, congenital abnormalities and life‐threatening conditions requiring an immediate hospital visit Assessed at 12 and 18 months of age | 314/1369 | 401/2333 | RR 0.86 (0.74 to 1.01) | 3382 (3 studies) | ⊕⊕⊕⊝ | 1 study, Kumwenda 2014, contributed data to 2 comparisons; total number of comparisons = 4 |
| *The basis for the assumed risk (e.g. the median control group risk across studies) is provided in footnotes. The corresponding risk (and its 95% CI) is based on the assumed risk in the comparison group and the relative effect of the intervention (and its 95% CI). CI: confidence interval; LNS: lipid‐based nutrient supplement; RR: risk ratio; SD: standard deviation | ||||||
| GRADE Working Group grades of evidence | ||||||
| aDowngraded one level due to study limitations: high risk of selection bias (inadequate sequence generation process) in one study (Adu‐Afarwuah 2007); high risk of performance bias in seven studies (Adu‐Afarwuah 2016; Ashorn 2015; Christian 2015; Dewey 2017; Hess 2015; Luby 2018; Null 2018); and high risk of detection bias in one study (Christian 2015). | ||||||
| LNS plus complementary feeding compared with fortified blended food (FBF) | ||||||
| Patient or population: children aged 6 to 23 months Settings: community Intervention: LNS plus complementary feeding Comparison: FBF | ||||||
| Outcomes | Illustrative comparative risks* (95% CI) | Relative effect | Number of participants | Quality of the evidence | Comments | |
| Assumed risk | Corresponding risk | |||||
| FBF | LNS plus complementary feeding | |||||
| Stunting | ||||||
| Moderate stunting Measured as height‐for‐age z score < −2 SD Measured at 12 months and 18 months of age | 461/1048 | 735/1829 | RR 0.89 (0.82 to 0.97) | 2828 | ⊕⊕⊕⊝ | 1 study, Phuka 2008, contributed data to 2 comparisons; total number of comparisons = 4 |
| Severe stunting Measured as height‐for‐age z score < −3 SD Measured at 12 months and 18 months of age | 43/292 | 53/493 | RR 0.41 (0.12 to 1.42) | 729 (2 studies) | ⊕⊕⊕⊝ | 1 study, Phuka 2008, contributed data to 2 comparisons; total number of comparisons = 3 |
| Wasting | ||||||
| Moderate wasting Measured as weight‐for‐height z score < −2 SD Measured at 12 months and 18 months of age | 145/886 | 195/1462 | RR 0.79 (0.65 to 0.97) | 2290 (2 studies) | ⊕⊕⊕⊝ | 1 study, Phuka 2008, contributed data to 2 comparisons; total number of comparisons = 3 |
| Severe wasting Measured as weight‐for‐height z score < −3 SD Measured at 12 months and 18 months of age | 5/296 | 5/497 | RR 0.64 (0.19 to 2.18) | 735 (2 studies) | ⊕⊕⊕⊝ | 1 study, Phuka 2008, contributed data to 2 comparisons; total number of comparisons = 3 |
| Underweight | ||||||
| Moderate underweight Measured as weight‐for‐age z score < −2 SD Measured at 12 months and 18 months of age | 355/876 | 478/1457 | RR 0.81 (0.73 to 0.91) | 2280 (2 studies) | ⊕⊕⊕⊝ | 1 study, Phuka 2008, contributed data to 2 comparisons; total number of comparisons = 3 |
| Severe underweight Measured as weight‐for‐age z score < −3 SD Measured at 12 months of age | 34/722 | 60/1505 | RR 1.23 (0.67 to 2.25) | 173 (1 study) | ⊕⊕⊝⊝ | 1 study, Phuka 2008, contributed data to 2 arms to this analysis; total number of comparisons = 2 |
| Anaemia | None of the included studies reported this outcome | |||||
| Adverse effects | None of the included studies reported this outcome | |||||
| *The basis for the assumed risk (e.g. the median control group risk across studies) is provided in footnotes. The corresponding risk (and its 95% CI) is based on the assumed risk in the comparison group and the relative effect of the intervention (and its 95% CI). CI: Confidence interval; LNS: lipid‐based nutrient supplements; RR: Risk Ratio; SD: Standard deviation. | ||||||
| GRADE Working Group grades of evidence | ||||||
| aDowngraded one level due to study limitations: high risk of performance bias in two studies (Christian 2015; Phuka 2008). | ||||||
| LNS plus complementary feeding compared with micronutrient powders (MNP) | ||||||
| Patient or population: children aged 6 to 23 months Settings: community Intervention: LNS plus complementary feeding Comparison: MNP | ||||||
| Outcomes | Illustrative comparative risks* (95% CI) | Relative effect | Number of participants | Quality of the evidence | Comments | |
| Assumed risk | Corresponding risk | |||||
| MNP | LNS plus complementary feeding | |||||
| Moderate stunting Measured as height‐for‐age z score < −2 SD Measured at 12 months and 24 months of age | 421/1059 | 336/945 | RR 0.92 (0.82 to 1.02) | 2365 | ⊕⊕⊕⊝ | ‐ |
| Moderate wasting Measured as weight‐for‐height z score < −2 SD Measured at 12 months and 24 months of age | 133/1059 | 115/945 | RR 0.97 (0.77 to 1.23) | 2004 | ⊕⊕⊕⊝ | ‐ |
| Moderate underweight Measured as weight‐for‐age z score < −2 SD Measured at 12 months and 24 months of age | 376/1059 | 292/945 | RR 0.88 (0.78 to 0.99) | 2004 | ⊕⊕⊕⊝ | ‐ |
| Anaemia Measured as haemoglobin < 10 g/dL Measured at 12 months of age | 18/98 | 10/98 | RR 0.38 (0.21 to 0.68) | 557 | ⊕⊕⊝⊝ | ‐ |
| Adverse effects | None of the included studies reported this outcome | |||||
| *The basis for the assumed risk (e.g. the median control group risk across studies) is provided in footnotes. The corresponding risk (and its 95% CI) is based on the assumed risk in the comparison group and the relative effect of the intervention (and its 95% CI). CI: Confidence interval; LNS: Lipid‐based nutrient supplements; RR: Risk ratio; SD: Standard deviation. | ||||||
| GRADE Working Group grades of evidence | ||||||
| aDowngraded one level due to study limitations: high risk of performance bias in two studies (Adu‐Afarwuah 2016; Dewey 2017). | ||||||
| Method | Approach |
| Measures of treatment effects | Rates If rates represent events that could occur more than once per participant, we will report the rate difference using the methodologies described in Deeks 2011. |
| Unit of analysis issues | Cluster‐randomised trials We will follow the methods described in theCochrane Handbook for Systematic Reviews of Interventions (Higgins 2011b), and adjust the sample sizes or standard errors of cluster‐randomised trials by using an estimate of the intra‐cluster correlation co‐efficient (ICC) derived from the study (if possible), from a similar trial or from a study of a similar population. If we use ICCs from other sources, we will report this in the results section, and conduct sensitivity analyses to investigate the effect of variation in the ICC. We will acknowledge heterogeneity in the randomisation unit and perform a sensitivity analysis to investigate the effects of the randomisation unit in the future updates of the review, if applicable. |
| Dealing with missing data | If we find studies with high levels of missing data, we will explore the effect in the overall assessment of treatment effect by removing such studies and conducting a sensitivity analysis. |
| Assessment of reporting bias | If we include 10 or more studies in a meta‐analysis, we will investigate reporting biases (such as publication bias) using funnel plots. We will assess funnel plot asymmetry visually, and use formal tests for funnel plot asymmetry. For continuous outcomes, we will use the test proposed by Egger 1997. For dichotomous outcomes, we will use the test proposed by Harbord 2006. If asymmetry is detected in any of these tests or is suggested by a visual assessment, we will perform exploratory analyses to investigate it. |
| Subgroup analysis and investigation of heterogeneity | We will conduct exploratory subgroup analyses on the primary outcomes, irrespective of heterogeneity, when there are more than three studies contributing data. We will conduct the following analyses.
|
| Sensitivity analysis | We will carry out a sensitivity analysis to examine:
|
| ICC: Intra‐class correlation coefficient; WHO: World Health Organization. | |
| Study | Total energy | Lipid content | Protein Content | Micronutrients |
| 108 kcal (20 g/day) | linoleic acid (1.29 g); linolenic acid (0.29 g) | Not specified | Carotene (400 μg RE); vitamin C (30 mg); folic acid (80 g); thiamine (0.3 mg); riboflavin (0.4 mg); vitamin B3 (4 mg); pantothenic acid (1.8 mg); vitamin B6 (0.3 mg); vitamin B12 (0.5 g); iron sulphate (9 mg); zinc sulphate (4 mg); calcium phosphate (100 mg); potassium (152 mg); copper sulphate (0.2 mg); sodium selenite (10 ug); potassium iodate (90 ug); phosphate (82 mg); magnesium (16 mg); manganese (0.08 mg); phytate (82 mg) | |
| 118 kcal (20 g/day) | 9.6 g | 2.6 g | Linoleic acid (4.46 g); α‐linolenic acid (0.58 g); vitamin A (400 mg retinol equivalents); thiamine (0.3 mg); riboflavin (0.4 mg); niacin (4 mg); vitamin B6 (0.3 mg); vitamin B12 (0.5 mg); vitamin C (30 mg); vitamin D (5 mg); vitamin E (6 mg); vitamin K (30 mg); folic acid (80 mg); pantothenic acid (1.8 mg); iron (6 mg); zinc (8 mg); copper (0.34 mg); calcium (280 mg); phosphorus (190 mg); potassium (200 mg); magnesium (40 mg); selenium (20 mg); iodine (90 mg); manganese (1.2 mg) | |
| 118 kcal (20 g/day) | 9.6 g | 2.6 g | Linoleic acid (4.46 g); a‐linolenic acid (0.58 g); vitamin A (400 mg RE); vitamin C (30 mg); vitamin B1 (0.3 mg); vitamin B2 (0.4 mg); niacin (4 mg); folic acid (80 mg); pantothenic acid (1.8 mg); vitamin B6 (0.3 mg); vitamin B12 (0.5 mg); vitamin D (5 mg); vitamin E (6 mg); vitamin K (30 mg); iron (6 mg); zinc (8 mg); copper (0.34 mg); calcium (280 mg); phosphorus (190 mg); potassium (200 mg); magnesium (40 mg); selenium (20 mg); iodine (90 mg); manganese (1.2 mg) | |
| 275 kcal (50 g/day) | Not specified | Not specified | Vitamin A (412 IU); vitamin D (307 IU); vitamin C (75 mg); thiamine (0.7 mg); riboflavin (1.0 mg); vitamin B12 (1.0 μg); pyridoxine (0.24 mg); niacin (10.3 mg); pantothenic acid (3.8 mg); folic acid (0.07 mg); vitamin K (0.01 mg); calcium (514 mg); phosphorus (265 mg); iron (9.5 mg); zinc (8.3 mg); copper (0.3 mg); iodine (0.07 mg); selenium (0.003 mg); magnesium (23.4 mg); phytic acid (0.425 mg2); phytic acid:iron molar ratio2 (2.1); phytic acid:zinc molar ratio2 (1.9) | |
| 250 kcal (46 g/day) | Not specified | Not specified | Not specified | |
| 118 kcal (20 g/day) | 9.6 g | 2.6 g | Linoleic acid (4.46 g); α‐linolenic acid (0.58 g); vitamin A (400 mg RE); thiamine (0.5 mg); riboflavin (0.5 mg); niacin (6 mg); folic acid (150 mg); pantothenic acid (2 mg); vitamin B6 (0.5 mg); vitamin B12 (0.9 mg); vitamin C (30 mg); vitamin D (5 mg); vitamin E (6 mg); vitamin K (30 mg); calcium (280 mg); copper (0.34 mg); iodine (90 mg); iron (9 mg); magnesium (40 mg); manganese (1.2 mg); phosphorus (190 mg); potassium (200 mg); selenium (20 mg); zinc (8 mg) | |
| 118 kcal (20 g/day) | 9.6 g | 2.6 g | Linoleic acid (4.46 g); α‐Linolenic acid (0.58 g); vitamin A (400 mg); thiamine (0.3 mg); riboflavin (0.4 mg); niacin (4 mg); pantothenic acid (1.8 mg); vitamin B6 (0.3 mg); vitamin B12 (0.5 mg); folic acid (80 mg); vitamin C (30 mg); vitamin D (5 mg); vitamin E (6 mg); vitamin K (30 mg); calcium (280 mg); copper (0.34 mg); iodine (90 mg); iron (6 mg); magnesium (40 mg); manganese (1.2 mg); phosphorus (190 mg); potassium (200 mg); selenium (20 μg); zinc (0 mg) | |
| 247 kcal (46 g/day) | 16 g | 5.9 g | Linoleic acid (2 g); α‐linolenic acid (0.3 g); vitamin A (400 mg); vitamin E (6 mg); thiamine (0.5 mg); niacin (6 mg); pantothenic acid (2 mg); vitamin B6 (0.5 mg); folic acid (160 mg); vitamin B12 (0.9 mg); vitamin C (30 mg); magnesium (60 mg); zinc (4 mg); iron (9 mg); copper (0.3 mg); potassium (310 mg); calcium (387 mg); phosphorus (275 mg); selenium (17 mg); manganese (0.17 mg); iodine (90 mg) | |
| 108 kcal (20 g/day) | 7.08 g | 2.56 g | Linoleic acid (1.29 g); α‐linoleic acid (0.29 g); vitamin A (400 mg); thiamine (0.3 mg); riboflavin (0.4 mg); niacin (4 mg); pantothenic acid (1.8 mg); vitamin B6 (0.3 mg); vitamin B12 (0.5 mg); folic acid (80 mg); vitamin C (30 mg); calcium (100 mg); copper (0.2 mg); iodine (90 mg); iron (9 mg); magnesium (16 mg); manganese (0.08 mg); phosphorus (82.2 mg); potassium (152 mg); selenium (10 mg); zinc (4 mg) | |
| 55 kcal (10 g/day) | 4.7 g | 1.3 g | Linoleic acid (2.22 g); α‐linolenic acid (0.29 g); vitamin A (400 μg RE); vitamin C (30 mg); vitamin B1 (0.3 mg); vitamin B2 (0.4 mg); niacin (4 mg); folic acid (80 μg); pantothenic acid (1.8 mg); vitamin B6 (0.3 mg); vitamin B12 (0.5 μg); vitamin D (200 IU); vitamin E (6 6 mg); vitamin K (30 μg); iron (6 mg); zinc (8 mg); copper (0.34 mg); calcium (240 mg); phosphorus (208 mg); potassium (265 mg); magnesium (50 mg); selenium (20 μg); iodine (90 μg); manganese (1.2 mg); phytate (28 mg) | |
| 17 kcal (20 g/day) | 9.5 g | 2.5 g | Linoleic acid (4.44 g); α‐linolenic acid (0.58 g); vitamin A (400 μg RE); vitamin C (30 mg); vitamin B1 (0.3 mg); vitamin B2 (0.4 mg); niacin (4 mg); folic acid (80 μg); pantothenic acid (1.8 mg); vitamin B6 (0.3 mg); vitamin B12 (0.5 μg); vitamin D (200 IU); vitamin E (6 6 mg); vitamin K (30 μg); iron (6 mg); zinc (8 mg); copper (0.34 mg); calcium (240 mg); phosphorus (208 mg); potassium (265 mg); magnesium (50 mg); selenium (20 μg); iodine (90 μg); manganese (1.2 mg); phytate (56 mg) | |
| 241 kcal (40 g/day) | 18.9 g | 5 g | Linoleic acid (8.88 g); α‐linolenic acid (1.16 g); vitamin A (400 μg RE); vitamin C (30 mg); vitamin B1 (0.3 mg); vitamin B2 (0.4 mg); niacin (4 mg); folic acid (80 μg); pantothenic acid (1.8 mg); vitamin B6 (0.3 mg); vitamin B12 (0.5 μg); vitamin D (200 IU); vitamin E (6 6 mg); vitamin K (30 μg); iron (6 mg); zinc (8 mg); copper (0.34 mg); calcium (240 mg); phosphorus (208 mg); potassium (265 mg); magnesium (50 mg); selenium (20 μg); iodine (90 μg); manganese (1.2 mg); phytate (112 mg) | |
| 118 kcal (20 g/day) | 9.6 g | 2.6 g | Linoleic acid (4.46 g); Alpha‐linolenic acid (0.58 g); Vitamin A (400 μg); Vitamin D (5 μg); Vitamin E (6 mg); Vitamin K (30 μg); Vitamin C (30 mg) Folic acid (150 μg); Thiamine (B1) (0.5 mg); Riboflavin (B2) (0.5 mg); Niacin (6 mg); Pantothenic acid (B5) (2 mg); Vitamin B6 (0.5 mg); Vitamin B12 (0.9 μg); Calcium (280 mg); Copper (0.34 mg); Iodine (90 μg); Iron (9 mg); Magnesium (40 mg); Manganese (1.2 mg); Phosphorous (190 mg); Potassium (200 mg); Selenium (20 μg); Zinc (8 mg) | |
| Milk‐LNS 284.8 kcal (54 g/day) | 17.9 g | 8.2 g | Retinol (400 μg RE); folate (160 μg); niacin (6 mg); pantothenic acid (2 mg); riboflavin (0.5 mg); thiamine (0.5 mg); vitamin B6 (0.5 mg); vitamin B12 (0.9 μg); vitamin C (30 mg); vitamin D (5 μg); calcium (366 mg); copper (0.4 mg); iodine (90 μg); iron (6 mg); magnesium (78.5 mg); selenium (20 μg); zinc (6.0 mg); phosphorus (185.6 mg); potassium (318.6 mg); manganese (0.60 mg) | |
| Soy‐LNS 276.1 kcal (54 g/day) | 18.5 g | 7.5 g | Retinol (400 μg RE); folate (160 μg); niacin (6 mg); pantothenic acid (2 mg); riboflavin (0.5 mg); thiamine (0.5 mg); vitamin B6 (0.5 mg); vitamin B12 (0.9 μg); vitamin C (30 mg); vitamin D (5 μg); calcium (366 mg); copper (0.4 mg); iodine (90 μg); iron (6 mg); magnesium (78.5 mg); selenium (20 μg); zinc (6.0 mg); phosphorus (185.6 mg); potassium (307.3 mg); manganese (0.60 mg) | |
| 110 kcal (20 g/day) | 7 g | 2.6 g | Linoleic acid (1.29 g); α‐linolenic acid (0.29 g); folic acid (80 μg); niacin (4 mg); pantothenic acid (1.8 mg); riboflavin (0.4 mg); thiamine (0.3 mg); vitamin A (400 μg); vitamin B12 (0.5 μg); vitamin B6 (0.3 mg); vitamin C (30 mg); calcium (100 mg); copper (0.2 mg); iodine (90 μg); iron (9 mg); magnesium (16 mg); manganese (0,08 mg); phosphorous (82 mg); potassium (152 mg); selenium (10 μg); zinc (4 mg) | |
| 118 kcal (20 g/day) | 9.6 g | 2.6 g | Linoleic acid (4.46 g); Alpha‐linolenic acid (0.58 g); Vitamin A (400 μg); Vitamin D (5 μg); Vitamin E (6 mg); Vitamin K (30 μg); Vitamin C (30 mg) Folic acid (150 μg); Thiamine (B1) (0.5 mg); Riboflavin (B2) (0.5 mg); Niacin (6 mg); Pantothenic acid (B5) (2 mg); Vitamin B6 (0.5 mg); Vitamin B12 (0.9 μg); Calcium (280 mg); Copper (0.34 mg); Iodine (90 μg); Iron (9 mg); Magnesium (40 mg); Manganese (1.2 mg); Phosphorous (190 mg); Potassium (200 mg); Selenium (20 μg); Zinc (8 mg) | |
| 118 kcal (20 g/day) | 9.6 g | 2.6 g | Linoleic acid (4.5 g); α‐linolenic acid (0.6 g); vitamin A (400 μg); vitamin C (30 mg); vitamin D (5 mg); vitamin E (6 mg); vitamin K (30 mg); thiamine (0.5 mg); riboflavin (0.5 mg); niacin (6 mg); pantothenic acid (2 mg); vitamin B6 (0.5 mg); folic acid (150 μg); vitamin B12 (0.9 μg); iron (9 mg); zinc (8 mg); copper (0.3 mg); selenium (20 μg); iodine (90 μg); calcium (280 mg); magnesium (40 mg); manganese (1.2 mg); phosphorus (190 mg); potassium (200 mg) | |
| 130 kcal (25 g/day) | 8.3 g | 3.8 g | Retinol (400 mg RE); folate (160 mg); niacin (6 mg); pantothenic acid (2 mg); riboflavin (0.5 mg); thiamine (0.5 mg); vitamin B 6 (0.5 mg); vitamin B12 (0.9 mg); vitamin C (30 mg); vitamin D (5 mg); calcium (283 mg); copper (0.5 mg); iodine (90 mg); iron (8 mg); magnesium (60 mg); selenium (17 mg); zinc (8.4 mg) | |
| 264 kcal (50 g/day) | 16.5 g | 7.6 g | Retinol (400 mg RE); folate (160 mg); niacin (6 mg); pantothenic acid (2 mg); riboflavin (0.5 mg); thiamine (0.5 mg); vitamin B6 (0.5 mg); vitamin B12 (0.9 mg); vitamin C (30 mg); vitamin D (5 mg); calcium (366 mg); copper (0.4 mg); iodine (90 mg); iron (8 mg); magnesium (60 mg); selenium (17 mg); zinc (8.4 mg) | |
| 247 kcal (46.4 g/day) | 16 g | 5.9 g | Vitamin A (400 μg); vitamin B12 (0.9 μg); iron (9 mg); zinc (9 mg) | |
| g: gram; | ||||
| Outcome or subgroup title | No. of studies | No. of participants | Statistical method | Effect size |
| 1 Moderate stunting Show forest plot | 9 | 13372 | Risk Ratio (Random, 95% CI) | 0.93 [0.88, 0.98] |
| 2 Severe stunting Show forest plot | 5 | 6151 | Risk Ratio (Random, 95% CI) | 0.85 [0.74, 0.98] |
| 3 Moderate stunting: Sensitivity analysis Show forest plot | 7 | Risk Ratio (Random, 95% CI) | 0.92 [0.88, 0.96] | |
| 4 Severe stunting: Sensitivity analysis Show forest plot | 4 | Risk Ratio (Random, 95% CI) | 0.84 [0.73, 0.97] | |
| 5 Moderate wasting Show forest plot | 8 | 13172 | Risk Ratio (Random, 95% CI) | 0.82 [0.74, 0.91] |
| 6 Severe wasting Show forest plot | 3 | 2329 | Risk Ratio (Random, 95% CI) | 1.27 [0.66, 2.46] |
| 7 Moderate wasting: Sensitivity analysis Show forest plot | 6 | Risk Ratio (Random, 95% CI) | 0.81 [0.73, 0.90] | |
| 8 Severe wasting: Sensitivity analysis Show forest plot | 2 | Risk Ratio (Random, 95% CI) | 1.24 [0.61, 2.51] | |
| 9 Moderate underweight Show forest plot | 8 | 13073 | Risk Ratio (Random, 95% CI) | 0.85 [0.80, 0.91] |
| 10 Severe underweight Show forest plot | 2 | 1729 | Risk Ratio (Random, 95% CI) | 0.78 [0.54, 1.13] |
| 11 Moderate underweight: Sensitivity analysis Show forest plot | 6 | Risk Ratio (Random, 95% CI) | 0.85 [0.80, 0.90] | |
| 12 Severe underweight: Sensitivity analysis Show forest plot | 1 | Risk Ratio (Random, 95% CI) | 0.79 [0.54, 1.16] | |
| 13 Anaemia Show forest plot | 5 | 2332 | Risk Ratio (Random, 95% CI) | 0.79 [0.69, 0.90] |
| 14 Adverse effects Show forest plot | 3 | 3382 | Risk Ratio (Random, 95% CI) | 0.86 [0.74, 1.01] |
| 15 Adverse effects: Sensitivity analysis Show forest plot | 1 | 1932 | Risk Ratio (Random, 95% CI) | 0.76 [0.60, 0.95] |
| 16 Mid‐upper arm circumference (MUAC) Show forest plot | 6 | 8187 | Std. Mean Difference (Random, 95% CI) | 0.13 [0.05, 0.22] |
| 17 Serum haemoglobin (g/L) Show forest plot | 4 | 4518 | Mean Difference (Random, 95% CI) | 5.78 [2.27, 9.30] |
| 18 Mortality Show forest plot | 3 | 3321 | Risk Ratio (Random, 95% CI) | 0.93 [0.63, 1.37] |
| 19 HAZ Show forest plot | 12 | 15795 | Std. Mean Difference (Random, 95% CI) | 0.11 [0.05, 0.16] |
| 20 WAZ Show forest plot | 10 | 12188 | Std. Mean Difference (Random, 95% CI) | 0.09 [0.02, 0.16] |
| 21 WHZ Show forest plot | 10 | 12894 | Std. Mean Difference (Random, 95% CI) | 0.08 [0.04, 0.13] |
| Outcome or subgroup title | No. of studies | No. of participants | Statistical method | Effect size |
| 1 Severe stunting Show forest plot | 5 | 6151 | Risk Ratio (Random, 95% CI) | 0.85 [0.74, 0.98] |
| 1.1 SQ LNS | 4 | 4956 | Risk Ratio (Random, 95% CI) | 0.83 [0.70, 0.99] |
| 1.2 MQ LNS | 2 | 1195 | Risk Ratio (Random, 95% CI) | 0.88 [0.69, 1.12] |
| 2 Moderate stunting Show forest plot | 9 | 13372 | Risk Ratio (Random, 95% CI) | 0.93 [0.88, 0.98] |
| 2.1 SQ LNS | 7 | 9710 | Risk Ratio (Random, 95% CI) | 0.92 [0.84, 1.00] |
| 2.2 MQ LNS | 3 | 3662 | Risk Ratio (Random, 95% CI) | 0.94 [0.88, 1.02] |
| 3 Moderate wasting Show forest plot | 8 | 13172 | Risk Ratio (Random, 95% CI) | 0.82 [0.74, 0.91] |
| 3.1 SQ LNS | 7 | 9903 | Risk Ratio (Random, 95% CI) | 0.83 [0.73, 0.95] |
| 3.2 MQ LNS | 2 | 3269 | Risk Ratio (Random, 95% CI) | 0.78 [0.63, 0.96] |
| 4 Severe wasting Show forest plot | 3 | 2329 | Risk Ratio (Random, 95% CI) | 1.27 [0.66, 2.46] |
| 4.1 SQ LNS | 2 | 1106 | Risk Ratio (Random, 95% CI) | 1.74 [0.73, 4.15] |
| 4.2 MQ LNS | 2 | 1223 | Risk Ratio (Random, 95% CI) | 0.84 [0.31, 2.30] |
| 5 Moderate underweight Show forest plot | 8 | 13073 | Risk Ratio (Random, 95% CI) | 0.85 [0.80, 0.91] |
| 5.1 SQ LNS | 7 | 9880 | Risk Ratio (Random, 95% CI) | 0.88 [0.80, 0.96] |
| 5.2 MQ LNS | 2 | 3193 | Risk Ratio (Random, 95% CI) | 0.83 [0.76, 0.92] |
| 6 Severe underweight Show forest plot | 2 | 1729 | Risk Ratio (Random, 95% CI) | 0.78 [0.54, 1.13] |
| 6.1 SQ LNS | 2 | 1083 | Risk Ratio (Random, 95% CI) | 0.84 [0.52, 1.37] |
| 6.2 MQ LNS | 1 | 646 | Risk Ratio (Random, 95% CI) | 0.71 [0.41, 1.24] |
| 7 Anaemia Show forest plot | 5 | 2332 | Risk Ratio (M‐H, Random, 95% CI) | 0.79 [0.69, 0.90] |
| 7.1 SQ LNS | 3 | 1107 | Risk Ratio (M‐H, Random, 95% CI) | 0.63 [0.43, 0.93] |
| 7.2 MQ LNS | 2 | 1225 | Risk Ratio (M‐H, Random, 95% CI) | 0.86 [0.78, 0.94] |
| 8 Adverse effects Show forest plot | 3 | 3382 | Risk Ratio (Random, 95% CI) | 0.86 [0.74, 1.01] |
| 8.1 SQ LNS | 3 | 2576 | Risk Ratio (Random, 95% CI) | 0.86 [0.69, 1.06] |
| 8.2 MQ LNS | 1 | 806 | Risk Ratio (Random, 95% CI) | 0.85 [0.63, 1.15] |
| 9 Mid‐upper arm circumference (MUAC) Show forest plot | 6 | 8187 | Std. Mean Difference (Random, 95% CI) | 0.13 [0.05, 0.22] |
| 9.1 SQ LNS | 5 | 6546 | Std. Mean Difference (Random, 95% CI) | 0.12 [‐0.00, 0.24] |
| 9.2 MQ LNS | 2 | 1641 | Std. Mean Difference (Random, 95% CI) | 0.17 [0.08, 0.26] |
| 10 Serum haemoglobin (g/L) Show forest plot | 4 | 4518 | Mean Difference (IV, Random, 95% CI) | 5.78 [2.27, 9.30] |
| 10.1 SQ LNS | 2 | 3293 | Mean Difference (IV, Random, 95% CI) | 8.95 [7.66, 10.23] |
| 10.2 MQ LNS | 2 | 1225 | Mean Difference (IV, Random, 95% CI) | 3.01 [2.73, 3.28] |
| 11 Mortality Show forest plot | 3 | 3321 | Risk Ratio (Random, 95% CI) | 0.93 [0.63, 1.37] |
| 11.1 SQ LNS | 3 | 2195 | Risk Ratio (Random, 95% CI) | 0.88 [0.49, 1.60] |
| 11.2 MQ LNS | 1 | 1126 | Risk Ratio (Random, 95% CI) | 1.06 [0.58, 1.92] |
| 12 HAZ Show forest plot | 12 | 15795 | Std. Mean Difference (Random, 95% CI) | 0.11 [0.05, 0.16] |
| 12.1 SQ LNS | 9 | 10919 | Std. Mean Difference (Random, 95% CI) | 0.12 [0.04, 0.20] |
| 12.2 MQ LNS | 4 | 4876 | Std. Mean Difference (Random, 95% CI) | 0.08 [0.01, 0.15] |
| 13 WHZ Show forest plot | 10 | 12894 | Std. Mean Difference (Random, 95% CI) | 0.08 [0.04, 0.13] |
| 13.1 SQ LNS | 8 | 10631 | Std. Mean Difference (Random, 95% CI) | 0.08 [0.02, 0.15] |
| 13.2 MQ LNS | 3 | 2263 | Std. Mean Difference (Random, 95% CI) | 0.07 [0.00, 0.14] |
| 14 WAZ Show forest plot | 10 | 12188 | Std. Mean Difference (Random, 95% CI) | 0.09 [0.02, 0.16] |
| 14.1 SQ LNS | 9 | 10959 | Std. Mean Difference (Random, 95% CI) | 0.11 [0.02, 0.19] |
| 14.2 MQ LNS | 2 | 1229 | Std. Mean Difference (Random, 95% CI) | 0.05 [‐0.04, 0.14] |
| Outcome or subgroup title | No. of studies | No. of participants | Statistical method | Effect size |
| 1 Moderate stunting Show forest plot | 9 | 13372 | Risk Ratio (Random, 95% CI) | 0.93 [0.88, 0.98] |
| 1.1 6 to 12 months | 6 | 7871 | Risk Ratio (Random, 95% CI) | 0.96 [0.89, 1.03] |
| 1.2 More than 12 months | 3 | 5501 | Risk Ratio (Random, 95% CI) | 0.89 [0.81, 0.97] |
| 2 Severe stunting Show forest plot | 5 | 6151 | Risk Ratio (Random, 95% CI) | 0.85 [0.74, 0.98] |
| 2.1 6 to 12 months | 3 | 2251 | Risk Ratio (Random, 95% CI) | 0.89 [0.74, 1.07] |
| 2.2 More than 12 months | 2 | 3900 | Risk Ratio (Random, 95% CI) | 0.80 [0.64, 0.99] |
| 3 Moderate wasting Show forest plot | 8 | 13172 | Risk Ratio (Random, 95% CI) | 0.82 [0.74, 0.91] |
| 3.1 6 to 12 months | 5 | 7669 | Risk Ratio (Random, 95% CI) | 0.81 [0.72, 0.92] |
| 3.2 More than 12 months | 3 | 5503 | Risk Ratio (Random, 95% CI) | 0.83 [0.69, 0.99] |
| 4 Severe wasting: 6 to 12 months Show forest plot | 3 | 2329 | Risk Ratio (Random, 95% CI) | 1.27 [0.66, 2.46] |
| 5 Moderate underweight Show forest plot | 8 | 13073 | Risk Ratio (Random, 95% CI) | 0.85 [0.80, 0.91] |
| 5.1 6 to 12 months | 5 | 7532 | Risk Ratio (Random, 95% CI) | 0.87 [0.78, 0.97] |
| 5.2 More than 12 months | 3 | 5541 | Risk Ratio (Random, 95% CI) | 0.87 [0.79, 0.95] |
| 6 Severe underweight: 6 to 12 months Show forest plot | 2 | 1729 | Risk Ratio (Random, 95% CI) | 0.78 [0.54, 1.13] |
| 7 Anaemia Show forest plot | 5 | 2332 | Risk Ratio (M‐H, Random, 95% CI) | 0.79 [0.69, 0.90] |
| 7.1 Upto 6 months | 2 | 1176 | Risk Ratio (M‐H, Random, 95% CI) | 0.55 [0.20, 1.47] |
| 7.2 6 to 12 months | 2 | 627 | Risk Ratio (M‐H, Random, 95% CI) | 0.84 [0.71, 1.00] |
| 7.3 More than 12 months | 1 | 529 | Risk Ratio (M‐H, Random, 95% CI) | 0.70 [0.55, 0.88] |
| 8 Adverse effects Show forest plot | 3 | 3382 | Risk Ratio (Random, 95% CI) | 0.86 [0.74, 1.01] |
| 9 Mid‐upper arm circumference (MUAC) Show forest plot | 6 | 8187 | Std. Mean Difference (Random, 95% CI) | 0.13 [0.05, 0.22] |
| 9.1 Upto 6 months | 2 | 1472 | Std. Mean Difference (Random, 95% CI) | 0.06 [‐0.23, 0.35] |
| 9.2 6 to 12 months | 3 | 5114 | Std. Mean Difference (Random, 95% CI) | 0.18 [0.10, 0.26] |
| 9.3 More than 12 months | 1 | 1601 | Std. Mean Difference (Random, 95% CI) | 0.04 [‐0.04, 0.12] |
| 10 Serum haemoglobin (g/L) Show forest plot | 4 | 4518 | Mean Difference (IV, Random, 95% CI) | 5.78 [2.27, 9.30] |
| 10.1 Upto 6 months | 2 | 1176 | Mean Difference (IV, Random, 95% CI) | 5.58 [0.52, 10.64] |
| 10.2 6 to 12 months | 2 | 3342 | Mean Difference (IV, Random, 95% CI) | 5.96 [0.08, 11.84] |
| 11 Mortality Show forest plot | 3 | 3321 | Risk Ratio (Random, 95% CI) | 0.93 [0.63, 1.37] |
| 11.1 6 to 12 months | 3 | 3321 | Risk Ratio (Random, 95% CI) | 0.93 [0.63, 1.37] |
| 12 HAZ Show forest plot | 12 | 15795 | Std. Mean Difference (Random, 95% CI) | 0.11 [0.05, 0.16] |
| 12.1 Upto 6 months | 3 | 1510 | Std. Mean Difference (Random, 95% CI) | 0.19 [0.01, 0.36] |
| 12.2 6 to 12 months | 6 | 8784 | Std. Mean Difference (Random, 95% CI) | 0.08 [0.00, 0.15] |
| 12.3 More than 12 months | 3 | 5501 | Std. Mean Difference (Random, 95% CI) | 0.14 [0.03, 0.25] |
| 13 WAZ Show forest plot | 10 | 12188 | Std. Mean Difference (Random, 95% CI) | 0.09 [0.02, 0.16] |
| 13.1 Upto 6 months | 3 | 1103 | Std. Mean Difference (Random, 95% CI) | 0.09 [‐0.00, 0.19] |
| 13.2 6 to 12 months | 4 | 5544 | Std. Mean Difference (Random, 95% CI) | 0.03 [‐0.12, 0.18] |
| 13.3 More than 12 months | 3 | 5541 | Std. Mean Difference (Random, 95% CI) | 0.13 [0.03, 0.24] |
| 14 WHZ Show forest plot | 10 | 12894 | Std. Mean Difference (Random, 95% CI) | 0.08 [0.04, 0.13] |
| 14.1 Upto 6 months | 2 | 1216 | Std. Mean Difference (Random, 95% CI) | 0.13 [‐0.12, 0.38] |
| 14.2 6 to 12 months | 5 | 6175 | Std. Mean Difference (Random, 95% CI) | 0.07 [0.00, 0.14] |
| 14.3 More than 12 months | 3 | 5503 | Std. Mean Difference (Random, 95% CI) | 0.09 [0.01, 0.17] |
| Outcome or subgroup title | No. of studies | No. of participants | Statistical method | Effect size |
| 1 Moderate stunting Show forest plot | 9 | 13492 | Risk Ratio (Random, 95% CI) | 0.93 [0.88, 0.98] |
| 1.1 At 12 months | 1 | 564 | Risk Ratio (Random, 95% CI) | 1.01 [0.86, 1.19] |
| 1.2 At 18 months | 6 | 7427 | Risk Ratio (Random, 95% CI) | 0.95 [0.88, 1.02] |
| 1.3 At 24 months | 3 | 5501 | Risk Ratio (Random, 95% CI) | 0.89 [0.81, 0.97] |
| 2 Severe stunting Show forest plot | 5 | 6151 | Risk Ratio (Random, 95% CI) | 0.85 [0.74, 0.98] |
| 2.1 At 12 months | 1 | 564 | Risk Ratio (Random, 95% CI) | 0.96 [0.67, 1.38] |
| 2.2 At 18 months | 2 | 1687 | Risk Ratio (Random, 95% CI) | 0.86 [0.70, 1.07] |
| 2.3 At 24 months | 2 | 3900 | Risk Ratio (Random, 95% CI) | 0.80 [0.64, 0.99] |
| 3 Moderate wasting Show forest plot | 8 | 13172 | Risk Ratio (Random, 95% CI) | 0.80 [0.73, 0.88] |
| 3.1 At 18 months | 6 | 7669 | Risk Ratio (Random, 95% CI) | 0.79 [0.71, 0.89] |
| 3.2 At 24 months | 3 | 5503 | Risk Ratio (Random, 95% CI) | 0.83 [0.69, 0.99] |
| 4 Severe wasting Show forest plot | 3 | 2329 | Risk Ratio (Random, 95% CI) | 1.27 [0.66, 2.46] |
| 4.1 At 12 months | 1 | 563 | Risk Ratio (Random, 95% CI) | 0.78 [0.12, 4.93] |
| 4.2 At 18 months | 2 | 1766 | Risk Ratio (Random, 95% CI) | 1.39 [0.67, 2.87] |
| 5 Moderate underweight Show forest plot | 8 | 13073 | Risk Ratio (Random, 95% CI) | 0.85 [0.81, 0.90] |
| 5.1 At 18 months | 6 | 7532 | Risk Ratio (Random, 95% CI) | 0.85 [0.78, 0.92] |
| 5.2 At 24 months | 3 | 5541 | Risk Ratio (Random, 95% CI) | 0.87 [0.79, 0.95] |
| 6 Severe underweight: at 18 months Show forest plot | 2 | 1729 | Risk Ratio (Random, 95% CI) | 0.78 [0.54, 1.13] |
| 7 Anaemia Show forest plot | 5 | 2332 | Risk Ratio (M‐H, Random, 95% CI) | 0.79 [0.69, 0.90] |
| 7.1 At 12 months | 2 | 1176 | Risk Ratio (M‐H, Random, 95% CI) | 0.55 [0.20, 1.47] |
| 7.2 At 18 months | 3 | 1156 | Risk Ratio (M‐H, Random, 95% CI) | 0.80 [0.71, 0.91] |
| 7.3 At 36 months | 0 | 0 | Risk Ratio (M‐H, Random, 95% CI) | 0.0 [0.0, 0.0] |
| 8 Adverse effects: At 18 months Show forest plot | 3 | 3382 | Risk Ratio (Random, 95% CI) | 0.86 [0.74, 1.01] |
| 9 Mid‐upper arm circumference (MUAC) Show forest plot | 6 | 8187 | Std. Mean Difference (Random, 95% CI) | 0.13 [0.05, 0.22] |
| 9.1 At 12 months | 1 | 1193 | Std. Mean Difference (Random, 95% CI) | 0.15 [0.06, 0.24] |
| 9.2 At 18 months | 3 | 4355 | Std. Mean Difference (Random, 95% CI) | 0.12 [‐0.11, 0.34] |
| 9.3 At 24 months | 1 | 1601 | Std. Mean Difference (Random, 95% CI) | 0.04 [‐0.04, 0.12] |
| 9.4 At 36 months | 1 | 1038 | Std. Mean Difference (Random, 95% CI) | 0.2 [0.06, 0.34] |
| 10 Serum haemoglobin (g/L) Show forest plot | 4 | 4518 | Mean Difference (IV, Random, 95% CI) | 5.78 [2.27, 9.30] |
| 10.1 At 12 months | 1 | 194 | Mean Difference (IV, Random, 95% CI) | 8.5 [4.46, 12.54] |
| 10.2 At 18 months | 2 | 3342 | Mean Difference (IV, Random, 95% CI) | 5.96 [0.08, 11.84] |
| 10.3 At 36 months | 1 | 982 | Mean Difference (IV, Random, 95% CI) | 3.30 [1.42, 5.18] |
| 11 Mortality Show forest plot | 3 | 3321 | Risk Ratio (Random, 95% CI) | 0.93 [0.63, 1.37] |
| 11.1 At 12 months | 1 | 1932 | Risk Ratio (Random, 95% CI) | 0.85 [0.56, 1.30] |
| 11.2 At 18 months | 2 | 1389 | Risk Ratio (Random, 95% CI) | 1.10 [0.42, 2.89] |
| 12 HAZ Show forest plot | 12 | 15795 | Std. Mean Difference (Random, 95% CI) | 0.10 [0.05, 0.15] |
| 12.1 At 12 to 15 months | 3 | 1103 | Std. Mean Difference (Random, 95% CI) | 0.07 [‐0.02, 0.15] |
| 12.2 At 18 months | 6 | 8153 | Std. Mean Difference (Random, 95% CI) | 0.08 [0.00, 0.16] |
| 12.3 At 24 months | 3 | 5501 | Std. Mean Difference (Random, 95% CI) | 0.14 [0.03, 0.25] |
| 12.4 At 36 months | 1 | 1038 | Std. Mean Difference (Random, 95% CI) | 0.27 [0.10, 0.44] |
| 13 WAZ Show forest plot | 10 | 12188 | Std. Mean Difference (Random, 95% CI) | 0.10 [0.04, 0.16] |
| 13.1 At 12 to 15 months | 3 | 1103 | Std. Mean Difference (Random, 95% CI) | 0.09 [‐0.00, 0.19] |
| 13.2 At 18 months | 5 | 5544 | Std. Mean Difference (Random, 95% CI) | 0.05 [‐0.06, 0.17] |
| 13.3 At 24 months | 3 | 5541 | Std. Mean Difference (Random, 95% CI) | 0.13 [0.03, 0.23] |
| 14 WHZ Show forest plot | 10 | 12894 | Std. Mean Difference (Random, 95% CI) | 0.12 [0.02, 0.22] |
| 14.1 At 12 to 15 months | 2 | 809 | Std. Mean Difference (Random, 95% CI) | 0.10 [‐0.02, 0.22] |
| 14.2 At 18 months | 5 | 5544 | Std. Mean Difference (Random, 95% CI) | 0.13 [‐0.05, 0.31] |
| 14.3 At 24 months | 3 | 5503 | Std. Mean Difference (Random, 95% CI) | 0.09 [0.01, 0.17] |
| 14.4 At 36 months | 1 | 1038 | Std. Mean Difference (Random, 95% CI) | 0.04 [‐0.08, 0.16] |
| Outcome or subgroup title | No. of studies | No. of participants | Statistical method | Effect size |
| 1 Moderate stunting Show forest plot | 3 | 2828 | Risk Ratio (Random, 95% CI) | 0.89 [0.82, 0.97] |
| 2 Severe stunting Show forest plot | 2 | 729 | Risk Ratio (Random, 95% CI) | 0.41 [0.12, 1.42] |
| 3 Moderate wasting Show forest plot | 2 | 2290 | Risk Ratio (Random, 95% CI) | 0.79 [0.65, 0.97] |
| 4 Severe wasting Show forest plot | 2 | 735 | Risk Ratio (Random, 95% CI) | 0.64 [0.19, 2.18] |
| 5 Moderate underweight Show forest plot | 2 | 2280 | Risk Ratio (Random, 95% CI) | 0.81 [0.73, 0.91] |
| 6 Severe underweight Show forest plot | 1 | Risk Ratio (Random, 95% CI) | Totals not selected | |
| 7 MUAC Show forest plot | 2 | 1512 | Std. Mean Difference (IV, Random, 95% CI) | 0.02 [‐0.08, 0.12] |
| 8 Haemoglobin (g/L) Show forest plot | 1 | 182 | Mean Difference (IV, Random, 95% CI) | 0.29 [‐6.00, 6.59] |
| 9 HAZ Show forest plot | 4 | 4047 | Std. Mean Difference (IV, Random, 95% CI) | 0.06 [0.00, 0.13] |
| 10 WAZ Show forest plot | 3 | 1933 | Mean Difference (IV, Random, 95% CI) | 0.05 [‐0.04, 0.14] |
| 11 WHZ Show forest plot | 3 | 1933 | Std. Mean Difference (IV, Random, 95% CI) | 0.07 [‐0.02, 0.16] |
| Outcome or subgroup title | No. of studies | No. of participants | Statistical method | Effect size |
| 1 Moderate stunting Show forest plot | 3 | 2365 | Risk Ratio (Random, 95% CI) | 0.92 [0.82, 1.02] |
| 2 Moderate wasting Show forest plot | 2 | 2004 | Risk Ratio (Random, 95% CI) | 0.97 [0.77, 1.23] |
| 3 Moderate underweight Show forest plot | 2 | 2004 | Risk Ratio (Random, 95% CI) | 0.88 [0.78, 0.99] |
| 4 Anaemia Show forest plot | 2 | 557 | Risk Ratio (Random, 95% CI) | 0.38 [0.21, 0.68] |
| 5 Anaemia: Sensitivity analysis Show forest plot | 1 | Risk Ratio (Random, 95% CI) | 0.56 [0.27, 1.14] | |
| 6 Serum haemoglobin (g/L) Show forest plot | 2 | 557 | Mean Difference (Random, 95% CI) | 5.13 [2.00, 8.26] |
| 7 Serum haemoglobin (g/L): Sensitivity analysis Show forest plot | 1 | Mean Difference (Random, 95% CI) | 3.6 [‐0.13, 7.33] | |
| 8 HAZ Show forest plot | 3 | 2362 | Std. Mean Difference (IV, Random, 95% CI) | 0.10 [‐0.08, 0.27] |
| 9 HAZ: Sensitivity analysis Show forest plot | 2 | 2001 | Std. Mean Difference (IV, Random, 95% CI) | 0.16 [0.03, 0.28] |
| 10 WAZ Show forest plot | 3 | 2362 | Std. Mean Difference (IV, Random, 95% CI) | 0.12 [0.02, 0.21] |
| 11 WAZ: Sensitivity analysis Show forest plot | 2 | 2001 | Std. Mean Difference (IV, Random, 95% CI) | 0.14 [0.05, 0.23] |
| 12 WHZ Show forest plot | 3 | 2362 | Std. Mean Difference (IV, Random, 95% CI) | 0.05 [‐0.06, 0.17] |
| 13 WHZ: Sensitivity analysis Show forest plot | 2 | 2001 | Std. Mean Difference (IV, Random, 95% CI) | 0.10 [0.01, 0.18] |