Preventive lipid‐based nutrient supplements given with complementary foods to infants and young children 6 to 23 months of age for health, nutrition, and developmental outcomes
Información
- DOI:
- https://doi.org/10.1002/14651858.CD012611.pub3Copiar DOI

- Base de datos:
-
- Cochrane Database of Systematic Reviews
- Versión publicada:
-
- 02 mayo 2019see what's new
- Tipo:
-
- Intervention
- Etapa:
-
- Review
- Grupo Editorial Cochrane:
-
Grupo Cochrane de Problemas de desarrollo, psicosociales y de aprendizaje
- Copyright:
-
- Copyright © 2019 The Cochrane Collaboration. Published by John Wiley & Sons, Ltd.
Cifras del artículo
Altmetric:
Citado por:
Autores
Contributions of authors
All review authors contributed to the development of the review.
Rehana A Salam (RAS), Yousaf Bashir, Sana Sadiq Sheikh and Afsah Zulfiqar Bhutta selected which studies to include, obtained copies of the studies and extracted data from the studies.
Jai K Das (JKD) and RAS entered data into RevMan, carried out the analysis and interpreted the results.
JKD, RAS, Zita Weise Prinzo and Zulfiqar A Bhutta (ZAB) drafted the final review.
As the contact author, ZAB has overall responsibility for the review.
Sources of support
Internal sources
-
Evidence and Programme Guidance, Department of Nutrition for Health and Development, World Health Organization (WHO), Switzerland.
Zita Weise Prinzo is a full‐time member of staff at the WHO
-
Aga Khan University, Karachi, Pakistan.
Jai K Das, Rehana A Salam, Sana Sadiq Sheikh and Zulfiqar A Bhutta are full‐time employees of Aga Khan University, Karachi
External sources
-
The Bill & Melinda Gates Foundation, USA.
WHO thanks the Bill & Melinda Gates Foundation for supporting the preparation of systematic reviews of the evidence of the effects and harms of nutrition and nutrition‐sensitive interventions.
-
Evidence and Programme Guidance, Department of Nutrition for Health and Development, WHO, Switzerland.
WHO provided financial support for this work.
-
Nutrition International, Canada.
WHO thank Nutrition International for supporting the Evidence and Programme Guidance Unit, Department of Nutrition for Health and Development, for the preparation of systematic reviews of the evidence of the effects and harms of nutrition and nutrition‐sensitive interventions.
Declarations of interest
We certify that we have no affiliations with, or involvement in, any organisation or entity with a direct financial interest in the subject matter of the review (e.g. employment, consultancy, stock ownership, honoraria, expert testimony).
Jai K Das ‐ none known.
Rehana A Salam ‐ none known.
Yousaf Bashir Hadi ‐ none known.
Sana Sadiq Sheikh ‐ none known.
Afsah Zulfiqar Bhutta ‐ none known.
Zita Weise Prinzo is a full‐time member of staff of the WHO.
Zulfiqar A Bhutta's institution was awarded a grant from the WHO to undertake this review.
The review authors alone are responsible for the views expressed in this publication; the views do not necessarily represent the official position, decisions, policy or views of the WHO.
Acknowledgements
We are grateful to the Cochrane Developmental, Psychosocial and Learning Problems editorial team for their support in the preparation of this review. We are also thankful to the four peers (a content editor, a statistical editor, and two reviewers who are external to the editorial team) who commented on the review.
The review was partially developed during the World Health Organization/Cochrane/Cornell University Summer Institute for Systematic Reviews in Nutrition Global Policy Making, hosted at the Division of Nutritional Sciences, Cornell University, Ithaca, USA, from 25 July to 5 August 2016.
We would like to acknowledge Nida Ashraf for assisting with the preliminary data extraction and analysis.
We acknowledge Kathryn Dewey (KD) who reviewed the draft meticulously and provided critical input, especially on the technical aspects of the intervention and methodological aspects of the studies of which she was Principal Investigator. KD had no role in finalising the findings and conclusions of the review.
Version history
| Published | Title | Stage | Authors | Version |
| 2019 May 02 | Preventive lipid‐based nutrient supplements given with complementary foods to infants and young children 6 to 23 months of age for health, nutrition, and developmental outcomes | Review | Jai K Das, Rehana A Salam, Yousaf Bashir Hadi, Sana Sadiq Sheikh, Afsah Z Bhutta, Zita Weise Prinzo, Zulfiqar A Bhutta | |
| 2019 Mar 29 | Provision of preventive lipid‐based nutrient supplements given with complementary foods to infants and young children 6 to 23 months of age for health, nutrition, and developmental outcomes | Protocol | Jai K Das, Rehana A Salam, Zita Weise Prinzo, Sana Sadiq Sheikh, Zulfiqar A Bhutta | |
| 2017 Mar 29 | Provision of preventive lipid‐based nutrient supplements given with complementary foods to infants and young children 6 to 23 months of age for health, nutrition, and developmental outcomes | Protocol | Jai K Das, Rehana A Salam, Zita Weise Prinzo, Sana Sadiq Sheikh, Zulfiqar A Bhutta | |
Differences between protocol and review
Subgroup analysis and investigation of heterogeneity
In our protocol (Das 2017), we had planned to conduct an analysis by 'duration of intervention' according to the following subgroups: 'less than three months versus three to six months versus six months or more'. However, in the review, we changed these subgroups to 'up to 6 months versus 6‐12 months versus more than 12 months', according to the findings of the included studies and to be more clinically relevant.
We had also planned to conduct an analysis by 'age at follow‐up' according to '6 to 11 months versus 12 to 23 months versus other' (Das 2017), but changed these in the review to the following subgroups: 'at 12 months versus at 18 months versus at 24 months versus at 36 months'. Again, this was done according to the findings of the included studies identified at the review stage, and to be more clinically relevant.
We could not conduct the following, preplanned subgroup analyses (Das 2017), since the included studies did not report this information.
-
Breastfeeding practices (breastfed versus not breastfed)
-
Frequency of intervention (daily versus weekly versus flexible)
-
Living in an emergency‐affected country (Wisner 2002) or in a refugee or internally displaced persons' camp (yes versus no)
-
Anaemic status of participants at start of intervention (anaemic (defined as haemoglobin values < 110 g/L) versus non anaemic or unknown status)
These exploratory analyses have been archived in Table 1 for use in future updates of this review.
Search methods
We searched the Database of Abstracts of Reviews of Effects (DARE) to find other reviews.
Inclusion criteria: Type of study
In our protocol, we had specified that we would be including randomised controlled trials (RCTs), quasi‐RCTs, controlled before‐and‐after studies (CBAs), and interrupted time series (ITS); however since almost all the included studies in the review were RCTs, we decided to restrict our inclusion to RCTs and quasi‐RCTs only, to strengthen the quality of the evidence.
Keywords
MeSH
Medical Subject Headings (MeSH) Keywords
Medical Subject Headings Check Words
Child, Preschool; Humans; Infant;
PICO

Study flow diagram.

'Risk of bias' graph: review authors' judgements about each risk of bias item presented as percentages across all included studies.
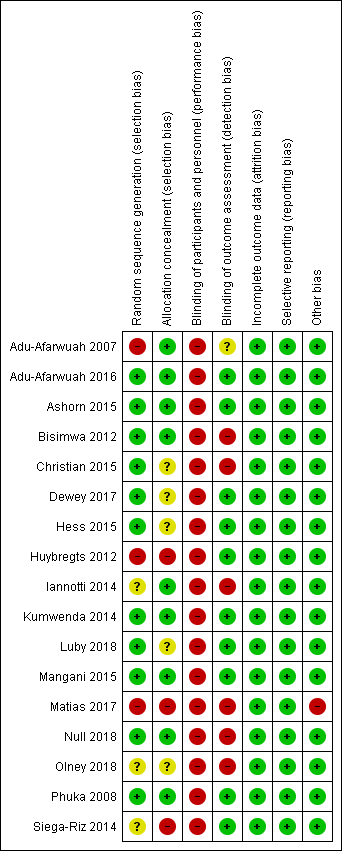
'Risk of bias' summary: review authors' judgements about each risk of bias item for each included study.

Forest plot of comparison: 1 LNS versus no intervention, outcome: 1.1 Moderate stunting.
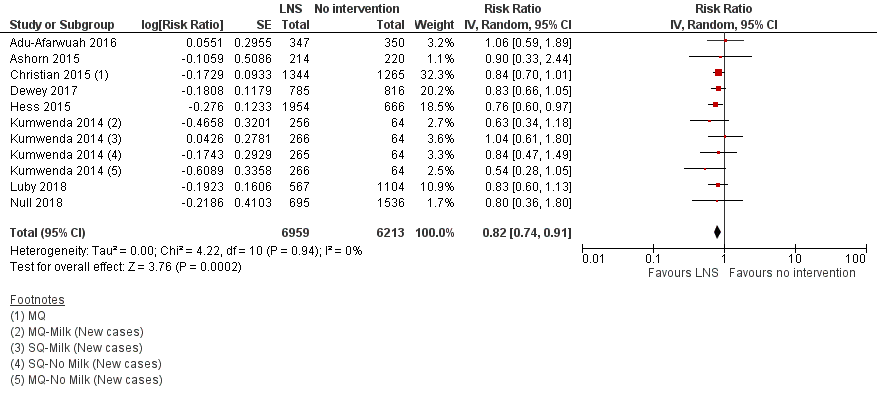
Forest plot of comparison: 1 LNS versus no intervention, outcome: 1.5 Moderate wasting.

Comparison 1 LNS versus no intervention, Outcome 1 Moderate stunting.

Comparison 1 LNS versus no intervention, Outcome 2 Severe stunting.

Comparison 1 LNS versus no intervention, Outcome 3 Moderate stunting: Sensitivity analysis.
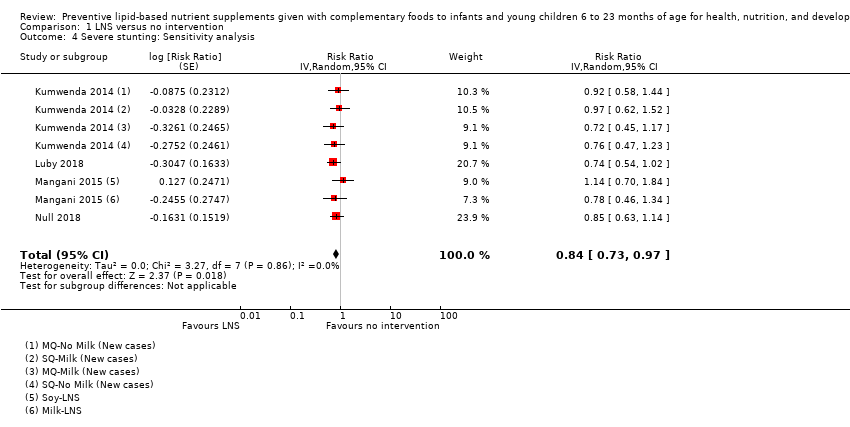
Comparison 1 LNS versus no intervention, Outcome 4 Severe stunting: Sensitivity analysis.

Comparison 1 LNS versus no intervention, Outcome 5 Moderate wasting.
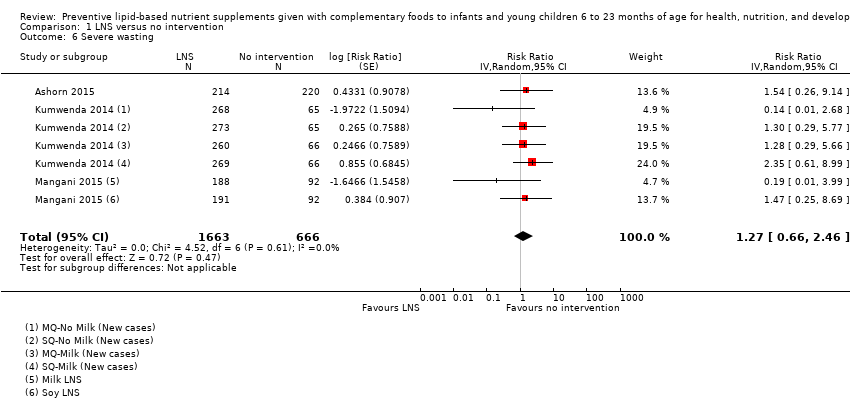
Comparison 1 LNS versus no intervention, Outcome 6 Severe wasting.

Comparison 1 LNS versus no intervention, Outcome 7 Moderate wasting: Sensitivity analysis.

Comparison 1 LNS versus no intervention, Outcome 8 Severe wasting: Sensitivity analysis.

Comparison 1 LNS versus no intervention, Outcome 9 Moderate underweight.
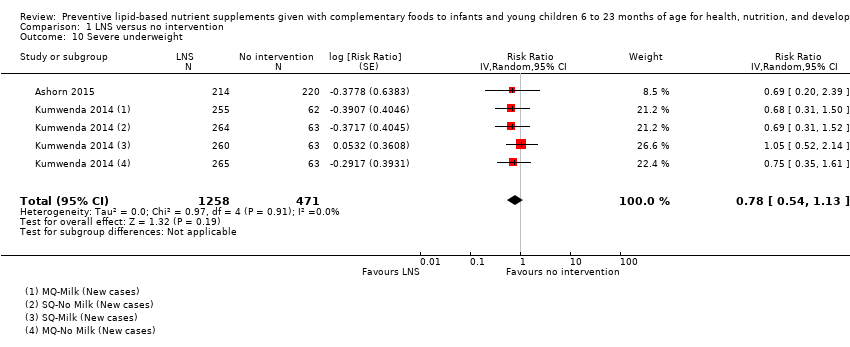
Comparison 1 LNS versus no intervention, Outcome 10 Severe underweight.

Comparison 1 LNS versus no intervention, Outcome 11 Moderate underweight: Sensitivity analysis.
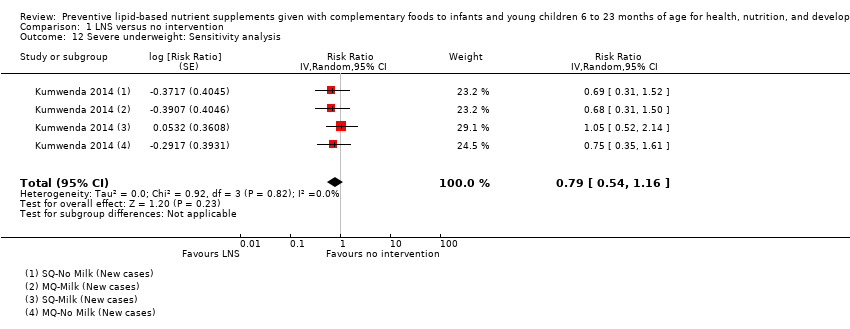
Comparison 1 LNS versus no intervention, Outcome 12 Severe underweight: Sensitivity analysis.

Comparison 1 LNS versus no intervention, Outcome 13 Anaemia.

Comparison 1 LNS versus no intervention, Outcome 14 Adverse effects.
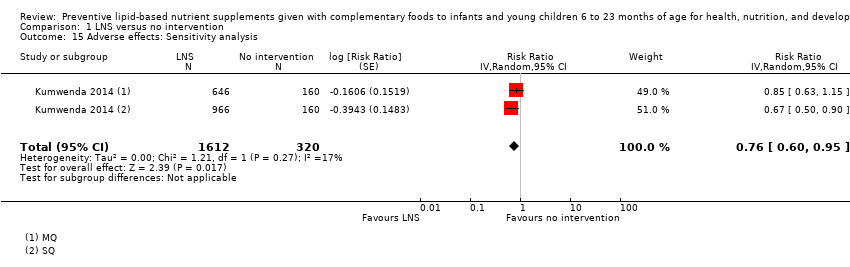
Comparison 1 LNS versus no intervention, Outcome 15 Adverse effects: Sensitivity analysis.
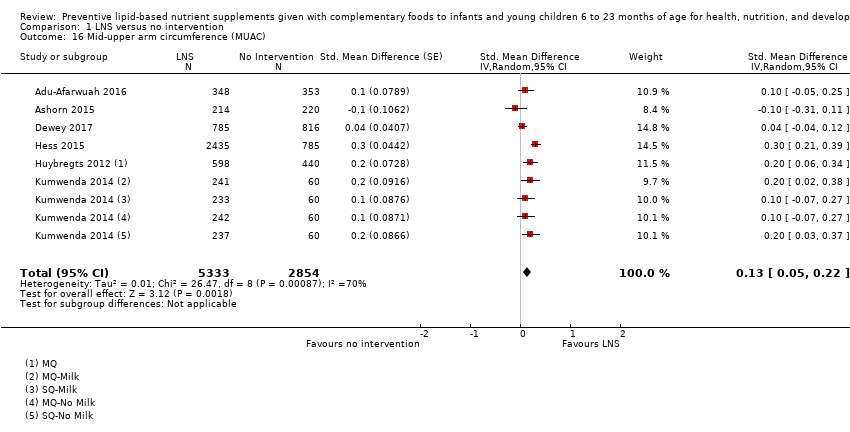
Comparison 1 LNS versus no intervention, Outcome 16 Mid‐upper arm circumference (MUAC).
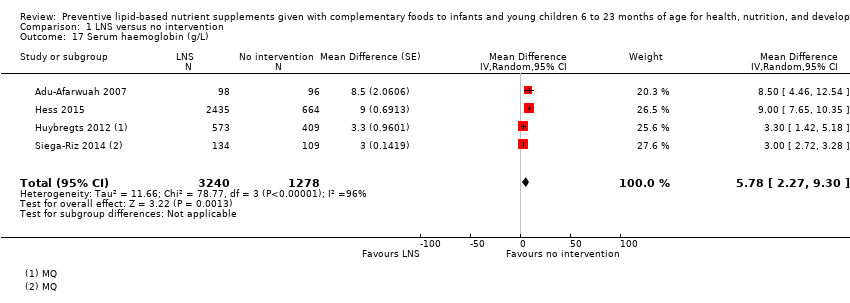
Comparison 1 LNS versus no intervention, Outcome 17 Serum haemoglobin (g/L).
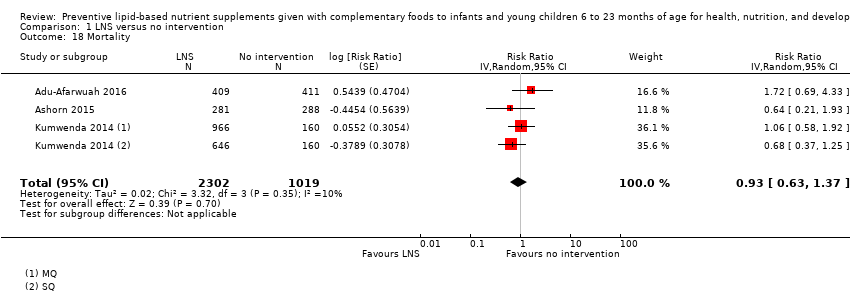
Comparison 1 LNS versus no intervention, Outcome 18 Mortality.

Comparison 1 LNS versus no intervention, Outcome 19 HAZ.

Comparison 1 LNS versus no intervention, Outcome 20 WAZ.

Comparison 1 LNS versus no intervention, Outcome 21 WHZ.

Comparison 2 LNS versus no intervention: Subgroup analysis by energy content/formulation of product provided, Outcome 1 Severe stunting.

Comparison 2 LNS versus no intervention: Subgroup analysis by energy content/formulation of product provided, Outcome 2 Moderate stunting.

Comparison 2 LNS versus no intervention: Subgroup analysis by energy content/formulation of product provided, Outcome 3 Moderate wasting.
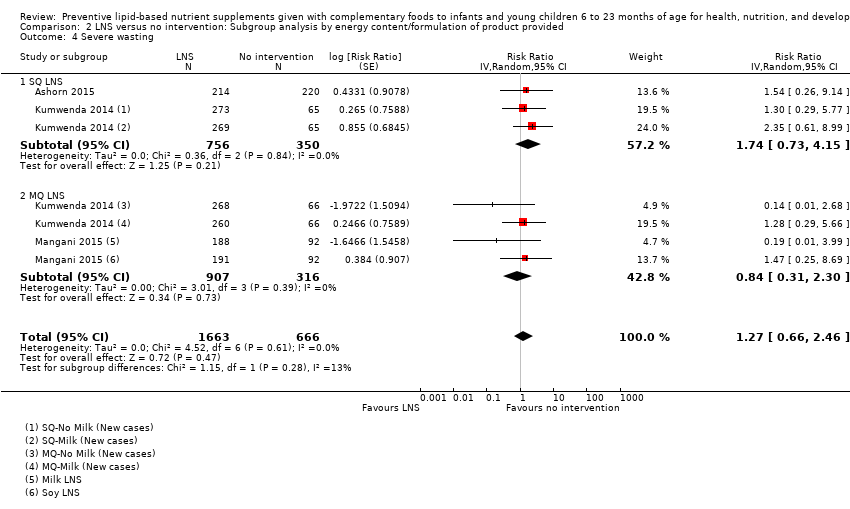
Comparison 2 LNS versus no intervention: Subgroup analysis by energy content/formulation of product provided, Outcome 4 Severe wasting.
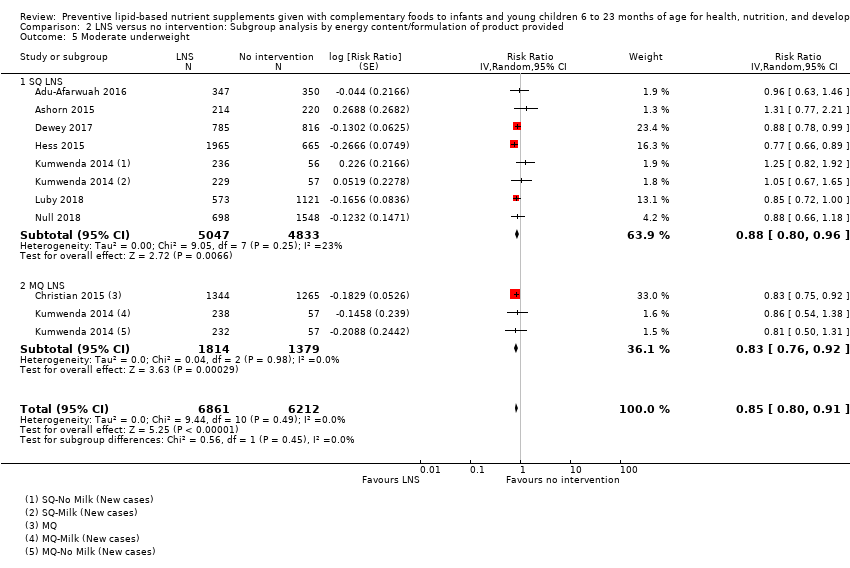
Comparison 2 LNS versus no intervention: Subgroup analysis by energy content/formulation of product provided, Outcome 5 Moderate underweight.

Comparison 2 LNS versus no intervention: Subgroup analysis by energy content/formulation of product provided, Outcome 6 Severe underweight.

Comparison 2 LNS versus no intervention: Subgroup analysis by energy content/formulation of product provided, Outcome 7 Anaemia.

Comparison 2 LNS versus no intervention: Subgroup analysis by energy content/formulation of product provided, Outcome 8 Adverse effects.

Comparison 2 LNS versus no intervention: Subgroup analysis by energy content/formulation of product provided, Outcome 9 Mid‐upper arm circumference (MUAC).

Comparison 2 LNS versus no intervention: Subgroup analysis by energy content/formulation of product provided, Outcome 10 Serum haemoglobin (g/L).

Comparison 2 LNS versus no intervention: Subgroup analysis by energy content/formulation of product provided, Outcome 11 Mortality.

Comparison 2 LNS versus no intervention: Subgroup analysis by energy content/formulation of product provided, Outcome 12 HAZ.

Comparison 2 LNS versus no intervention: Subgroup analysis by energy content/formulation of product provided, Outcome 13 WHZ.

Comparison 2 LNS versus no intervention: Subgroup analysis by energy content/formulation of product provided, Outcome 14 WAZ.
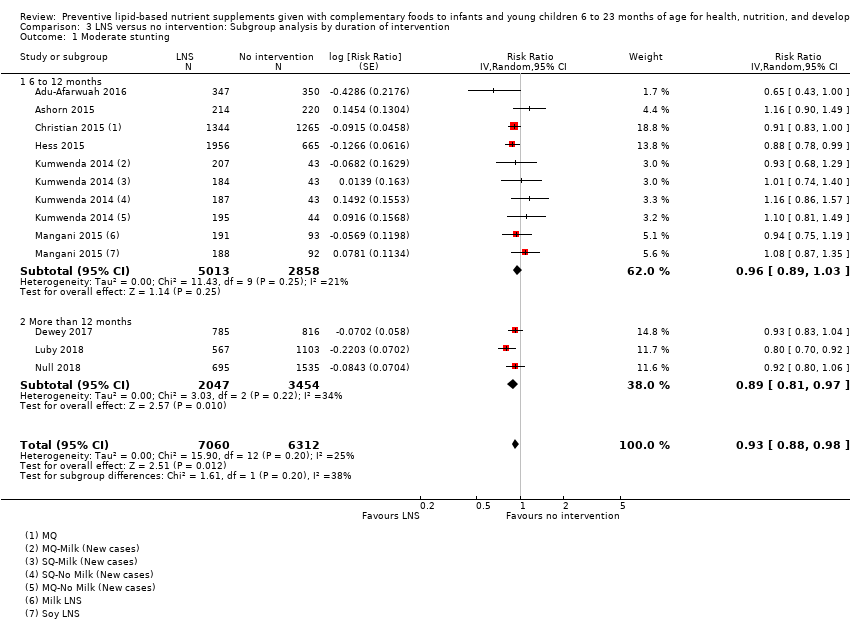
Comparison 3 LNS versus no intervention: Subgroup analysis by duration of intervention, Outcome 1 Moderate stunting.

Comparison 3 LNS versus no intervention: Subgroup analysis by duration of intervention, Outcome 2 Severe stunting.

Comparison 3 LNS versus no intervention: Subgroup analysis by duration of intervention, Outcome 3 Moderate wasting.
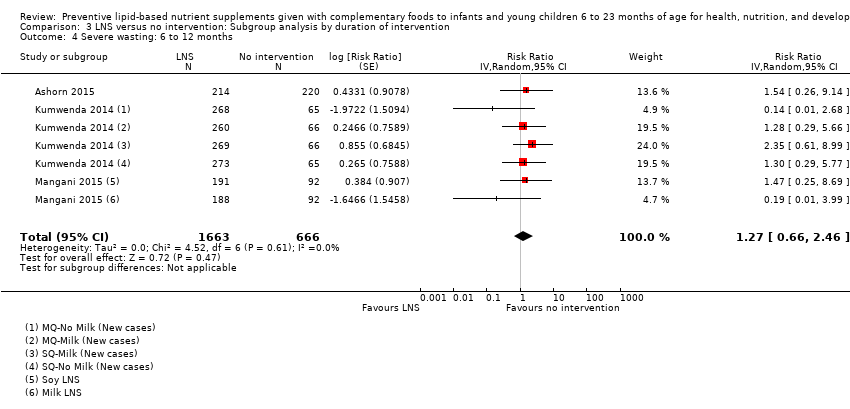
Comparison 3 LNS versus no intervention: Subgroup analysis by duration of intervention, Outcome 4 Severe wasting: 6 to 12 months.

Comparison 3 LNS versus no intervention: Subgroup analysis by duration of intervention, Outcome 5 Moderate underweight.
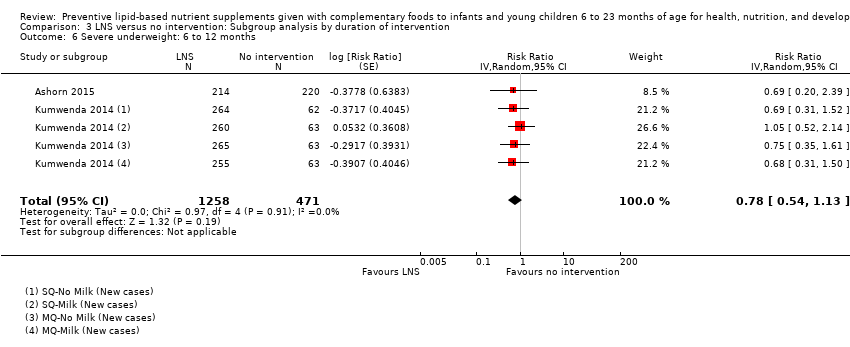
Comparison 3 LNS versus no intervention: Subgroup analysis by duration of intervention, Outcome 6 Severe underweight: 6 to 12 months.
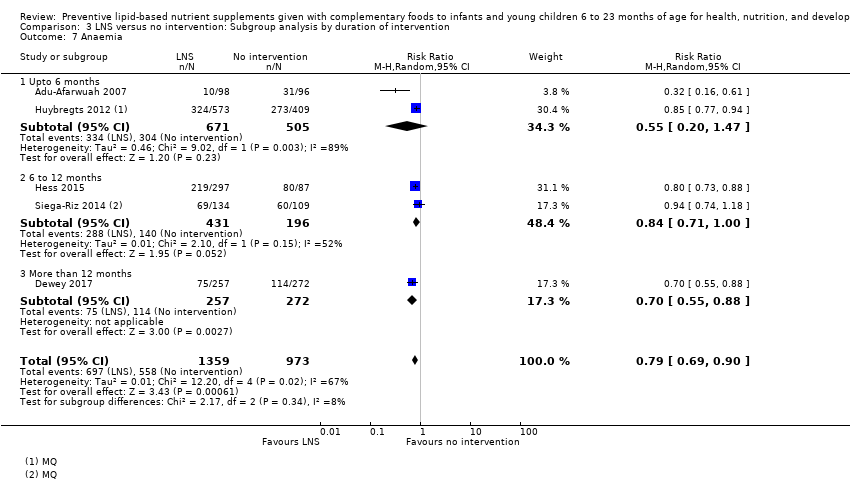
Comparison 3 LNS versus no intervention: Subgroup analysis by duration of intervention, Outcome 7 Anaemia.
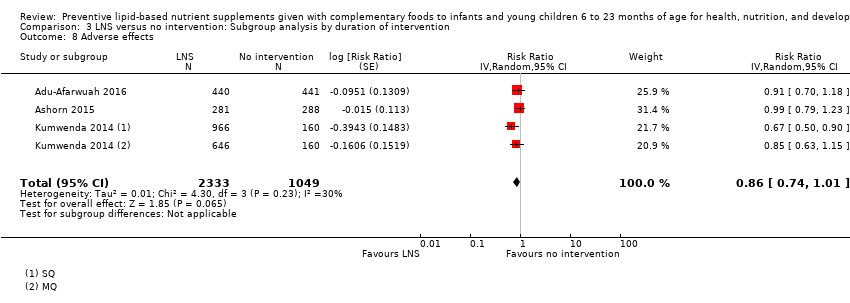
Comparison 3 LNS versus no intervention: Subgroup analysis by duration of intervention, Outcome 8 Adverse effects.
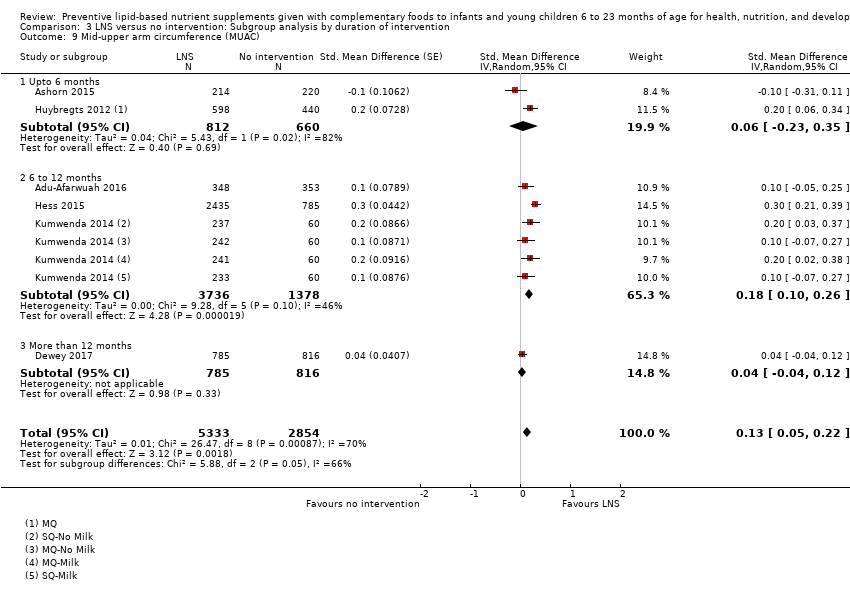
Comparison 3 LNS versus no intervention: Subgroup analysis by duration of intervention, Outcome 9 Mid‐upper arm circumference (MUAC).

Comparison 3 LNS versus no intervention: Subgroup analysis by duration of intervention, Outcome 10 Serum haemoglobin (g/L).
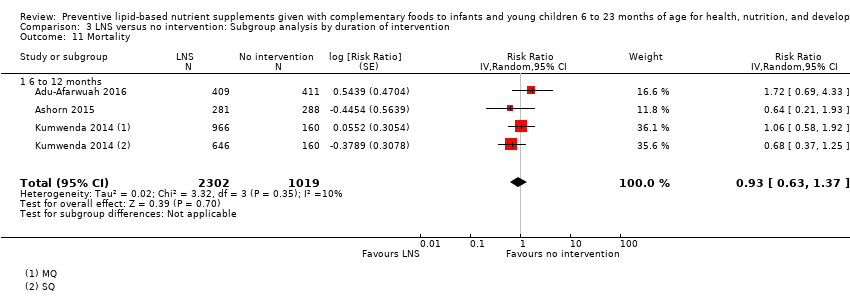
Comparison 3 LNS versus no intervention: Subgroup analysis by duration of intervention, Outcome 11 Mortality.

Comparison 3 LNS versus no intervention: Subgroup analysis by duration of intervention, Outcome 12 HAZ.
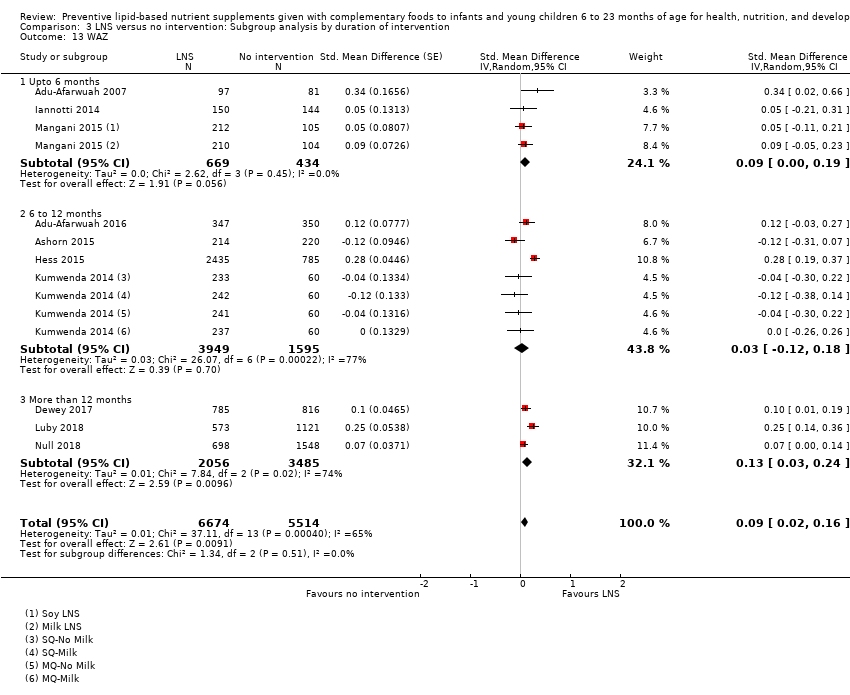
Comparison 3 LNS versus no intervention: Subgroup analysis by duration of intervention, Outcome 13 WAZ.
Comparison 3 LNS versus no intervention: Subgroup analysis by duration of intervention, Outcome 14 WHZ.
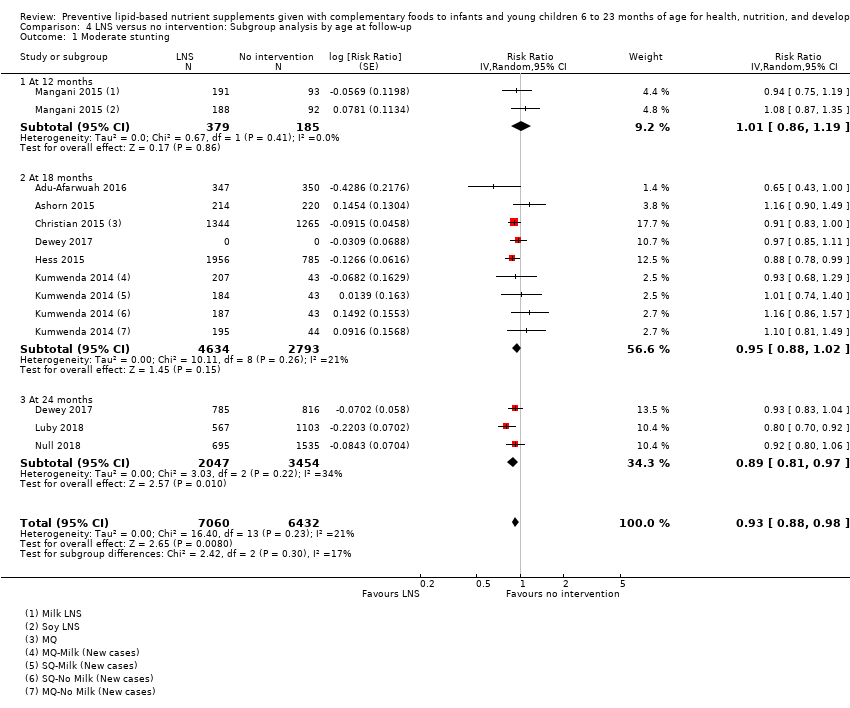
Comparison 4 LNS versus no intervention: Subgroup analysis by age at follow‐up, Outcome 1 Moderate stunting.

Comparison 4 LNS versus no intervention: Subgroup analysis by age at follow‐up, Outcome 2 Severe stunting.

Comparison 4 LNS versus no intervention: Subgroup analysis by age at follow‐up, Outcome 3 Moderate wasting.
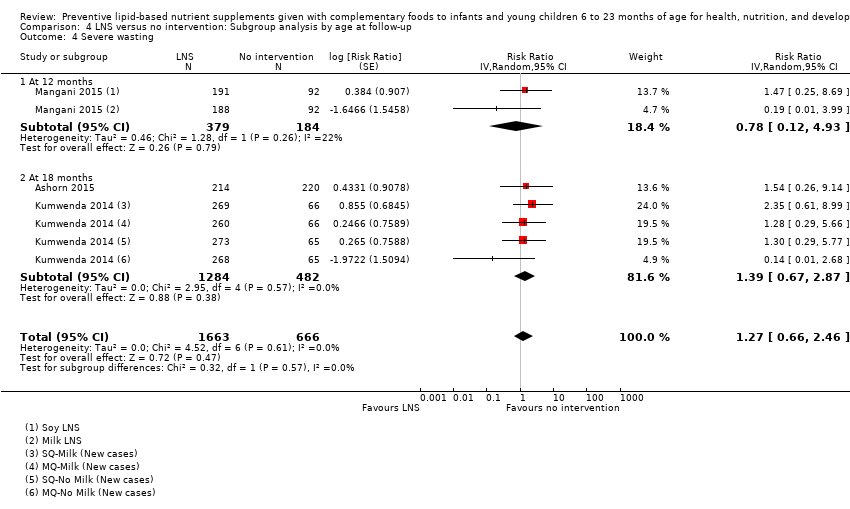
Comparison 4 LNS versus no intervention: Subgroup analysis by age at follow‐up, Outcome 4 Severe wasting.

Comparison 4 LNS versus no intervention: Subgroup analysis by age at follow‐up, Outcome 5 Moderate underweight.
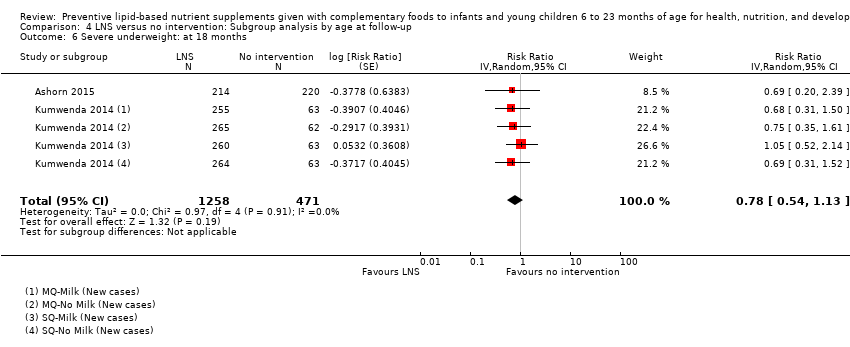
Comparison 4 LNS versus no intervention: Subgroup analysis by age at follow‐up, Outcome 6 Severe underweight: at 18 months.

Comparison 4 LNS versus no intervention: Subgroup analysis by age at follow‐up, Outcome 7 Anaemia.
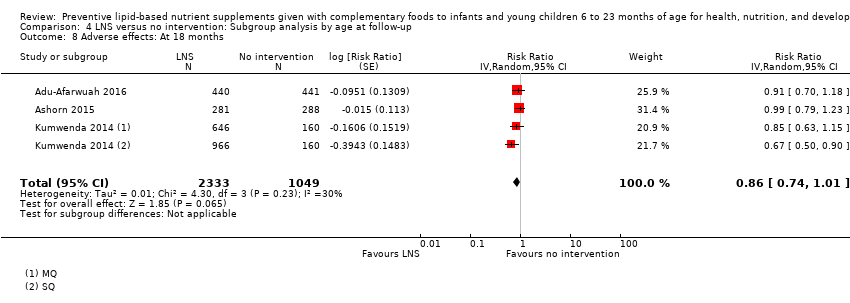
Comparison 4 LNS versus no intervention: Subgroup analysis by age at follow‐up, Outcome 8 Adverse effects: At 18 months.

Comparison 4 LNS versus no intervention: Subgroup analysis by age at follow‐up, Outcome 9 Mid‐upper arm circumference (MUAC).

Comparison 4 LNS versus no intervention: Subgroup analysis by age at follow‐up, Outcome 10 Serum haemoglobin (g/L).
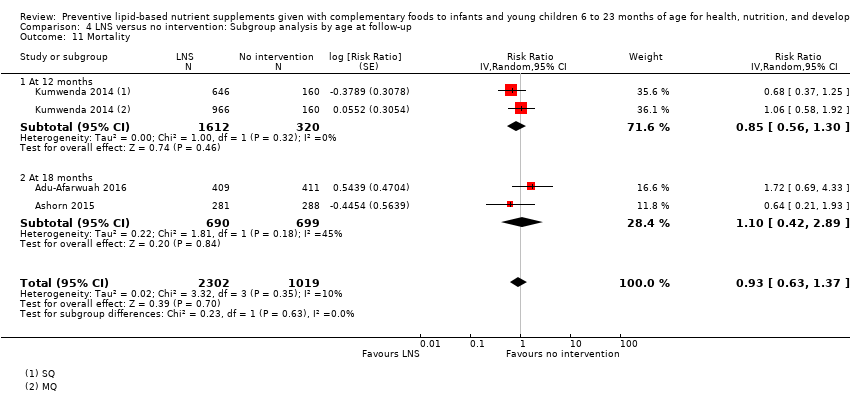
Comparison 4 LNS versus no intervention: Subgroup analysis by age at follow‐up, Outcome 11 Mortality.
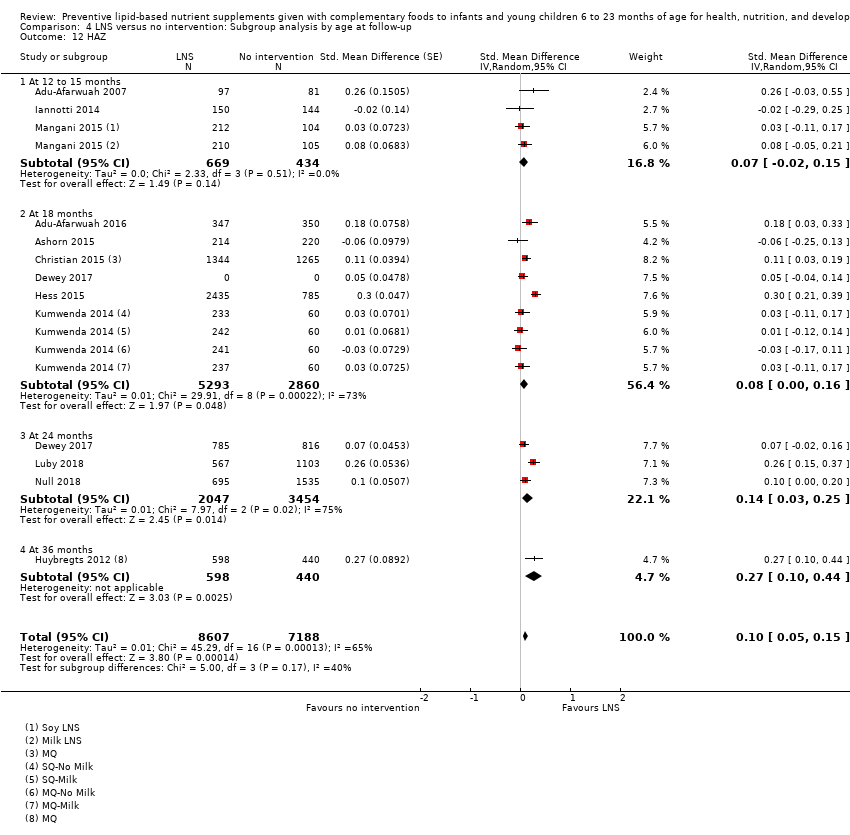
Comparison 4 LNS versus no intervention: Subgroup analysis by age at follow‐up, Outcome 12 HAZ.
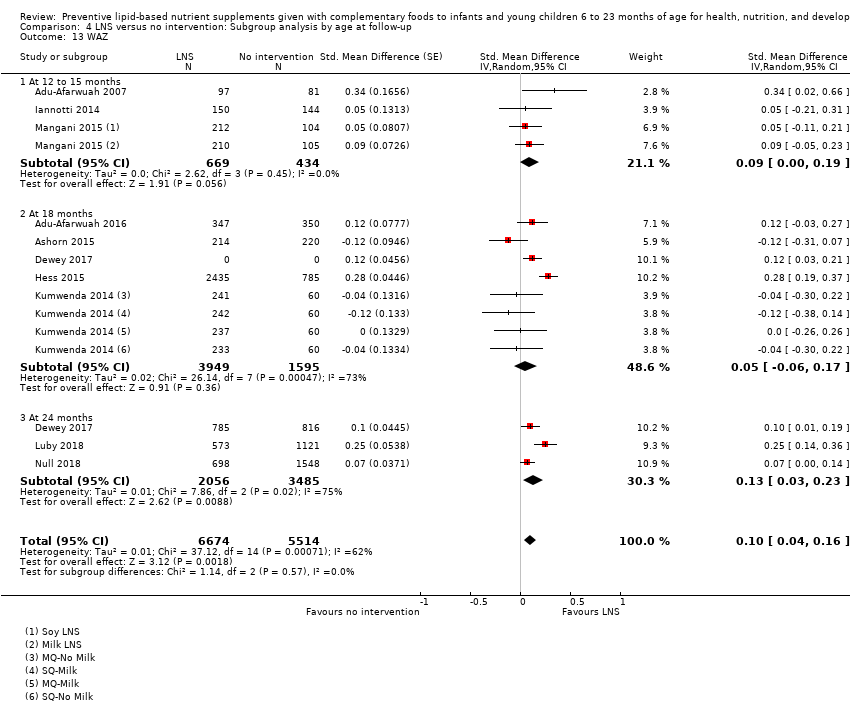
Comparison 4 LNS versus no intervention: Subgroup analysis by age at follow‐up, Outcome 13 WAZ.

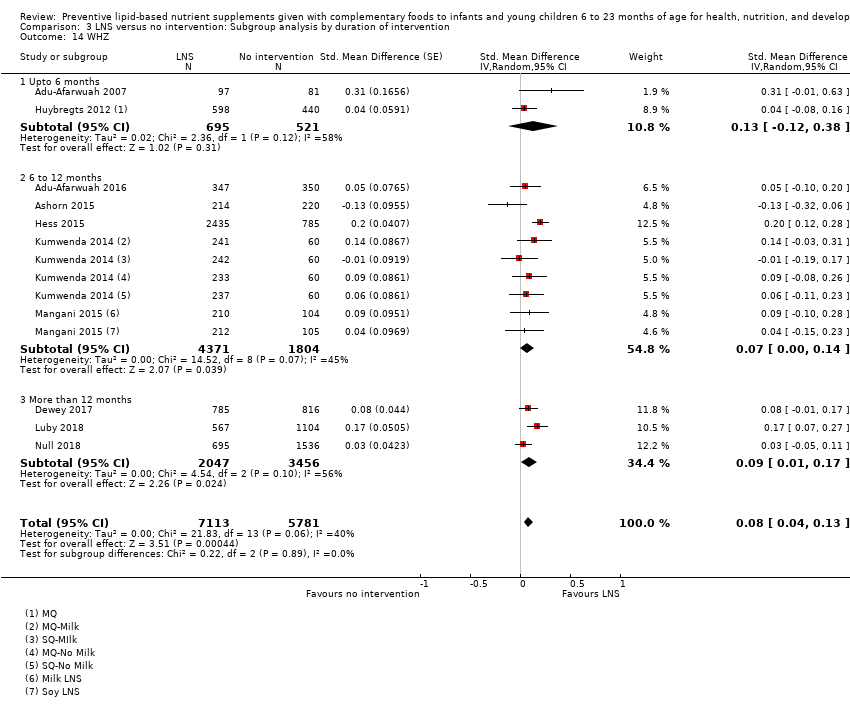
Comparison 4 LNS versus no intervention: Subgroup analysis by age at follow‐up, Outcome 14 WHZ.

Comparison 5 LNS versus fortified blended food (FBF), Outcome 1 Moderate stunting.
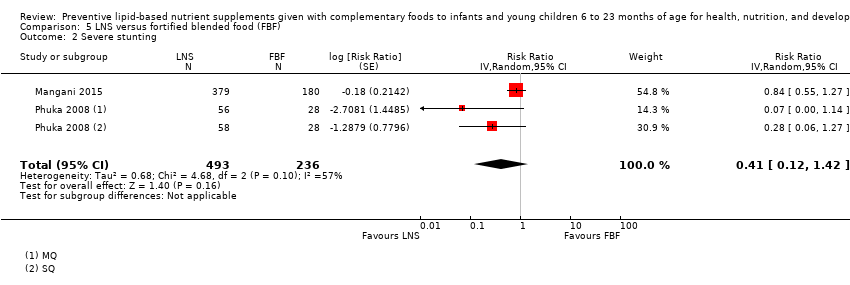
Comparison 5 LNS versus fortified blended food (FBF), Outcome 2 Severe stunting.
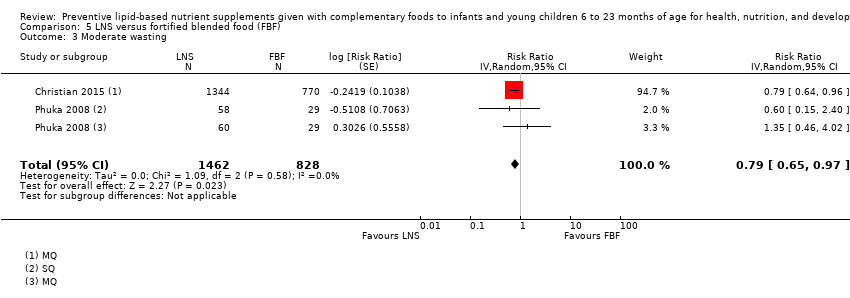
Comparison 5 LNS versus fortified blended food (FBF), Outcome 3 Moderate wasting.

Comparison 5 LNS versus fortified blended food (FBF), Outcome 4 Severe wasting.

Comparison 5 LNS versus fortified blended food (FBF), Outcome 5 Moderate underweight.
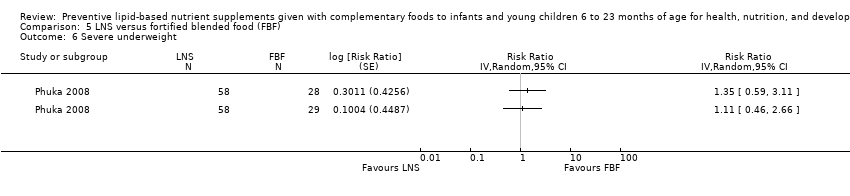
Comparison 5 LNS versus fortified blended food (FBF), Outcome 6 Severe underweight.

Comparison 5 LNS versus fortified blended food (FBF), Outcome 7 MUAC.

Comparison 5 LNS versus fortified blended food (FBF), Outcome 8 Haemoglobin (g/L).

Comparison 5 LNS versus fortified blended food (FBF), Outcome 9 HAZ.

Comparison 5 LNS versus fortified blended food (FBF), Outcome 10 WAZ.

Comparison 5 LNS versus fortified blended food (FBF), Outcome 11 WHZ.

Comparison 6 LNS versus micronutrient powders (MNP), Outcome 1 Moderate stunting.
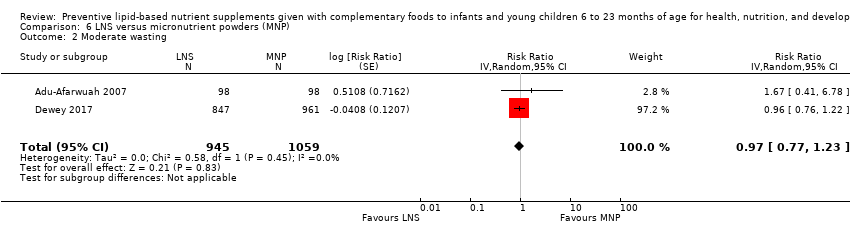
Comparison 6 LNS versus micronutrient powders (MNP), Outcome 2 Moderate wasting.

Comparison 6 LNS versus micronutrient powders (MNP), Outcome 3 Moderate underweight.

Comparison 6 LNS versus micronutrient powders (MNP), Outcome 4 Anaemia.
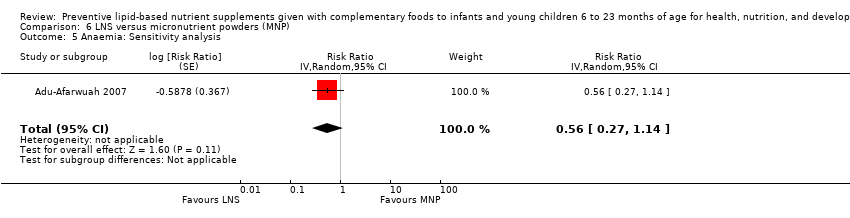
Comparison 6 LNS versus micronutrient powders (MNP), Outcome 5 Anaemia: Sensitivity analysis.

Comparison 6 LNS versus micronutrient powders (MNP), Outcome 6 Serum haemoglobin (g/L).

Comparison 6 LNS versus micronutrient powders (MNP), Outcome 7 Serum haemoglobin (g/L): Sensitivity analysis.
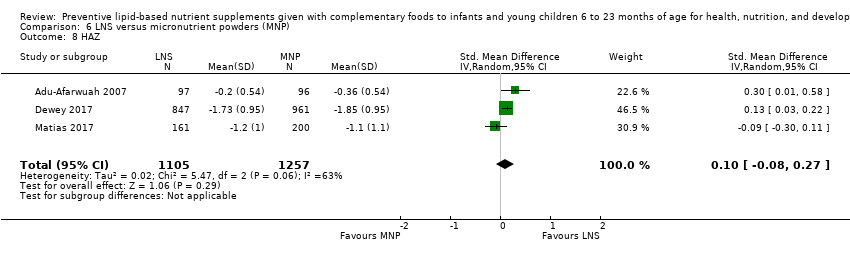
Comparison 6 LNS versus micronutrient powders (MNP), Outcome 8 HAZ.

Comparison 6 LNS versus micronutrient powders (MNP), Outcome 9 HAZ: Sensitivity analysis.

Comparison 6 LNS versus micronutrient powders (MNP), Outcome 10 WAZ.

Comparison 6 LNS versus micronutrient powders (MNP), Outcome 11 WAZ: Sensitivity analysis.

Comparison 6 LNS versus micronutrient powders (MNP), Outcome 12 WHZ.

Comparison 6 LNS versus micronutrient powders (MNP), Outcome 13 WHZ: Sensitivity analysis.
| LNS plus complementary feeding compared with no intervention | ||||||
| Patient or population: children aged 6 to 23 months Settings: community Intervention: LNS plus complementary feeding Comparison: no intervention | ||||||
| Outcomes | Illustrative comparative risks* (95% CI) | Relative effect | Number of participants | Quality of the evidence | Comments | |
| Assumed risk | Corresponding risk | |||||
| No intervention | LNS plus complementary feeding | |||||
| Stunting | ||||||
| Moderate stunting Measured as height‐for‐age z score < −2 SD Measured at 12, 18 and 24 months of age | 2618/7137 | 2353/7060 | RR 0.93 (0.88 to 0.98) | 13,372 | ⊕⊕⊕⊝ | 2 studies, Kumwenda 2014 and Mangani 2015, contributed data to multiple comparisons; total number of comparisons = 13 |
| Severe stunting Measured as height‐for‐age z score < −3 SD Measured at 12, 18 and 24 months of age | 471/4188 | 290/2868 | RR 0.85 (0.74 to 0.98) | 6151 (5 studies) | ⊕⊕⊕⊝ | 2 studies, Kumwenda 2014 and Mangani 2015, contributed data to multiple comparisons; total number of comparisons = 9 |
| Wasting | ||||||
| Moderate wasting Measured as weight‐for‐height z score < −2 SD Measured at 12, 18 and 24 months of age | 695/6213 | 624/6959 | RR 0.82 (0.74 to 0.91) | 13,172 (8 studies) | ⊕⊕⊕⊝ | 1 study, Kumwenda 2014, contributed data to 2 comparisons; total number of comparisons = 11 |
| Severe wasting Measured as weight‐for‐height z score < −3 SD Measured at 12 and 18 months of age | 18/1636 | 21/1663 | RR 1.27 (0.66 to 2.46) | 2329 (3 studies) | ⊕⊕⊕⊕ | 1 study, Kumwenda 2014, contributed data to 4 comparisons; total number of comparisons = 6 |
| Underweight | ||||||
| Moderate underweight Measured as weight‐for‐age z score < −2 SD Measured at 12, 18 and 24 months of age | 1723/7013 | 1525/6861 | RR 0.85 (0.80 to 0.91) | 13,073 (8 studies) | ⊕⊕⊕⊝ | 1 study, Kumwenda 2014, contributed data to 4 comparisons; total number of comparisons = 11 |
| Severe underweight Measured as weight‐for‐age z score < −3 SD Measured at 12 and 18 months of age | 62/1224 | 50/1258 | RR 0.78 (0.54 to 1.13) | 1729 (2 studies) | ⊕⊕⊕⊕ | 1 study, Kumwenda 2014, contributed data to 4 comparisons; total number of comparisons = 5 |
| Anaemia Measured as haemoglobin < 10 g/dL Measured at 12, 18 and 24 months of age | 697/1359 | 558/973 | RR 0.79 (0.69 to 0.90) | 2332 (5 studies) | ⊕⊕⊝⊝ | ‐ |
| Adverse effects Defined as deaths, hospitalisations, congenital abnormalities and life‐threatening conditions requiring an immediate hospital visit Assessed at 12 and 18 months of age | 314/1369 | 401/2333 | RR 0.86 (0.74 to 1.01) | 3382 (3 studies) | ⊕⊕⊕⊝ | 1 study, Kumwenda 2014, contributed data to 2 comparisons; total number of comparisons = 4 |
| *The basis for the assumed risk (e.g. the median control group risk across studies) is provided in footnotes. The corresponding risk (and its 95% CI) is based on the assumed risk in the comparison group and the relative effect of the intervention (and its 95% CI). CI: confidence interval; LNS: lipid‐based nutrient supplement; RR: risk ratio; SD: standard deviation | ||||||
| GRADE Working Group grades of evidence | ||||||
| aDowngraded one level due to study limitations: high risk of selection bias (inadequate sequence generation process) in one study (Adu‐Afarwuah 2007); high risk of performance bias in seven studies (Adu‐Afarwuah 2016; Ashorn 2015; Christian 2015; Dewey 2017; Hess 2015; Luby 2018; Null 2018); and high risk of detection bias in one study (Christian 2015). | ||||||
| LNS plus complementary feeding compared with fortified blended food (FBF) | ||||||
| Patient or population: children aged 6 to 23 months Settings: community Intervention: LNS plus complementary feeding Comparison: FBF | ||||||
| Outcomes | Illustrative comparative risks* (95% CI) | Relative effect | Number of participants | Quality of the evidence | Comments | |
| Assumed risk | Corresponding risk | |||||
| FBF | LNS plus complementary feeding | |||||
| Stunting | ||||||
| Moderate stunting Measured as height‐for‐age z score < −2 SD Measured at 12 months and 18 months of age | 461/1048 | 735/1829 | RR 0.89 (0.82 to 0.97) | 2828 | ⊕⊕⊕⊝ | 1 study, Phuka 2008, contributed data to 2 comparisons; total number of comparisons = 4 |
| Severe stunting Measured as height‐for‐age z score < −3 SD Measured at 12 months and 18 months of age | 43/292 | 53/493 | RR 0.41 (0.12 to 1.42) | 729 (2 studies) | ⊕⊕⊕⊝ | 1 study, Phuka 2008, contributed data to 2 comparisons; total number of comparisons = 3 |
| Wasting | ||||||
| Moderate wasting Measured as weight‐for‐height z score < −2 SD Measured at 12 months and 18 months of age | 145/886 | 195/1462 | RR 0.79 (0.65 to 0.97) | 2290 (2 studies) | ⊕⊕⊕⊝ | 1 study, Phuka 2008, contributed data to 2 comparisons; total number of comparisons = 3 |
| Severe wasting Measured as weight‐for‐height z score < −3 SD Measured at 12 months and 18 months of age | 5/296 | 5/497 | RR 0.64 (0.19 to 2.18) | 735 (2 studies) | ⊕⊕⊕⊝ | 1 study, Phuka 2008, contributed data to 2 comparisons; total number of comparisons = 3 |
| Underweight | ||||||
| Moderate underweight Measured as weight‐for‐age z score < −2 SD Measured at 12 months and 18 months of age | 355/876 | 478/1457 | RR 0.81 (0.73 to 0.91) | 2280 (2 studies) | ⊕⊕⊕⊝ | 1 study, Phuka 2008, contributed data to 2 comparisons; total number of comparisons = 3 |
| Severe underweight Measured as weight‐for‐age z score < −3 SD Measured at 12 months of age | 34/722 | 60/1505 | RR 1.23 (0.67 to 2.25) | 173 (1 study) | ⊕⊕⊝⊝ | 1 study, Phuka 2008, contributed data to 2 arms to this analysis; total number of comparisons = 2 |
| Anaemia | None of the included studies reported this outcome | |||||
| Adverse effects | None of the included studies reported this outcome | |||||
| *The basis for the assumed risk (e.g. the median control group risk across studies) is provided in footnotes. The corresponding risk (and its 95% CI) is based on the assumed risk in the comparison group and the relative effect of the intervention (and its 95% CI). CI: Confidence interval; LNS: lipid‐based nutrient supplements; RR: Risk Ratio; SD: Standard deviation. | ||||||
| GRADE Working Group grades of evidence | ||||||
| aDowngraded one level due to study limitations: high risk of performance bias in two studies (Christian 2015; Phuka 2008). | ||||||
| LNS plus complementary feeding compared with micronutrient powders (MNP) | ||||||
| Patient or population: children aged 6 to 23 months Settings: community Intervention: LNS plus complementary feeding Comparison: MNP | ||||||
| Outcomes | Illustrative comparative risks* (95% CI) | Relative effect | Number of participants | Quality of the evidence | Comments | |
| Assumed risk | Corresponding risk | |||||
| MNP | LNS plus complementary feeding | |||||
| Moderate stunting Measured as height‐for‐age z score < −2 SD Measured at 12 months and 24 months of age | 421/1059 | 336/945 | RR 0.92 (0.82 to 1.02) | 2365 | ⊕⊕⊕⊝ | ‐ |
| Moderate wasting Measured as weight‐for‐height z score < −2 SD Measured at 12 months and 24 months of age | 133/1059 | 115/945 | RR 0.97 (0.77 to 1.23) | 2004 | ⊕⊕⊕⊝ | ‐ |
| Moderate underweight Measured as weight‐for‐age z score < −2 SD Measured at 12 months and 24 months of age | 376/1059 | 292/945 | RR 0.88 (0.78 to 0.99) | 2004 | ⊕⊕⊕⊝ | ‐ |
| Anaemia Measured as haemoglobin < 10 g/dL Measured at 12 months of age | 18/98 | 10/98 | RR 0.38 (0.21 to 0.68) | 557 | ⊕⊕⊝⊝ | ‐ |
| Adverse effects | None of the included studies reported this outcome | |||||
| *The basis for the assumed risk (e.g. the median control group risk across studies) is provided in footnotes. The corresponding risk (and its 95% CI) is based on the assumed risk in the comparison group and the relative effect of the intervention (and its 95% CI). CI: Confidence interval; LNS: Lipid‐based nutrient supplements; RR: Risk ratio; SD: Standard deviation. | ||||||
| GRADE Working Group grades of evidence | ||||||
| aDowngraded one level due to study limitations: high risk of performance bias in two studies (Adu‐Afarwuah 2016; Dewey 2017). | ||||||
| Method | Approach |
| Measures of treatment effects | Rates If rates represent events that could occur more than once per participant, we will report the rate difference using the methodologies described in Deeks 2011. |
| Unit of analysis issues | Cluster‐randomised trials We will follow the methods described in theCochrane Handbook for Systematic Reviews of Interventions (Higgins 2011b), and adjust the sample sizes or standard errors of cluster‐randomised trials by using an estimate of the intra‐cluster correlation co‐efficient (ICC) derived from the study (if possible), from a similar trial or from a study of a similar population. If we use ICCs from other sources, we will report this in the results section, and conduct sensitivity analyses to investigate the effect of variation in the ICC. We will acknowledge heterogeneity in the randomisation unit and perform a sensitivity analysis to investigate the effects of the randomisation unit in the future updates of the review, if applicable. |
| Dealing with missing data | If we find studies with high levels of missing data, we will explore the effect in the overall assessment of treatment effect by removing such studies and conducting a sensitivity analysis. |
| Assessment of reporting bias | If we include 10 or more studies in a meta‐analysis, we will investigate reporting biases (such as publication bias) using funnel plots. We will assess funnel plot asymmetry visually, and use formal tests for funnel plot asymmetry. For continuous outcomes, we will use the test proposed by Egger 1997. For dichotomous outcomes, we will use the test proposed by Harbord 2006. If asymmetry is detected in any of these tests or is suggested by a visual assessment, we will perform exploratory analyses to investigate it. |
| Subgroup analysis and investigation of heterogeneity | We will conduct exploratory subgroup analyses on the primary outcomes, irrespective of heterogeneity, when there are more than three studies contributing data. We will conduct the following analyses.
|
| Sensitivity analysis | We will carry out a sensitivity analysis to examine:
|
| ICC: Intra‐class correlation coefficient; WHO: World Health Organization. | |
| Study | Total energy | Lipid content | Protein Content | Micronutrients |
| 108 kcal (20 g/day) | linoleic acid (1.29 g); linolenic acid (0.29 g) | Not specified | Carotene (400 μg RE); vitamin C (30 mg); folic acid (80 g); thiamine (0.3 mg); riboflavin (0.4 mg); vitamin B3 (4 mg); pantothenic acid (1.8 mg); vitamin B6 (0.3 mg); vitamin B12 (0.5 g); iron sulphate (9 mg); zinc sulphate (4 mg); calcium phosphate (100 mg); potassium (152 mg); copper sulphate (0.2 mg); sodium selenite (10 ug); potassium iodate (90 ug); phosphate (82 mg); magnesium (16 mg); manganese (0.08 mg); phytate (82 mg) | |
| 118 kcal (20 g/day) | 9.6 g | 2.6 g | Linoleic acid (4.46 g); α‐linolenic acid (0.58 g); vitamin A (400 mg retinol equivalents); thiamine (0.3 mg); riboflavin (0.4 mg); niacin (4 mg); vitamin B6 (0.3 mg); vitamin B12 (0.5 mg); vitamin C (30 mg); vitamin D (5 mg); vitamin E (6 mg); vitamin K (30 mg); folic acid (80 mg); pantothenic acid (1.8 mg); iron (6 mg); zinc (8 mg); copper (0.34 mg); calcium (280 mg); phosphorus (190 mg); potassium (200 mg); magnesium (40 mg); selenium (20 mg); iodine (90 mg); manganese (1.2 mg) | |
| 118 kcal (20 g/day) | 9.6 g | 2.6 g | Linoleic acid (4.46 g); a‐linolenic acid (0.58 g); vitamin A (400 mg RE); vitamin C (30 mg); vitamin B1 (0.3 mg); vitamin B2 (0.4 mg); niacin (4 mg); folic acid (80 mg); pantothenic acid (1.8 mg); vitamin B6 (0.3 mg); vitamin B12 (0.5 mg); vitamin D (5 mg); vitamin E (6 mg); vitamin K (30 mg); iron (6 mg); zinc (8 mg); copper (0.34 mg); calcium (280 mg); phosphorus (190 mg); potassium (200 mg); magnesium (40 mg); selenium (20 mg); iodine (90 mg); manganese (1.2 mg) | |
| 275 kcal (50 g/day) | Not specified | Not specified | Vitamin A (412 IU); vitamin D (307 IU); vitamin C (75 mg); thiamine (0.7 mg); riboflavin (1.0 mg); vitamin B12 (1.0 μg); pyridoxine (0.24 mg); niacin (10.3 mg); pantothenic acid (3.8 mg); folic acid (0.07 mg); vitamin K (0.01 mg); calcium (514 mg); phosphorus (265 mg); iron (9.5 mg); zinc (8.3 mg); copper (0.3 mg); iodine (0.07 mg); selenium (0.003 mg); magnesium (23.4 mg); phytic acid (0.425 mg2); phytic acid:iron molar ratio2 (2.1); phytic acid:zinc molar ratio2 (1.9) | |
| 250 kcal (46 g/day) | Not specified | Not specified | Not specified | |
| 118 kcal (20 g/day) | 9.6 g | 2.6 g | Linoleic acid (4.46 g); α‐linolenic acid (0.58 g); vitamin A (400 mg RE); thiamine (0.5 mg); riboflavin (0.5 mg); niacin (6 mg); folic acid (150 mg); pantothenic acid (2 mg); vitamin B6 (0.5 mg); vitamin B12 (0.9 mg); vitamin C (30 mg); vitamin D (5 mg); vitamin E (6 mg); vitamin K (30 mg); calcium (280 mg); copper (0.34 mg); iodine (90 mg); iron (9 mg); magnesium (40 mg); manganese (1.2 mg); phosphorus (190 mg); potassium (200 mg); selenium (20 mg); zinc (8 mg) | |
| 118 kcal (20 g/day) | 9.6 g | 2.6 g | Linoleic acid (4.46 g); α‐Linolenic acid (0.58 g); vitamin A (400 mg); thiamine (0.3 mg); riboflavin (0.4 mg); niacin (4 mg); pantothenic acid (1.8 mg); vitamin B6 (0.3 mg); vitamin B12 (0.5 mg); folic acid (80 mg); vitamin C (30 mg); vitamin D (5 mg); vitamin E (6 mg); vitamin K (30 mg); calcium (280 mg); copper (0.34 mg); iodine (90 mg); iron (6 mg); magnesium (40 mg); manganese (1.2 mg); phosphorus (190 mg); potassium (200 mg); selenium (20 μg); zinc (0 mg) | |
| 247 kcal (46 g/day) | 16 g | 5.9 g | Linoleic acid (2 g); α‐linolenic acid (0.3 g); vitamin A (400 mg); vitamin E (6 mg); thiamine (0.5 mg); niacin (6 mg); pantothenic acid (2 mg); vitamin B6 (0.5 mg); folic acid (160 mg); vitamin B12 (0.9 mg); vitamin C (30 mg); magnesium (60 mg); zinc (4 mg); iron (9 mg); copper (0.3 mg); potassium (310 mg); calcium (387 mg); phosphorus (275 mg); selenium (17 mg); manganese (0.17 mg); iodine (90 mg) | |
| 108 kcal (20 g/day) | 7.08 g | 2.56 g | Linoleic acid (1.29 g); α‐linoleic acid (0.29 g); vitamin A (400 mg); thiamine (0.3 mg); riboflavin (0.4 mg); niacin (4 mg); pantothenic acid (1.8 mg); vitamin B6 (0.3 mg); vitamin B12 (0.5 mg); folic acid (80 mg); vitamin C (30 mg); calcium (100 mg); copper (0.2 mg); iodine (90 mg); iron (9 mg); magnesium (16 mg); manganese (0.08 mg); phosphorus (82.2 mg); potassium (152 mg); selenium (10 mg); zinc (4 mg) | |
| 55 kcal (10 g/day) | 4.7 g | 1.3 g | Linoleic acid (2.22 g); α‐linolenic acid (0.29 g); vitamin A (400 μg RE); vitamin C (30 mg); vitamin B1 (0.3 mg); vitamin B2 (0.4 mg); niacin (4 mg); folic acid (80 μg); pantothenic acid (1.8 mg); vitamin B6 (0.3 mg); vitamin B12 (0.5 μg); vitamin D (200 IU); vitamin E (6 6 mg); vitamin K (30 μg); iron (6 mg); zinc (8 mg); copper (0.34 mg); calcium (240 mg); phosphorus (208 mg); potassium (265 mg); magnesium (50 mg); selenium (20 μg); iodine (90 μg); manganese (1.2 mg); phytate (28 mg) | |
| 17 kcal (20 g/day) | 9.5 g | 2.5 g | Linoleic acid (4.44 g); α‐linolenic acid (0.58 g); vitamin A (400 μg RE); vitamin C (30 mg); vitamin B1 (0.3 mg); vitamin B2 (0.4 mg); niacin (4 mg); folic acid (80 μg); pantothenic acid (1.8 mg); vitamin B6 (0.3 mg); vitamin B12 (0.5 μg); vitamin D (200 IU); vitamin E (6 6 mg); vitamin K (30 μg); iron (6 mg); zinc (8 mg); copper (0.34 mg); calcium (240 mg); phosphorus (208 mg); potassium (265 mg); magnesium (50 mg); selenium (20 μg); iodine (90 μg); manganese (1.2 mg); phytate (56 mg) | |
| 241 kcal (40 g/day) | 18.9 g | 5 g | Linoleic acid (8.88 g); α‐linolenic acid (1.16 g); vitamin A (400 μg RE); vitamin C (30 mg); vitamin B1 (0.3 mg); vitamin B2 (0.4 mg); niacin (4 mg); folic acid (80 μg); pantothenic acid (1.8 mg); vitamin B6 (0.3 mg); vitamin B12 (0.5 μg); vitamin D (200 IU); vitamin E (6 6 mg); vitamin K (30 μg); iron (6 mg); zinc (8 mg); copper (0.34 mg); calcium (240 mg); phosphorus (208 mg); potassium (265 mg); magnesium (50 mg); selenium (20 μg); iodine (90 μg); manganese (1.2 mg); phytate (112 mg) | |
| 118 kcal (20 g/day) | 9.6 g | 2.6 g | Linoleic acid (4.46 g); Alpha‐linolenic acid (0.58 g); Vitamin A (400 μg); Vitamin D (5 μg); Vitamin E (6 mg); Vitamin K (30 μg); Vitamin C (30 mg) Folic acid (150 μg); Thiamine (B1) (0.5 mg); Riboflavin (B2) (0.5 mg); Niacin (6 mg); Pantothenic acid (B5) (2 mg); Vitamin B6 (0.5 mg); Vitamin B12 (0.9 μg); Calcium (280 mg); Copper (0.34 mg); Iodine (90 μg); Iron (9 mg); Magnesium (40 mg); Manganese (1.2 mg); Phosphorous (190 mg); Potassium (200 mg); Selenium (20 μg); Zinc (8 mg) | |
| Milk‐LNS 284.8 kcal (54 g/day) | 17.9 g | 8.2 g | Retinol (400 μg RE); folate (160 μg); niacin (6 mg); pantothenic acid (2 mg); riboflavin (0.5 mg); thiamine (0.5 mg); vitamin B6 (0.5 mg); vitamin B12 (0.9 μg); vitamin C (30 mg); vitamin D (5 μg); calcium (366 mg); copper (0.4 mg); iodine (90 μg); iron (6 mg); magnesium (78.5 mg); selenium (20 μg); zinc (6.0 mg); phosphorus (185.6 mg); potassium (318.6 mg); manganese (0.60 mg) | |
| Soy‐LNS 276.1 kcal (54 g/day) | 18.5 g | 7.5 g | Retinol (400 μg RE); folate (160 μg); niacin (6 mg); pantothenic acid (2 mg); riboflavin (0.5 mg); thiamine (0.5 mg); vitamin B6 (0.5 mg); vitamin B12 (0.9 μg); vitamin C (30 mg); vitamin D (5 μg); calcium (366 mg); copper (0.4 mg); iodine (90 μg); iron (6 mg); magnesium (78.5 mg); selenium (20 μg); zinc (6.0 mg); phosphorus (185.6 mg); potassium (307.3 mg); manganese (0.60 mg) | |
| 110 kcal (20 g/day) | 7 g | 2.6 g | Linoleic acid (1.29 g); α‐linolenic acid (0.29 g); folic acid (80 μg); niacin (4 mg); pantothenic acid (1.8 mg); riboflavin (0.4 mg); thiamine (0.3 mg); vitamin A (400 μg); vitamin B12 (0.5 μg); vitamin B6 (0.3 mg); vitamin C (30 mg); calcium (100 mg); copper (0.2 mg); iodine (90 μg); iron (9 mg); magnesium (16 mg); manganese (0,08 mg); phosphorous (82 mg); potassium (152 mg); selenium (10 μg); zinc (4 mg) | |
| 118 kcal (20 g/day) | 9.6 g | 2.6 g | Linoleic acid (4.46 g); Alpha‐linolenic acid (0.58 g); Vitamin A (400 μg); Vitamin D (5 μg); Vitamin E (6 mg); Vitamin K (30 μg); Vitamin C (30 mg) Folic acid (150 μg); Thiamine (B1) (0.5 mg); Riboflavin (B2) (0.5 mg); Niacin (6 mg); Pantothenic acid (B5) (2 mg); Vitamin B6 (0.5 mg); Vitamin B12 (0.9 μg); Calcium (280 mg); Copper (0.34 mg); Iodine (90 μg); Iron (9 mg); Magnesium (40 mg); Manganese (1.2 mg); Phosphorous (190 mg); Potassium (200 mg); Selenium (20 μg); Zinc (8 mg) | |
| 118 kcal (20 g/day) | 9.6 g | 2.6 g | Linoleic acid (4.5 g); α‐linolenic acid (0.6 g); vitamin A (400 μg); vitamin C (30 mg); vitamin D (5 mg); vitamin E (6 mg); vitamin K (30 mg); thiamine (0.5 mg); riboflavin (0.5 mg); niacin (6 mg); pantothenic acid (2 mg); vitamin B6 (0.5 mg); folic acid (150 μg); vitamin B12 (0.9 μg); iron (9 mg); zinc (8 mg); copper (0.3 mg); selenium (20 μg); iodine (90 μg); calcium (280 mg); magnesium (40 mg); manganese (1.2 mg); phosphorus (190 mg); potassium (200 mg) | |
| 130 kcal (25 g/day) | 8.3 g | 3.8 g | Retinol (400 mg RE); folate (160 mg); niacin (6 mg); pantothenic acid (2 mg); riboflavin (0.5 mg); thiamine (0.5 mg); vitamin B 6 (0.5 mg); vitamin B12 (0.9 mg); vitamin C (30 mg); vitamin D (5 mg); calcium (283 mg); copper (0.5 mg); iodine (90 mg); iron (8 mg); magnesium (60 mg); selenium (17 mg); zinc (8.4 mg) | |
| 264 kcal (50 g/day) | 16.5 g | 7.6 g | Retinol (400 mg RE); folate (160 mg); niacin (6 mg); pantothenic acid (2 mg); riboflavin (0.5 mg); thiamine (0.5 mg); vitamin B6 (0.5 mg); vitamin B12 (0.9 mg); vitamin C (30 mg); vitamin D (5 mg); calcium (366 mg); copper (0.4 mg); iodine (90 mg); iron (8 mg); magnesium (60 mg); selenium (17 mg); zinc (8.4 mg) | |
| 247 kcal (46.4 g/day) | 16 g | 5.9 g | Vitamin A (400 μg); vitamin B12 (0.9 μg); iron (9 mg); zinc (9 mg) | |
| g: gram; | ||||
| Outcome or subgroup title | No. of studies | No. of participants | Statistical method | Effect size |
| 1 Moderate stunting Show forest plot | 9 | 13372 | Risk Ratio (Random, 95% CI) | 0.93 [0.88, 0.98] |
| 2 Severe stunting Show forest plot | 5 | 6151 | Risk Ratio (Random, 95% CI) | 0.85 [0.74, 0.98] |
| 3 Moderate stunting: Sensitivity analysis Show forest plot | 7 | Risk Ratio (Random, 95% CI) | 0.92 [0.88, 0.96] | |
| 4 Severe stunting: Sensitivity analysis Show forest plot | 4 | Risk Ratio (Random, 95% CI) | 0.84 [0.73, 0.97] | |
| 5 Moderate wasting Show forest plot | 8 | 13172 | Risk Ratio (Random, 95% CI) | 0.82 [0.74, 0.91] |
| 6 Severe wasting Show forest plot | 3 | 2329 | Risk Ratio (Random, 95% CI) | 1.27 [0.66, 2.46] |
| 7 Moderate wasting: Sensitivity analysis Show forest plot | 6 | Risk Ratio (Random, 95% CI) | 0.81 [0.73, 0.90] | |
| 8 Severe wasting: Sensitivity analysis Show forest plot | 2 | Risk Ratio (Random, 95% CI) | 1.24 [0.61, 2.51] | |
| 9 Moderate underweight Show forest plot | 8 | 13073 | Risk Ratio (Random, 95% CI) | 0.85 [0.80, 0.91] |
| 10 Severe underweight Show forest plot | 2 | 1729 | Risk Ratio (Random, 95% CI) | 0.78 [0.54, 1.13] |
| 11 Moderate underweight: Sensitivity analysis Show forest plot | 6 | Risk Ratio (Random, 95% CI) | 0.85 [0.80, 0.90] | |
| 12 Severe underweight: Sensitivity analysis Show forest plot | 1 | Risk Ratio (Random, 95% CI) | 0.79 [0.54, 1.16] | |
| 13 Anaemia Show forest plot | 5 | 2332 | Risk Ratio (Random, 95% CI) | 0.79 [0.69, 0.90] |
| 14 Adverse effects Show forest plot | 3 | 3382 | Risk Ratio (Random, 95% CI) | 0.86 [0.74, 1.01] |
| 15 Adverse effects: Sensitivity analysis Show forest plot | 1 | 1932 | Risk Ratio (Random, 95% CI) | 0.76 [0.60, 0.95] |
| 16 Mid‐upper arm circumference (MUAC) Show forest plot | 6 | 8187 | Std. Mean Difference (Random, 95% CI) | 0.13 [0.05, 0.22] |
| 17 Serum haemoglobin (g/L) Show forest plot | 4 | 4518 | Mean Difference (Random, 95% CI) | 5.78 [2.27, 9.30] |
| 18 Mortality Show forest plot | 3 | 3321 | Risk Ratio (Random, 95% CI) | 0.93 [0.63, 1.37] |
| 19 HAZ Show forest plot | 12 | 15795 | Std. Mean Difference (Random, 95% CI) | 0.11 [0.05, 0.16] |
| 20 WAZ Show forest plot | 10 | 12188 | Std. Mean Difference (Random, 95% CI) | 0.09 [0.02, 0.16] |
| 21 WHZ Show forest plot | 10 | 12894 | Std. Mean Difference (Random, 95% CI) | 0.08 [0.04, 0.13] |
| Outcome or subgroup title | No. of studies | No. of participants | Statistical method | Effect size |
| 1 Severe stunting Show forest plot | 5 | 6151 | Risk Ratio (Random, 95% CI) | 0.85 [0.74, 0.98] |
| 1.1 SQ LNS | 4 | 4956 | Risk Ratio (Random, 95% CI) | 0.83 [0.70, 0.99] |
| 1.2 MQ LNS | 2 | 1195 | Risk Ratio (Random, 95% CI) | 0.88 [0.69, 1.12] |
| 2 Moderate stunting Show forest plot | 9 | 13372 | Risk Ratio (Random, 95% CI) | 0.93 [0.88, 0.98] |
| 2.1 SQ LNS | 7 | 9710 | Risk Ratio (Random, 95% CI) | 0.92 [0.84, 1.00] |
| 2.2 MQ LNS | 3 | 3662 | Risk Ratio (Random, 95% CI) | 0.94 [0.88, 1.02] |
| 3 Moderate wasting Show forest plot | 8 | 13172 | Risk Ratio (Random, 95% CI) | 0.82 [0.74, 0.91] |
| 3.1 SQ LNS | 7 | 9903 | Risk Ratio (Random, 95% CI) | 0.83 [0.73, 0.95] |
| 3.2 MQ LNS | 2 | 3269 | Risk Ratio (Random, 95% CI) | 0.78 [0.63, 0.96] |
| 4 Severe wasting Show forest plot | 3 | 2329 | Risk Ratio (Random, 95% CI) | 1.27 [0.66, 2.46] |
| 4.1 SQ LNS | 2 | 1106 | Risk Ratio (Random, 95% CI) | 1.74 [0.73, 4.15] |
| 4.2 MQ LNS | 2 | 1223 | Risk Ratio (Random, 95% CI) | 0.84 [0.31, 2.30] |
| 5 Moderate underweight Show forest plot | 8 | 13073 | Risk Ratio (Random, 95% CI) | 0.85 [0.80, 0.91] |
| 5.1 SQ LNS | 7 | 9880 | Risk Ratio (Random, 95% CI) | 0.88 [0.80, 0.96] |
| 5.2 MQ LNS | 2 | 3193 | Risk Ratio (Random, 95% CI) | 0.83 [0.76, 0.92] |
| 6 Severe underweight Show forest plot | 2 | 1729 | Risk Ratio (Random, 95% CI) | 0.78 [0.54, 1.13] |
| 6.1 SQ LNS | 2 | 1083 | Risk Ratio (Random, 95% CI) | 0.84 [0.52, 1.37] |
| 6.2 MQ LNS | 1 | 646 | Risk Ratio (Random, 95% CI) | 0.71 [0.41, 1.24] |
| 7 Anaemia Show forest plot | 5 | 2332 | Risk Ratio (M‐H, Random, 95% CI) | 0.79 [0.69, 0.90] |
| 7.1 SQ LNS | 3 | 1107 | Risk Ratio (M‐H, Random, 95% CI) | 0.63 [0.43, 0.93] |
| 7.2 MQ LNS | 2 | 1225 | Risk Ratio (M‐H, Random, 95% CI) | 0.86 [0.78, 0.94] |
| 8 Adverse effects Show forest plot | 3 | 3382 | Risk Ratio (Random, 95% CI) | 0.86 [0.74, 1.01] |
| 8.1 SQ LNS | 3 | 2576 | Risk Ratio (Random, 95% CI) | 0.86 [0.69, 1.06] |
| 8.2 MQ LNS | 1 | 806 | Risk Ratio (Random, 95% CI) | 0.85 [0.63, 1.15] |
| 9 Mid‐upper arm circumference (MUAC) Show forest plot | 6 | 8187 | Std. Mean Difference (Random, 95% CI) | 0.13 [0.05, 0.22] |
| 9.1 SQ LNS | 5 | 6546 | Std. Mean Difference (Random, 95% CI) | 0.12 [‐0.00, 0.24] |
| 9.2 MQ LNS | 2 | 1641 | Std. Mean Difference (Random, 95% CI) | 0.17 [0.08, 0.26] |
| 10 Serum haemoglobin (g/L) Show forest plot | 4 | 4518 | Mean Difference (IV, Random, 95% CI) | 5.78 [2.27, 9.30] |
| 10.1 SQ LNS | 2 | 3293 | Mean Difference (IV, Random, 95% CI) | 8.95 [7.66, 10.23] |
| 10.2 MQ LNS | 2 | 1225 | Mean Difference (IV, Random, 95% CI) | 3.01 [2.73, 3.28] |
| 11 Mortality Show forest plot | 3 | 3321 | Risk Ratio (Random, 95% CI) | 0.93 [0.63, 1.37] |
| 11.1 SQ LNS | 3 | 2195 | Risk Ratio (Random, 95% CI) | 0.88 [0.49, 1.60] |
| 11.2 MQ LNS | 1 | 1126 | Risk Ratio (Random, 95% CI) | 1.06 [0.58, 1.92] |
| 12 HAZ Show forest plot | 12 | 15795 | Std. Mean Difference (Random, 95% CI) | 0.11 [0.05, 0.16] |
| 12.1 SQ LNS | 9 | 10919 | Std. Mean Difference (Random, 95% CI) | 0.12 [0.04, 0.20] |
| 12.2 MQ LNS | 4 | 4876 | Std. Mean Difference (Random, 95% CI) | 0.08 [0.01, 0.15] |
| 13 WHZ Show forest plot | 10 | 12894 | Std. Mean Difference (Random, 95% CI) | 0.08 [0.04, 0.13] |
| 13.1 SQ LNS | 8 | 10631 | Std. Mean Difference (Random, 95% CI) | 0.08 [0.02, 0.15] |
| 13.2 MQ LNS | 3 | 2263 | Std. Mean Difference (Random, 95% CI) | 0.07 [0.00, 0.14] |
| 14 WAZ Show forest plot | 10 | 12188 | Std. Mean Difference (Random, 95% CI) | 0.09 [0.02, 0.16] |
| 14.1 SQ LNS | 9 | 10959 | Std. Mean Difference (Random, 95% CI) | 0.11 [0.02, 0.19] |
| 14.2 MQ LNS | 2 | 1229 | Std. Mean Difference (Random, 95% CI) | 0.05 [‐0.04, 0.14] |
| Outcome or subgroup title | No. of studies | No. of participants | Statistical method | Effect size |
| 1 Moderate stunting Show forest plot | 9 | 13372 | Risk Ratio (Random, 95% CI) | 0.93 [0.88, 0.98] |
| 1.1 6 to 12 months | 6 | 7871 | Risk Ratio (Random, 95% CI) | 0.96 [0.89, 1.03] |
| 1.2 More than 12 months | 3 | 5501 | Risk Ratio (Random, 95% CI) | 0.89 [0.81, 0.97] |
| 2 Severe stunting Show forest plot | 5 | 6151 | Risk Ratio (Random, 95% CI) | 0.85 [0.74, 0.98] |
| 2.1 6 to 12 months | 3 | 2251 | Risk Ratio (Random, 95% CI) | 0.89 [0.74, 1.07] |
| 2.2 More than 12 months | 2 | 3900 | Risk Ratio (Random, 95% CI) | 0.80 [0.64, 0.99] |
| 3 Moderate wasting Show forest plot | 8 | 13172 | Risk Ratio (Random, 95% CI) | 0.82 [0.74, 0.91] |
| 3.1 6 to 12 months | 5 | 7669 | Risk Ratio (Random, 95% CI) | 0.81 [0.72, 0.92] |
| 3.2 More than 12 months | 3 | 5503 | Risk Ratio (Random, 95% CI) | 0.83 [0.69, 0.99] |
| 4 Severe wasting: 6 to 12 months Show forest plot | 3 | 2329 | Risk Ratio (Random, 95% CI) | 1.27 [0.66, 2.46] |
| 5 Moderate underweight Show forest plot | 8 | 13073 | Risk Ratio (Random, 95% CI) | 0.85 [0.80, 0.91] |
| 5.1 6 to 12 months | 5 | 7532 | Risk Ratio (Random, 95% CI) | 0.87 [0.78, 0.97] |
| 5.2 More than 12 months | 3 | 5541 | Risk Ratio (Random, 95% CI) | 0.87 [0.79, 0.95] |
| 6 Severe underweight: 6 to 12 months Show forest plot | 2 | 1729 | Risk Ratio (Random, 95% CI) | 0.78 [0.54, 1.13] |
| 7 Anaemia Show forest plot | 5 | 2332 | Risk Ratio (M‐H, Random, 95% CI) | 0.79 [0.69, 0.90] |
| 7.1 Upto 6 months | 2 | 1176 | Risk Ratio (M‐H, Random, 95% CI) | 0.55 [0.20, 1.47] |
| 7.2 6 to 12 months | 2 | 627 | Risk Ratio (M‐H, Random, 95% CI) | 0.84 [0.71, 1.00] |
| 7.3 More than 12 months | 1 | 529 | Risk Ratio (M‐H, Random, 95% CI) | 0.70 [0.55, 0.88] |
| 8 Adverse effects Show forest plot | 3 | 3382 | Risk Ratio (Random, 95% CI) | 0.86 [0.74, 1.01] |
| 9 Mid‐upper arm circumference (MUAC) Show forest plot | 6 | 8187 | Std. Mean Difference (Random, 95% CI) | 0.13 [0.05, 0.22] |
| 9.1 Upto 6 months | 2 | 1472 | Std. Mean Difference (Random, 95% CI) | 0.06 [‐0.23, 0.35] |
| 9.2 6 to 12 months | 3 | 5114 | Std. Mean Difference (Random, 95% CI) | 0.18 [0.10, 0.26] |
| 9.3 More than 12 months | 1 | 1601 | Std. Mean Difference (Random, 95% CI) | 0.04 [‐0.04, 0.12] |
| 10 Serum haemoglobin (g/L) Show forest plot | 4 | 4518 | Mean Difference (IV, Random, 95% CI) | 5.78 [2.27, 9.30] |
| 10.1 Upto 6 months | 2 | 1176 | Mean Difference (IV, Random, 95% CI) | 5.58 [0.52, 10.64] |
| 10.2 6 to 12 months | 2 | 3342 | Mean Difference (IV, Random, 95% CI) | 5.96 [0.08, 11.84] |
| 11 Mortality Show forest plot | 3 | 3321 | Risk Ratio (Random, 95% CI) | 0.93 [0.63, 1.37] |
| 11.1 6 to 12 months | 3 | 3321 | Risk Ratio (Random, 95% CI) | 0.93 [0.63, 1.37] |
| 12 HAZ Show forest plot | 12 | 15795 | Std. Mean Difference (Random, 95% CI) | 0.11 [0.05, 0.16] |
| 12.1 Upto 6 months | 3 | 1510 | Std. Mean Difference (Random, 95% CI) | 0.19 [0.01, 0.36] |
| 12.2 6 to 12 months | 6 | 8784 | Std. Mean Difference (Random, 95% CI) | 0.08 [0.00, 0.15] |
| 12.3 More than 12 months | 3 | 5501 | Std. Mean Difference (Random, 95% CI) | 0.14 [0.03, 0.25] |
| 13 WAZ Show forest plot | 10 | 12188 | Std. Mean Difference (Random, 95% CI) | 0.09 [0.02, 0.16] |
| 13.1 Upto 6 months | 3 | 1103 | Std. Mean Difference (Random, 95% CI) | 0.09 [‐0.00, 0.19] |
| 13.2 6 to 12 months | 4 | 5544 | Std. Mean Difference (Random, 95% CI) | 0.03 [‐0.12, 0.18] |
| 13.3 More than 12 months | 3 | 5541 | Std. Mean Difference (Random, 95% CI) | 0.13 [0.03, 0.24] |
| 14 WHZ Show forest plot | 10 | 12894 | Std. Mean Difference (Random, 95% CI) | 0.08 [0.04, 0.13] |
| 14.1 Upto 6 months | 2 | 1216 | Std. Mean Difference (Random, 95% CI) | 0.13 [‐0.12, 0.38] |
| 14.2 6 to 12 months | 5 | 6175 | Std. Mean Difference (Random, 95% CI) | 0.07 [0.00, 0.14] |
| 14.3 More than 12 months | 3 | 5503 | Std. Mean Difference (Random, 95% CI) | 0.09 [0.01, 0.17] |
| Outcome or subgroup title | No. of studies | No. of participants | Statistical method | Effect size |
| 1 Moderate stunting Show forest plot | 9 | 13492 | Risk Ratio (Random, 95% CI) | 0.93 [0.88, 0.98] |
| 1.1 At 12 months | 1 | 564 | Risk Ratio (Random, 95% CI) | 1.01 [0.86, 1.19] |
| 1.2 At 18 months | 6 | 7427 | Risk Ratio (Random, 95% CI) | 0.95 [0.88, 1.02] |
| 1.3 At 24 months | 3 | 5501 | Risk Ratio (Random, 95% CI) | 0.89 [0.81, 0.97] |
| 2 Severe stunting Show forest plot | 5 | 6151 | Risk Ratio (Random, 95% CI) | 0.85 [0.74, 0.98] |
| 2.1 At 12 months | 1 | 564 | Risk Ratio (Random, 95% CI) | 0.96 [0.67, 1.38] |
| 2.2 At 18 months | 2 | 1687 | Risk Ratio (Random, 95% CI) | 0.86 [0.70, 1.07] |
| 2.3 At 24 months | 2 | 3900 | Risk Ratio (Random, 95% CI) | 0.80 [0.64, 0.99] |
| 3 Moderate wasting Show forest plot | 8 | 13172 | Risk Ratio (Random, 95% CI) | 0.80 [0.73, 0.88] |
| 3.1 At 18 months | 6 | 7669 | Risk Ratio (Random, 95% CI) | 0.79 [0.71, 0.89] |
| 3.2 At 24 months | 3 | 5503 | Risk Ratio (Random, 95% CI) | 0.83 [0.69, 0.99] |
| 4 Severe wasting Show forest plot | 3 | 2329 | Risk Ratio (Random, 95% CI) | 1.27 [0.66, 2.46] |
| 4.1 At 12 months | 1 | 563 | Risk Ratio (Random, 95% CI) | 0.78 [0.12, 4.93] |
| 4.2 At 18 months | 2 | 1766 | Risk Ratio (Random, 95% CI) | 1.39 [0.67, 2.87] |
| 5 Moderate underweight Show forest plot | 8 | 13073 | Risk Ratio (Random, 95% CI) | 0.85 [0.81, 0.90] |
| 5.1 At 18 months | 6 | 7532 | Risk Ratio (Random, 95% CI) | 0.85 [0.78, 0.92] |
| 5.2 At 24 months | 3 | 5541 | Risk Ratio (Random, 95% CI) | 0.87 [0.79, 0.95] |
| 6 Severe underweight: at 18 months Show forest plot | 2 | 1729 | Risk Ratio (Random, 95% CI) | 0.78 [0.54, 1.13] |
| 7 Anaemia Show forest plot | 5 | 2332 | Risk Ratio (M‐H, Random, 95% CI) | 0.79 [0.69, 0.90] |
| 7.1 At 12 months | 2 | 1176 | Risk Ratio (M‐H, Random, 95% CI) | 0.55 [0.20, 1.47] |
| 7.2 At 18 months | 3 | 1156 | Risk Ratio (M‐H, Random, 95% CI) | 0.80 [0.71, 0.91] |
| 7.3 At 36 months | 0 | 0 | Risk Ratio (M‐H, Random, 95% CI) | 0.0 [0.0, 0.0] |
| 8 Adverse effects: At 18 months Show forest plot | 3 | 3382 | Risk Ratio (Random, 95% CI) | 0.86 [0.74, 1.01] |
| 9 Mid‐upper arm circumference (MUAC) Show forest plot | 6 | 8187 | Std. Mean Difference (Random, 95% CI) | 0.13 [0.05, 0.22] |
| 9.1 At 12 months | 1 | 1193 | Std. Mean Difference (Random, 95% CI) | 0.15 [0.06, 0.24] |
| 9.2 At 18 months | 3 | 4355 | Std. Mean Difference (Random, 95% CI) | 0.12 [‐0.11, 0.34] |
| 9.3 At 24 months | 1 | 1601 | Std. Mean Difference (Random, 95% CI) | 0.04 [‐0.04, 0.12] |
| 9.4 At 36 months | 1 | 1038 | Std. Mean Difference (Random, 95% CI) | 0.2 [0.06, 0.34] |
| 10 Serum haemoglobin (g/L) Show forest plot | 4 | 4518 | Mean Difference (IV, Random, 95% CI) | 5.78 [2.27, 9.30] |
| 10.1 At 12 months | 1 | 194 | Mean Difference (IV, Random, 95% CI) | 8.5 [4.46, 12.54] |
| 10.2 At 18 months | 2 | 3342 | Mean Difference (IV, Random, 95% CI) | 5.96 [0.08, 11.84] |
| 10.3 At 36 months | 1 | 982 | Mean Difference (IV, Random, 95% CI) | 3.30 [1.42, 5.18] |
| 11 Mortality Show forest plot | 3 | 3321 | Risk Ratio (Random, 95% CI) | 0.93 [0.63, 1.37] |
| 11.1 At 12 months | 1 | 1932 | Risk Ratio (Random, 95% CI) | 0.85 [0.56, 1.30] |
| 11.2 At 18 months | 2 | 1389 | Risk Ratio (Random, 95% CI) | 1.10 [0.42, 2.89] |
| 12 HAZ Show forest plot | 12 | 15795 | Std. Mean Difference (Random, 95% CI) | 0.10 [0.05, 0.15] |
| 12.1 At 12 to 15 months | 3 | 1103 | Std. Mean Difference (Random, 95% CI) | 0.07 [‐0.02, 0.15] |
| 12.2 At 18 months | 6 | 8153 | Std. Mean Difference (Random, 95% CI) | 0.08 [0.00, 0.16] |
| 12.3 At 24 months | 3 | 5501 | Std. Mean Difference (Random, 95% CI) | 0.14 [0.03, 0.25] |
| 12.4 At 36 months | 1 | 1038 | Std. Mean Difference (Random, 95% CI) | 0.27 [0.10, 0.44] |
| 13 WAZ Show forest plot | 10 | 12188 | Std. Mean Difference (Random, 95% CI) | 0.10 [0.04, 0.16] |
| 13.1 At 12 to 15 months | 3 | 1103 | Std. Mean Difference (Random, 95% CI) | 0.09 [‐0.00, 0.19] |
| 13.2 At 18 months | 5 | 5544 | Std. Mean Difference (Random, 95% CI) | 0.05 [‐0.06, 0.17] |
| 13.3 At 24 months | 3 | 5541 | Std. Mean Difference (Random, 95% CI) | 0.13 [0.03, 0.23] |
| 14 WHZ Show forest plot | 10 | 12894 | Std. Mean Difference (Random, 95% CI) | 0.12 [0.02, 0.22] |
| 14.1 At 12 to 15 months | 2 | 809 | Std. Mean Difference (Random, 95% CI) | 0.10 [‐0.02, 0.22] |
| 14.2 At 18 months | 5 | 5544 | Std. Mean Difference (Random, 95% CI) | 0.13 [‐0.05, 0.31] |
| 14.3 At 24 months | 3 | 5503 | Std. Mean Difference (Random, 95% CI) | 0.09 [0.01, 0.17] |
| 14.4 At 36 months | 1 | 1038 | Std. Mean Difference (Random, 95% CI) | 0.04 [‐0.08, 0.16] |
| Outcome or subgroup title | No. of studies | No. of participants | Statistical method | Effect size |
| 1 Moderate stunting Show forest plot | 3 | 2828 | Risk Ratio (Random, 95% CI) | 0.89 [0.82, 0.97] |
| 2 Severe stunting Show forest plot | 2 | 729 | Risk Ratio (Random, 95% CI) | 0.41 [0.12, 1.42] |
| 3 Moderate wasting Show forest plot | 2 | 2290 | Risk Ratio (Random, 95% CI) | 0.79 [0.65, 0.97] |
| 4 Severe wasting Show forest plot | 2 | 735 | Risk Ratio (Random, 95% CI) | 0.64 [0.19, 2.18] |
| 5 Moderate underweight Show forest plot | 2 | 2280 | Risk Ratio (Random, 95% CI) | 0.81 [0.73, 0.91] |
| 6 Severe underweight Show forest plot | 1 | Risk Ratio (Random, 95% CI) | Totals not selected | |
| 7 MUAC Show forest plot | 2 | 1512 | Std. Mean Difference (IV, Random, 95% CI) | 0.02 [‐0.08, 0.12] |
| 8 Haemoglobin (g/L) Show forest plot | 1 | 182 | Mean Difference (IV, Random, 95% CI) | 0.29 [‐6.00, 6.59] |
| 9 HAZ Show forest plot | 4 | 4047 | Std. Mean Difference (IV, Random, 95% CI) | 0.06 [0.00, 0.13] |
| 10 WAZ Show forest plot | 3 | 1933 | Mean Difference (IV, Random, 95% CI) | 0.05 [‐0.04, 0.14] |
| 11 WHZ Show forest plot | 3 | 1933 | Std. Mean Difference (IV, Random, 95% CI) | 0.07 [‐0.02, 0.16] |
| Outcome or subgroup title | No. of studies | No. of participants | Statistical method | Effect size |
| 1 Moderate stunting Show forest plot | 3 | 2365 | Risk Ratio (Random, 95% CI) | 0.92 [0.82, 1.02] |
| 2 Moderate wasting Show forest plot | 2 | 2004 | Risk Ratio (Random, 95% CI) | 0.97 [0.77, 1.23] |
| 3 Moderate underweight Show forest plot | 2 | 2004 | Risk Ratio (Random, 95% CI) | 0.88 [0.78, 0.99] |
| 4 Anaemia Show forest plot | 2 | 557 | Risk Ratio (Random, 95% CI) | 0.38 [0.21, 0.68] |
| 5 Anaemia: Sensitivity analysis Show forest plot | 1 | Risk Ratio (Random, 95% CI) | 0.56 [0.27, 1.14] | |
| 6 Serum haemoglobin (g/L) Show forest plot | 2 | 557 | Mean Difference (Random, 95% CI) | 5.13 [2.00, 8.26] |
| 7 Serum haemoglobin (g/L): Sensitivity analysis Show forest plot | 1 | Mean Difference (Random, 95% CI) | 3.6 [‐0.13, 7.33] | |
| 8 HAZ Show forest plot | 3 | 2362 | Std. Mean Difference (IV, Random, 95% CI) | 0.10 [‐0.08, 0.27] |
| 9 HAZ: Sensitivity analysis Show forest plot | 2 | 2001 | Std. Mean Difference (IV, Random, 95% CI) | 0.16 [0.03, 0.28] |
| 10 WAZ Show forest plot | 3 | 2362 | Std. Mean Difference (IV, Random, 95% CI) | 0.12 [0.02, 0.21] |
| 11 WAZ: Sensitivity analysis Show forest plot | 2 | 2001 | Std. Mean Difference (IV, Random, 95% CI) | 0.14 [0.05, 0.23] |
| 12 WHZ Show forest plot | 3 | 2362 | Std. Mean Difference (IV, Random, 95% CI) | 0.05 [‐0.06, 0.17] |
| 13 WHZ: Sensitivity analysis Show forest plot | 2 | 2001 | Std. Mean Difference (IV, Random, 95% CI) | 0.10 [0.01, 0.18] |