Suplementos nutricionales preventivos a base de lípidos administrados con alimentos complementarios a los lactantes y niños pequeños de seis a 23 meses de edad para los resultados de salud, nutrición y desarrollo
Appendices
Appendix 1. Search strategies for retracted studies
MEDLINE Ovid 1946 to February Week 4 2019
Searched 5 March 2019. 45 records were retrieved, none of which related to included studies in this review.
1 exp Lipids/
2 fatty acid$.tw,kf.
3 Docosahexaenoic acid.tw,kf.
4 Eicosapentaenoic Acid$.tw,kf.
5 PUFA$.tw,kf.
6 lipid.tw,kf.
7 (omega 3$ or omega 6$).tw,kf.
8 (soy$ or peanut or groundnut or whey or sesame or cashew or chickpea or oil$).tw,kf.
9 or/1‐8
10 Dietary Supplements/
11 Food, fortified/
12 ((diet$ or food$) adj3 (fortif$ or enrich$ or supplement$)).tw,kf.
13 (complement$ adj3 (food$ or feed$)).tw,kf.
14 "Ready to use".tw,kf.
15 (RUSF or RUTF).tw,kf.
16 "point of use".tw,kf. )
17 (home$ adj2 fortif$).tw,kf.
18 or/10‐17
19 9 and 18
20 (lipid$ adj3 nutrient$).tw,kf.
21 (lipid$ adj3 supplement$).tw,kf.
22 lipid based.tw,kf.
23 (lipid$ adj3 fortif$).tw,kf.
24 (lipid$ adj3 enrich$).tw,kf.
25 (lipid$ adj2 emuls$).tw,kf.
26 (lipid$ adj2 formulation$).tw,kf.
27 (Lipid$ adj3 powder$).tw,kf.
28 (lipid adj3 spread$).tw,kf.
29 (lipid$ adj3 paste$).tw,kf.
30 (Nutributter$ or Plumpy$).tw,kf.
31 (LBNS$ or LNS$1 or iLiNS).tw,kf.
32 or/20‐31
33 19 or 32 (43056)
34 Infant/ (753966)
35 (baby or babies or infant$ or toddler$ or child$).tw. (1425823)
36 34 or 35 (1743645)
37 33 and 36 (3151)
38 exp animals/ not humans.sh.
39 37 not 38
40 (comment or "corrected and republished article" or editorial or "expression of concern" or published erratum or retracted publication or "retraction of publication").pt.
41 (comment or corrected or correction or corrigendum or "expression of concern" or erratum or retracted or retraction).ti.
42 40 or 41
43 39 and 42
Embase Ovid 1974 to 2019 March 04
Searched 5 March 2019. records were retreived, none of which related to included studies in this review.
1 exp Lipids/
2 fatty acid$.tw,kw.
3 Docosahexaenoic acid.tw,kw.
4 Eicosapentaenoic Acid$.tw,kw.
5 PUFA$.tw,kw.
6 lipid$.tw,kw.
7 (omega 3$ or omega 6$).tw,kw.
8 (soy$ or peanut or groundnut or whey or sesame or cashew or chickpea or oil$).tw,kw.
9 or/1‐8
10 dietary supplement/
11 fortified food/
12 ((diet$ or food$) adj3 (fortif$ or enrich$ or supplement$)).tw,kw.
13 (complement$ adj3 (food$ or feed$)).tw,kw.
14 "Ready to use".tw,kw.
15 (RUSF or RUTF).tw,kw.
16 "point of use".tw,kw.
17 (home$ adj2 fortif$).tw,kw.
18 or/10‐17
19 9 and 18
20 lipid based.tw,kw.
21 (lipid$ adj3 nutrient$).tw,kw.
22 (lipid$ adj3 supplement$).tw,kw.
23 (lipid$ adj3 fortif$).tw,kw.
24 (lipid$ adj3 enrich$).tw,kw.
25 (lipid$ adj2 emuls$).tw,kw.
26 (lipid$ adj2 formulation$).tw,kw.
27 (Lipid$ adj3 powder$).tw,kw.
28 (lipid adj3 spread$).tw,kw.
29 (lipid$ adj3 paste$).tw,kw.
30 (Nutributter$ or Plumpy$).tw,kw.
31 (LBNS$ or LNS$1 or iLiNS).tw,kw.
32 or/20‐31
33 19 or 32
34 infant/
35 (baby or babies or infant$ or toddler$ or child$).tw.
36 34 or 35
37 33 and 36
38 exp animals/ or exp invertebrate/ or animal experiment/ or animal model/ or animal tissue/ or animal cell/ or nonhuman/)
39 human/ or normal human/ or human cell/
40 38 not 39
41 37 not 40
42 exp erratum/
43 erratum.pt.
44 yes.nr.
45 tombstone.pt.
46 (comment or corrected or correction or corrigendum or "expression of concern" or erratum or retracted or retraction).ti.
47 or/42‐46
48 41 and 47
Retraction Watch Database retractiondatabase.org/RetractionSearch.aspx?
Searched 5 March 2019.
We searched for retractions of all reports of included studies using PubMed ID (where a PubMed ID existed for the report), and ran separate searches for the title of each paper. When searching by title alone retrieved a large number of records, we searched by a combination of title and surname of first author.
Appendix 2. Search strategies for intervention studies
Cochrane Central Register of Controlled Trials (CENTRAL) in the Cochrane Library
#1[mh Lipids]
#2(fatty next acid*)
#3((Docosahexaenoic or Eicosapentaenoic) next acid*)
#4(PUFA or PUFAs)
#5lipid*
#6(omega next (3* or 6*))
#7(soy* or peanut or groundnut or whey or sesame or cashew or chickpea or oil*)
#8{or #1‐#7}
#9[mh "Dietary Supplements"]
#10[mh "Food, fortified"]
#11((diet* or food*) near/3 (fortif* or enrich* or supplement*))
#12(complement* near/3 (food* or feed*))
#13"Ready to use"
#14"point of use"
#15(RUSF or RUTF)
#16(home* near/2 fortif*)
#17{or #9‐#16}
#18#8 and #17
#19(lipid next based)
#20(lipid* near/3 supplement*)
#21(lipid* near/3 nutrient*)
#22(lipid* near/3 fortif*)
#23(lipid* near/3 formulation*)
#24(lipid* near/3 enrich*)
#25(lipid* near/3 emuls*)
#26(lipid* near/3 powder*)
#27(lipid* near/3 spread*)
#28(lipid* near/3 paste*)
#29(Nutributter* or Plumpy*)
#30(LNS or iLiNS)
#31{or #19‐#30}
#32#18 or #31
#33[mh ^Infant]
#34infant* or toddler* or baby or babies or child*
#35#33 or #34
#36#32 and #35 in Trials
MEDLINE Ovid
1 exp Lipids/
2 fatty acid$.tw,kf.
3 Docosahexaenoic acid.tw,kf.
4 Eicosapentaenoic Acid$.tw,kf.
5 PUFA$.tw,kf.
6 lipid.tw,kf.
7 (omega 3$ or omega 6$).tw,kf.
8 (soy$ or peanut or groundnut or whey or sesame or cashew or chickpea or oil$).tw,kf.
9 or/1‐8
10 Dietary Supplements/
11 Food, fortified/
12 ((diet$ or food$) adj3 (fortif$ or enrich$ or supplement$)).tw,kf.
13 (complement$ adj3 (food$ or feed$)).tw,kf.
14 "Ready to use".tw,kf.
15 (RUSF or RUTF).tw,kf.
16 "point of use".tw,kf.
17 (home$ adj2 fortif$).tw,kf.
18 or/10‐17
19 9 and 18
20 (lipid$ adj3 nutrient$).tw,kf.
21 (lipid$ adj3 supplement$).tw,kf.
22 lipid based.tw,kf.
23 (lipid$ adj3 fortif$).tw,kf.
24 (lipid$ adj3 enrich$).tw,kf.
25 (lipid$ adj2 emuls$).tw,kf.
26 (lipid$ adj2 formulation$).tw,kf.
27 (lipid$ adj3 powder$).tw,kf.
28 (lipid adj3 spread$).tw,kf.
29 (lipid$ adj3 paste$).tw,kf.
30 (Nutributter$ or Plumpy$).tw,kf.
31 (LBNS$ or LNS$1 or iLiNS).tw,kf.
32 or/20‐31
33 19 or 32
34 Infant/
35 (baby or babies or infant$ or toddler$ or child$).tw.
36 34 or 35
37 33 and 36
38 exp animals/ not humans.sh.
39 37 not 38
MEDLINE In‐Process and Other Non‐Indexed Citations Ovid
1 lipid based.tw,kf.
2 (lipid$ adj3 nutrient$).tw,kf.
3 (lipid$ adj3 supplement$).tw,kf.
4 (lipid$ adj3 fortif$).tw,kf.
5 (lipid$ adj3 enrich$).tw,kf.
6 (lipid$ adj2 emuls$).tw,kf.
7 (lipid$ adj2 formulation$).tw,kf.
8 (Lipid$ adj3 powder$).tw,kf.
9 (lipid adj3 spread$).tw,kf.
10 (lipid$ adj3 paste$).tw,kf.
11 (Nutributter$ or Plumpy$).tw,kf.
12 (LBNS$ or LNS$1 or iLiNS).tw,kf.
13 or/1‐12
14 ((diet$ or food$) adj3 (fortif$ or enrich$ or supplement$)).tw,kf.
15 (complement$ adj3 (food$ or feed$)).tw,kf.
16 (RUSF or RUTF).tw,kf.
17 "point of use".tw,kf.
18 (home$ adj2 fortif$).tw,kf.
19 lipid$.tw,kf.
20 fatty acid$.tw,kf.
21 Docosahexaenoic acid$.tw,kf.
22 Eicosapentaenoic Acid$.tw,kf.
23 PUFA$.tw,kf.
24 (omega 3$ or omega 6$).tw,kf.
25 (soy$ or peanut or groundnut or whey or sesame or cashew or chickpea or oil$).tw,kf.
26 or/14‐18
27 or/19‐25
28 26 and 27
29 13 or 28
30 (baby or babies or infant$ or toddler$ or child$).tw.
31 29 and 30
MEDLINE E‐pub ahead of print Ovid
1 lipid based.tw,kf.
2 (lipid$ adj3 nutrient$).tw,kf.
3 (lipid$ adj3 supplement$).tw,kf.
4 (lipid$ adj3 fortif$).tw,kf.
5 (lipid$ adj3 enrich$).tw,kf.
6 (lipid$ adj2 emuls$).tw,kf.
7 (lipid$ adj2 formulation$).tw,kf.
8 (Lipid$ adj3 powder$).tw,kf.
9 (lipid adj3 spread$).tw,kf.
10 (lipid$ adj3 paste$).tw,kf.
11 (Nutributter$ or Plumpy$).tw,kf.
12 (LBNS$ or LNS$1 or iLiNS).tw,kf.
13 or/1‐12
14 ((diet$ or food$) adj3 (fortif$ or enrich$ or supplement$)).tw,kf.
15 (complement$ adj3 (food$ or feed$)).tw,kf.
16 (RUSF or RUTF).tw,kf.
17 "point of use".tw,kf.
18 (home$ adj2 fortif$).tw,kf.
19 lipid$.tw,kf.
20 fatty acid$.tw,kf.
21 Docosahexaenoic acid$.tw,kf.
22 Eicosapentaenoic Acid$.tw,kf.
23 PUFA$.tw,kf.
24 (omega 3$ or omega 6$).tw,kf.
25 (soy$ or peanut or groundnut or whey or sesame or cashew or chickpea or oil$).tw,kf.
26 or/14‐18
27 or/19‐25
28 26 and 27
29 13 or 28
30 (baby or babies or infant$ or toddler$ or child$).tw.
31 29 and 30
Embase Ovid
1 exp Lipids/
2 fatty acid$.tw,kw.
3 Docosahexaenoic acid.tw,kw.
4 Eicosapentaenoic Acid$.tw,kw.
5 PUFA$.tw,kw.
6 lipid$.tw,kw.
7 (omega 3$ or omega 6$).tw,kw.
8 (soy$ or peanut or groundnut or whey or sesame or cashew or chickpea or oil$).tw,kw.
9 or/1‐8
10 dietary supplement/
11 fortified food/
12 ((diet$ or food$) adj3 (fortif$ or enrich$ or supplement$)).tw,kw.
13 (complement$ adj3 (food$ or feed$)).tw,kw.
14 "Ready to use".tw,kw.
15 (RUSF or RUTF).tw,kw.
16 "point of use".tw,kw.
17 (home$ adj2 fortif$).tw,kw.
18 or/10‐17
19 9 and 18
20 lipid based.tw,kw.
21 (lipid$ adj3 nutrient$).tw,kw.
22 (lipid$ adj3 supplement$).tw,kw.
23 (lipid$ adj3 fortif$).tw,kw.
24 (lipid$ adj3 enrich$).tw,kw.
25 (lipid$ adj2 emuls$).tw,kw.
26 (lipid$ adj2 formulation$).tw,kw.
27 (Lipid$ adj3 powder$).tw,kw.
28 (lipid adj3 spread$).tw,kw.
29 (lipid$ adj3 paste$).tw,kw.
30 (Nutributter$ or Plumpy$).tw,kw.
31 (LBNS$ or LNS$1 or iLiNS).tw,kw.
32 or/20‐31
33 19 or 32
34 infant/
35 (baby or babies or infant$ or toddler$ or child$).tw.
36 34 or 35
37 33 and 36
38 exp animals/ or exp invertebrate/ or animal experiment/ or animal model/ or animal tissue/ or animal cell/ or nonhuman/
39 human/ or normal human/ or human cell/
40 38 not 39
41 37 not 40
CINAHL Plus EBSCOhost (Cumulative Index to Nursing and Allied Health Literature
S1(MH "Lipids+")
S2TI (lipid*) or AB (lipid*)
S3TI(Docosahexaenoic acid*) OR AB(Docosahexaenoic acid*)
S4TI( Eicosapentaenoic acid*) OR AB( Eicosapentaenoic acid*)
S5TI(PUFA*) OR AB(PUFA* )
S6TI(omega 3* or omega 6*) OR AB(omega 3* or omega 6* )
S7TI (soy* or peanut or groundnut or whey or sesame or cashew or chickpea or oil*) or AB(soy* or peanut or groundnut or whey or sesame or cashew or chickpea or oil*)
S8TI(fatty acid*) OR AB(fatty acid* )
S9S1 OR S2 OR S3 OR S4 OR S5 OR S6 OR S7 OR S8
S10(MH "Dietary Supplements")
S11(MH "Dietary Supplementation")
S12(MH "Food, Fortified")
S13TI ((diet* or food*) n3 (fortif* or enrich* or supplement*)) OR AB((diet* or food*) n3 (fortif* or enrich* or supplement*))
S14TI (complement* N3 (food* or feed*)) or AB (complement* N3 (food* or feed*))
S15"Ready to use"
S16(RUSF or RUTF)
S17"point of use"
S18TI (home* N2 fortif*) OR AB(home* N2 fortif*)
S19S10 OR S11 OR S12 OR S13 OR S14 OR S15 OR S16 OR S17 OR S18
S20S9 AND S19
S21TI (lipid based) or AB (lipid based)
S22TI(lipid* N3 supplement*) OR AB( lipid* N3 supplement*)
S23TI(lipid* N3 nutrient*) OR AB(lipid* N3 nutrient*)
S24TI(lipid* N3 fortif*) OR AB (lipid* N3 fortif*)
S25TI(lipid* N3 formulation*) OR AB(lipid* N3 formulation*)
S26TI(lipid* N3 enrich*) OR AB(lipid* N3 enrich* )
S27TI(lipid* N3 emuls*) OR AB(lipid* N3 emuls*)
S28TI(lipid* N3 powder*) OR AB(lipid* N3 powder*)
S29TI(lipid N3 spread*) OR AB(lipid N3 spread*)
S30TI(lipid* N3 paste*) OR AB(lipid* N3 paste*)
S31Nutributter*
S32 Plumpy*
S33TI(LNS*1 or iLiNS) OR AB( LNS*1 or iLiNS)
S34S21 OR S22 OR S23 OR S24 OR S25 OR S26 OR S27 OR S28 OR S29 OR S30 OR S31 OR S32 OR S33
S35S20 OR S34
S36(MH "Infant")
S37TI(baby or babies or infant* or toddler* or child*) OR AB (baby or babies or infant* or toddler* or child*)
S38S36 OR S37
S39S35 AND S38
Science Citation Index (SCI) and Social Sciences Citation Index (SSCI) Web of Science
#5 #4 AND #3
#4 TS=(infant* OR child* OR toddler* or baby or babies)
#3 #2 OR #1
#2 TS=(Nutributter* OR Plumpy* OR LNS OR iLiNS OR "lipid based" )
#1 TS=(( "fatty acid*" OR PUFA OR PUFAs OR "omega 3*" OR "omega 6*" OR soy* OR peanut* OR groundnut* OR whey* OR sesame* OR cashew* OR chickpea* OR oil* ) Near/3 ( FORTIF* OR ENRICH OR SUPPLEMENT* OR "READY TO USE" OR "POINT OF USE" OR RUSF OR RUTF OR PASTE* OR SPREAD* OR FORMULAT* OR EMULS* OR NUTRIENT* OR POWDER*))
Conference Proceedings Citation Index ‐ Science (CPCI‐S) and Conference Proceedings Citation Index ‐ Social Science & Humanities (CPCI‐SS&H) Web of Science
#5 #4 AND #3
DocType=All document types; Language=All languages;
#4 TS=(infant* OR child* OR toddler* or baby or babies)
DocType=All document types; Language=All languages;
#3 #2 OR #1
DocType=All document types; Language=All languages;
#2 TS=(Nutributter* OR Plumpy* OR LNS OR iLiNS OR "lipid based" )
DocType=All document types; Language=All languages;
#1 TS=(( "fatty acid*" OR PUFA OR PUFAs OR "omega 3*" OR "omega 6*" OR soy* OR peanut* OR groundnut* OR whey* OR sesame* OR cashew* OR chickpea* OR oil* ) Near/3 ( FORTIF* OR ENRICH OR SUPPLEMENT* OR "READY TO USE" OR "POINT OF USE" OR RUSF OR RUTF OR PASTE* OR SPREAD* OR FORMULAT* OR EMULS* OR NUTRIENT* OR POWDER*))
DocType=All document types; Language=All languages;
Cochrane Database of Systematic Reviews (CDSR), part of the Cochrane Library
#1[mh Lipids]
#3((Docosahexaenoic or Eicosapentaenoic) next acid*):ti,ab
#4(PUFA or PUFAs):ti,ab
#5lipid*:ti,ab 23529
#6(omega next (3* or 6*)):ti,ab
#7(soy* or peanut or groundnut or whey or sesame or cashew or chickpea or oil*):ti,ab
#8{or #1‐#7}
#9[mh "Dietary Supplements"]
#10[mh "Food, fortified"]
#11((diet* or food*) near/3 (fortif* or enrich* or supplement*)):ti,ab
#12(complement* near/3 (food* or feed*)):ti,ab
#13"Ready to use":ti,ab
#14"point of use":ti,ab
#15(RUSF or RUTF):ti,ab
#16(home* near/2 fortif*):ti,ab
#17{or #9‐#16}
#18#8 and #17
#19(lipid next based):ti,ab
#20(lipid* near/3 supplement*):ti,ab
#21(lipid* near/3 nutrient*):ti,ab
#22(lipid* near/3 fortif*):ti,ab
#23(lipid* near/3 formulation*):ti,ab
#24(lipid* near/3 enrich*):ti,ab
#25(lipid* near/3 emuls*):ti,ab
#26(lipid* near/3 powder*):ti,ab
#27(lipid* near/3 spread*):ti,ab
#28(lipid* near/3 paste*):ti,ab
#29(Nutributter* or Plumpy*):ti,ab
#30(LNS*1 or iLiNS):ti,ab
#31{or #19‐#30}
#32#18 or #31
#33[mh ^Infant]
#34infant* or toddler* or baby or babies or child*:ti,ab
#35#33 or #34
#36#32 and #35 in Cochrane Reviews (Reviews and Protocols)
Database of Abstracts of Reviews of Effect (DARE), part of the Cochrane Library
#1[mh Lipids]
#3((Docosahexaenoic or Eicosapentaenoic) next acid*):ti,ab
#4(PUFA or PUFAs):ti,ab
#5lipid*:ti,ab 23529
#6(omega next (3* or 6*)):ti,ab
#7(soy* or peanut or groundnut or whey or sesame or cashew or chickpea or oil*):ti,ab
#8{or #1‐#7}
#9[mh "Dietary Supplements"]
#10[mh "Food, fortified"]
#11((diet* or food*) near/3 (fortif* or enrich* or supplement*)):ti,ab
#12(complement* near/3 (food* or feed*)):ti,ab
#13"Ready to use":ti,ab
#14"point of use":ti,ab
#15(RUSF or RUTF):ti,ab
#16(home* near/2 fortif*):ti,ab
#17{or #9‐#16}
#18#8 and #17
#19(lipid next based):ti,ab
#20(lipid* near/3 supplement*):ti,ab
#21(lipid* near/3 nutrient*):ti,ab
#22(lipid* near/3 fortif*):ti,ab
#23(lipid* near/3 formulation*):ti,ab
#24(lipid* near/3 enrich*):ti,ab
#25(lipid* near/3 emuls*):ti,ab
#26(lipid* near/3 powder*):ti,ab
#27(lipid* near/3 spread*):ti,ab
#28(lipid* near/3 paste*):ti,ab
#29(Nutributter* or Plumpy*):ti,ab
#30(LNS*1 or iLiNS):ti,ab
#31{or #19‐#30}
#32#18 or #31
#33[mh ^Infant]
#34infant* or toddler* or baby or babies or child*:ti,ab
#35#33 or #34
#36#32 and #35 in Other Reviews
Epistemonikos (epistemonikos.org)
(title:(LIPID* OR FATTY ACID* OR OMEGA OR Docosahexaenoic OR Eicosapentaenoic OR soy* OR peanut OR groundnut OR whey OR sesame OR cashew OR chickpea OR oil*) OR abstract:(LIPID* OR FATTY ACID* OR OMEGA OR Docosahexaenoic OR Eicosapentaenoic OR soy* OR peanut OR groundnut OR whey OR sesame OR cashew OR chickpea OR oil*)) AND (title:(fortif* OR enrich* OR supplement* OR "Ready to use" OR "point of use" OR RUSF OR RUTF) OR abstract:(fortif* OR enrich* OR supplement* OR "Ready to use" OR "point of use" OR RUSF OR RUTF)) AND title:(babies OR children OR infant*)
LIMITED TO
PUBLICATION TYPE: SYSTEMATIC REVIEW
SYSTEMATIC REVIEW QUESTION : INTERVENTIONS
POPLINE (www.popline.org)
((ALL FIELDS(lipid* OR "fatty acid*" OR PUFA OR PUFAs OR "omega 3*" OR "omega 6*" OR soy* OR peanut* OR groundnut* OR whey* OR sesame* OR cashew* OR chickpea* OR oil*) AND ALL FIELDS (FORTIF* OR ENRICH OR SUPPLEMENT* OR "READY TO USE" OR "POINT OF USE" OR RUSF OR RUTF OR PASTE* OR SPREAD* OR FORMULAT* OR EMULS* OR NUTRIENT* OR POWDER*)) OR (Nutributter* OR Plumpy* OR LNS OR iLiNS)) AND ALL FIELDS (infan* OR child* OR baby OR babies OR toddler*)
ClinicalTrials.gov (clinicaltrials.gov)
Interventional Studies | LIPID‐BASED OR LNS OR iLiNS OR "NUTRIENT SUPPLEMENT" OR PASTE OR SPREAD OR BLEND OR NUTRIBUTTER OR Plumpy OR PLUMPYNUT | Child
World Health Organization International Clinical Trials Registry Platform (WHO ICTRP; who.int/trialsearch)
(LIPID BASED OR LNS OR iLiNS OR NUTRIENT SUPPLEMENT OR SPREAD OR paste OR BLEND OR NUTRIBUTTER OR Plumpy OR PLUMPYNUT) NOT (teeth OR oral heath OR dentistry)
IBECS (Índice Bibliográfico Español en Ciencias de la Salud; ibecs.isciii.es)
WORD| "lipid based" OR LNS OR iLiNS OR "nutrient supplement" OR paste OR spread OR blend OR nutributter OR Plumpy OR plumpynut
AND
WORD| infan* OR child* OR baby OR babies OR toddler*
SciELO (Scientific Electronic Library Online; www.scielo.br)
"lipid based" OR LNS OR iLiNS OR "nutrient supplement" OR paste OR spread OR blend OR nutributter OR Plumpy OR plumpynut [All indexes]
AND
infan* OR child* OR baby OR babies OR toddler* [All indexes]
AIM (Africa Index Medicus; search.bvsalud.org/ghl/?lang=en&submit=Search&where=REGIONAL)
(lipid based OR LNS OR iLiNS OR nutrient supplement OR paste OR spread OR blend OR nutributter OR Plumpy OR plumpynut) AND (infan OR child OR baby OR babies OR toddler)
IMEMR (Index Medicus for the Eastern Mediterranean Region; search.bvsalud.org/ghl/?lang=en&submit=Search&where=REGIONAL)
(lipid based OR LNS OR iLiNS OR nutrient supplement OR paste OR spread OR blend OR nutributter OR Plumpy OR plumpynut) [Title]
AND
(infan OR child OR baby OR babies OR toddler) [Title]
LILACS (Latin American and Caribbean Health Sciences Literature; lilacs.bvsalud.org/en)
(tw:("lipid based" OR LNS OR iLiNS OR "nutrient supplement" OR paste OR spread OR blend OR nutributter OR Plumpy OR plumpynut) AND (tw:(infan* OR child* OR baby OR babies OR toddler*)
PAHO/WHO Institutional Repository for Information Sharing (iris.paho.org/xmlui)
("lipid based" OR LNS OR iLiNS OR "nutrient supplement" OR paste OR spread OR blend OR nutributter OR Plumpy OR plumpynut) AND (infan* OR child* OR baby OR babies OR toddler*)
WHOLIS (WHO Library Database; search.bvsalud.org/ghl/?lang=en&submit=Search&where=REGIONAL)
words or phrase "lipid based" OR LNS OR iLiNS OR "nutrient supplement" OR paste OR spread OR blend OR nutributter OR Plumpy OR plumpynut AND words or phrase infan* OR child* OR baby OR babies OR toddler*
WPRIM (Western Pacific Index Medicus; search.bvsalud.org/ghl/?lang=en&submit=Search&where=REGIONAL)
("lipid based" OR LNS OR iLiNS OR "nutrient supplement" OR paste OR spread OR blend OR nutributter OR Plumpy OR plumpynut) AND (infan* OR child* OR baby OR babies OR toddler*)
IMSEAR (Index Medicus for the South‐East Asian Region; search.bvsalud.org/ghl/?lang=en&submit=Search&where=REGIONAL)
("lipid based" OR LNS OR iLiNS OR "nutrient supplement" OR paste OR spread OR blend OR nutributter OR Plumpy OR plumpynut) [Title] AND (infan* OR child* OR baby OR babies OR toddler*) [Title]
IndMED (indmed.nic.in/indmed.html)
(lipid based OR LNS OR iLiNS OR nutrient supplement OR paste OR spread OR blend OR nutributter OR Plumpy OR plumpynut) AND (infan OR child OR baby OR babies OR toddler)
Native Health Research Database (hscssl.unm.edu/nhd)
Keywords: (Supplement AND child)
Appendix 3. Extraction sheet
| Author: | ||
| Year of publication: | ||
| Journal: | ||
| Study funded by: | ||
| Country: | ||
| Study design: | ||
| Setting (Hospital/Outpatient/Community): | ||
| Setting (Stable/Emergency): | ||
| Target population: | ||
| Baseline Indicators | Anemia: | |
| BMI: | ||
| MUAC: | ||
| Other: | ||
| Intervention/Comparison Groups | Intervention/Comparison: | |
| Supplementary food composition/Nutrient density: | ||
| Produced by: | ||
| Dose/Frequency: | ||
| Duration of intervention: | ||
| Period of intervention: | ||
| Intervention given through: | ||
| Composition of LNS/Nutrient density: | ||
| Duration of follow‐up: | ||
| Number of participants: | ||
| Risk of Bias | Randomization/Sequence generation | Author judgment for risk of bias: Low, High or Unclear |
| Quote from the paper: | ||
| Allocation concealment | Author judgment for risk of bias: Low, High or Unclear | |
| Quote from the paper: | ||
| Assessment blinding ‐ Outcome | Author judgment for risk of bias: Low, High or Unclear | |
| Quote from the paper: | ||
| Blinding of participants/personnel | Author judgment for risk of bias: Low, High or Unclear | |
| Quote from the paper: | ||
| Selective reporting | Author judgment for risk of bias: Low, High or Unclear | |
| Quote from the paper: | ||
| Attribution/ Loss to follow up | Author judgment for risk of bias: Low, High or Unclear | |
| Quote from the paper: | ||
| Other bias | Author judgment for risk of bias: Low, High or Unclear | |
| Quote from the paper: | ||
| Outcomes | Primary/Secondary: | |
| Outcome definition: | ||
| Units: | ||
| Numbers (for all groups) | ||
| Limitations: | ||
| Comments: | ||
Footnotes
BMI: Body mass index.
LNS: Lipid‐based nutrient supplements.
MUAC: Mid‐upper arm circumference.
Appendix 4. Criteria for assessing risk of bias in RCTs
Random sequence generation (checking for possible selection bias)
We assessed whether the method used to generate the allocation sequence was described in sufficient detail to allow an assessment of whether it produced comparable groups.
-
Low risk of bias: any truly random process (for example, random number table, computer random number generator)
-
High risk of bias: any non‐random process (for example, odd or even date of birth, hospital or clinic record number)
-
Unclear risk of bias: insufficient information provided to permit judgement of high or low risk of bias
Allocation concealment (checking for possible selection bias)
We assessed whether the method used to conceal the allocation sequence was described in sufficient detail to determine whether intervention allocations could have been foreseen in advance of, or during, enrolment.
-
Low risk of bias: telephone or central randomisation; consecutively numbered, sealed, opaque envelopes
-
High risk of bias: open random allocation, unsealed or non‐opaque envelopes
-
Unclear risk of bias: insufficient information provided to permit judgement of high or low risk of bias
Blinding of participants and personnel (checking for possible performance bias)
We described all measures used, if any, to blind study participants and personnel from knowledge of which intervention a participant received.
We assessed the risk of performance bias associated with blinding of participants and personnel as follows.
-
Low risk of bias: blinding of participants and personnel and unlikely that the blinding could have been broken, or no blinding or incomplete blinding but outcome unlikely to have been influenced
-
High risk of bias: participants and personnel not blinded, incomplete or broken blinding and outcome likely to have been influenced
-
Unclear risk of bias: insufficient information provided to permit judgement of high or low risk of bias
Whilst assessed separately, we combined the results into a single evaluation of risk of bias associated with blinding (Higgins 2011a).
Blinding of outcome assessment (checking for possible detection bias)
We described all measures used, if any, to blind outcome assessors from knowledge of which intervention a participant received.
-
Low risk of bias: blinding of outcome assessment and unlikely that the blinding could have been broken, or no blinding but measurement unlikely to have been influenced
-
High risk of bias: no blinding of outcome assessment, measurement likely to have been influenced by lack of blinding, or blinding could have been broken
-
Unclear risk of bias: insufficient information provided to permit judgement of high or low risk of bias
Incomplete outcome data (checking for possible attrition bias through withdrawals, dropouts, protocol deviations)
We assessed the outcomes in each included study as follows.
-
Low risk of bias: no missing outcome data or missing outcome data were unlikely to bias the results based on the following considerations; study authors provided transparent documentation of participant flow throughout the study, the proportion of missing data was similar in the intervention and control groups, the reasons for missing data were provided and balanced across intervention and control groups, or the reasons for missing data were not likely to bias the results (for example, moving house)
-
High risk of bias: missing outcome data were likely to bias the result, 'as‐treated (per protocol)' analysis was performed with substantial differences between the intervention received and that assigned at randomisation, or potentially inappropriate methods for imputation were used
-
Unclear risk of bias: insufficient information provided to permit judgement of high or low risk of bias
Selective outcome reporting (checking for possible reporting bias)
Selective reporting can lead to reporting bias. We compared the methods to the results and looked for outcomes that were measured (or likely to have been measured) but not reported.
-
Low risk of bias: all of the study’s pre‐specified outcomes and expected outcomes of interest to the review were reported
-
High risk of bias: not all of the study’s pre‐specified outcomes were reported, one or more reported primary outcomes were not pre‐specified, outcomes of interest were reported incompletely and so could not be used, or the study failed to include the results of a key outcome that was expected to be reported
-
Unclear risk of bias: insufficient information provided to permit judgement of high or low risk of bias
Other sources of bias (checking for other possible sources of bias not covered by the domains above)
We assessed if the study was free of other potential bias as follows.
-
Low risk of bias: similarity between outcome measures at baseline, similarity between potential confounding variables at baseline, or adequate protection of study arms against contamination
-
High risk of bias: no similarity between outcome measures at baseline, no similarity between potential confounding variables at baseline, or inadequate protection of study arms against contamination
-
Unclear risk of bias: insufficient information provided to permit judgement of high or low risk of bias

Study flow diagram.

'Risk of bias' graph: review authors' judgements about each risk of bias item presented as percentages across all included studies.
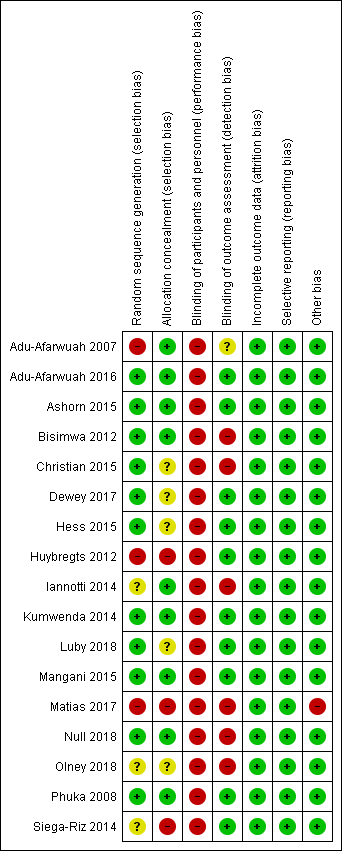
'Risk of bias' summary: review authors' judgements about each risk of bias item for each included study.

Forest plot of comparison: 1 LNS versus no intervention, outcome: 1.1 Moderate stunting.
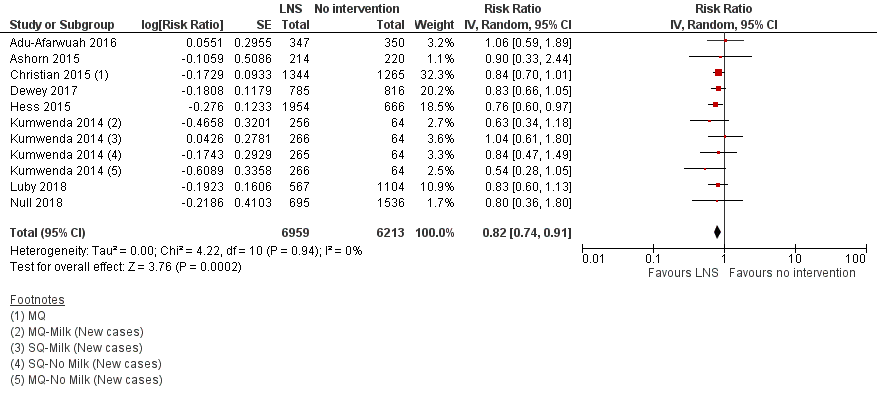
Forest plot of comparison: 1 LNS versus no intervention, outcome: 1.5 Moderate wasting.

Comparison 1 LNS versus no intervention, Outcome 1 Moderate stunting.

Comparison 1 LNS versus no intervention, Outcome 2 Severe stunting.

Comparison 1 LNS versus no intervention, Outcome 3 Moderate stunting: Sensitivity analysis.
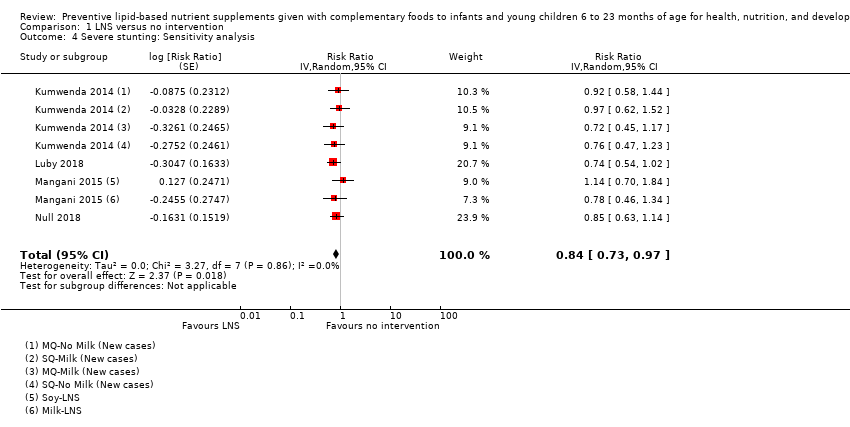
Comparison 1 LNS versus no intervention, Outcome 4 Severe stunting: Sensitivity analysis.

Comparison 1 LNS versus no intervention, Outcome 5 Moderate wasting.
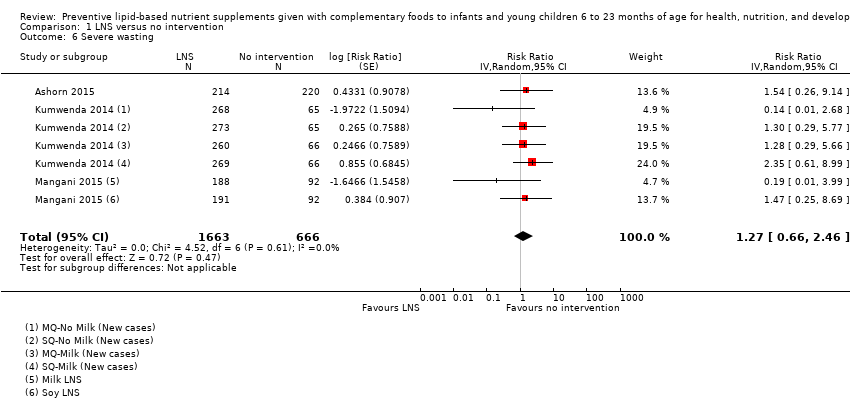
Comparison 1 LNS versus no intervention, Outcome 6 Severe wasting.

Comparison 1 LNS versus no intervention, Outcome 7 Moderate wasting: Sensitivity analysis.

Comparison 1 LNS versus no intervention, Outcome 8 Severe wasting: Sensitivity analysis.

Comparison 1 LNS versus no intervention, Outcome 9 Moderate underweight.
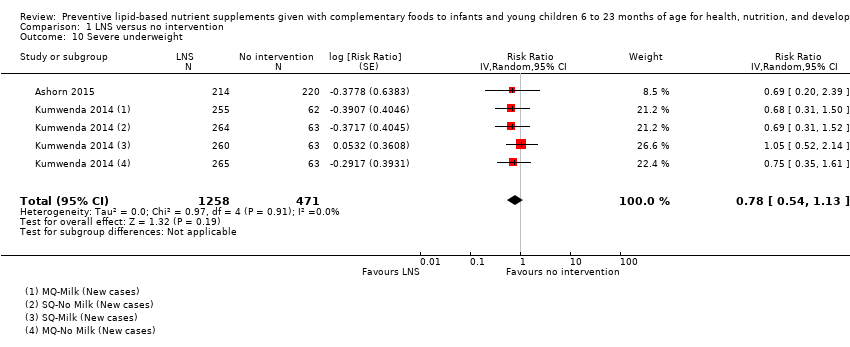
Comparison 1 LNS versus no intervention, Outcome 10 Severe underweight.

Comparison 1 LNS versus no intervention, Outcome 11 Moderate underweight: Sensitivity analysis.
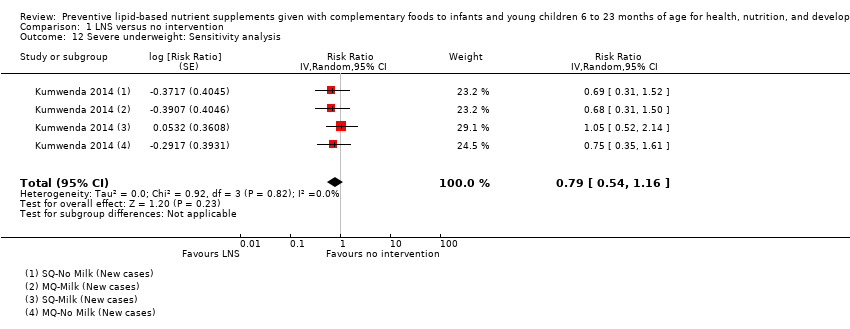
Comparison 1 LNS versus no intervention, Outcome 12 Severe underweight: Sensitivity analysis.

Comparison 1 LNS versus no intervention, Outcome 13 Anaemia.

Comparison 1 LNS versus no intervention, Outcome 14 Adverse effects.
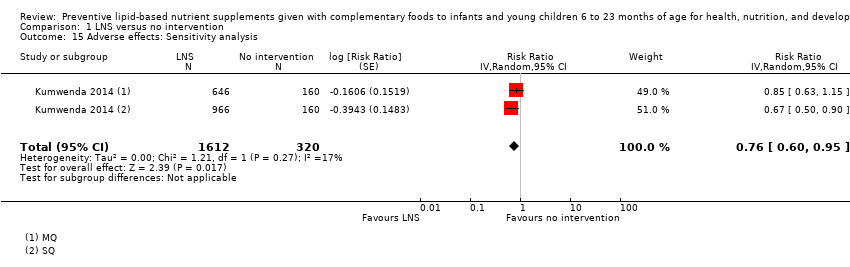
Comparison 1 LNS versus no intervention, Outcome 15 Adverse effects: Sensitivity analysis.
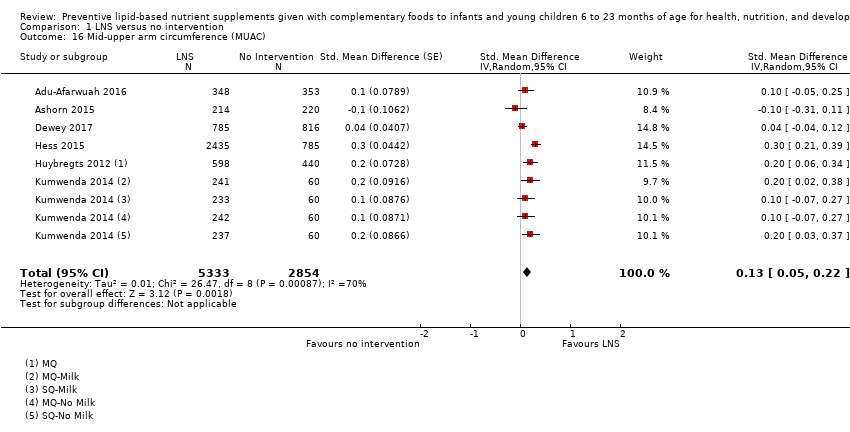
Comparison 1 LNS versus no intervention, Outcome 16 Mid‐upper arm circumference (MUAC).
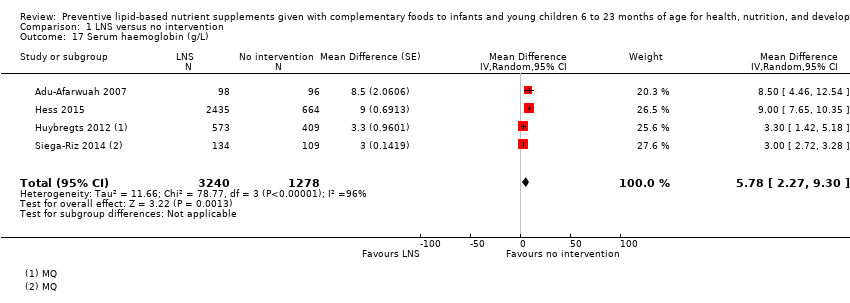
Comparison 1 LNS versus no intervention, Outcome 17 Serum haemoglobin (g/L).
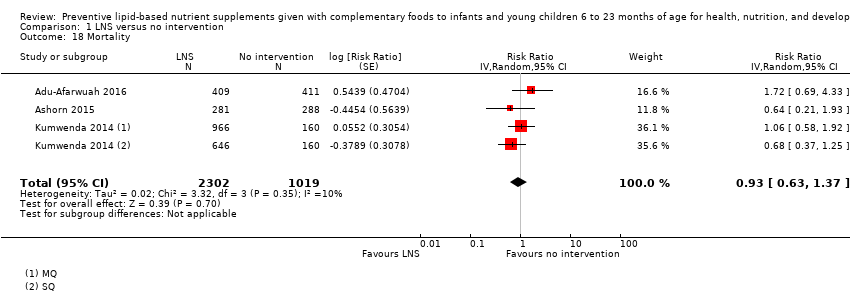
Comparison 1 LNS versus no intervention, Outcome 18 Mortality.

Comparison 1 LNS versus no intervention, Outcome 19 HAZ.

Comparison 1 LNS versus no intervention, Outcome 20 WAZ.

Comparison 1 LNS versus no intervention, Outcome 21 WHZ.

Comparison 2 LNS versus no intervention: Subgroup analysis by energy content/formulation of product provided, Outcome 1 Severe stunting.

Comparison 2 LNS versus no intervention: Subgroup analysis by energy content/formulation of product provided, Outcome 2 Moderate stunting.

Comparison 2 LNS versus no intervention: Subgroup analysis by energy content/formulation of product provided, Outcome 3 Moderate wasting.
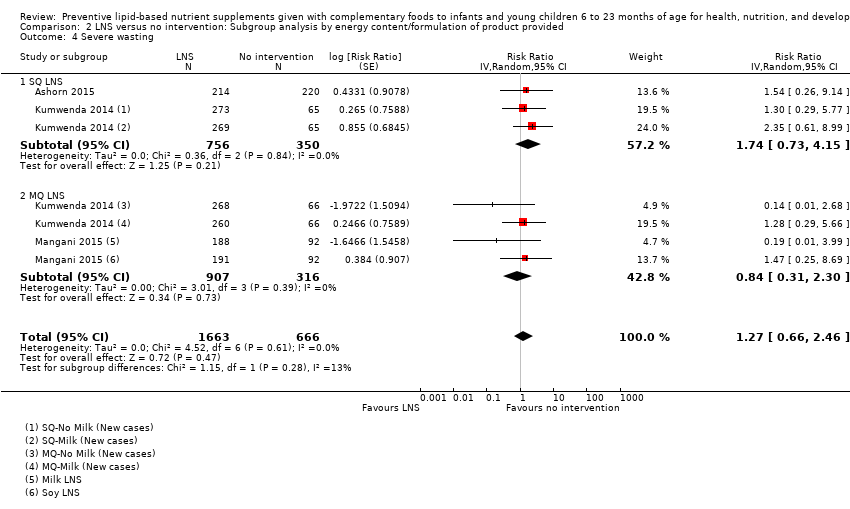
Comparison 2 LNS versus no intervention: Subgroup analysis by energy content/formulation of product provided, Outcome 4 Severe wasting.
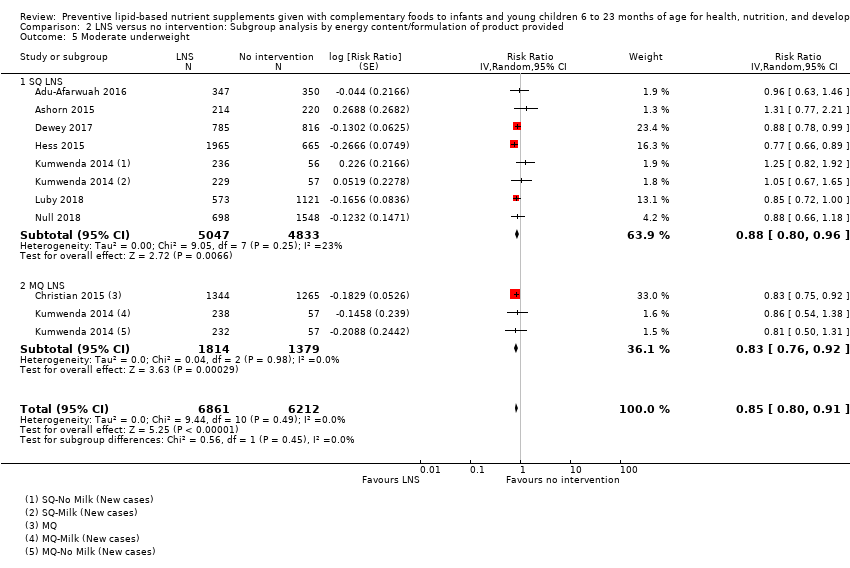
Comparison 2 LNS versus no intervention: Subgroup analysis by energy content/formulation of product provided, Outcome 5 Moderate underweight.

Comparison 2 LNS versus no intervention: Subgroup analysis by energy content/formulation of product provided, Outcome 6 Severe underweight.

Comparison 2 LNS versus no intervention: Subgroup analysis by energy content/formulation of product provided, Outcome 7 Anaemia.

Comparison 2 LNS versus no intervention: Subgroup analysis by energy content/formulation of product provided, Outcome 8 Adverse effects.

Comparison 2 LNS versus no intervention: Subgroup analysis by energy content/formulation of product provided, Outcome 9 Mid‐upper arm circumference (MUAC).

Comparison 2 LNS versus no intervention: Subgroup analysis by energy content/formulation of product provided, Outcome 10 Serum haemoglobin (g/L).

Comparison 2 LNS versus no intervention: Subgroup analysis by energy content/formulation of product provided, Outcome 11 Mortality.

Comparison 2 LNS versus no intervention: Subgroup analysis by energy content/formulation of product provided, Outcome 12 HAZ.

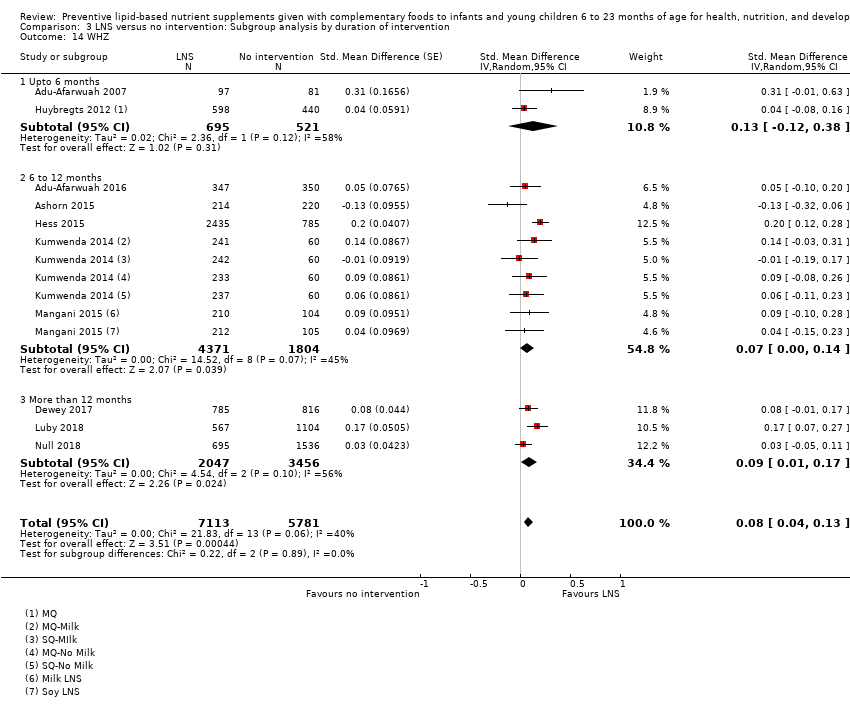
Comparison 2 LNS versus no intervention: Subgroup analysis by energy content/formulation of product provided, Outcome 13 WHZ.

Comparison 2 LNS versus no intervention: Subgroup analysis by energy content/formulation of product provided, Outcome 14 WAZ.
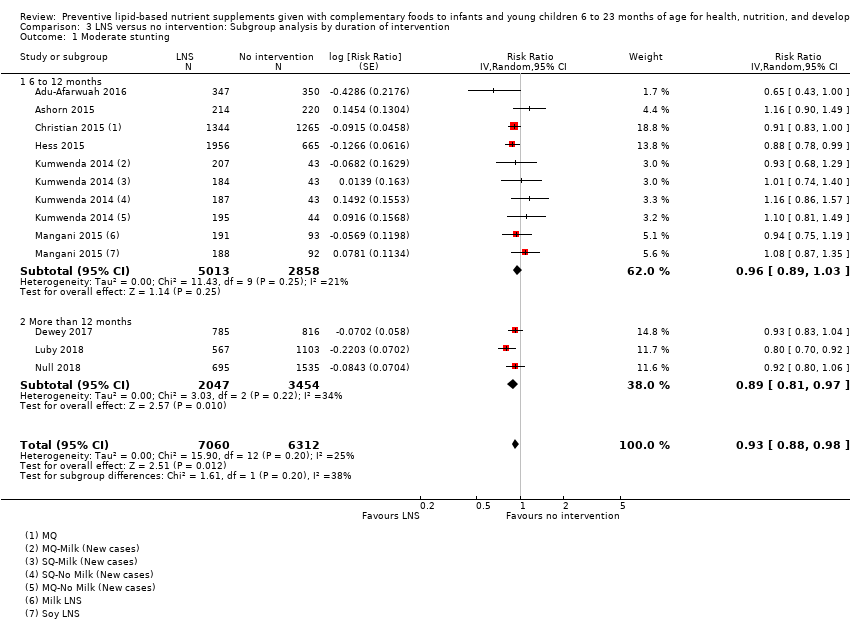
Comparison 3 LNS versus no intervention: Subgroup analysis by duration of intervention, Outcome 1 Moderate stunting.

Comparison 3 LNS versus no intervention: Subgroup analysis by duration of intervention, Outcome 2 Severe stunting.

Comparison 3 LNS versus no intervention: Subgroup analysis by duration of intervention, Outcome 3 Moderate wasting.
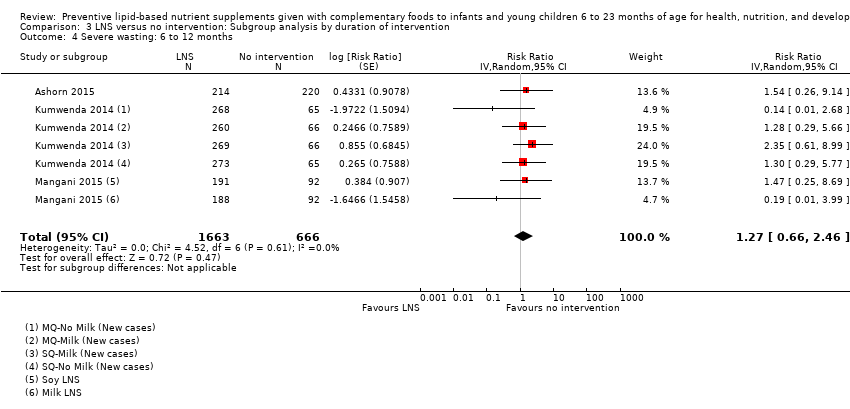
Comparison 3 LNS versus no intervention: Subgroup analysis by duration of intervention, Outcome 4 Severe wasting: 6 to 12 months.

Comparison 3 LNS versus no intervention: Subgroup analysis by duration of intervention, Outcome 5 Moderate underweight.
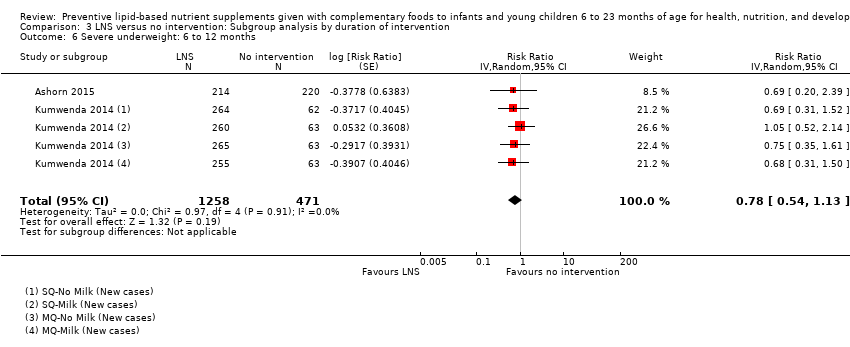
Comparison 3 LNS versus no intervention: Subgroup analysis by duration of intervention, Outcome 6 Severe underweight: 6 to 12 months.
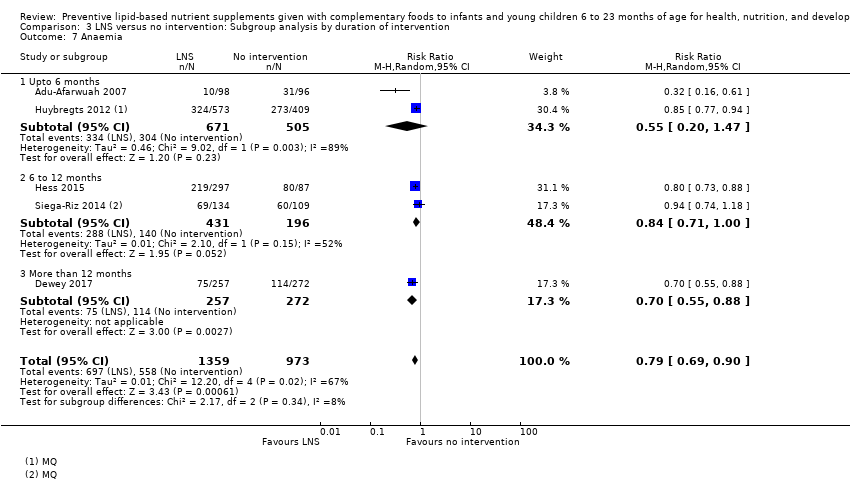
Comparison 3 LNS versus no intervention: Subgroup analysis by duration of intervention, Outcome 7 Anaemia.
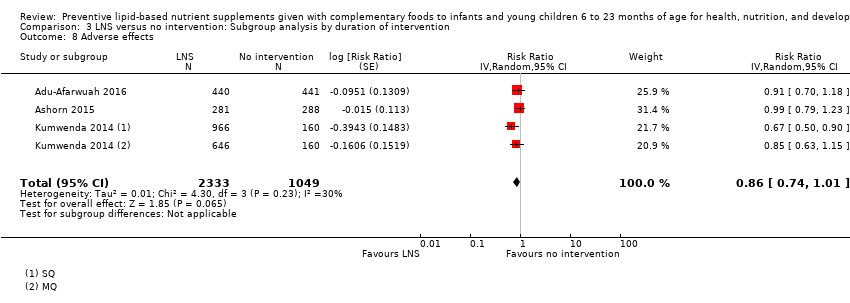
Comparison 3 LNS versus no intervention: Subgroup analysis by duration of intervention, Outcome 8 Adverse effects.
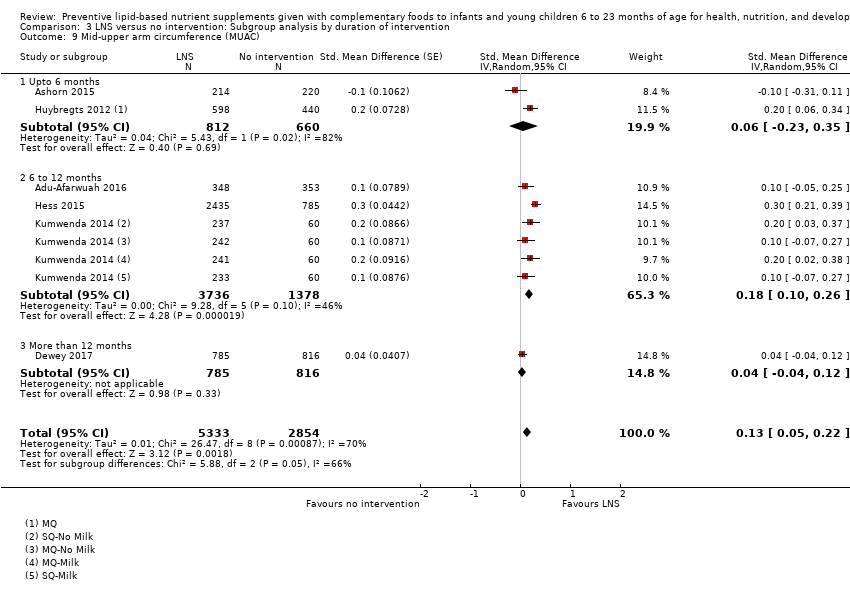
Comparison 3 LNS versus no intervention: Subgroup analysis by duration of intervention, Outcome 9 Mid‐upper arm circumference (MUAC).

Comparison 3 LNS versus no intervention: Subgroup analysis by duration of intervention, Outcome 10 Serum haemoglobin (g/L).
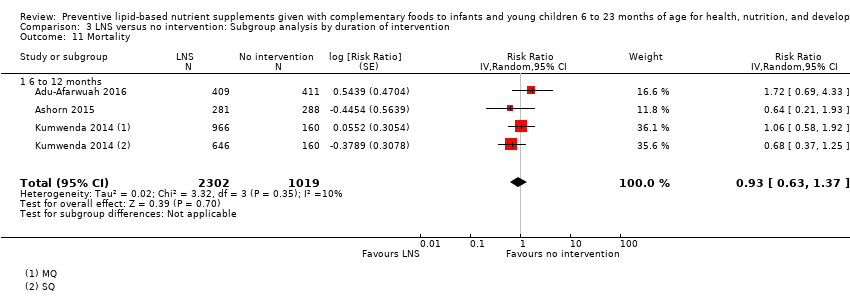
Comparison 3 LNS versus no intervention: Subgroup analysis by duration of intervention, Outcome 11 Mortality.

Comparison 3 LNS versus no intervention: Subgroup analysis by duration of intervention, Outcome 12 HAZ.
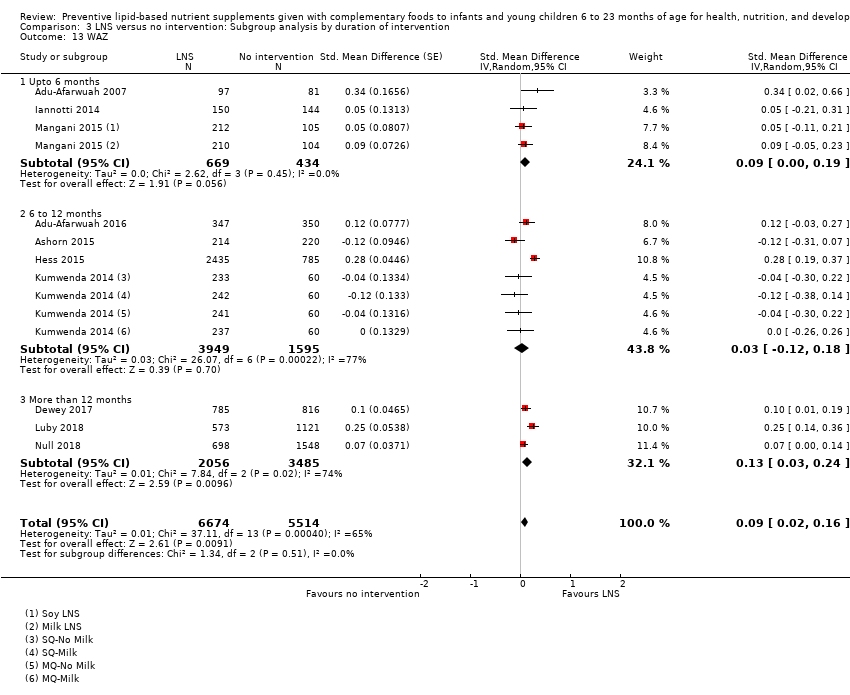
Comparison 3 LNS versus no intervention: Subgroup analysis by duration of intervention, Outcome 13 WAZ.
Comparison 3 LNS versus no intervention: Subgroup analysis by duration of intervention, Outcome 14 WHZ.
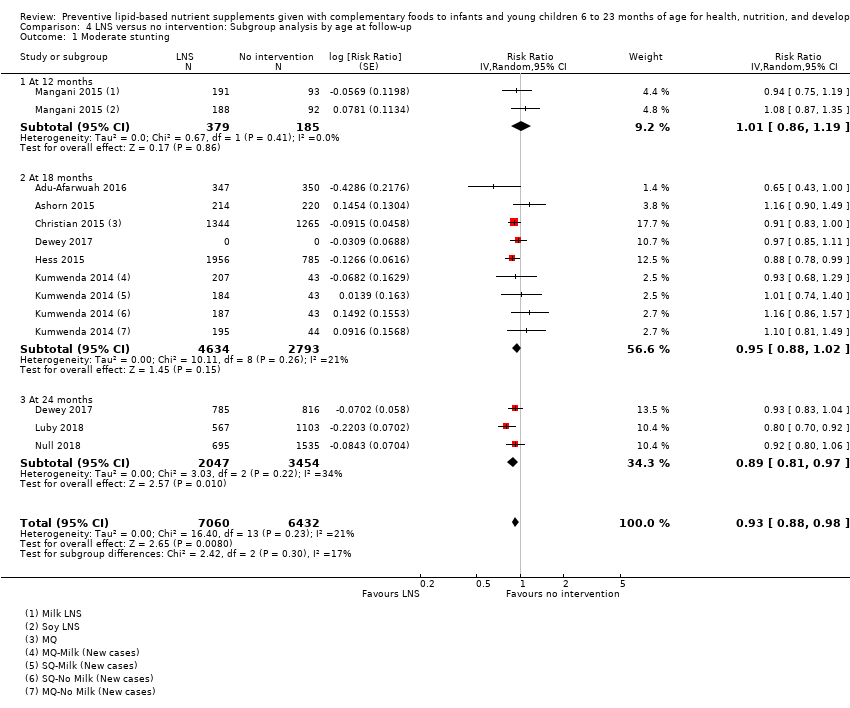
Comparison 4 LNS versus no intervention: Subgroup analysis by age at follow‐up, Outcome 1 Moderate stunting.

Comparison 4 LNS versus no intervention: Subgroup analysis by age at follow‐up, Outcome 2 Severe stunting.

Comparison 4 LNS versus no intervention: Subgroup analysis by age at follow‐up, Outcome 3 Moderate wasting.
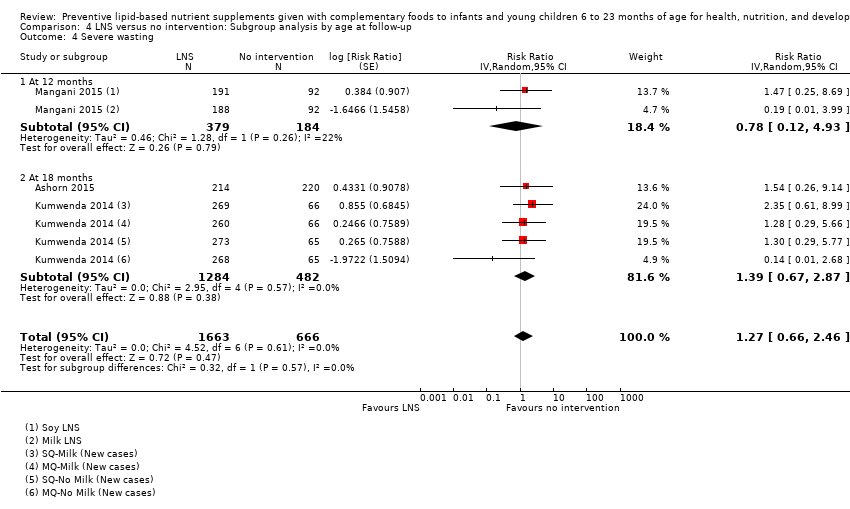
Comparison 4 LNS versus no intervention: Subgroup analysis by age at follow‐up, Outcome 4 Severe wasting.

Comparison 4 LNS versus no intervention: Subgroup analysis by age at follow‐up, Outcome 5 Moderate underweight.
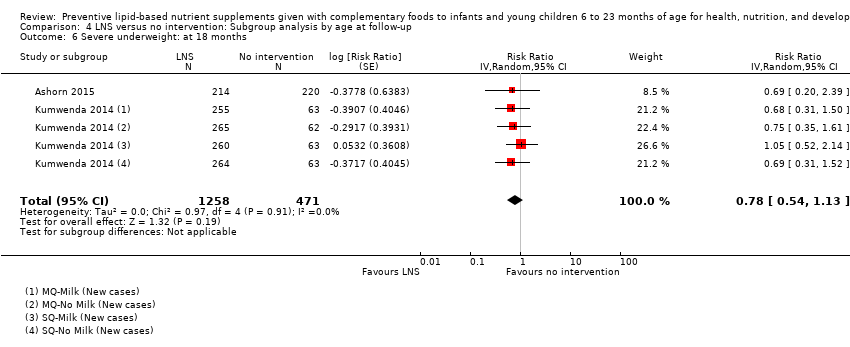
Comparison 4 LNS versus no intervention: Subgroup analysis by age at follow‐up, Outcome 6 Severe underweight: at 18 months.

Comparison 4 LNS versus no intervention: Subgroup analysis by age at follow‐up, Outcome 7 Anaemia.
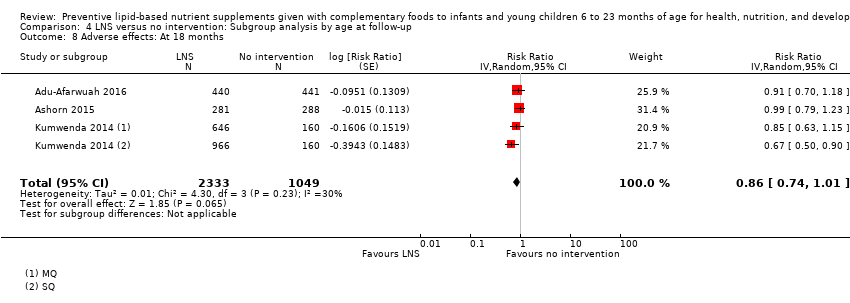
Comparison 4 LNS versus no intervention: Subgroup analysis by age at follow‐up, Outcome 8 Adverse effects: At 18 months.

Comparison 4 LNS versus no intervention: Subgroup analysis by age at follow‐up, Outcome 9 Mid‐upper arm circumference (MUAC).

Comparison 4 LNS versus no intervention: Subgroup analysis by age at follow‐up, Outcome 10 Serum haemoglobin (g/L).
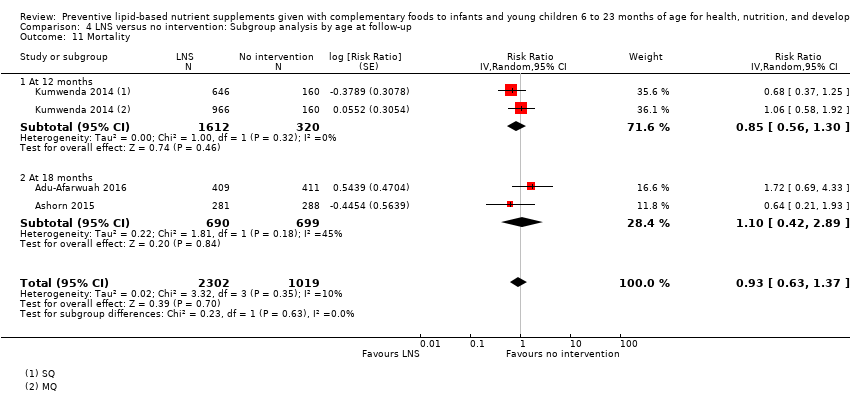
Comparison 4 LNS versus no intervention: Subgroup analysis by age at follow‐up, Outcome 11 Mortality.
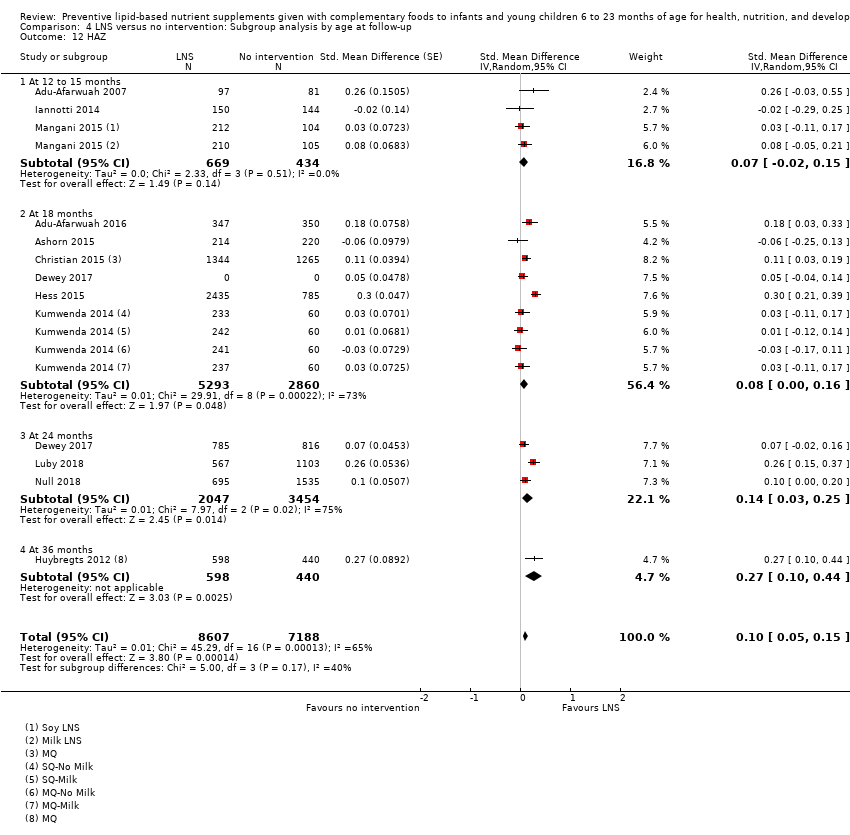
Comparison 4 LNS versus no intervention: Subgroup analysis by age at follow‐up, Outcome 12 HAZ.
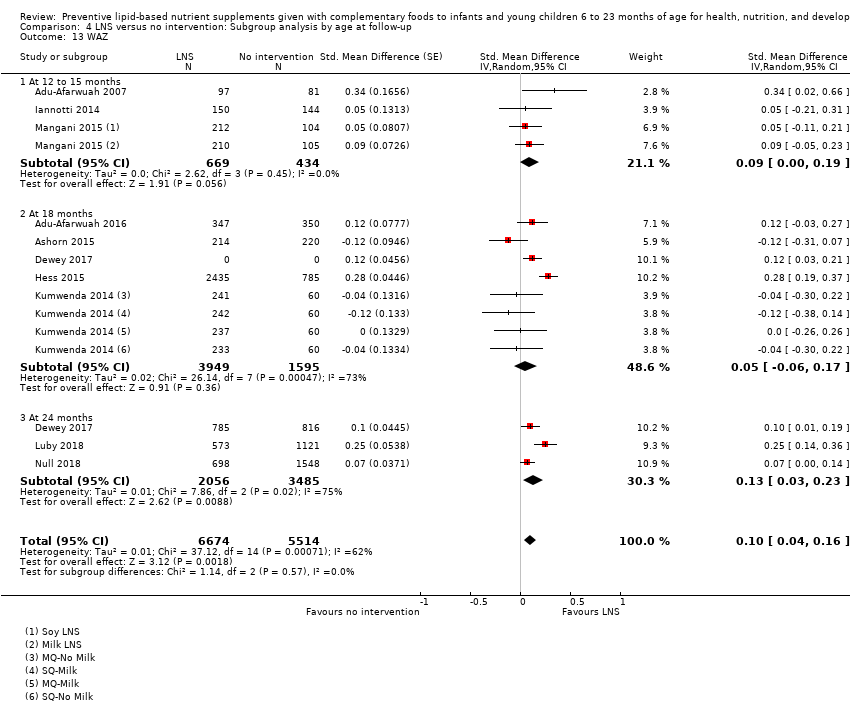
Comparison 4 LNS versus no intervention: Subgroup analysis by age at follow‐up, Outcome 13 WAZ.

Comparison 4 LNS versus no intervention: Subgroup analysis by age at follow‐up, Outcome 14 WHZ.

Comparison 5 LNS versus fortified blended food (FBF), Outcome 1 Moderate stunting.
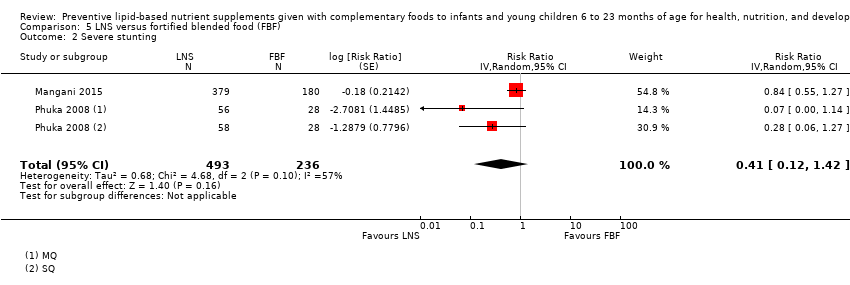
Comparison 5 LNS versus fortified blended food (FBF), Outcome 2 Severe stunting.
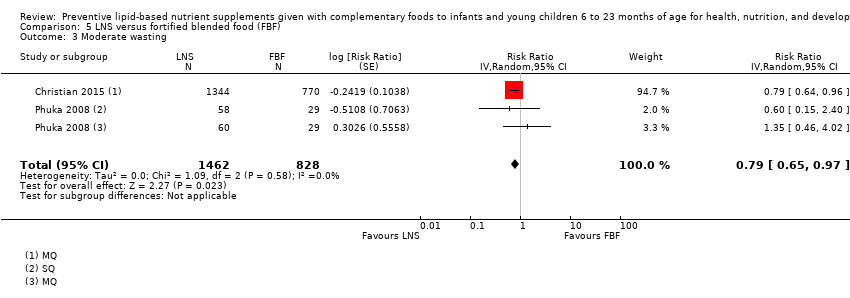
Comparison 5 LNS versus fortified blended food (FBF), Outcome 3 Moderate wasting.

Comparison 5 LNS versus fortified blended food (FBF), Outcome 4 Severe wasting.

Comparison 5 LNS versus fortified blended food (FBF), Outcome 5 Moderate underweight.
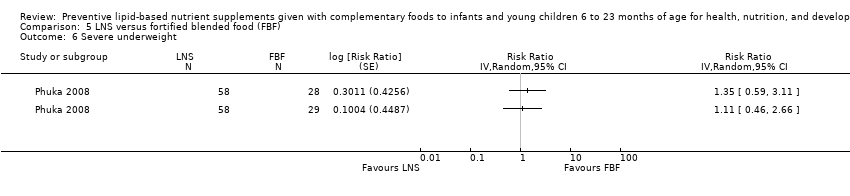
Comparison 5 LNS versus fortified blended food (FBF), Outcome 6 Severe underweight.

Comparison 5 LNS versus fortified blended food (FBF), Outcome 7 MUAC.

Comparison 5 LNS versus fortified blended food (FBF), Outcome 8 Haemoglobin (g/L).

Comparison 5 LNS versus fortified blended food (FBF), Outcome 9 HAZ.

Comparison 5 LNS versus fortified blended food (FBF), Outcome 10 WAZ.

Comparison 5 LNS versus fortified blended food (FBF), Outcome 11 WHZ.

Comparison 6 LNS versus micronutrient powders (MNP), Outcome 1 Moderate stunting.
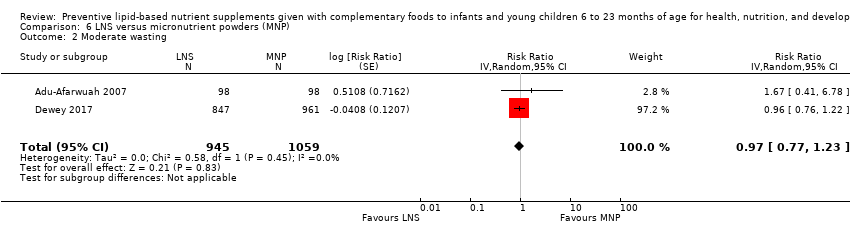
Comparison 6 LNS versus micronutrient powders (MNP), Outcome 2 Moderate wasting.

Comparison 6 LNS versus micronutrient powders (MNP), Outcome 3 Moderate underweight.

Comparison 6 LNS versus micronutrient powders (MNP), Outcome 4 Anaemia.
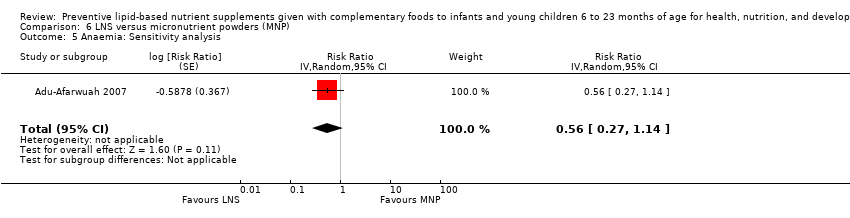
Comparison 6 LNS versus micronutrient powders (MNP), Outcome 5 Anaemia: Sensitivity analysis.

Comparison 6 LNS versus micronutrient powders (MNP), Outcome 6 Serum haemoglobin (g/L).

Comparison 6 LNS versus micronutrient powders (MNP), Outcome 7 Serum haemoglobin (g/L): Sensitivity analysis.
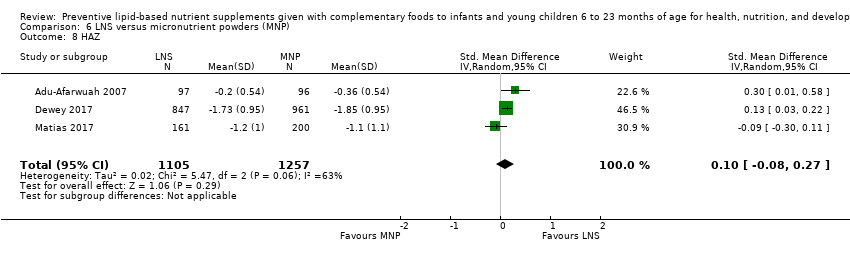
Comparison 6 LNS versus micronutrient powders (MNP), Outcome 8 HAZ.

Comparison 6 LNS versus micronutrient powders (MNP), Outcome 9 HAZ: Sensitivity analysis.

Comparison 6 LNS versus micronutrient powders (MNP), Outcome 10 WAZ.

Comparison 6 LNS versus micronutrient powders (MNP), Outcome 11 WAZ: Sensitivity analysis.

Comparison 6 LNS versus micronutrient powders (MNP), Outcome 12 WHZ.

Comparison 6 LNS versus micronutrient powders (MNP), Outcome 13 WHZ: Sensitivity analysis.
| LNS plus complementary feeding compared with no intervention | ||||||
| Patient or population: children aged 6 to 23 months Settings: community Intervention: LNS plus complementary feeding Comparison: no intervention | ||||||
| Outcomes | Illustrative comparative risks* (95% CI) | Relative effect | Number of participants | Quality of the evidence | Comments | |
| Assumed risk | Corresponding risk | |||||
| No intervention | LNS plus complementary feeding | |||||
| Stunting | ||||||
| Moderate stunting Measured as height‐for‐age z score < −2 SD Measured at 12, 18 and 24 months of age | 2618/7137 | 2353/7060 | RR 0.93 (0.88 to 0.98) | 13,372 | ⊕⊕⊕⊝ | 2 studies, Kumwenda 2014 and Mangani 2015, contributed data to multiple comparisons; total number of comparisons = 13 |
| Severe stunting Measured as height‐for‐age z score < −3 SD Measured at 12, 18 and 24 months of age | 471/4188 | 290/2868 | RR 0.85 (0.74 to 0.98) | 6151 (5 studies) | ⊕⊕⊕⊝ | 2 studies, Kumwenda 2014 and Mangani 2015, contributed data to multiple comparisons; total number of comparisons = 9 |
| Wasting | ||||||
| Moderate wasting Measured as weight‐for‐height z score < −2 SD Measured at 12, 18 and 24 months of age | 695/6213 | 624/6959 | RR 0.82 (0.74 to 0.91) | 13,172 (8 studies) | ⊕⊕⊕⊝ | 1 study, Kumwenda 2014, contributed data to 2 comparisons; total number of comparisons = 11 |
| Severe wasting Measured as weight‐for‐height z score < −3 SD Measured at 12 and 18 months of age | 18/1636 | 21/1663 | RR 1.27 (0.66 to 2.46) | 2329 (3 studies) | ⊕⊕⊕⊕ | 1 study, Kumwenda 2014, contributed data to 4 comparisons; total number of comparisons = 6 |
| Underweight | ||||||
| Moderate underweight Measured as weight‐for‐age z score < −2 SD Measured at 12, 18 and 24 months of age | 1723/7013 | 1525/6861 | RR 0.85 (0.80 to 0.91) | 13,073 (8 studies) | ⊕⊕⊕⊝ | 1 study, Kumwenda 2014, contributed data to 4 comparisons; total number of comparisons = 11 |
| Severe underweight Measured as weight‐for‐age z score < −3 SD Measured at 12 and 18 months of age | 62/1224 | 50/1258 | RR 0.78 (0.54 to 1.13) | 1729 (2 studies) | ⊕⊕⊕⊕ | 1 study, Kumwenda 2014, contributed data to 4 comparisons; total number of comparisons = 5 |
| Anaemia Measured as haemoglobin < 10 g/dL Measured at 12, 18 and 24 months of age | 697/1359 | 558/973 | RR 0.79 (0.69 to 0.90) | 2332 (5 studies) | ⊕⊕⊝⊝ | ‐ |
| Adverse effects Defined as deaths, hospitalisations, congenital abnormalities and life‐threatening conditions requiring an immediate hospital visit Assessed at 12 and 18 months of age | 314/1369 | 401/2333 | RR 0.86 (0.74 to 1.01) | 3382 (3 studies) | ⊕⊕⊕⊝ | 1 study, Kumwenda 2014, contributed data to 2 comparisons; total number of comparisons = 4 |
| *The basis for the assumed risk (e.g. the median control group risk across studies) is provided in footnotes. The corresponding risk (and its 95% CI) is based on the assumed risk in the comparison group and the relative effect of the intervention (and its 95% CI). CI: confidence interval; LNS: lipid‐based nutrient supplement; RR: risk ratio; SD: standard deviation | ||||||
| GRADE Working Group grades of evidence | ||||||
| aDowngraded one level due to study limitations: high risk of selection bias (inadequate sequence generation process) in one study (Adu‐Afarwuah 2007); high risk of performance bias in seven studies (Adu‐Afarwuah 2016; Ashorn 2015; Christian 2015; Dewey 2017; Hess 2015; Luby 2018; Null 2018); and high risk of detection bias in one study (Christian 2015). | ||||||
| LNS plus complementary feeding compared with fortified blended food (FBF) | ||||||
| Patient or population: children aged 6 to 23 months Settings: community Intervention: LNS plus complementary feeding Comparison: FBF | ||||||
| Outcomes | Illustrative comparative risks* (95% CI) | Relative effect | Number of participants | Quality of the evidence | Comments | |
| Assumed risk | Corresponding risk | |||||
| FBF | LNS plus complementary feeding | |||||
| Stunting | ||||||
| Moderate stunting Measured as height‐for‐age z score < −2 SD Measured at 12 months and 18 months of age | 461/1048 | 735/1829 | RR 0.89 (0.82 to 0.97) | 2828 | ⊕⊕⊕⊝ | 1 study, Phuka 2008, contributed data to 2 comparisons; total number of comparisons = 4 |
| Severe stunting Measured as height‐for‐age z score < −3 SD Measured at 12 months and 18 months of age | 43/292 | 53/493 | RR 0.41 (0.12 to 1.42) | 729 (2 studies) | ⊕⊕⊕⊝ | 1 study, Phuka 2008, contributed data to 2 comparisons; total number of comparisons = 3 |
| Wasting | ||||||
| Moderate wasting Measured as weight‐for‐height z score < −2 SD Measured at 12 months and 18 months of age | 145/886 | 195/1462 | RR 0.79 (0.65 to 0.97) | 2290 (2 studies) | ⊕⊕⊕⊝ | 1 study, Phuka 2008, contributed data to 2 comparisons; total number of comparisons = 3 |
| Severe wasting Measured as weight‐for‐height z score < −3 SD Measured at 12 months and 18 months of age | 5/296 | 5/497 | RR 0.64 (0.19 to 2.18) | 735 (2 studies) | ⊕⊕⊕⊝ | 1 study, Phuka 2008, contributed data to 2 comparisons; total number of comparisons = 3 |
| Underweight | ||||||
| Moderate underweight Measured as weight‐for‐age z score < −2 SD Measured at 12 months and 18 months of age | 355/876 | 478/1457 | RR 0.81 (0.73 to 0.91) | 2280 (2 studies) | ⊕⊕⊕⊝ | 1 study, Phuka 2008, contributed data to 2 comparisons; total number of comparisons = 3 |
| Severe underweight Measured as weight‐for‐age z score < −3 SD Measured at 12 months of age | 34/722 | 60/1505 | RR 1.23 (0.67 to 2.25) | 173 (1 study) | ⊕⊕⊝⊝ | 1 study, Phuka 2008, contributed data to 2 arms to this analysis; total number of comparisons = 2 |
| Anaemia | None of the included studies reported this outcome | |||||
| Adverse effects | None of the included studies reported this outcome | |||||
| *The basis for the assumed risk (e.g. the median control group risk across studies) is provided in footnotes. The corresponding risk (and its 95% CI) is based on the assumed risk in the comparison group and the relative effect of the intervention (and its 95% CI). CI: Confidence interval; LNS: lipid‐based nutrient supplements; RR: Risk Ratio; SD: Standard deviation. | ||||||
| GRADE Working Group grades of evidence | ||||||
| aDowngraded one level due to study limitations: high risk of performance bias in two studies (Christian 2015; Phuka 2008). | ||||||
| LNS plus complementary feeding compared with micronutrient powders (MNP) | ||||||
| Patient or population: children aged 6 to 23 months Settings: community Intervention: LNS plus complementary feeding Comparison: MNP | ||||||
| Outcomes | Illustrative comparative risks* (95% CI) | Relative effect | Number of participants | Quality of the evidence | Comments | |
| Assumed risk | Corresponding risk | |||||
| MNP | LNS plus complementary feeding | |||||
| Moderate stunting Measured as height‐for‐age z score < −2 SD Measured at 12 months and 24 months of age | 421/1059 | 336/945 | RR 0.92 (0.82 to 1.02) | 2365 | ⊕⊕⊕⊝ | ‐ |
| Moderate wasting Measured as weight‐for‐height z score < −2 SD Measured at 12 months and 24 months of age | 133/1059 | 115/945 | RR 0.97 (0.77 to 1.23) | 2004 | ⊕⊕⊕⊝ | ‐ |
| Moderate underweight Measured as weight‐for‐age z score < −2 SD Measured at 12 months and 24 months of age | 376/1059 | 292/945 | RR 0.88 (0.78 to 0.99) | 2004 | ⊕⊕⊕⊝ | ‐ |
| Anaemia Measured as haemoglobin < 10 g/dL Measured at 12 months of age | 18/98 | 10/98 | RR 0.38 (0.21 to 0.68) | 557 | ⊕⊕⊝⊝ | ‐ |
| Adverse effects | None of the included studies reported this outcome | |||||
| *The basis for the assumed risk (e.g. the median control group risk across studies) is provided in footnotes. The corresponding risk (and its 95% CI) is based on the assumed risk in the comparison group and the relative effect of the intervention (and its 95% CI). CI: Confidence interval; LNS: Lipid‐based nutrient supplements; RR: Risk ratio; SD: Standard deviation. | ||||||
| GRADE Working Group grades of evidence | ||||||
| aDowngraded one level due to study limitations: high risk of performance bias in two studies (Adu‐Afarwuah 2016; Dewey 2017). | ||||||
| Method | Approach |
| Measures of treatment effects | Rates If rates represent events that could occur more than once per participant, we will report the rate difference using the methodologies described in Deeks 2011. |
| Unit of analysis issues | Cluster‐randomised trials We will follow the methods described in theCochrane Handbook for Systematic Reviews of Interventions (Higgins 2011b), and adjust the sample sizes or standard errors of cluster‐randomised trials by using an estimate of the intra‐cluster correlation co‐efficient (ICC) derived from the study (if possible), from a similar trial or from a study of a similar population. If we use ICCs from other sources, we will report this in the results section, and conduct sensitivity analyses to investigate the effect of variation in the ICC. We will acknowledge heterogeneity in the randomisation unit and perform a sensitivity analysis to investigate the effects of the randomisation unit in the future updates of the review, if applicable. |
| Dealing with missing data | If we find studies with high levels of missing data, we will explore the effect in the overall assessment of treatment effect by removing such studies and conducting a sensitivity analysis. |
| Assessment of reporting bias | If we include 10 or more studies in a meta‐analysis, we will investigate reporting biases (such as publication bias) using funnel plots. We will assess funnel plot asymmetry visually, and use formal tests for funnel plot asymmetry. For continuous outcomes, we will use the test proposed by Egger 1997. For dichotomous outcomes, we will use the test proposed by Harbord 2006. If asymmetry is detected in any of these tests or is suggested by a visual assessment, we will perform exploratory analyses to investigate it. |
| Subgroup analysis and investigation of heterogeneity | We will conduct exploratory subgroup analyses on the primary outcomes, irrespective of heterogeneity, when there are more than three studies contributing data. We will conduct the following analyses.
|
| Sensitivity analysis | We will carry out a sensitivity analysis to examine:
|
| ICC: Intra‐class correlation coefficient; WHO: World Health Organization. | |
| Study | Total energy | Lipid content | Protein Content | Micronutrients |
| 108 kcal (20 g/day) | linoleic acid (1.29 g); linolenic acid (0.29 g) | Not specified | Carotene (400 μg RE); vitamin C (30 mg); folic acid (80 g); thiamine (0.3 mg); riboflavin (0.4 mg); vitamin B3 (4 mg); pantothenic acid (1.8 mg); vitamin B6 (0.3 mg); vitamin B12 (0.5 g); iron sulphate (9 mg); zinc sulphate (4 mg); calcium phosphate (100 mg); potassium (152 mg); copper sulphate (0.2 mg); sodium selenite (10 ug); potassium iodate (90 ug); phosphate (82 mg); magnesium (16 mg); manganese (0.08 mg); phytate (82 mg) | |
| 118 kcal (20 g/day) | 9.6 g | 2.6 g | Linoleic acid (4.46 g); α‐linolenic acid (0.58 g); vitamin A (400 mg retinol equivalents); thiamine (0.3 mg); riboflavin (0.4 mg); niacin (4 mg); vitamin B6 (0.3 mg); vitamin B12 (0.5 mg); vitamin C (30 mg); vitamin D (5 mg); vitamin E (6 mg); vitamin K (30 mg); folic acid (80 mg); pantothenic acid (1.8 mg); iron (6 mg); zinc (8 mg); copper (0.34 mg); calcium (280 mg); phosphorus (190 mg); potassium (200 mg); magnesium (40 mg); selenium (20 mg); iodine (90 mg); manganese (1.2 mg) | |
| 118 kcal (20 g/day) | 9.6 g | 2.6 g | Linoleic acid (4.46 g); a‐linolenic acid (0.58 g); vitamin A (400 mg RE); vitamin C (30 mg); vitamin B1 (0.3 mg); vitamin B2 (0.4 mg); niacin (4 mg); folic acid (80 mg); pantothenic acid (1.8 mg); vitamin B6 (0.3 mg); vitamin B12 (0.5 mg); vitamin D (5 mg); vitamin E (6 mg); vitamin K (30 mg); iron (6 mg); zinc (8 mg); copper (0.34 mg); calcium (280 mg); phosphorus (190 mg); potassium (200 mg); magnesium (40 mg); selenium (20 mg); iodine (90 mg); manganese (1.2 mg) | |
| 275 kcal (50 g/day) | Not specified | Not specified | Vitamin A (412 IU); vitamin D (307 IU); vitamin C (75 mg); thiamine (0.7 mg); riboflavin (1.0 mg); vitamin B12 (1.0 μg); pyridoxine (0.24 mg); niacin (10.3 mg); pantothenic acid (3.8 mg); folic acid (0.07 mg); vitamin K (0.01 mg); calcium (514 mg); phosphorus (265 mg); iron (9.5 mg); zinc (8.3 mg); copper (0.3 mg); iodine (0.07 mg); selenium (0.003 mg); magnesium (23.4 mg); phytic acid (0.425 mg2); phytic acid:iron molar ratio2 (2.1); phytic acid:zinc molar ratio2 (1.9) | |
| 250 kcal (46 g/day) | Not specified | Not specified | Not specified | |
| 118 kcal (20 g/day) | 9.6 g | 2.6 g | Linoleic acid (4.46 g); α‐linolenic acid (0.58 g); vitamin A (400 mg RE); thiamine (0.5 mg); riboflavin (0.5 mg); niacin (6 mg); folic acid (150 mg); pantothenic acid (2 mg); vitamin B6 (0.5 mg); vitamin B12 (0.9 mg); vitamin C (30 mg); vitamin D (5 mg); vitamin E (6 mg); vitamin K (30 mg); calcium (280 mg); copper (0.34 mg); iodine (90 mg); iron (9 mg); magnesium (40 mg); manganese (1.2 mg); phosphorus (190 mg); potassium (200 mg); selenium (20 mg); zinc (8 mg) | |
| 118 kcal (20 g/day) | 9.6 g | 2.6 g | Linoleic acid (4.46 g); α‐Linolenic acid (0.58 g); vitamin A (400 mg); thiamine (0.3 mg); riboflavin (0.4 mg); niacin (4 mg); pantothenic acid (1.8 mg); vitamin B6 (0.3 mg); vitamin B12 (0.5 mg); folic acid (80 mg); vitamin C (30 mg); vitamin D (5 mg); vitamin E (6 mg); vitamin K (30 mg); calcium (280 mg); copper (0.34 mg); iodine (90 mg); iron (6 mg); magnesium (40 mg); manganese (1.2 mg); phosphorus (190 mg); potassium (200 mg); selenium (20 μg); zinc (0 mg) | |
| 247 kcal (46 g/day) | 16 g | 5.9 g | Linoleic acid (2 g); α‐linolenic acid (0.3 g); vitamin A (400 mg); vitamin E (6 mg); thiamine (0.5 mg); niacin (6 mg); pantothenic acid (2 mg); vitamin B6 (0.5 mg); folic acid (160 mg); vitamin B12 (0.9 mg); vitamin C (30 mg); magnesium (60 mg); zinc (4 mg); iron (9 mg); copper (0.3 mg); potassium (310 mg); calcium (387 mg); phosphorus (275 mg); selenium (17 mg); manganese (0.17 mg); iodine (90 mg) | |
| 108 kcal (20 g/day) | 7.08 g | 2.56 g | Linoleic acid (1.29 g); α‐linoleic acid (0.29 g); vitamin A (400 mg); thiamine (0.3 mg); riboflavin (0.4 mg); niacin (4 mg); pantothenic acid (1.8 mg); vitamin B6 (0.3 mg); vitamin B12 (0.5 mg); folic acid (80 mg); vitamin C (30 mg); calcium (100 mg); copper (0.2 mg); iodine (90 mg); iron (9 mg); magnesium (16 mg); manganese (0.08 mg); phosphorus (82.2 mg); potassium (152 mg); selenium (10 mg); zinc (4 mg) | |
| 55 kcal (10 g/day) | 4.7 g | 1.3 g | Linoleic acid (2.22 g); α‐linolenic acid (0.29 g); vitamin A (400 μg RE); vitamin C (30 mg); vitamin B1 (0.3 mg); vitamin B2 (0.4 mg); niacin (4 mg); folic acid (80 μg); pantothenic acid (1.8 mg); vitamin B6 (0.3 mg); vitamin B12 (0.5 μg); vitamin D (200 IU); vitamin E (6 6 mg); vitamin K (30 μg); iron (6 mg); zinc (8 mg); copper (0.34 mg); calcium (240 mg); phosphorus (208 mg); potassium (265 mg); magnesium (50 mg); selenium (20 μg); iodine (90 μg); manganese (1.2 mg); phytate (28 mg) | |
| 17 kcal (20 g/day) | 9.5 g | 2.5 g | Linoleic acid (4.44 g); α‐linolenic acid (0.58 g); vitamin A (400 μg RE); vitamin C (30 mg); vitamin B1 (0.3 mg); vitamin B2 (0.4 mg); niacin (4 mg); folic acid (80 μg); pantothenic acid (1.8 mg); vitamin B6 (0.3 mg); vitamin B12 (0.5 μg); vitamin D (200 IU); vitamin E (6 6 mg); vitamin K (30 μg); iron (6 mg); zinc (8 mg); copper (0.34 mg); calcium (240 mg); phosphorus (208 mg); potassium (265 mg); magnesium (50 mg); selenium (20 μg); iodine (90 μg); manganese (1.2 mg); phytate (56 mg) | |
| 241 kcal (40 g/day) | 18.9 g | 5 g | Linoleic acid (8.88 g); α‐linolenic acid (1.16 g); vitamin A (400 μg RE); vitamin C (30 mg); vitamin B1 (0.3 mg); vitamin B2 (0.4 mg); niacin (4 mg); folic acid (80 μg); pantothenic acid (1.8 mg); vitamin B6 (0.3 mg); vitamin B12 (0.5 μg); vitamin D (200 IU); vitamin E (6 6 mg); vitamin K (30 μg); iron (6 mg); zinc (8 mg); copper (0.34 mg); calcium (240 mg); phosphorus (208 mg); potassium (265 mg); magnesium (50 mg); selenium (20 μg); iodine (90 μg); manganese (1.2 mg); phytate (112 mg) | |
| 118 kcal (20 g/day) | 9.6 g | 2.6 g | Linoleic acid (4.46 g); Alpha‐linolenic acid (0.58 g); Vitamin A (400 μg); Vitamin D (5 μg); Vitamin E (6 mg); Vitamin K (30 μg); Vitamin C (30 mg) Folic acid (150 μg); Thiamine (B1) (0.5 mg); Riboflavin (B2) (0.5 mg); Niacin (6 mg); Pantothenic acid (B5) (2 mg); Vitamin B6 (0.5 mg); Vitamin B12 (0.9 μg); Calcium (280 mg); Copper (0.34 mg); Iodine (90 μg); Iron (9 mg); Magnesium (40 mg); Manganese (1.2 mg); Phosphorous (190 mg); Potassium (200 mg); Selenium (20 μg); Zinc (8 mg) | |
| Milk‐LNS 284.8 kcal (54 g/day) | 17.9 g | 8.2 g | Retinol (400 μg RE); folate (160 μg); niacin (6 mg); pantothenic acid (2 mg); riboflavin (0.5 mg); thiamine (0.5 mg); vitamin B6 (0.5 mg); vitamin B12 (0.9 μg); vitamin C (30 mg); vitamin D (5 μg); calcium (366 mg); copper (0.4 mg); iodine (90 μg); iron (6 mg); magnesium (78.5 mg); selenium (20 μg); zinc (6.0 mg); phosphorus (185.6 mg); potassium (318.6 mg); manganese (0.60 mg) | |
| Soy‐LNS 276.1 kcal (54 g/day) | 18.5 g | 7.5 g | Retinol (400 μg RE); folate (160 μg); niacin (6 mg); pantothenic acid (2 mg); riboflavin (0.5 mg); thiamine (0.5 mg); vitamin B6 (0.5 mg); vitamin B12 (0.9 μg); vitamin C (30 mg); vitamin D (5 μg); calcium (366 mg); copper (0.4 mg); iodine (90 μg); iron (6 mg); magnesium (78.5 mg); selenium (20 μg); zinc (6.0 mg); phosphorus (185.6 mg); potassium (307.3 mg); manganese (0.60 mg) | |
| 110 kcal (20 g/day) | 7 g | 2.6 g | Linoleic acid (1.29 g); α‐linolenic acid (0.29 g); folic acid (80 μg); niacin (4 mg); pantothenic acid (1.8 mg); riboflavin (0.4 mg); thiamine (0.3 mg); vitamin A (400 μg); vitamin B12 (0.5 μg); vitamin B6 (0.3 mg); vitamin C (30 mg); calcium (100 mg); copper (0.2 mg); iodine (90 μg); iron (9 mg); magnesium (16 mg); manganese (0,08 mg); phosphorous (82 mg); potassium (152 mg); selenium (10 μg); zinc (4 mg) | |
| 118 kcal (20 g/day) | 9.6 g | 2.6 g | Linoleic acid (4.46 g); Alpha‐linolenic acid (0.58 g); Vitamin A (400 μg); Vitamin D (5 μg); Vitamin E (6 mg); Vitamin K (30 μg); Vitamin C (30 mg) Folic acid (150 μg); Thiamine (B1) (0.5 mg); Riboflavin (B2) (0.5 mg); Niacin (6 mg); Pantothenic acid (B5) (2 mg); Vitamin B6 (0.5 mg); Vitamin B12 (0.9 μg); Calcium (280 mg); Copper (0.34 mg); Iodine (90 μg); Iron (9 mg); Magnesium (40 mg); Manganese (1.2 mg); Phosphorous (190 mg); Potassium (200 mg); Selenium (20 μg); Zinc (8 mg) | |
| 118 kcal (20 g/day) | 9.6 g | 2.6 g | Linoleic acid (4.5 g); α‐linolenic acid (0.6 g); vitamin A (400 μg); vitamin C (30 mg); vitamin D (5 mg); vitamin E (6 mg); vitamin K (30 mg); thiamine (0.5 mg); riboflavin (0.5 mg); niacin (6 mg); pantothenic acid (2 mg); vitamin B6 (0.5 mg); folic acid (150 μg); vitamin B12 (0.9 μg); iron (9 mg); zinc (8 mg); copper (0.3 mg); selenium (20 μg); iodine (90 μg); calcium (280 mg); magnesium (40 mg); manganese (1.2 mg); phosphorus (190 mg); potassium (200 mg) | |
| 130 kcal (25 g/day) | 8.3 g | 3.8 g | Retinol (400 mg RE); folate (160 mg); niacin (6 mg); pantothenic acid (2 mg); riboflavin (0.5 mg); thiamine (0.5 mg); vitamin B 6 (0.5 mg); vitamin B12 (0.9 mg); vitamin C (30 mg); vitamin D (5 mg); calcium (283 mg); copper (0.5 mg); iodine (90 mg); iron (8 mg); magnesium (60 mg); selenium (17 mg); zinc (8.4 mg) | |
| 264 kcal (50 g/day) | 16.5 g | 7.6 g | Retinol (400 mg RE); folate (160 mg); niacin (6 mg); pantothenic acid (2 mg); riboflavin (0.5 mg); thiamine (0.5 mg); vitamin B6 (0.5 mg); vitamin B12 (0.9 mg); vitamin C (30 mg); vitamin D (5 mg); calcium (366 mg); copper (0.4 mg); iodine (90 mg); iron (8 mg); magnesium (60 mg); selenium (17 mg); zinc (8.4 mg) | |
| 247 kcal (46.4 g/day) | 16 g | 5.9 g | Vitamin A (400 μg); vitamin B12 (0.9 μg); iron (9 mg); zinc (9 mg) | |
| g: gram; | ||||
| Outcome or subgroup title | No. of studies | No. of participants | Statistical method | Effect size |
| 1 Moderate stunting Show forest plot | 9 | 13372 | Risk Ratio (Random, 95% CI) | 0.93 [0.88, 0.98] |
| 2 Severe stunting Show forest plot | 5 | 6151 | Risk Ratio (Random, 95% CI) | 0.85 [0.74, 0.98] |
| 3 Moderate stunting: Sensitivity analysis Show forest plot | 7 | Risk Ratio (Random, 95% CI) | 0.92 [0.88, 0.96] | |
| 4 Severe stunting: Sensitivity analysis Show forest plot | 4 | Risk Ratio (Random, 95% CI) | 0.84 [0.73, 0.97] | |
| 5 Moderate wasting Show forest plot | 8 | 13172 | Risk Ratio (Random, 95% CI) | 0.82 [0.74, 0.91] |
| 6 Severe wasting Show forest plot | 3 | 2329 | Risk Ratio (Random, 95% CI) | 1.27 [0.66, 2.46] |
| 7 Moderate wasting: Sensitivity analysis Show forest plot | 6 | Risk Ratio (Random, 95% CI) | 0.81 [0.73, 0.90] | |
| 8 Severe wasting: Sensitivity analysis Show forest plot | 2 | Risk Ratio (Random, 95% CI) | 1.24 [0.61, 2.51] | |
| 9 Moderate underweight Show forest plot | 8 | 13073 | Risk Ratio (Random, 95% CI) | 0.85 [0.80, 0.91] |
| 10 Severe underweight Show forest plot | 2 | 1729 | Risk Ratio (Random, 95% CI) | 0.78 [0.54, 1.13] |
| 11 Moderate underweight: Sensitivity analysis Show forest plot | 6 | Risk Ratio (Random, 95% CI) | 0.85 [0.80, 0.90] | |
| 12 Severe underweight: Sensitivity analysis Show forest plot | 1 | Risk Ratio (Random, 95% CI) | 0.79 [0.54, 1.16] | |
| 13 Anaemia Show forest plot | 5 | 2332 | Risk Ratio (Random, 95% CI) | 0.79 [0.69, 0.90] |
| 14 Adverse effects Show forest plot | 3 | 3382 | Risk Ratio (Random, 95% CI) | 0.86 [0.74, 1.01] |
| 15 Adverse effects: Sensitivity analysis Show forest plot | 1 | 1932 | Risk Ratio (Random, 95% CI) | 0.76 [0.60, 0.95] |
| 16 Mid‐upper arm circumference (MUAC) Show forest plot | 6 | 8187 | Std. Mean Difference (Random, 95% CI) | 0.13 [0.05, 0.22] |
| 17 Serum haemoglobin (g/L) Show forest plot | 4 | 4518 | Mean Difference (Random, 95% CI) | 5.78 [2.27, 9.30] |
| 18 Mortality Show forest plot | 3 | 3321 | Risk Ratio (Random, 95% CI) | 0.93 [0.63, 1.37] |
| 19 HAZ Show forest plot | 12 | 15795 | Std. Mean Difference (Random, 95% CI) | 0.11 [0.05, 0.16] |
| 20 WAZ Show forest plot | 10 | 12188 | Std. Mean Difference (Random, 95% CI) | 0.09 [0.02, 0.16] |
| 21 WHZ Show forest plot | 10 | 12894 | Std. Mean Difference (Random, 95% CI) | 0.08 [0.04, 0.13] |
| Outcome or subgroup title | No. of studies | No. of participants | Statistical method | Effect size |
| 1 Severe stunting Show forest plot | 5 | 6151 | Risk Ratio (Random, 95% CI) | 0.85 [0.74, 0.98] |
| 1.1 SQ LNS | 4 | 4956 | Risk Ratio (Random, 95% CI) | 0.83 [0.70, 0.99] |
| 1.2 MQ LNS | 2 | 1195 | Risk Ratio (Random, 95% CI) | 0.88 [0.69, 1.12] |
| 2 Moderate stunting Show forest plot | 9 | 13372 | Risk Ratio (Random, 95% CI) | 0.93 [0.88, 0.98] |
| 2.1 SQ LNS | 7 | 9710 | Risk Ratio (Random, 95% CI) | 0.92 [0.84, 1.00] |
| 2.2 MQ LNS | 3 | 3662 | Risk Ratio (Random, 95% CI) | 0.94 [0.88, 1.02] |
| 3 Moderate wasting Show forest plot | 8 | 13172 | Risk Ratio (Random, 95% CI) | 0.82 [0.74, 0.91] |
| 3.1 SQ LNS | 7 | 9903 | Risk Ratio (Random, 95% CI) | 0.83 [0.73, 0.95] |
| 3.2 MQ LNS | 2 | 3269 | Risk Ratio (Random, 95% CI) | 0.78 [0.63, 0.96] |
| 4 Severe wasting Show forest plot | 3 | 2329 | Risk Ratio (Random, 95% CI) | 1.27 [0.66, 2.46] |
| 4.1 SQ LNS | 2 | 1106 | Risk Ratio (Random, 95% CI) | 1.74 [0.73, 4.15] |
| 4.2 MQ LNS | 2 | 1223 | Risk Ratio (Random, 95% CI) | 0.84 [0.31, 2.30] |
| 5 Moderate underweight Show forest plot | 8 | 13073 | Risk Ratio (Random, 95% CI) | 0.85 [0.80, 0.91] |
| 5.1 SQ LNS | 7 | 9880 | Risk Ratio (Random, 95% CI) | 0.88 [0.80, 0.96] |
| 5.2 MQ LNS | 2 | 3193 | Risk Ratio (Random, 95% CI) | 0.83 [0.76, 0.92] |
| 6 Severe underweight Show forest plot | 2 | 1729 | Risk Ratio (Random, 95% CI) | 0.78 [0.54, 1.13] |
| 6.1 SQ LNS | 2 | 1083 | Risk Ratio (Random, 95% CI) | 0.84 [0.52, 1.37] |
| 6.2 MQ LNS | 1 | 646 | Risk Ratio (Random, 95% CI) | 0.71 [0.41, 1.24] |
| 7 Anaemia Show forest plot | 5 | 2332 | Risk Ratio (M‐H, Random, 95% CI) | 0.79 [0.69, 0.90] |
| 7.1 SQ LNS | 3 | 1107 | Risk Ratio (M‐H, Random, 95% CI) | 0.63 [0.43, 0.93] |
| 7.2 MQ LNS | 2 | 1225 | Risk Ratio (M‐H, Random, 95% CI) | 0.86 [0.78, 0.94] |
| 8 Adverse effects Show forest plot | 3 | 3382 | Risk Ratio (Random, 95% CI) | 0.86 [0.74, 1.01] |
| 8.1 SQ LNS | 3 | 2576 | Risk Ratio (Random, 95% CI) | 0.86 [0.69, 1.06] |
| 8.2 MQ LNS | 1 | 806 | Risk Ratio (Random, 95% CI) | 0.85 [0.63, 1.15] |
| 9 Mid‐upper arm circumference (MUAC) Show forest plot | 6 | 8187 | Std. Mean Difference (Random, 95% CI) | 0.13 [0.05, 0.22] |
| 9.1 SQ LNS | 5 | 6546 | Std. Mean Difference (Random, 95% CI) | 0.12 [‐0.00, 0.24] |
| 9.2 MQ LNS | 2 | 1641 | Std. Mean Difference (Random, 95% CI) | 0.17 [0.08, 0.26] |
| 10 Serum haemoglobin (g/L) Show forest plot | 4 | 4518 | Mean Difference (IV, Random, 95% CI) | 5.78 [2.27, 9.30] |
| 10.1 SQ LNS | 2 | 3293 | Mean Difference (IV, Random, 95% CI) | 8.95 [7.66, 10.23] |
| 10.2 MQ LNS | 2 | 1225 | Mean Difference (IV, Random, 95% CI) | 3.01 [2.73, 3.28] |
| 11 Mortality Show forest plot | 3 | 3321 | Risk Ratio (Random, 95% CI) | 0.93 [0.63, 1.37] |
| 11.1 SQ LNS | 3 | 2195 | Risk Ratio (Random, 95% CI) | 0.88 [0.49, 1.60] |
| 11.2 MQ LNS | 1 | 1126 | Risk Ratio (Random, 95% CI) | 1.06 [0.58, 1.92] |
| 12 HAZ Show forest plot | 12 | 15795 | Std. Mean Difference (Random, 95% CI) | 0.11 [0.05, 0.16] |
| 12.1 SQ LNS | 9 | 10919 | Std. Mean Difference (Random, 95% CI) | 0.12 [0.04, 0.20] |
| 12.2 MQ LNS | 4 | 4876 | Std. Mean Difference (Random, 95% CI) | 0.08 [0.01, 0.15] |
| 13 WHZ Show forest plot | 10 | 12894 | Std. Mean Difference (Random, 95% CI) | 0.08 [0.04, 0.13] |
| 13.1 SQ LNS | 8 | 10631 | Std. Mean Difference (Random, 95% CI) | 0.08 [0.02, 0.15] |
| 13.2 MQ LNS | 3 | 2263 | Std. Mean Difference (Random, 95% CI) | 0.07 [0.00, 0.14] |
| 14 WAZ Show forest plot | 10 | 12188 | Std. Mean Difference (Random, 95% CI) | 0.09 [0.02, 0.16] |
| 14.1 SQ LNS | 9 | 10959 | Std. Mean Difference (Random, 95% CI) | 0.11 [0.02, 0.19] |
| 14.2 MQ LNS | 2 | 1229 | Std. Mean Difference (Random, 95% CI) | 0.05 [‐0.04, 0.14] |
| Outcome or subgroup title | No. of studies | No. of participants | Statistical method | Effect size |
| 1 Moderate stunting Show forest plot | 9 | 13372 | Risk Ratio (Random, 95% CI) | 0.93 [0.88, 0.98] |
| 1.1 6 to 12 months | 6 | 7871 | Risk Ratio (Random, 95% CI) | 0.96 [0.89, 1.03] |
| 1.2 More than 12 months | 3 | 5501 | Risk Ratio (Random, 95% CI) | 0.89 [0.81, 0.97] |
| 2 Severe stunting Show forest plot | 5 | 6151 | Risk Ratio (Random, 95% CI) | 0.85 [0.74, 0.98] |
| 2.1 6 to 12 months | 3 | 2251 | Risk Ratio (Random, 95% CI) | 0.89 [0.74, 1.07] |
| 2.2 More than 12 months | 2 | 3900 | Risk Ratio (Random, 95% CI) | 0.80 [0.64, 0.99] |
| 3 Moderate wasting Show forest plot | 8 | 13172 | Risk Ratio (Random, 95% CI) | 0.82 [0.74, 0.91] |
| 3.1 6 to 12 months | 5 | 7669 | Risk Ratio (Random, 95% CI) | 0.81 [0.72, 0.92] |
| 3.2 More than 12 months | 3 | 5503 | Risk Ratio (Random, 95% CI) | 0.83 [0.69, 0.99] |
| 4 Severe wasting: 6 to 12 months Show forest plot | 3 | 2329 | Risk Ratio (Random, 95% CI) | 1.27 [0.66, 2.46] |
| 5 Moderate underweight Show forest plot | 8 | 13073 | Risk Ratio (Random, 95% CI) | 0.85 [0.80, 0.91] |
| 5.1 6 to 12 months | 5 | 7532 | Risk Ratio (Random, 95% CI) | 0.87 [0.78, 0.97] |
| 5.2 More than 12 months | 3 | 5541 | Risk Ratio (Random, 95% CI) | 0.87 [0.79, 0.95] |
| 6 Severe underweight: 6 to 12 months Show forest plot | 2 | 1729 | Risk Ratio (Random, 95% CI) | 0.78 [0.54, 1.13] |
| 7 Anaemia Show forest plot | 5 | 2332 | Risk Ratio (M‐H, Random, 95% CI) | 0.79 [0.69, 0.90] |
| 7.1 Upto 6 months | 2 | 1176 | Risk Ratio (M‐H, Random, 95% CI) | 0.55 [0.20, 1.47] |
| 7.2 6 to 12 months | 2 | 627 | Risk Ratio (M‐H, Random, 95% CI) | 0.84 [0.71, 1.00] |
| 7.3 More than 12 months | 1 | 529 | Risk Ratio (M‐H, Random, 95% CI) | 0.70 [0.55, 0.88] |
| 8 Adverse effects Show forest plot | 3 | 3382 | Risk Ratio (Random, 95% CI) | 0.86 [0.74, 1.01] |
| 9 Mid‐upper arm circumference (MUAC) Show forest plot | 6 | 8187 | Std. Mean Difference (Random, 95% CI) | 0.13 [0.05, 0.22] |
| 9.1 Upto 6 months | 2 | 1472 | Std. Mean Difference (Random, 95% CI) | 0.06 [‐0.23, 0.35] |
| 9.2 6 to 12 months | 3 | 5114 | Std. Mean Difference (Random, 95% CI) | 0.18 [0.10, 0.26] |
| 9.3 More than 12 months | 1 | 1601 | Std. Mean Difference (Random, 95% CI) | 0.04 [‐0.04, 0.12] |
| 10 Serum haemoglobin (g/L) Show forest plot | 4 | 4518 | Mean Difference (IV, Random, 95% CI) | 5.78 [2.27, 9.30] |
| 10.1 Upto 6 months | 2 | 1176 | Mean Difference (IV, Random, 95% CI) | 5.58 [0.52, 10.64] |
| 10.2 6 to 12 months | 2 | 3342 | Mean Difference (IV, Random, 95% CI) | 5.96 [0.08, 11.84] |
| 11 Mortality Show forest plot | 3 | 3321 | Risk Ratio (Random, 95% CI) | 0.93 [0.63, 1.37] |
| 11.1 6 to 12 months | 3 | 3321 | Risk Ratio (Random, 95% CI) | 0.93 [0.63, 1.37] |
| 12 HAZ Show forest plot | 12 | 15795 | Std. Mean Difference (Random, 95% CI) | 0.11 [0.05, 0.16] |
| 12.1 Upto 6 months | 3 | 1510 | Std. Mean Difference (Random, 95% CI) | 0.19 [0.01, 0.36] |
| 12.2 6 to 12 months | 6 | 8784 | Std. Mean Difference (Random, 95% CI) | 0.08 [0.00, 0.15] |
| 12.3 More than 12 months | 3 | 5501 | Std. Mean Difference (Random, 95% CI) | 0.14 [0.03, 0.25] |
| 13 WAZ Show forest plot | 10 | 12188 | Std. Mean Difference (Random, 95% CI) | 0.09 [0.02, 0.16] |
| 13.1 Upto 6 months | 3 | 1103 | Std. Mean Difference (Random, 95% CI) | 0.09 [‐0.00, 0.19] |
| 13.2 6 to 12 months | 4 | 5544 | Std. Mean Difference (Random, 95% CI) | 0.03 [‐0.12, 0.18] |
| 13.3 More than 12 months | 3 | 5541 | Std. Mean Difference (Random, 95% CI) | 0.13 [0.03, 0.24] |
| 14 WHZ Show forest plot | 10 | 12894 | Std. Mean Difference (Random, 95% CI) | 0.08 [0.04, 0.13] |
| 14.1 Upto 6 months | 2 | 1216 | Std. Mean Difference (Random, 95% CI) | 0.13 [‐0.12, 0.38] |
| 14.2 6 to 12 months | 5 | 6175 | Std. Mean Difference (Random, 95% CI) | 0.07 [0.00, 0.14] |
| 14.3 More than 12 months | 3 | 5503 | Std. Mean Difference (Random, 95% CI) | 0.09 [0.01, 0.17] |
| Outcome or subgroup title | No. of studies | No. of participants | Statistical method | Effect size |
| 1 Moderate stunting Show forest plot | 9 | 13492 | Risk Ratio (Random, 95% CI) | 0.93 [0.88, 0.98] |
| 1.1 At 12 months | 1 | 564 | Risk Ratio (Random, 95% CI) | 1.01 [0.86, 1.19] |
| 1.2 At 18 months | 6 | 7427 | Risk Ratio (Random, 95% CI) | 0.95 [0.88, 1.02] |
| 1.3 At 24 months | 3 | 5501 | Risk Ratio (Random, 95% CI) | 0.89 [0.81, 0.97] |
| 2 Severe stunting Show forest plot | 5 | 6151 | Risk Ratio (Random, 95% CI) | 0.85 [0.74, 0.98] |
| 2.1 At 12 months | 1 | 564 | Risk Ratio (Random, 95% CI) | 0.96 [0.67, 1.38] |
| 2.2 At 18 months | 2 | 1687 | Risk Ratio (Random, 95% CI) | 0.86 [0.70, 1.07] |
| 2.3 At 24 months | 2 | 3900 | Risk Ratio (Random, 95% CI) | 0.80 [0.64, 0.99] |
| 3 Moderate wasting Show forest plot | 8 | 13172 | Risk Ratio (Random, 95% CI) | 0.80 [0.73, 0.88] |
| 3.1 At 18 months | 6 | 7669 | Risk Ratio (Random, 95% CI) | 0.79 [0.71, 0.89] |
| 3.2 At 24 months | 3 | 5503 | Risk Ratio (Random, 95% CI) | 0.83 [0.69, 0.99] |
| 4 Severe wasting Show forest plot | 3 | 2329 | Risk Ratio (Random, 95% CI) | 1.27 [0.66, 2.46] |
| 4.1 At 12 months | 1 | 563 | Risk Ratio (Random, 95% CI) | 0.78 [0.12, 4.93] |
| 4.2 At 18 months | 2 | 1766 | Risk Ratio (Random, 95% CI) | 1.39 [0.67, 2.87] |
| 5 Moderate underweight Show forest plot | 8 | 13073 | Risk Ratio (Random, 95% CI) | 0.85 [0.81, 0.90] |
| 5.1 At 18 months | 6 | 7532 | Risk Ratio (Random, 95% CI) | 0.85 [0.78, 0.92] |
| 5.2 At 24 months | 3 | 5541 | Risk Ratio (Random, 95% CI) | 0.87 [0.79, 0.95] |
| 6 Severe underweight: at 18 months Show forest plot | 2 | 1729 | Risk Ratio (Random, 95% CI) | 0.78 [0.54, 1.13] |
| 7 Anaemia Show forest plot | 5 | 2332 | Risk Ratio (M‐H, Random, 95% CI) | 0.79 [0.69, 0.90] |
| 7.1 At 12 months | 2 | 1176 | Risk Ratio (M‐H, Random, 95% CI) | 0.55 [0.20, 1.47] |
| 7.2 At 18 months | 3 | 1156 | Risk Ratio (M‐H, Random, 95% CI) | 0.80 [0.71, 0.91] |
| 7.3 At 36 months | 0 | 0 | Risk Ratio (M‐H, Random, 95% CI) | 0.0 [0.0, 0.0] |
| 8 Adverse effects: At 18 months Show forest plot | 3 | 3382 | Risk Ratio (Random, 95% CI) | 0.86 [0.74, 1.01] |
| 9 Mid‐upper arm circumference (MUAC) Show forest plot | 6 | 8187 | Std. Mean Difference (Random, 95% CI) | 0.13 [0.05, 0.22] |
| 9.1 At 12 months | 1 | 1193 | Std. Mean Difference (Random, 95% CI) | 0.15 [0.06, 0.24] |
| 9.2 At 18 months | 3 | 4355 | Std. Mean Difference (Random, 95% CI) | 0.12 [‐0.11, 0.34] |
| 9.3 At 24 months | 1 | 1601 | Std. Mean Difference (Random, 95% CI) | 0.04 [‐0.04, 0.12] |
| 9.4 At 36 months | 1 | 1038 | Std. Mean Difference (Random, 95% CI) | 0.2 [0.06, 0.34] |
| 10 Serum haemoglobin (g/L) Show forest plot | 4 | 4518 | Mean Difference (IV, Random, 95% CI) | 5.78 [2.27, 9.30] |
| 10.1 At 12 months | 1 | 194 | Mean Difference (IV, Random, 95% CI) | 8.5 [4.46, 12.54] |
| 10.2 At 18 months | 2 | 3342 | Mean Difference (IV, Random, 95% CI) | 5.96 [0.08, 11.84] |
| 10.3 At 36 months | 1 | 982 | Mean Difference (IV, Random, 95% CI) | 3.30 [1.42, 5.18] |
| 11 Mortality Show forest plot | 3 | 3321 | Risk Ratio (Random, 95% CI) | 0.93 [0.63, 1.37] |
| 11.1 At 12 months | 1 | 1932 | Risk Ratio (Random, 95% CI) | 0.85 [0.56, 1.30] |
| 11.2 At 18 months | 2 | 1389 | Risk Ratio (Random, 95% CI) | 1.10 [0.42, 2.89] |
| 12 HAZ Show forest plot | 12 | 15795 | Std. Mean Difference (Random, 95% CI) | 0.10 [0.05, 0.15] |
| 12.1 At 12 to 15 months | 3 | 1103 | Std. Mean Difference (Random, 95% CI) | 0.07 [‐0.02, 0.15] |
| 12.2 At 18 months | 6 | 8153 | Std. Mean Difference (Random, 95% CI) | 0.08 [0.00, 0.16] |
| 12.3 At 24 months | 3 | 5501 | Std. Mean Difference (Random, 95% CI) | 0.14 [0.03, 0.25] |
| 12.4 At 36 months | 1 | 1038 | Std. Mean Difference (Random, 95% CI) | 0.27 [0.10, 0.44] |
| 13 WAZ Show forest plot | 10 | 12188 | Std. Mean Difference (Random, 95% CI) | 0.10 [0.04, 0.16] |
| 13.1 At 12 to 15 months | 3 | 1103 | Std. Mean Difference (Random, 95% CI) | 0.09 [‐0.00, 0.19] |
| 13.2 At 18 months | 5 | 5544 | Std. Mean Difference (Random, 95% CI) | 0.05 [‐0.06, 0.17] |
| 13.3 At 24 months | 3 | 5541 | Std. Mean Difference (Random, 95% CI) | 0.13 [0.03, 0.23] |
| 14 WHZ Show forest plot | 10 | 12894 | Std. Mean Difference (Random, 95% CI) | 0.12 [0.02, 0.22] |
| 14.1 At 12 to 15 months | 2 | 809 | Std. Mean Difference (Random, 95% CI) | 0.10 [‐0.02, 0.22] |
| 14.2 At 18 months | 5 | 5544 | Std. Mean Difference (Random, 95% CI) | 0.13 [‐0.05, 0.31] |
| 14.3 At 24 months | 3 | 5503 | Std. Mean Difference (Random, 95% CI) | 0.09 [0.01, 0.17] |
| 14.4 At 36 months | 1 | 1038 | Std. Mean Difference (Random, 95% CI) | 0.04 [‐0.08, 0.16] |
| Outcome or subgroup title | No. of studies | No. of participants | Statistical method | Effect size |
| 1 Moderate stunting Show forest plot | 3 | 2828 | Risk Ratio (Random, 95% CI) | 0.89 [0.82, 0.97] |
| 2 Severe stunting Show forest plot | 2 | 729 | Risk Ratio (Random, 95% CI) | 0.41 [0.12, 1.42] |
| 3 Moderate wasting Show forest plot | 2 | 2290 | Risk Ratio (Random, 95% CI) | 0.79 [0.65, 0.97] |
| 4 Severe wasting Show forest plot | 2 | 735 | Risk Ratio (Random, 95% CI) | 0.64 [0.19, 2.18] |
| 5 Moderate underweight Show forest plot | 2 | 2280 | Risk Ratio (Random, 95% CI) | 0.81 [0.73, 0.91] |
| 6 Severe underweight Show forest plot | 1 | Risk Ratio (Random, 95% CI) | Totals not selected | |
| 7 MUAC Show forest plot | 2 | 1512 | Std. Mean Difference (IV, Random, 95% CI) | 0.02 [‐0.08, 0.12] |
| 8 Haemoglobin (g/L) Show forest plot | 1 | 182 | Mean Difference (IV, Random, 95% CI) | 0.29 [‐6.00, 6.59] |
| 9 HAZ Show forest plot | 4 | 4047 | Std. Mean Difference (IV, Random, 95% CI) | 0.06 [0.00, 0.13] |
| 10 WAZ Show forest plot | 3 | 1933 | Mean Difference (IV, Random, 95% CI) | 0.05 [‐0.04, 0.14] |
| 11 WHZ Show forest plot | 3 | 1933 | Std. Mean Difference (IV, Random, 95% CI) | 0.07 [‐0.02, 0.16] |
| Outcome or subgroup title | No. of studies | No. of participants | Statistical method | Effect size |
| 1 Moderate stunting Show forest plot | 3 | 2365 | Risk Ratio (Random, 95% CI) | 0.92 [0.82, 1.02] |
| 2 Moderate wasting Show forest plot | 2 | 2004 | Risk Ratio (Random, 95% CI) | 0.97 [0.77, 1.23] |
| 3 Moderate underweight Show forest plot | 2 | 2004 | Risk Ratio (Random, 95% CI) | 0.88 [0.78, 0.99] |
| 4 Anaemia Show forest plot | 2 | 557 | Risk Ratio (Random, 95% CI) | 0.38 [0.21, 0.68] |
| 5 Anaemia: Sensitivity analysis Show forest plot | 1 | Risk Ratio (Random, 95% CI) | 0.56 [0.27, 1.14] | |
| 6 Serum haemoglobin (g/L) Show forest plot | 2 | 557 | Mean Difference (Random, 95% CI) | 5.13 [2.00, 8.26] |
| 7 Serum haemoglobin (g/L): Sensitivity analysis Show forest plot | 1 | Mean Difference (Random, 95% CI) | 3.6 [‐0.13, 7.33] | |
| 8 HAZ Show forest plot | 3 | 2362 | Std. Mean Difference (IV, Random, 95% CI) | 0.10 [‐0.08, 0.27] |
| 9 HAZ: Sensitivity analysis Show forest plot | 2 | 2001 | Std. Mean Difference (IV, Random, 95% CI) | 0.16 [0.03, 0.28] |
| 10 WAZ Show forest plot | 3 | 2362 | Std. Mean Difference (IV, Random, 95% CI) | 0.12 [0.02, 0.21] |
| 11 WAZ: Sensitivity analysis Show forest plot | 2 | 2001 | Std. Mean Difference (IV, Random, 95% CI) | 0.14 [0.05, 0.23] |
| 12 WHZ Show forest plot | 3 | 2362 | Std. Mean Difference (IV, Random, 95% CI) | 0.05 [‐0.06, 0.17] |
| 13 WHZ: Sensitivity analysis Show forest plot | 2 | 2001 | Std. Mean Difference (IV, Random, 95% CI) | 0.10 [0.01, 0.18] |