Altering the availability or proximity of food, alcohol and tobacco products to change their selection and consumption
Abstract
This is a protocol for a Cochrane Review (Intervention). The objectives are as follows:
1. To assess the impact of altering the availability or proximity of: a) food products (including non‐alcoholic beverages); b) alcohol products; and c) tobacco products on their selection or consumption.
2. For each of the above products, to assess the extent to which the impact of such interventions is modified by: i) study characteristics; ii) intervention characteristics; and iii) participant characteristics.
Background
Description of the condition
Non‐communicable diseases, principally cardiovascular diseases, diabetes, certain forms of cancer and chronic respiratory diseases, accounted for an estimated 68% of all deaths worldwide in 2012 (WHO 2016). Major risk factors for non‐communicable diseases include metabolic and dietary risk factors linked to food consumption (e.g. high body mass index, high systolic blood pressure), as well as smoking and alcohol use – risks that are, in principle, modifiable. These are also amongst the most significant risk factors for total disease burden, both globally and in high‐income countries specifically (GBD 2016). Identifying interventions that are effective in achieving sustained health behaviour change across populations and countries is therefore one of the most important public health challenges of the 21st century.
Description of the intervention
It is increasingly recognised that the physical environments that surround us can exert considerable influences on our health‐related behaviours and that altering these environments may provide a catalyst for behaviour change (Das 2012; Marteau 2012). In a recent systematic scoping review, we described a set of interventions that involve altering small‐scale physical environments – or micro‐environments ‐ with the intention of changing health‐related behaviours (Hollands 2013a; Hollands 2013b). Such interventions, which have also been described as 'choice architecture' (or 'nudge') interventions, involve changing characteristics of environments where people may select or consume food, alcohol or tobacco including restaurants, workplaces, schools, homes, bars, pubs, supermarkets or shops. These interventions have received increased policy and research interest in recent years as a result of several factors, including shifts in theoretical understanding, and some supportive empirical evidence (Marteau 2015). Their standing has also likely been influenced by political acceptability (with governments preferring ‘light‐touch’ rather than legislative or regulatory approaches) and public acceptability (with preliminary evidence suggesting these types of interventions are relatively acceptable (Petrescu 2016)). Perceived feasibility and low cost, whereby such interventions may be viewed as easily implemented at scale, without complex legislative or regulatory processes, or the need for individual delivery, may also contribute.
The placement of food, alcohol and tobacco products within the physical environment can influence their selection and consumption. Within a provisional typology of physical micro‐environment interventions, generated as an outcome of the scoping review mentioned above (Hollands 2013a), we proposed that ‘placement’ interventions comprise two key, more specific intervention types: first, interventions that target the ‘availability’ of food, alcohol or tobacco products within a specific environment – in essence, what is made available for selection and/or consumption; and second, interventions focused on how available products are positioned within a specific environment. Our focus here is on the ‘proximity’ of food, alcohol or tobacco products to and from people, which can be altered by moving the products nearer or further away to make them more or less accessible. Availability and proximity interventions are further described below.
Interventions that alter availability
These interventions involve manipulating the available food, alcohol or tobacco product options in an environment such as a shop, bar or restaurant. This can be achieved by providing, either:
a) A greater or lesser range of different product options, for example:
-
food – providing a wider range of healthier meal options, or a reduced number of less healthy meal options in a restaurant or cafeteria; or a reduced range of snacks in vending machines;
-
alcohol ‐ providing a wider range of different low‐alcohol options in a bar or pub; or a reduced range of types of wine or beer in a restaurant; and
-
tobacco – providing a reduced range of types of tobacco product in a shop.
b) A greater or lesser amount (number) of discrete units of a product. In this case, the range of different product options might not be changed, but the number of available units of the existing product options is manipulated. For example:
-
food – making a lesser amount of (a range of) chocolate bars on display in a supermarket;
-
alcohol – making a greater amount of (a range of) low‐alcohol beer bottles available in a bar or pub; and
-
tobacco – making a lesser amount of (a range of) cigarettes available in a shop.
c) A combination of a) and b).
Interventions that alter proximity
These interventions concern the positioning of products that are available within that environment. The term we have used ‐ ‘proximity’ ‐ reflects the fact that the predominant intervention of this type within the current context involves moving food, alcohol or tobacco products closer to or further away from people, such as placing a healthier product such as fruit in a more proximal (and therefore convenient) position within a shop to encourage its purchase (Kroese 2016). By reducing or increasing the distance to be traversed or reached, such interventions can alter the degree of convenience, and of effort required for potential consumers to select or consume these products.
The proximity of a product (how close or far away it is) is altered in relation to key physical features in environments, such as typical or expected walking routes, building entrances, checkouts in supermarkets or shops, or seating. Examples include positioning a display of food products close to a shop’s entrance (e.g. 1 m), aiming to enable convenient selection of the products, versus this being located at a distance that requires customers to walk a greater distance to engage with the display (e.g. 20 m). Alternatively, it could involve altering the positioning of a food product to be within arm’s reach of a potential consumer (e.g. placed 20 cm from seating) versus requiring them to leave their seating and walk to take the food product (e.g. placed 2 m from seating).
How the intervention might work
There are considerable influences on behaviour that are beyond individuals’ deliberative control. Indeed, it has been suggested that most human behaviour occurs outside of awareness, cued by stimuli in environments and resulting in actions that may be largely unaccompanied by conscious reflection (Neal 2006; Marteau 2012; Hollands 2016). This proposition has led to increasing policy and research attention being placed on interventions with mechanisms of action that are less dependent on the conscious engagement of the recipients, including interventions that involve altering the placement of objects within the physical environments that surround and cue behaviour.
Various mechanisms of action have been proposed for both availability and proximity interventions. In relation to availability, whether options are available (or absent) within a given environment inevitably shapes and constrains people’s possible responses. The more product options that are available, the more likely it is that an actor will encounter an option they are willing to select or consume (Chernev 2011), particularly given the ‘mere‐exposure’ effect, whereby simple repeated exposure to a product can elicit increased liking (Dalenberg 2014). Therefore, increasing the range of options for a given product or category should increase its selection or consumption – although this is of course subject to people engaging with the product in the first place, which will be influenced by many factors, including characteristics of the person (such as hunger) and of the product (such as its attractiveness or palatability). It has been suggested that if the range of available products is increased, choosing between these options becomes more reliant on a reasoning process, meaning that people may make different choices based on what they are most able to justify (Sela 2009). Furthermore, if the range of available product options remains the same but the number of units of these products increases, this may increase their visibility or salience and therefore encourage selection or consumption.
In relation to proximity, the central role of physical and mental effort has been highlighted (Wansink 2004; Bar‐Hillel 2015). Humans tend to take the least effortful course of action without the need for conscious deliberation, and so physical environments can shape responses by capitalising on this phenomenon. Consequently, products placed nearer an actor require less effort to obtain than those placed farther away and this may correspondingly impact on motivation to select or consume them (Hunter 2016). Other than the effort needed (or perceived as such), more distal products may also be less visible and less salient (Maas 2012). Increasing physical distance may also increase ‘psychological distance’ – the subjective experience of distance from the self in that time and place (Trope 2010) – and so more distal products may be focused upon in a less detailed way or be subject to more deliberation or rationalisation, which may impact upon one's behaviour.
Why it is important to do this review
A recent systematic scoping review of evidence for the effects of physical micro‐environment interventions identified a substantial number of randomised controlled trials that have investigated the effects of altering the availability and proximity of products on health‐related behaviours (Hollands 2013a). The majority of these studies focused on food products, where interventions have significant potential given the necessity of consumption of these products and their ubiquity within many environments. However, because both tobacco and alcohol use also involve the selection and consumption of products, such interventions may also have the potential to change these behaviours via similar mechanisms. We propose to synthesise evidence for the effects of availability and proximity interventions within a single systematic review because we conceptualise them both as interventions that alter the placement of products within physical micro‐environments. To our knowledge, evidence from these studies has yet to be synthesised using rigorous systematic review methods that include quantitative synthesis, assessment of risk of bias and investigation of potential effect modifiers, or to encompass alcohol and tobacco use, although parts of this evidence base have been reviewed (Grech 2015). As such, we do not yet have reliable estimates of the effects of these types of interventions on product selection and consumption, nor of the influence of factors that may modify any such effects. Both are necessary to inform the selection and design of effective public health interventions, particularly given increasing research and policy interest in interventions that alter the physical environment to make unhealthier behaviours less likely and healthier behaviours more likely. This interest is evidenced by the substantial public and policy interest in a previous Cochrane review on portion, package and tableware size (Hollands 2015), which has influenced policy debate in the UK and Australia (Public Health England 2015; Jones 2016).
Poor diet, harmful alcohol use and smoking are socially patterned, being more common amongst those in lower socioeconomic positions, thereby contributing to the increased morbidity and premature mortality observed in these groups (Stringhini 2010). Person‐centred behaviour change interventions, that focus on the provision of educational information to individuals and encouragement for them to make active choices, potentially widen health inequalities (Lorenc 2013; McGill 2015). Interventions that instead aim to alter the environments that people are exposed to and are less reliant on conscious, reflective engagement (Hollands 2016), may have greater potential to reduce, or at least not increase, health inequalities. It has been suggested that this may be because they rely less on recipients’ cognitive resources including levels of literacy, numeracy and cognitive control, which on average are lower in population subgroups experiencing higher levels of social and material deprivation (Spears 2010; Hall 2014). The current review will seek to identify evidence for differential effects of exposure to these interventions between socioeconomic groups. To our knowledge, no studies of the effects of these interventions have been conducted in low‐ and middle‐income countries (LMICs) (Hollands 2013a) that would enable a comparison of effects between studies in high‐income countries (HICs) and LMICs, but we will seek to identify such evidence. Purposively considering socioeconomic status and country context factors in our analysis (and highlighting gaps in the evidence base) will enable us to draw implications for the potential of such interventions to impact upon health inequalities.
Objectives
1. To assess the impact of altering the availability or proximity of: a) food products (including non‐alcoholic beverages); b) alcohol products; and c) tobacco products on their selection or consumption.
2. For each of the above products, to assess the extent to which the impact of such interventions is modified by: i) study characteristics; ii) intervention characteristics; and iii) participant characteristics.
Methods
Criteria for considering studies for this review
Types of studies
Randomised controlled trials (RCTs) or cluster‐RCTs with between‐subjects (parallel group) or within‐subjects (cross‐over) designs, conducted in laboratory or field (‘real world’) settings. We will exclude non‐randomised studies because a recent scoping review indicates that a sufficient number of eligible randomised studies will be available to enable quantitative synthesis of evidence for intervention effects using meta‐analysis (Hollands 2013a). An additional consideration is that, compared with RCTs, non‐randomised studies rely on more stringent and sometimes non‐verifiable assumptions in order to confer confidence that the risk of systematic differences between comparison groups beyond the intervention of interest (i.e. confounding) is sufficiently low to permit valid inferences about causal effects. If randomised assignment is not clear in studies considered otherwise eligible for inclusion at the full‐text assessment stage, we will only include the study if study authors confirm that randomisation occurred.
Types of participants
Adults and children exposed to the interventions. Adults are defined as those 18 years or over, and children defined as those under 18 years (United Nations 1989). We will exclude studies where the product is being selected and fed directly by one person to another (e.g. mother‐child dyads). We will set no other exclusion criteria in relation to demographic, socioeconomic or clinical characteristics. We will exclude studies involving non‐human participants (i.e. animal studies).
Types of interventions
Interventions eligible to be considered in this review are those that involve altering the availability or proximity of food (including non‐alcoholic beverages), alcohol or tobacco products within ‘physical micro‐environments’ ‐ defined here as small‐scale physical environments where people gather for specific purposes and activities, such as restaurants, workplaces, schools, homes, bars, pubs, supermarkets or shops (Swinburn 1999). We define availability interventions and proximity interventions in Description of the intervention and provide details of specific eligibility criteria below.
Availability interventions
‘Availability interventions’ eligible to be considered in this review are those that involve comparing the effects of exposure to at least two differing (i.e. higher versus lower) levels of availability of a manipulated food, alcohol or tobacco product. This will allow us to examine whether, for example, making a food product more available increases its consumption, or making a food product less available decreases its consumption. The ‘product’ can be operationalised as applying to types of a specific product (e.g. fruit, chocolate bars) or to broader categories of products (e.g. energy‐dense snack foods; low‐fat meals). For alcohol and tobacco products, we will also consider including interventions in which the availability of specific recognised alternatives to those products that are not themselves alcohol and tobacco products is manipulated within alcohol or tobacco selection and consumption contexts (e.g. alcohol‐free variants in the case of alcohol, or e‐cigarettes in the case of tobacco).
Additional inclusion criteria
-
The comparison of different levels of availability must be explicitly described, as opposed to this being inferred by the review team. For example, a review author could infer that a supermarket sales promotion might increase the number of products on display in store, but a study would only be included if this alteration was clearly stated by authors.
-
We will include multi‐component interventions in which there are concurrent intervention components that are unrelated to availability, providing those additional components are implemented wholly within the same micro‐environment as is the availability intervention, involving changes to the product itself or its proximal physical environment. Examples include nutritional labelling on the product itself, or promotional signage placed near to the product.
We will exclude the following interventions.
-
Multi‐component interventions in which there are concurrent intervention components that are unrelated to availability, where those additional components are not implemented wholly within the same micro‐environment as is the availability intervention, involving changes to the product itself or its proximal physical environment. Examples of such ineligible intervention components include health education programmes or marketing campaigns.
-
Interventions in which availability may be altered indirectly as a result of a higher‐level intervention but is not directly and systematically altered (e.g. organisational‐level interventions to encourage the wider availability of healthier products within a workplace or set of workplaces, or national‐ or regional‐level policy interventions to encourage schools to modify their environments). While availability may be changed as a result of the higher‐level intervention, this is not directly manipulated to safeguard implementation fidelity.
-
Interventions within analogue studies that do not manipulate real food, alcohol or tobacco products but instead may use written vignettes, computer or questionnaire tasks, or mock products to assess the impact of altering availability.
-
Interventions in which the range of product options is unchanged in terms of the different types or categories of products that are available, but changes are made in the range of ways in which those same products are formulated or presented (e.g. flavour, colour, size or shape).
-
Interventions in which the environmental contexts or opportunities for selection and consumption are not comparable between intervention and control groups. Therefore, we will exclude interventions that involve removing (or adding) the entire range of food, alcohol or tobacco products (e.g. studies examining the effectiveness within a specified environment of complete smoking or alcohol bans), as well as those which involve substantial changes to the infrastructure of the environment (such as building new shops or restaurants). We will also exclude interventions in which availability differs between intervention and control arms due to: additional exposure to foods via assigned dietary programmes (e.g. prescribed diets); education (e.g. taste‐testing sessions, cooking lessons or food education); or other means of prescribed distribution of products to participants.
-
Interventions in which the availability of a product is not altered in terms of its range or amount but as a result of temporal (e.g. changing hours of sale or altering a range of available products over time) or spatial (e.g. changing the places in which a product can be selected or consumed) factors.
Proximity interventions
‘Proximity interventions’ eligible to be considered in this review are those that involve comparing the effects of exposure to at least two differing (i.e. higher versus lower) levels of proximity of a manipulated food, alcohol or tobacco product.
Whilst there are likely other ways of altering the positioning of products that do not impact on their proximity, we have purposefully limited our scope to proximity interventions. This is because any such other studies would be difficult to assess within the same framework specified for use in the current review, which focuses on the effects of altering the quantity or degree (i.e. increase versus decrease) of a specific property (i.e. proximity).
Additional inclusion criteria
-
The comparison of different levels of proximity must be explicitly described, as opposed to this being inferred by the review team. For example, a review author could infer that a redesigned layout of a cafeteria or restaurant might increase or decrease proximity from a given point of reference, but a study would only be included if this change in proximity was clearly stated by authors.
-
As per availability interventions, we will include multi‐component interventions in which there are concurrent intervention components that are unrelated to proximity, providing those additional components are implemented wholly within the same micro‐environment as is the proximity intervention, involving changes to the product itself or its proximal physical environment. Examples include nutritional labelling on the product itself, or promotional signage placed near to the product.
We will exclude the following interventions.
-
(As per availability interventions), multi‐component interventions in which there are concurrent intervention components that are unrelated to proximity, where those additional components are not implemented wholly within the same micro‐environment as is the proximity intervention, involving changes to the product itself or its proximal physical environment.
-
Interventions in which proximity may be altered indirectly as a result of a higher‐level intervention but is not directly and systematically altered (e.g. organisational‐level interventions to encourage the redesign of the layout of school or workplace cafeterias). While proximity may be changed as a result of the higher‐level intervention, this is not directly manipulated to safeguard implementation fidelity.
-
Interventions within analogue studies that do not manipulate real food, alcohol or tobacco products but instead may use written vignettes, computer or questionnaire tasks, or mock products to assess the impact of altering proximity.
-
Interventions in which the proximity of text, symbols or images that relate to products is altered (e.g. on a sign, advertisement, poster, menu, leaflet or computer screen), but the proximity of the actual products to be selected or consumed is not.
Types of outcome measures
Eligible studies must incorporate one or more objective measures of unconstrained selection (with or without purchasing) or consumption of the manipulated food, alcohol or tobacco product(s). For example, a study investigating the effects of increasing the availability or proximity of fruit within a shop on healthier purchasing, may include a specific measure of fruit (i.e. the manipulated product) selected only, or a broader measure that encompasses both fruit selection and selection of non‐fruit options available in the shop (e.g. a measure of selection of all healthier food options). Either would represent an appropriate primary outcome. Studies may additionally include measures that relate specifically to non‐manipulated products – in the given example there may also be a measure of selection of non‐fruit options only. Such measures would represent appropriate secondary outcomes.
Objective measurement may involve sales data or calculating the amount of a product consumed by subtracting the amount remaining after consumption from the total amount presented to the participant. Alternatively, it may involve direct observation of selection or consumption behaviour by outcome assessors. Subjective measurement would involve participant self‐report. By unconstrained, we refer to behaviour of participants that is not constrained or regulated by either explicit instructions or some other action of the researcher. For example, we will exclude studies that manipulate the availability of foods that are not selected, plated or served under the direction of the participant, but where foods are presented to them individually with the instruction to select or consume.
Quantities consumed or selected may have been measured over a time period less than or equal to one day (immediate) or exceeding one day (longer‐term). Our choice of eligible outcome constructs reflects a focus on the assessment of the effects of eligible interventions in terms of the types and amounts of food, alcohol and tobacco people consume, coupled with recognition that the amount selected (with or without purchasing) is an important intermediate endpoint in pathways to consumption.
Primary outcomes
Measures of unconstrained selection (with or without purchasing) or consumption of the manipulated food, alcohol or tobacco product(s). We anticipate encountering a range of measures of these outcome constructs among included studies, and present the following examples of likely measures below:
1. Selection of a product (a) without purchase, or b) with purchase.
Assessment of the amounts of products (e.g. food, drink, alcohol or tobacco products), energy or substances (e.g. saturated fat, alcohol, carbon monoxide) selected, measured in applicable natural units (e.g. kilojoules, grams). Depending on the study setting, a product may be selected with or without this involving a purchase, that is, a transfer of money to the vendor. In cases where there is no purchasing, selection may be comparable to typical purchasing, e.g. products being selected in a restaurant or bar where there is no charge for them, or it may be behaviour that necessarily precedes consumption in that context, such as serving an amount of a food product on to a plate or pouring an amount of drink into a glass.
2. Consumption (intake) of a product.
As per selection, assessment of the amounts of products (e.g. food, drink, alcohol or tobacco products), energy, or substances (e.g. saturated fat, alcohol, carbon monoxide) consumed, measured in applicable natural units (e.g. kilojoules, grams).
Secondary outcomes
As with the specified primary outcomes, secondary outcomes are also measures of unconstrained selection (with or without purchasing) or consumption of food, alcohol or tobacco products. However, secondary outcomes apply to other products that are available in the same micro‐environment at the same point of selection or consumption as the manipulated product(s), but that are not themselves manipulated as regards their proximity or availability.
Due to the nature of the interventions, we anticipate that adverse effects (other than unwanted health‐harming effects on selection or consumption, which will be captured by the specified primary and secondary outcomes) are unlikely to occur, or be assessed or reported. However, any adverse events or harms reported in included studies will be noted.
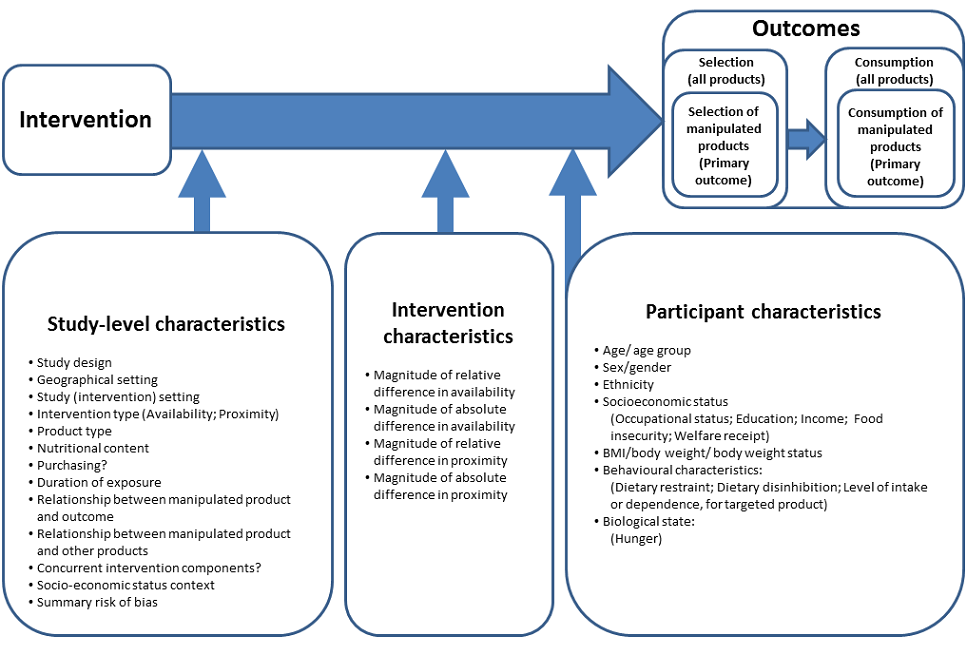
Conceptual model
To supplement study eligibility criteria, we have developed a provisional conceptual model (Figure 1). The conceptual model is design‐oriented in the sense that it is intended to help direct the review process (Anderson 2011) by providing a simplified visual representation of the causal system of interest, i.e. the proposed causal pathway between eligible interventions and their outcomes (behavioural endpoints), and potential moderators of that relationship (effect modifiers) given that differential effects are plausible (Anderson 2013). The provisional conceptual model will be used to inform the development of search strategies, data extraction forms and a provisional framework for the statistical analysis of the data collected from the eligible studies (see Search methods for identification of studies and Data collection and analysis). We propose to revise the conceptual model iteratively as we encounter evidence from eligible studies during the course of the review process, and will document all revisions including the rationale for each revision and supporting evidence. As such, initial and subsequent iterations of the conceptual model will be used as a reference point for the design (in the protocol) and conduct (post‐protocol) of all stages of the systematic review up to and including data synthesis, and as a conceptual basis for explicit reporting of the methods and assumptions used within the synthesis (Anderson 2013). We anticipate that, in practice, iterative refinement of the conceptual model will primarily involve incorporating further potential effect modifiers that we encounter when collecting the data from the eligible studies, which will then be considered for inclusion in the proposed meta‐regression analysis.

Design‐oriented conceptual model
Within the provisional conceptual model (Figure 1), we distinguish between three sets of potential effect modifiers: study characteristics; intervention characteristics; and participant characteristics. Within our proposed analytic framework for quantitative synthesis of data collected from the included studies (see Data collection and analysis), potential effect‐modifying impacts of study characteristics can only be investigated based on between‐study comparisons, whereas potential effect‐modifying impacts of intervention characteristics can be investigated based on within‐study comparisons between participant groups (for example, between different arms of an RCT). Potential effect‐modifying impacts of participant characteristics may be investigated based on either between‐study comparisons or within‐study comparisons, depending on the level of reporting of results by participant subgroups among included studies.
Search methods for identification of studies
Electronic searches
We developed a MEDLINE search strategy by combining sets of controlled vocabulary and free‐text search terms based on the eligibility criteria described above (see Criteria for considering studies for this review). It was developed with the intention of being highly sensitive (at the expense of precision) to give confidence in its ability to detect potentially eligible title and abstract records. This search strategy was externally peer‐reviewed by an information retrieval specialist and co‐convenor of the Cochrane Information Retrieval Methods Group and revised based on their peer‐review comments. We tested and calibrated the MEDLINE search strategy for its sensitivity to retrieve a reference set of 24 records of reports of potentially‐eligible studies that were identified within a preceding, broader scoping review of interventions within physical micro‐environments (Hollands 2013a). In addition, the search strategy was then reviewed by the Information Specialist of the Cochrane Public Health Group and further revised based on their comments. The final MEDLINE search strategy is presented in Appendix 1. We then adapted the final MEDLINE search strategy for use to search each of the other databases listed based on close examination of the database thesauri and scope notes. There were no restrictions for publication date, publication format or language. No study design filters were incorporated. Full details of the final search strategies will be provided in an appendix to the published review.
We will conduct electronic searches for eligible studies within each of the following databases:
-
MEDLINE (including MEDLINE In‐Process) (OvidSP) (1946 to present);
-
Embase (OvidSP) (1980 to present);
-
PsycINFO (OvidSP) (1806 to present);
-
Cochrane Central Register of Controlled Trials (CENTRAL) (1992 to present);
-
Applied Social Sciences Index and Abstracts (ASSIA) (ProQuest) (1987 to present);
-
Science Citation Index Expanded (Web of Science) (1900 to present);
-
Social Sciences Citation Index (Web of Science) (1956 to present); and
-
Trials Register of Promoting Health Interventions (EPPI Centre) (2004 to present).
Searching other resources
We will conduct electronic searches of the following grey literature databases using search strategies adapted from the final MEDLINE search strategy as described above:
-
Conference Proceedings Citation Index ‐ Science (Web of Science) (1990 to present);
-
Conference Proceedings Citation Index ‐ Social Science & Humanities (Web of Science) (1990 to present); and
-
OpenGrey (1997 to present).
We will search trial registers (ClinicalTrials.gov, the World Health Organization (WHO) International Clinical Trials Registry Platform (ICTRP), and the EU Clinical Trials Register) to identify registered trials, and the websites of key organisations in the area of health and nutrition including the following:
-
UK Department of Health;
-
Centers for Disease Control and Prevention (CDC), USA;
-
World Health Organization (WHO);
-
International Obesity Task Force; and
-
EU Platform for Action on Diet, Physical Activity and Health.
In addition, we will search the reference lists of all eligible study reports and undertake forward citation tracking (using Google Scholar) to identify further eligible studies or study reports. If non‐English language articles are found, we will use Google Translate in the first instance to determine potential eligibility. If an article cannot be excluded on this basis, we will aim to have the article translated by a native language speaker or professional translation service.
Data collection and analysis
Selection of studies
Title and abstract records retrieved by the electronic searches will be imported into EPPI Reviewer 4 (ER4) systematic review software (Thomas 2010). Duplicate records will be identified, reviewed manually and removed using ER4’s automatic de‐duplication feature.
In relation to the electronic searches, search terms based on relevant intervention and comparator concepts (for example, availab$, increas$, add$, introduc$, close$, near$, far$) are unlikely to be specific to title‐abstract records of eligible studies (even when configured in multi‐strand search strategies); they are also likely to feature frequently in irrelevant title‐abstract records. This is likely to result in large numbers of records being retrieved by electronic searches, which need to have sufficient sensitivity to capture all eligible studies. To address this challenge, we will use a semi‐automated screening workflow to manage the title‐abstract screening stage, deployed in ER4, which will use machine learning to assign title‐abstract records for duplicate manual screening (O'Mara‐Eves 2015). This workflow is designed to maximise recall of eligible studies while reducing screening workload to match the available resource, which we expect to allow for duplicate manual screening of up to a maximum of one third of retrieved records (the ‘overall screening budget’). Further details of the semi‐automated screening workflow are provided in Appendix 2.
Two review authors, working independently, will undertake duplicate screening of title and abstract records retrieved by the electronic searches. Title and abstract records will be coded as ‘provisionally eligible’, ‘excluded’ or ‘duplicate’ by applying the eligibility criteria described above (see Criteria for considering studies for this review). Any disagreements in the coding of title and abstract records will be identified and resolved by discussion to reach a consensus between the two review authors. If they are unable to reach a consensus, a third author will act as arbiter.
Full‐text copies of corresponding study reports will be obtained for all records coded as ‘provisionally eligible’ at the title and abstract screening stage. Duplicate screening of full‐text study reports will be undertaken by two review authors working independently. Full‐text study reports will be coded as ‘eligible’ or ‘excluded’ by applying the eligibility criteria described above (see Criteria for considering studies for this review), with the reasons for exclusion recorded. Any disagreements in the coding of full‐text study reports or reasons for exclusion will be identified and resolved by discussion to reach consensus between the two review authors. In the event that any coding disagreements cannot be resolved, a third author will act as arbiter. Bibliographic details of study reports excluded at the full‐text screening stage will be provided, along with the primary reason for exclusion, in a ’Characteristics of excluded studies’ table within the published review. Multiple full‐text reports of the same study will be identified, linked and treated as a single study. Full‐text reports comprising multiple eligible studies will be identified and each study will be treated separately. We will document the flow of records and studies through the systematic review process and report this using a PRISMA flow diagram (Moher 2009).
Data extraction and management
An electronic data extraction form will be developed based on the Cochrane Public Health template and the form used in a previous Cochrane review (Hollands 2015), modified to allow extraction of all data required for this review. An initial draft of this form will be piloted using a selection of included studies, to ensure that it enables reliable and accurate extraction of appropriate data, and amended in consultation with the review team. Data pertaining to the characteristics of included studies will be extracted by one review author. Outcome data will be extracted in duplicate by two review authors working independently. If a study with more than two intervention arms is included, only outcome data pertaining to the intervention and comparison groups that meet the eligibility criteria described above will be included in the review, but the table ’Characteristics of included studies’ will include details of all intervention and comparison groups present in the study. Any discrepancies in extracted outcome data will be identified and resolved by checking against the study report, discussion and consensus between two review authors, with a third author acting as arbiter in case of any unresolved discrepancies. Key unpublished data that are missing from reports of included studies will be sought by contacting the study authors.
At the outset we intend to collect the data summarised below. This represents a maximum core dataset that we can reasonably anticipate will be required based on our study eligibility criteria and the design‐oriented conceptual model (Figure 1). This dataset will likely evolve as the review develops. For example, the process of extracting data from the included studies may identify unanticipated potential effect modifiers (moderators or mediators) that prompt revisions to our design‐oriented conceptual model, as described above. This dataset relates to the process of data extraction only and, as such, not all of these variables will be included in the statistical analysis process.
Study characteristics
-
Study design: between‐subjects or within‐subjects design; individually or cluster randomised
-
Geographical setting: country
-
Study (intervention) setting: laboratory; field
-
Intervention type: availability; proximity (and, if applicable, type of availability intervention (e.g. range of options; amount (number) of units; combination) or type of proximity intervention (distance altered from which feature, e.g. seating; walking route; checkout; entrance))
-
Product type: food; alcohol; tobacco
-
If applicable, energy (calorie) or macronutrient content of product
-
If applicable, selection with purchasing or selection without purchasing
-
Duration of exposure
-
Relationship between manipulated product and outcome (how outcome maps on to manipulated product)
-
Relationship between manipulated product and other available products (for example, changes to the availability of a product may be accompanied by increases, decreases or no changes in the availability of other products. Coding schemes for characterising such different permutations will be developed iteratively based on the nature of studies that are encountered)
-
Concurrent intervention component in factorial design
-
Concurrent intervention components confounded with comparison of interest
-
Socioeconomic status context
-
Summary 'Risk of bias' assessments
-
Information on funding source and potential conflicts of interest from funding
Intervention characteristics
-
If applicable, magnitude of relative difference in availability (range, amount)
-
If applicable, magnitude of absolute difference in availability (range, amount)
-
If applicable, magnitude of relative difference in proximity
-
If applicable, magnitude of absolute difference in proximity
Participant characteristics
-
Age/age group
-
Sex/gender (e.g. male, female)
-
Ethnicity
-
Socioeconomic status (e.g. occupational status; education; income; food insecurity; welfare receipt)
-
Body mass index (BMI); body weight; body weight status
-
Behavioural characteristics (e.g. dietary restraint; dietary disinhibition; level of intake or dependence, for targeted product)
-
Biological state (e.g. hunger)
These participant characteristics cover several categories of social differentiation relevant to health equity. The incorporation of study‐level data on these participant characteristics into our proposed meta‐regression analysis (see Data synthesis) is in part intended to enable us to draw inferences concerning any differential effects of the intervention on health equity (Welch 2012). For example, within our proposed meta‐regression (see Data synthesis) we intend to enter proxy measures of socioeconomic status as participant characteristics that may moderate the observed effects of the intervention on product selection and consumption. In addition, to complement investigations based on participant characteristics, we will use the most commonly available measure of socioeconomic status to construct a binary study‐level covariate of ‘socioeconomic status context’ (see ‘Study characteristics’, above) that will serve as a proxy for the overall study context in terms of baseline levels of social and material deprivation amongst study participants. Analysis of this study‐level covariate as a potential effect modifier will allow us to investigate specifically whether eligible interventions are more or less effective in a study context characterised by high versus low levels of social and material deprivation. In practice, given experience with a previous Cochrane review in a similar area (Hollands 2015), we consider it unlikely that any single proxy measure of participants’ socioeconomic status, such as education or income, will be commonly measured in and reported by included studies, and it is likely that we will be limited to coding a study‐level covariate based on authors’ explicit descriptors of the study sample and/or setting.
Outcome data
It is anticipated that some eligible primary studies will include more than one eligible measure of selection or consumption. We will use the measure of selection or consumption that maps most closely on to the focus of the intervention, e.g. where only fruit products have been manipulated, we will, if possible, use a measure that relates specifically to fruit selection or consumption only. Where multiple products have been manipulated, we will, if possible, use a measure that either relates specifically to one of those products (if it was discernible that that product was the primary intervention focus), or captures consumption or selection of all manipulated products. If a study includes only a measure that captures selection or consumption of a wider set of products beyond those that have been manipulated (but including the manipulated product), this would still represent an eligible outcome for the purposes of this review, but would be considered less desirable because it may require assumptions to be made about the direction of effect in relation to the manipulated product itself. Following the application of these criteria, if there remain multiple eligible outcome measures, we will select the single measure of selection or consumption that has been (pre)specified by study authors as the primary outcome. If no primary outcome has been specified by study authors, we will select the measure of selection or consumption most proximal to health outcomes in the context of the specific intervention. For example, if a study reports measures of both energy intake and the amount of food eaten (in grams), we will select energy intake as the measure most proximal to diet‐related health outcomes.
For all outcome data, we will collect information on: outcome variable type (dichotomous, continuous); outcome variable definition; unit of measurement (if relevant); timing of measurement (immediate (≤ 1 day) or longer term (> 1 day)); and type of measure (objective, self‐report). For dichotomous outcomes we will extract event rates in each comparison group. For continuous outcomes we will extract mean differences, or mean changes in final measurements from baseline measurements, for each comparison group with associated standard deviations (or, if standard deviations are missing, standard errors, 95% confidence intervals or relevant t‐statistics, f‐statistics or P values), and we will also indicate whether a high or low value is favourable from a public health perspective. For included studies using factorial designs to investigate the effects of multiple experimental manipulations, we will combine groups to capture the main effects of each relevant randomised comparison.
Assessment of risk of bias in included studies
Risk of bias in the included studies will be assessed using the revised Cochrane 'Risk of bias' tool for randomised trials (RoB 2.0) (Higgins 2016a), using the additional guidance for cluster‐randomised (Eldridge 2016) and cross‐over trials (Higgins 2016b) should we identify eligible studies using these designs. RoB 2.0 addresses five specific domains: (1) bias arising from the randomisation process; (2) bias due to deviations from intended interventions; (3) bias due to missing outcome data; (4) bias in measurement of the outcome; and (5) bias in selection of the reported result. The tool will be applied to each included study by two review authors working independently, and supporting information and justifications for judgements of risk of bias for each domain (low; high; some concerns) will be recorded, and where possible, will include verbatim text extracted from study reports. Any discrepancies in judgements of risk of bias or justifications for judgements will be identified and resolved by discussion to reach consensus between two review authors, with a third author acting as arbiter in the case of any unresolved discrepancies. Following guidance given for RoB 2.0 (Section 1.3.4) (Higgins 2016a), we will derive an overall, summary 'Risk of bias' judgement (low; high; some concerns) for each specific outcome, based on those domains judged to be most critical in this specific review. This means that we will only judge summary risk of bias to be ’low’ if judgements in all of these domains are ’low (risk of bias)’. Completed 'Risk of bias' tables will be presented in the published review, including justifications for each judgement.
We will include a summary assessment of risk of bias for each specific outcome included in our statistical analysis as a covariate in our proposed meta‐regression analysis (see Data synthesis). We will also consider the summary risk of bias in determining the strength of inferences drawn from the results of the data synthesis and in developing conclusions and any recommendations concerning the design and conduct of future research.
Measures of treatment effect
For continuous outcomes, we will calculate the standardised mean difference (SMD) with 95% confidence intervals to express the size of the intervention effect in each study relative to the variability observed in that study. For dichotomous outcomes, we will calculate the odds ratio (OR) for each included study to express the size of the relative intervention effect between comparison groups, with the uncertainty in each result being expressed by the confidence interval. We will then re‐express the odds ratio as an SMD by applying the formula described in Section 9.4.6 of the Cochrane Handbook for Systematic Reviews of Interventions (Deeks 2011).
Unit of analysis issues
In the case of cluster‐randomised trials, where an analysis is reported that accounts for the clustered study design, we will estimate the effect on this basis, using reported test statistics (t‐statistics, F‐statistics or P values) to calculate standard errors if necessary. If this is not possible and the information is not available from the authors, then an ’approximately correct’ analysis will be carried out according to current guidelines (Higgins 2011). We will impute estimates of the intra‐cluster correlation (ICC) using estimates derived from similar studies or by using general recommendations from empirical research. If it is not possible to implement these procedures, we will give the effect estimate as presented but report the unit of analysis error.
For included studies with a within‐subjects design, we will calculate the SMD for continuous outcomes using the methods described in Section 16.4 of the Cochrane Handbook for Systematic Reviews of Interventions (Higgins 2011), and compute standard errors for outcome data using reported test statistics or estimates of correlation, as for cluster‐randomised trials, if necessary. Final outcome values will serve as the primary unit of analysis. For studies assessing changes from baseline as a result of an experimental manipulation, we will calculate final values based on either reported data or supplementary data obtained by contacting study authors, if available.
In relation to potential unit of analysis issues arising from studies with multiple eligible comparison groups, our detailed plans are provided below under Data synthesis.
Dealing with missing data
Data that are missing from reports of included studies will be sought by contacting the study authors. Where data are missing due to participant dropout we will conduct available case analyses and record any issues of missing data within 'Risk of bias' assessments.
Assessment of heterogeneity
We will assess statistical heterogeneity in results by inspecting a graphical display of the estimated treatment effects from included studies along with their 95% confidence intervals, and by formal statistical tests of homogeneity (Chi2) and measures of inconsistency (I2) and heterogeneity (τ2).
Assessment of reporting biases
We will draw funnel plots (plots of effect estimates versus the inverse of their standard errors) to inform assessment of reporting biases. We will conduct statistical tests to formally investigate the degree of asymmetry using the method proposed by Egger et al (Egger 1997). Results of statistical tests will be interpreted based on visual inspection of the funnel plots. Asymmetry of the funnel plot may indicate publication bias or other biases related to sample size, though it may also represent a true relationship between trial size and effect size.
Data synthesis
We will describe and summarise the findings of included studies to address the objectives of the review. We will provide a narrative synthesis describing the interventions, participants, study characteristics and effects of eligible interventions upon prespecified outcomes (see Criteria for considering studies for this review), and will consider presenting the narrative syntheses in disaggregated form by type of product: food, alcohol and tobacco. Our statistical analysis of the results of included studies will use a series of random‐effects and fixed‐effect models to estimate summary effect sizes as SMDs with 95% confidence intervals in terms of each specified outcome. The precise configuration of our proposed statistical analysis will be determined based on the final iteration of our design‐oriented conceptual model. Our statistical analysis will comprise the following stages.
-
Stage 1: conduct separate meta‐analyses for each product type (food, alcohol and tobacco) and, within each product type, conduct separate meta‐analyses for (i) availability interventions and (ii) proximity interventions.
Then for each meta‐analysis:
-
Stage 2: conduct a meta‐regression analysis with study characteristics as additional covariates.
-
Stage 3: conduct a meta‐regression analysis with intervention characteristics as covariates.
-
Stage 4: conduct a meta‐regression analysis with participant characteristics and summary risk of bias as covariates.
Study‐level effect sizes that are calculated based on outcome data from independent within‐study comparisons will be directly incorporated into Stage 1 meta‐analyses. For studies that include three or more eligible comparison groups (for example, an included study of a proximity intervention measured energy consumed from a food product placed either 1 m, 2 m or 3 m from participants), we will treat each eligible within‐study comparison as providing independent outcome data. We will use data from incremental comparisons only (for example, 1 m versus 2 m and 2 m versus 3 m; but not 1 m versus 3 m). We will consider handling the dependency between multiple comparisons in one of two ways. First, we will incorporate all comparisons into a single (univariate) meta‐analysis (or meta‐regression). Such a meta‐analysis assumes a linear ’dose‐response’ relationship between the size of the experimental manipulation and amounts consumed/selected. In such an analysis, we will halve the sample sizes of groups that feature in two incremental comparisons (for example, the 2 m group features in both the 1 m versus 2 m comparison and the 2 m versus 3 m comparison), to adjust corresponding study weights in the analysis. Alternatively, we may decide to undertake multivariate analysis to deal with studies with multiple treatment arms, so that direct comparisons between each treatment arm and a control condition can be modelled, using mvmeta (White 2011). The decision between a univariate and a multivariate approach will be contingent on the extent to which outcome data are available from studies with multiple treatment arms (that is, if there are few or no included multi‐arm studies, multivariate analysis may not be appropriate).
A covariate will be excluded from Stages 2, 3 or 4 of a meta‐regression analysis if useable data are available from fewer than 10 eligible studies incorporated into the corresponding Stage 1 meta‐analysis, and/or covariate values do not enable sufficient discrimination between studies (for example, if covariates are identical, with all included studies using a between‐subjects design and randomising individual participants). Within each stage of a meta‐regression analysis, we will test each covariate separately to identify those variables statistically associated with each outcome. Finally, we will estimate and present a meta‐regression model that incorporates the set of covariates that best explains statistical heterogeneity observed in the corresponding Stage 1 meta‐analysis. We will use the following procedure to select and incorporate covariates into this multi‐variable model:
-
rank those covariates identified as potentially important predictors of the outcome in Stages 2, 3 or 4 in order of the corresponding adjusted R2 values;
-
starting with the top‐ranked covariate, use a stepwise procedure to add each consecutively ranked covariate into the multi‐variable meta‐regression model; and
-
retain a covariate in the multi‐variable model only if it increases the adjusted R2 for the multi‐variable and no collinearity or multicollinearity with other retained covariates is detected.
For each covariate represented as a categorical or binary variable and retained in the final multi‐variable meta‐regression model, we will also estimate and present summary effect sizes for each subgroup. For each covariate represented as a continuous variable and retained in the final model, we will present a bubble plot to illustrate the statistical association.
Treatment of multi‐component studies
For included studies using factorial designs to investigate the effects of multiple experimental manipulations, we will combine outcome data across groups to capture the main effect attributable to each ‘availability’ or ‘proximity’ comparison.
We also anticipate encountering studies of interventions with concurrent components that are unrelated to but intrinsically confounded with the manipulations of interest (namely product availability or proximity). For these studies, we will treat the presence of concurrent components as a study characteristic. At minimum we will code all included studies using a dummy variable that represents the presence or absence of one or more additional intervention components (although we may iteratively develop a more detailed coding scheme should sufficiently similar concurrent components (and combinations thereof) be replicated across multiple studies). Our primary analyses will exclude comparisons where confounded components are present. We will subsequently conduct sensitivity analyses whereby these comparisons will be reinstated, in order to assess their impact on the results.
Certainty of evidence
We will use the standard GRADE system to rate the certainty of each body of evidence incorporated into meta‐analyses for (1) selection (with or without purchasing) and (2) consumption outcomes, in terms of the confidence that may be placed in summary estimates of effect. Within the GRADE approach, the certainty of a body of evidence for intervention effects is assessed based on the design of the underlying studies ‐ with RCTs initially considered high certainty ‐ and on a number of factors that can decrease or increase certainty. GRADE criteria for downgrading certainty of evidence encompass study limitations, inconsistency, imprecision, indirectness, publication bias, and other considerations (Balshem 2011). If such a criterion is identified, it is classified either as serious (leading to downgrading by one level) or very serious (downgrading by two levels). The four possible certainty ratings that can be applied range from high certainty (meaning that further research is very unlikely to change the estimate of effect) through to moderate certainty, low certainty and very low certainty (meaning that any estimate of effect is uncertain and is very likely to change with the integration of further study results).
'Summary of findings' tables
A series of 'Summary of findings' tables developed using GRADEpro GDT (Brozek 2008) will be presented. They will comprise summaries of the estimated intervention effect and the number of participants and studies for each outcome, encompassing unconstrained selection or consumption of manipulated products (primary outcomes) and non‐manipulated products (secondary outcomes). They will also include the justifications underpinning all GRADE assessments. We will present separate summary effect sizes and certainty of evidence ratings for food, alcohol and tobacco products, and for availability and proximity interventions within each of these product types. Results of meta‐analyses will be presented as SMDs with 95% confidence intervals (CIs). To facilitate interpretation of these estimated effect sizes, we will also re‐express them using selected familiar metrics of food, alcohol or tobacco selection or consumption (for example, in relation to average daily energy intake) using observational data from a population‐representative sample in at least one jurisdiction (Schünemann 2011; Hollands 2015).
Sensitivity analysis
In addition to the aforementioned treatment of studies featuring confounded additional intervention components, sensitivity analyses will be conducted to explore the impact of any outcome data that are imputed due to missing data.
Design‐oriented conceptual model