Modificaciones en la disponibilidad o proximidad de alimentos, alcohol y tabaco para cambiar su selección y consumo
Resumen
Antecedentes
El consumo excesivo de alimentos, alcohol y tabaco aumenta el riesgo de enfermedades no contagiosas. Las intervenciones para cambiar las características de los microentornos físicos en que las personas pueden seleccionar o consumir estos productos (como tiendas, restaurantes, lugares de trabajo y escuelas) son de considerable interés para las políticas de salud pública y la investigación. Esta revisión aborda dos tipos de intervención en estos entornos: la alteración de la disponibilidad (la variedad y la cantidad de opciones) de estos productos, o su proximidad (la distancia a la que están posicionados) a los consumidores potenciales.
Objetivos
1. Evaluar el impacto en la selección y el consumo de la alteración de la disponibilidad o la proximidad de: a) alimentos (incluidas las bebidas no alcohólicas), b) alcohol y c) productos del tabaco.
2. Evaluar hasta qué punto el impacto de estas intervenciones se ve modificado por las características de: i. estudios, ii. intervenciones y iii. participantes.
Métodos de búsqueda
Se realizaron búsquedas en CENTRAL, MEDLINE, Embase, PsycINFO y otras siete bases de datos de literatura publicada o gris, así como en registros de ensayos y sitios web clave, hasta el 23 de julio 2018, seguidas de búsquedas de citas.
Criterios de selección
Se incluyeron ensayos controlados aleatorizados con diseños entre participantes (grupos paralelos) o en los mismos participantes (cruzados). Los estudios elegibles compararon los efectos de la exposición con al menos dos niveles diferentes de disponibilidad de un producto o su proximidad, e incluyeron una medida de selección o consumo del producto manipulado.
Obtención y análisis de los datos
Se utilizó un nuevo flujo de trabajo de cribado semiautomático y se aplicaron métodos Cochrane estándar para seleccionar los estudios elegibles, recopilar datos y evaluar el riesgo de sesgo. En análisis separados para las intervenciones de disponibilidad y las intervenciones de proximidad, se combinaron los resultados con metanálisis de efectos aleatorizados y modelos de metarregresión para estimar los tamaños del efecto resumen (como diferencias de medias estandarizadas [DME]) e investigar las asociaciones entre los tamaños del efecto resumen y las características de los estudios, intervenciones o participantes seleccionados. Se evaluó la certeza de la evidencia para cada resultado con los criterios GRADE.
Resultados principales
Se incluyeron 24 estudios, y la mayoría (20/24) expresó inquietudes acerca del riesgo de sesgo. Todos los estudios incluidos investigaron los productos alimenticios; ninguno investigó el alcohol ni el tabaco. La mayoría se realizó en entornos de laboratorio (14/24), con participantes adultos (17/24), y se utilizaron diseños entre participantes (19/24). Todos los estudios se realizaron en países de ingresos altos, principalmente en los EE.UU. (14/24).
Seis estudios investigaron las intervenciones de disponibilidad, de los cuales dos cambiaron el número absoluto de distintas opciones disponibles, y cuatro alteraron la proporción relativa de opciones menos saludables (a más saludables). La mayoría de los estudios (4/6) manipularon bocadillos o bebidas. Para los resultados de selección, el metanálisis de tres comparaciones de tres estudios (n = 154) encontró que la exposición a menos opciones resultó en una gran reducción en la selección de los alimentos objetivo: DME ‐1,13 (intervalo de confianza [IC] del 95%: ‐1,90 a ‐0,37) (evidencia de certeza baja). Para los resultados de consumo, el metanálisis de tres comparaciones de dos estudios (n = 150) encontró que la exposición a menos opciones resultó en una reducción moderada en el consumo de esos alimentos, aunque con una falta de certeza significativa: DME ‐0,55 (IC del 95%: ‐1,27 a 0,18) (evidencia de certeza baja).
Dieciocho estudios investigaron las intervenciones de proximidad. La mayoría (14/18) cambió la distancia a la que se colocó un alimento o bebida de los participantes, mientras que cuatro estudios cambiaron el orden de los componentes de la comida encontrados a lo largo de una línea. Para los resultados de selección, solo se identificó un estudio con una comparación (n = 41), que encontró que el alimento colocado más lejos resultó en una reducción moderada en su selección: DME ‐0,65 (IC del 95%: ‐1,29 a ‐0,01) (evidencia de certeza muy baja). Para los resultados de consumo, el metanálisis de 15 comparaciones de 12 estudios (n = 1098) encontró que la exposición a alimentos situados más lejos resultó en una reducción moderada de su consumo: DME ‐0,60 (IC del 95%: ‐0,84 a ‐0,36) (evidencia de certeza baja). Los análisis de metarregresión indicaron que este efecto era mayor: cuanto más lejos se colocaba el producto; cuando solo se disponía del producto o productos objetivo; cuando los participantes tenían un bajo nivel de privación; y cuando el estudio presentaba un alto riesgo de sesgo.
Conclusiones de los autores
La evidencia actual sugiere que el cambio en el número de opciones alimentarias disponibles o la modificación de la posición de los alimentos podría contribuir a cambios significativos en las conductas, lo que justificaría la adopción de políticas para promover estos cambios en el entorno alimentario. Sin embargo, la certeza de esta evidencia según los criterios GRADE es baja o muy baja. Para permitir conclusiones más seguras y generalizables sobre estos efectos potencialmente importantes, se requiere investigación adicional en entornos del mundo real, con intervenciones en una variedad más amplia de alimentos, alcohol y productos de tabaco y durante períodos de tiempo sostenidos.
PICO
Resumen en términos sencillos
Modificaciones en la disponibilidad o proximidad de alimentos, alcohol y tabaco para cambiar su selección y consumo
Los patrones poco saludables de consumo de alimentos, alcohol y tabaco son causas importantes de deterioro de la salud. El cambio de la disponibilidad (la variedad o la cantidad de opciones, o ambas) de estos productos o su proximidad (la distancia a la que se encuentran) con respecto a los consumidores potenciales podría ayudar a las personas a tomar decisiones más saludables.
¿Cuál es el objetivo de esta revisión?
Esta revisión investigó si la modificación de la disponibilidad o la proximidad de los alimentos (incluidas las bebidas no alcohólicas), el alcohol y los productos de tabaco cambiaron la selección de las personas (como la compra) o el consumo de esos productos. Se buscó toda la evidencia disponible de los ensayos controlados aleatorizados (un tipo de estudio en que los participantes se asignan a uno de dos o más grupos de tratamiento mediante un método aleatorio) para responder a esta pregunta, y se encontraron 24 estudios realizados en países de ingresos altos.
¿Cuáles son los principales resultados de la revisión?
Seis estudios incluyeron intervenciones de disponibilidad, de las cuales cuatro cambiaron la proporción relativa de opciones menos saludables a opciones más saludables, y dos cambiaron el número absoluto de diferentes opciones disponibles. En los análisis estadísticos que combinaban los resultados de múltiples estudios, se encontró que la reducción del número de opciones disponibles para una variedad o categoría particular de alimentos redujo la selección de los productos alimenticios (al analizar a 154 participantes) y posiblemente redujo el consumo de los productos (de 150 participantes). Sin embargo, la certeza de la evidencia de estos efectos fue baja.
Dieciocho estudios incluyeron intervenciones de proximidad. La mayoría (14/18) cambió la distancia a la que se colocó un alimento o bebida de los participantes, mientras que cuatro estudios cambiaron el orden de los componentes de la comida encontrados a lo largo de una línea. Un estudio encontró que lo anterior redujo la selección de alimentos (análisis de 41 participantes), mientras que en un análisis estadístico que combinó los resultados de múltiples estudios, se encontró que colocar los alimentos más lejos redujo el consumo de esos productos alimenticios (análisis de 1098 participantes). Sin embargo, la certeza de la evidencia de estos efectos fue muy baja y baja, respectivamente.
Mensajes clave
Pese a sus limitaciones, la evidencia actual sugiere que la modificación del número de opciones alimentarias disponibles o el lugar en que se encuentran los alimentos podría contribuir a cambios significativos en la conducta, lo que justificaría la adopción de medidas de política para promover esos cambios en el entorno alimentario. Sin embargo, se necesitan más estudios de alta calidad en entornos del mundo real para hacer más seguro este hallazgo.
¿Cuál es el grado de actualización de esta revisión?
La evidencia está actualizada hasta el 23 de julio 2018.
Authors' conclusions
Summary of findings
| Lower versus higher availability of food products for changing quantity of food selected or consumed | |||||
| Population: Adults and children | |||||
| Outcomes | Illustrative comparative risks (95% CI) | Relative effect | Number of participants | Certainty of evidence | |
| Assumed risk: higher availability of food products (more options) | Corresponding risk: lower availability of food products (fewer options) | ||||
| Selection | Mean energy selected on an average snack occasion of 200 (±63) kcal1 | Mean energy selected on an average snack occasion would be 71 kcal (35.6%) less with lower availability (120 kcal fewer to 23 kcal fewer; 59.9% less to 11.7% less). | Mean selection in the lower availability group was 1.13 standard deviations lower (1.90 lower to 0.37 lower). | 154 | ⊕⊕⊝⊝ |
| Consumption | Mean energy intake on an average snack occasion of 200 (±63) kcal | Mean energy intake on an average snack occasion would be 35 kcal (17.3%) less with lower availability (80 kcal fewer to 11 kcal more; 40% less to 5.7% more). | Mean consumption in the lower availability group was 0.55 standard deviations lower (1.27 lower to 0.18 more). | 150 | ⊕⊕⊝⊝ |
| The basis for the assumed risk is provided in Footnotes.5 The corresponding risk (and its 95% confidence interval) is based on the assumed risk and the relative effect of the intervention (and its 95% CI). The relative effect is derived from the primary random‐effects meta‐analysis for the outcome. CI: confidence interval; kcal: kilocalories; RCT: randomised controlled trial | |||||
| GRADE Working Group grades of evidence | |||||
| 1Assumes that all foods selected are consumed. | |||||
| Lower versus higher proximity of food products for changing quantity of food selected or consumed | |||||
| Patient or population: Adults and children | |||||
| Outcomes | Illustrative comparative risks (95% CI) | Relative effect | Number of participants | Certainty of evidence | |
| Assumed risk: higher proximity of food products (placed nearer) | Corresponding risk: lower proximity of food products (placed farther away) | ||||
| Selection | Mean energy selected on an average snack occasion of 200 (±63) kcal1 | Mean energy selected on an average snack occasion would be 41 kcal (20.5%) less with lower proximity (81 kcal fewer to 1 kcal fewer; 40.6% less to 0.3% less). | Mean selection in the lower proximity group was 0.65 standard deviations lower (1.29 lower to 0.01 lower). | 41 (1 RCT; 1 comparison) | ⊕⊝⊝⊝ |
| Consumption | Mean energy intake on an average snack occasion of 200 (±63) kcal | Mean energy intake on an average snack occasion would be 38 kcal (18.9%) less with lower proximity (53 kcal fewer to 23 kcal fewer; 26.5% less to 11.3% less). | Mean consumption in the lower availability group was 0.60 standard deviations lower (0.84 lower to 0.36 lower). | 1098 (12 RCTs; 15 comparisons) | ⊕⊕⊝⊝ |
| The basis for the assumed risk is provided in Footnotes.6 The corresponding risk (and its 95% confidence interval) is based on the assumed risk and the relative effect of the intervention (and its 95% CI). The relative effect is derived from the primary random‐effects meta‐analysis for the outcome. CI: confidence interval; kcal: kilocalories; RCT: randomised controlled trial | |||||
| GRADE Working Group grades of evidence | |||||
| 1Assumes that all foods selected are consumed. | |||||
Background
Description of the condition
Non‐communicable diseases, principally cardiovascular diseases, diabetes, certain forms of cancer, and chronic respiratory diseases, accounted for an estimated 68% of all deaths worldwide in 2012 (WHO 2016). Major risk factors for non‐communicable diseases include metabolic and dietary risk factors linked to food consumption (e.g. high body mass index, high systolic blood pressure), as well as smoking and alcohol use – risks that are, in principle, modifiable. These are also amongst the most significant risk factors for total disease burden, both globally and in high‐income countries specifically (GBD 2018). Identifying interventions that are effective in achieving sustained health behaviour change across populations and countries is therefore one of the most important public health challenges of the 21st century.
Description of the intervention
It is increasingly recognised that the physical environments that surround us can exert considerable influences on our health‐related behaviours and that altering these environments may provide a catalyst for behaviour change (Cohen 2016; Marteau 2012; Stok 2017). We have previously described a set of interventions that involve altering small‐scale physical environments – or micro‐environments ‐ with the intention of changing health‐related behaviours (Hollands 2013a; Hollands 2017a), which have also been described as 'choice architecture' (or 'nudge') interventions (Cadario in press; Szaszi 2018; Thaler 2008). These interventions involve changing characteristics of, or cues within, environments where people may select or consume food, alcohol, or tobacco including restaurants, workplaces, schools, homes, bars, pubs, supermarkets, or shops. They have received increased policy and research interest in recent years as a result of several factors (Marteau 2015), including shifts in theoretical understanding, supportive empirical evidence, political acceptability (with governments preferring ‘light‐touch’ rather than legislative or regulatory approaches), and public acceptability (with evidence suggesting these types of interventions are relatively acceptable) (Petrescu 2016; Reisch 2016; Reynolds 2019). Perceived feasibility and low cost, whereby such interventions may be viewed as easily implemented at scale without complex legislative or regulatory processes or the need for individual delivery, may also contribute.
The placement of food, alcohol, and tobacco products within the physical environment can influence their selection and consumption. Within the Typology of Interventions in Proximal Physical Micro‐Environments (TIPPME) intervention typology (Hollands 2017a), a framework developed for characterising interventions in physical micro‐environments, ‘placement’ interventions comprise two key, more specific intervention types: first, interventions that target the ‘availability’ of food, alcohol, or tobacco products within a specific environment – essentially, what is made available for selection or consumption, or both; and second, interventions focused on how available products are positioned within a specific environment. Our specific focus with respect to how products are positioned is on the ‘proximity’ of food, alcohol, or tobacco products to and from people, which can be altered by moving the products nearer or farther away to make them more or less accessible. Availability and proximity interventions are described further below.
Interventions that alter availability
These interventions involve manipulating the available food, alcohol, or tobacco product options in an environment such as a shop, bar, or restaurant. This can be achieved by providing, either:
a) a greater or lesser range of different product options (within a targeted range or category), for example:
-
food – providing a wider range of healthier meal options, or a reduced number of less‐healthy meal options in a restaurant or cafeteria; or a reduced range of snacks in vending machines;
-
alcohol ‐ providing a wider range of different low‐alcohol options in a bar or pub; or a reduced range of types of wine or beer in a restaurant; and
-
tobacco – providing a reduced range of types of tobacco product in a shop.
b) a greater or lesser amount (number) of discrete units of a product. In this case, the range of different product options might not be changed, but the number of available units of the existing product options is manipulated. For example:
-
food – making a lesser amount of (a range of) chocolate bars on display in a supermarket;
-
alcohol – making a greater amount of (a range of) low‐alcohol beer bottles available in a bar or pub; and
-
tobacco – making a lesser amount of (a range of) cigarettes available in a shop.
c) a combination of a) and b).
These possible manipulations can concern changes in the absolute number of different options available, or changes in relative proportions, such as the relative number (proportion) of less‐healthy (to healthier) options that are available.
Interventions that alter proximity
These interventions concern the positioning of products that are available within that environment. The term we have used ‐ ‘proximity’ ‐ reflects the fact that the predominant intervention of this type within the current context involves moving food, alcohol, or tobacco products closer to or farther away from people, such as placing a healthier product such as fruit in a more proximal (and therefore convenient) position within a shop to encourage its purchase (Kroese 2016). By reducing or increasing the distance to be traversed or reached, such interventions can alter the degree of convenience, and of effort required for potential consumers to select or consume these products.
The proximity of a product (how close or far away it is) is altered in relation to key physical features in environments, such as typical or expected walking routes, building entrances, checkouts in supermarkets or shops, or seating. Examples include positioning a display of food products close to a shop’s entrance (e.g. 1 m), aiming to enable convenient selection of the products, versus this being located at a distance that requires customers to walk a greater distance to engage with the display (e.g. 20 m). Alternatively, it could involve altering the positioning of a food product to be within arm’s reach of a potential consumer (e.g. placed 20 cm from seating) versus requiring them to leave their seating and walk to take the food product (e.g. placed 2 m from seating).
A detailed conceptual framework for these interventions has been developed (Pechey under review).
How the intervention might work
There are considerable influences on behaviour that are beyond individuals’ deliberative control. Indeed, it has been suggested that much human behaviour occurs outside of awareness, cued by stimuli in environments and resulting in actions that may be largely unaccompanied by conscious reflection (Marteau 2012; Neal 2006). This proposition has led to increasing policy and research attention being placed on interventions with mechanisms of action that may be less dependent on the conscious engagement of the recipients (Hollands 2016), including interventions that involve altering the placement of objects within the physical environments that surround and cue behaviour.
Various underlying mechanisms of action have been proposed for both availability and proximity interventions (Pechey under review), although it is difficult to assess these outside of artificial, controlled environments. In relation to availability, whether options are available (or absent) within a given environment inevitably shapes and constrains people’s possible responses. The more product options that are available, the more likely it is that an actor will encounter an option they are willing to select or consume (Chernev 2011). Exposure may also increase the salience of, and the attention directed towards, products and elicit a ‘mere‐exposure’ effect ‐ whereby repeated exposure to a product can elicit increased liking (Dalenberg 2014). Altering a range of available products could also have the effect of implying a new social norm about which types of products are acceptable or commonplace, and this could influence selection and consumption. Whilst currently largely unexplored, the sum of these potential mechanisms is that increasing the range of options for a given product or category should increase its selection or consumption, albeit subject to people engaging with the product in the first place. This will be influenced by many factors, including characteristics of the person (such as hunger) and of the product (such as its attractiveness or palatability). In addition, it has been suggested that if the range of available products is increased, choosing between these options becomes more reliant on a reasoning process, meaning that people may make different choices based on what they are most able to justify (Sela 2009). Furthermore, if the range of available product options remains the same, but the number of units of these products increases, this may increase their visibility or salience and therefore encourage selection or consumption.
In relation to proximity, the central role of physical and mental effort has been highlighted (Bar‐Hillel 2015). Humans tend to take the least effortful course of action without the need for conscious deliberation, and so physical environments can shape responses by capitalising on this phenomenon. Consequently, products placed nearer an actor require less effort to obtain than those placed farther away, and this may correspondingly impact on motivation to select or consume them (Hunter 2018). Other than the effort needed (or perceived as such), more distal products may also be less visible and less salient (Maas 2012). Increasing physical distance may also increase ‘psychological distance’ – the subjective experience of distance from the self in that time and place – and so more distal products may be focused upon in a less detailed way or be subject to more deliberation or rationalisation, which may impact one's behaviour (Trope 2010).
Why it is important to do this review
A systematic scoping review of evidence for the effects of physical micro‐environment interventions identified a substantial number of studies that have investigated the effects of altering the availability and proximity of products on health‐related behaviours (Hollands 2013b). The majority of these studies focused on food products, where interventions have significant potential given the necessity of consumption of these products and their ubiquity within many environments. However, because both tobacco and alcohol use also involve the selection and consumption of products, such interventions may also have the potential to change these behaviours via similar mechanisms. We have synthesised evidence for the effects of availability and proximity interventions within a single systematic review because we conceptualise them both as interventions that alter the placement of products within physical micro‐environments. To our knowledge, evidence from these studies has yet to be synthesised using rigorous systematic review methods that include quantitative synthesis, assessment of risk of bias, and investigation of potential effect modifiers, or to encompass alcohol and tobacco use, although parts of this evidence base have been reviewed. As such, we do not yet have reliable estimates of the effects of these types of interventions on product selection and consumption, nor of the influence of factors that may modify any such effects. Both are necessary to inform the selection and design of effective public health interventions, particularly given increasing research and policy interest in interventions that alter the physical environment to make unhealthier behaviours less likely and healthier behaviours more likely. This interest is evidenced by the substantial public and policy interest in a previous Cochrane Review on portion, package, and tableware size (Hollands 2015), which has influenced policy debate in the UK and Australia (Jones 2016).
Poor diet, harmful alcohol use, and smoking are socially patterned, being more common amongst those in lower socioeconomic positions, thereby contributing to the increased morbidity and premature mortality observed in these groups (Stringhini 2010). Behaviour change interventions that focus on the provision of educational information to individuals and encouragement for them to make active choices, potentially widen health inequalities (Lorenc 2013; McGill 2015). Interventions that instead aim to alter the environments that people are exposed to and therefore may be less reliant on conscious, reflective engagement (Hollands 2016), could have a greater potential to reduce, or at least not increase, health inequalities. It has been suggested that this may be because they rely less on recipients’ cognitive resources including levels of literacy, numeracy, and cognitive control, which on average are lower in population subgroups experiencing higher levels of social and material deprivation (Hall 2014). The current review sought to identify evidence for differential effects of exposure to these interventions between socioeconomic groups. To our knowledge, no studies of the effects of these interventions have been conducted in low‐ and middle‐income countries (LMICs) that would enable a comparison of effects between studies in high‐income countries (HICs) and LMICs, but we sought to identify such evidence. Purposively considering socioeconomic status and country context factors in our analysis (and highlighting gaps in the evidence base) enabled the opportunity to assess the potential impact such interventions could have upon health inequalities.
Objectives
1. To assess the impact on selection and consumption of altering the availability or proximity of (a) food (including non‐alcoholic beverages), (b) alcohol, and (c) tobacco products.
2. To assess the extent to which the impact of these interventions is modified by characteristics of: i. studies, ii. interventions, and iii. participants.
Methods
Criteria for considering studies for this review
Types of studies
Randomised controlled trials (RCTs) or cluster‐RCTs with between‐participants (parallel group) or within‐participants (cross‐over) designs, conducted in laboratory or field (‘real‐world’) settings. We excluded non‐randomised studies because, first, a scoping review indicated that a sufficient number of eligible randomised studies were likely available to enable quantitative synthesis of evidence for intervention effects (Hollands 2013a). Second, compared with RCTs, non‐randomised studies rely on more stringent and sometimes non‐verifiable assumptions in order to confer confidence that the risk of systematic differences between comparison groups beyond the intervention of interest (i.e. confounding) is sufficiently low to permit valid inferences about causal effects. If randomised assignment was not clear in studies otherwise considered eligible for inclusion at the full‐text assessment stage, we only included the study if study authors had confirmed that randomisation occurred. We also excluded randomised studies that had only a single participating site in the intervention or the comparator group, or both, because this would result in the treatment effect being completely confounded with the site characteristics.
Types of participants
Adults and children exposed to the interventions. We defined adults as those 18 years of age or over, and children as those under 18 years (United Nations 1989). We excluded studies where the product was selected and fed directly by one person to another (e.g. mother‐child dyads). No other exclusion criteria in relation to demographic, socioeconomic, or clinical characteristics were set. We excluded studies involving non‐human participants (i.e. animal studies).
Types of interventions
Eligible interventions were those that involved altering the availability or proximity of food (including non‐alcoholic beverages), alcohol, or tobacco products within ‘physical micro‐environments’, defined here as small‐scale physical environments where people gather for specific purposes and activities, such as restaurants, workplaces, schools, homes, bars, pubs, supermarkets, or shops (Hollands 2017a; Swinburn 1999). Availability interventions and proximity interventions are defined in the Description of the intervention section, and details of specific eligibility criteria for each intervention type are provided below.
Availability interventions
‘Availability interventions’ eligible for consideration in this review were those that involved comparing the effects of exposure to at least two differing (i.e. higher versus lower) levels of availability of a manipulated food, alcohol, or tobacco product. This allowed us to examine whether, for example, making a food product more available increases its consumption, or making a food product less available decreases its consumption. The ‘product’ can be operationalised as applying to types of a specific product (e.g. fruit, chocolate bars) or to broader ranges or categories of products (e.g. energy‐dense snack foods; low‐fat meals). For alcohol and tobacco products, we also considered including interventions in which the availability of specific recognised alternatives to those products that are not themselves alcohol and tobacco products is manipulated within alcohol or tobacco selection and consumption contexts (e.g. alcohol‐free variants in the case of alcohol, or e‐cigarettes in the case of tobacco).
Additional inclusion criteria
-
The comparison of different levels of availability must be explicitly described, as opposed to this being inferred by the review team. For example, a review author could infer that a supermarket sales promotion would increase the number of products on display in store, but a study would only be included if this was clearly stated by the authors.
-
We included multicomponent interventions in which there were concurrent intervention components that were unrelated to availability, providing those additional components were implemented wholly within the same physical micro‐environment as in the availability intervention, involving changes to the product itself or its proximal physical environment. Examples include nutritional labelling on the product itself, or promotional signage placed near to the product. We planned to treat confounded and unconfounded components differently (see Data synthesis).
We excluded the following interventions.
-
Multicomponent interventions in which there were concurrent intervention components that were unrelated to availability, where those additional components were not implemented wholly within the same micro‐environment as in the availability intervention, involving changes to the product itself or its proximal physical environment. Examples of such ineligible intervention components include health education programmes or marketing campaigns.
-
Interventions in which availability may be altered indirectly as a result of a higher‐level intervention but is not directly and systematically altered (e.g. organisational‐level interventions to encourage the wider availability of healthier products within a workplace or set of workplaces, or national‐ or regional‐level policy interventions to encourage schools to modify their environments). Whilst availability may be changed as a result of the higher‐level intervention, this is not directly manipulated to safeguard implementation fidelity.
-
Interventions within analogue studies that do not manipulate real food, alcohol, or tobacco products but instead may use written vignettes, computer or questionnaire tasks, or mock products to assess the impact of altering availability.
-
Interventions in which the range of product options is unchanged (as regards being perceptible prior to selection) in terms of the different types or categories of products that are available, but changes are made in the range of ways in which those same products are formulated (as regards being perceptible prior to selection) or presented, such as flavour, colour, size, or shape.
-
Interventions in which the environmental contexts or opportunities for selection and consumption are not comparable between intervention and control groups. We therefore excluded interventions that involved removing (or adding) the entire range of food, alcohol, or tobacco products within a given micro‐environment (e.g. studies examining the effectiveness within a specified environment of complete smoking or alcohol bans), as well as those that involved substantial changes to its infrastructure (such as building new shops or restaurants) or its furniture (e.g. adding or removing fixtures and fittings). We also excluded interventions in which availability differed between intervention and control arms due to: additional exposure to foods via assigned dietary programmes (e.g. prescribed diets); education (e.g. taste‐testing sessions, cooking lessons, or food education); or other means of prescribed distribution of products to participants.
-
Interventions in which the availability of a product was not altered in terms of its range or amount but as a result of temporal (e.g. changing hours of sale or altering a range of available products over time) or spatial (e.g. changing the places in which a product can be selected or consumed) factors (Han 2014; Sherk 2018).
Proximity interventions
‘Proximity interventions’ eligible for consideration in this review were those that involved comparing the effects of exposure to at least two differing (i.e. higher versus lower) levels of proximity of a manipulated food, alcohol, or tobacco product. Whilst there may be other ways of altering the positioning of products that do not impact on their proximity, we have purposefully limited our scope to proximity interventions. This is because any other such studies would be difficult to assess within the same framework specified for use in the current review, which focuses on the effects of altering the quantity or degree (i.e. increase versus decrease) of a specific property (i.e. proximity).
Additional inclusion criteria
-
The comparison of different levels of proximity had to be explicitly described, as opposed to this being inferred by the review team. For example, a review author could infer that a redesigned layout of a cafeteria or restaurant might increase or decrease proximity from a given point of reference, but a study would only be included if this change in proximity was clearly stated by authors.
-
As per availability interventions, we included multicomponent interventions in which there were concurrent intervention components that were unrelated to proximity, providing those additional components were implemented wholly within the same physical micro‐environment as in the proximity intervention, involving changes to the product itself or its proximal physical environment. Examples include nutritional labelling on the product itself, or promotional signage placed near to the product.
We excluded the following interventions.
-
As per availability interventions, multicomponent interventions in which there were concurrent intervention components that were unrelated to proximity, where those additional components were not implemented wholly within the same micro‐environment as in the proximity intervention, involving changes to the product itself or its proximal physical environment.
-
Interventions in which proximity may be altered indirectly as a result of a higher‐level intervention but was not directly and systematically altered (e.g. organisational‐level interventions to encourage the redesign of the layout of school or workplace cafeterias). Whilst proximity may be changed as a result of the higher‐level intervention, this is not directly manipulated to safeguard implementation fidelity.
-
Interventions within analogue studies that do not manipulate real food, alcohol, or tobacco products but instead may use written vignettes, computer or questionnaire tasks, or mock products to assess the impact of altering proximity.
-
Interventions in which the proximity of text, symbols, or images that relate to products is altered (e.g. on a sign, advertisement, poster, menu, leaflet, or computer screen (e.g. online supermarket)), but the proximity of the actual products to be selected or consumed is not.
-
Interventions in which the environmental contexts or opportunities for selection and consumption are not comparable between intervention and control groups. We therefore excluded interventions that involved substantial changes to the infrastructure of the environment or its furniture.
Studies including both availability and proximity intervention components were eligible for inclusion in the review.
Types of outcome measures
Eligible studies had to incorporate one or more objective measures of unconstrained selection (with or without purchasing) or consumption of the manipulated food, alcohol, or tobacco product(s). For example, a study investigating the effects of increasing the availability or proximity of fruit within a shop on healthier purchasing could include a specific measure of fruit (i.e. the manipulated product) selected only, or a broader measure at category level that encompasses both fruit selection and selection of non‐fruit options available in the shop (e.g. a measure of selection of all healthier food options). Either would represent an appropriate primary outcome. Studies may additionally include measures that relate specifically to non‐manipulated products – in the given example there may also be a measure of selection of non‐fruit options only. Such measures would represent appropriate secondary outcomes.
Objective measurement may involve sales data or calculating the amount of a product consumed by subtracting the amount remaining after consumption from the total amount presented to the participant. Alternatively, it may involve direct observation of selection or consumption behaviour by outcome assessors. Subjective measurement would involve participant self‐report. By unconstrained, we refer to behaviour of participants that is not constrained or regulated by either explicit instructions or some other action of the researcher. For example, we excluded studies that manipulated the availability of foods that are not selected, plated, or served under the direction of the participant, but where foods were presented to them individually with the instruction to select or consume.
Quantities selected or consumed may have been measured over a time period less than or equal to one day (immediate) or exceeding one day (longer term). Our choice of eligible outcome constructs reflects a focus on the assessment of the effects of eligible interventions in terms of the types and amounts of food, alcohol, and tobacco people consume, coupled with recognition that the amount selected (with or without purchasing) is an important intermediate endpoint in pathways to consumption.
Primary outcomes
Measures of unconstrained selection (with or without purchasing) or consumption of the manipulated food, alcohol, or tobacco product(s). We anticipated encountering a range of measures of these outcome constructs amongst included studies, and present the following examples of likely measures below.
1. Selection of a product (a) without purchase, or b) with purchase.
Assessment of the amounts of products (e.g. food, drink, alcohol, or tobacco products), energy or substances (e.g. saturated fat, alcohol, carbon monoxide) selected, measured in applicable natural units (e.g. kilojoules, grams). Depending on the study setting, a product may be selected with or without this involving a purchase, that is a transfer of money to the vendor. In cases where there is no purchasing, selection may be comparable to typical purchasing (e.g. products being selected in a restaurant or bar where there is no charge for them) or it may be behaviour that necessarily precedes consumption in that context, such as serving an amount of a food product onto a plate or pouring an amount of drink into a glass.
2. Consumption (intake) of a product.
As per selection, assessment of the amounts of products (e.g. food, drink, alcohol, or tobacco products), energy, or substances (e.g. saturated fat, alcohol, carbon monoxide) consumed, measured in applicable natural units (e.g. kilojoules, grams).
Secondary outcomes
As with the specified primary outcomes, secondary outcomes are also measures of unconstrained selection (with or without purchasing) or consumption of food, alcohol, or tobacco products. However, secondary outcomes apply to other products that are available in the same micro‐environment at the same point of selection or consumption as the manipulated product(s), but that are not themselves manipulated as regards to their availability or proximity.
Due to the nature of the interventions, we anticipated that adverse effects (other than unwanted health‐harming effects on selection or consumption, which would be captured by the specified primary and secondary outcomes) were unlikely to occur, be assessed or reported. However, any adverse events or harms reported in the included studies were noted.
Conceptual model
To supplement study eligibility criteria, we developed a provisional conceptual model that was published in the protocol for this review (Hollands 2017b). The conceptual model was design‐oriented in the sense that it was intended to help direct the review process by providing a simplified visual representation of the causal system of interest (Anderson 2011), that is the proposed causal pathway between eligible interventions and their outcomes (behavioural endpoints), and potential moderators of that relationship (effect modifiers) given that differential effects are plausible (Anderson 2013). We used the provisional conceptual model to inform the development of search strategies, data extraction forms, and a provisional framework for the statistical analysis of the data collected from the eligible studies (see Search methods for identification of studies and Data collection and analysis).
We revised the conceptual model iteratively, as we encountered evidence from eligible studies during the course of the review process, and documented revisions. We used the iterations of the conceptual model as a reference point for the design (in the protocol), conduct, and reporting (postprotocol) of the systematic review (Anderson 2013). In practice, iterative refinement of the conceptual model involved incorporating further potential effect modifiers identified during the data collection process, which were then considered in the analysis and reporting of these data. The final version of the conceptual model is shown in Figure 1, with details of its development in Data collection and analysis.

Final conceptual model. Changes from the provisional conceptual model (Hollands 2017b), comprising two additions, are shown in red type.
Search methods for identification of studies
Electronic searches
We developed a MEDLINE search strategy by combining sets of controlled vocabulary and free‐text search terms based on the eligibility criteria described above (see Criteria for considering studies for this review). It was developed with the intention of being highly sensitive (at the expense of precision) to give confidence in its ability to detect potentially eligible title and abstract records. This search strategy was externally peer‐reviewed by an information retrieval specialist and co‐convenor of the Cochrane Information Retrieval Methods Group and revised based on their peer‐review comments. We tested and calibrated the MEDLINE search strategy for its sensitivity to retrieve a reference set of 24 records of reports of potentially eligible studies that were identified within a preceding, broader scoping review of interventions within physical micro‐environments (Hollands 2013a). The search strategy was then reviewed by the Information Specialist of the Cochrane Public Health Group and revised further based on their comments. We adapted our final MEDLINE search strategy for use in searching the other databases listed based on close examination of the database thesauri and scope notes. There were no restrictions on publication date, publication format, or language. No study design filters were incorporated. The full details of the final search strategies are provided in Appendix 1.
We conducted electronic searches for eligible studies within each of the following databases:
-
Cochrane Central Register of Controlled Trials (CENTRAL) (1992 to 23rd July 2018);
-
MEDLINE (including MEDLINE In‐Process) (OvidSP) (1946 to 23rd July 2018);
-
Embase (OvidSP) (1980 to 23rd July 2018);
-
PsycINFO (OvidSP) (1806 to 23rd July 2018);
-
Applied Social Sciences Index and Abstracts (ASSIA) (ProQuest) (1987 to 24th July 2018);
-
Science Citation Index Expanded (Web of Science) (1900 to 24th July 2018);
-
Social Sciences Citation Index (Web of Science) (1956 to 24th July 2018); and
-
Trials Register of Promoting Health Interventions (EPPI Centre) (2004 to 27th July 2018).
Searching other resources
We conducted electronic searches of the following grey literature databases using search strategies adapted from the final MEDLINE search strategy, as described above:
-
Conference Proceedings Citation Index ‐ Science (Web of Science) (1990 to 24th July 2018);
-
Conference Proceedings Citation Index ‐ Social Science & Humanities (Web of Science) (1990 to 24th July 2018); and
-
OpenGrey (1997 to 24th July 2018).
We searched trial registers (US National Institutes of Health Ongoing Trials Register ClinicalTrials.gov (www.clinicaltrials.gov/), the World Health Organization International Clinical Trials Registry Platform (apps.who.int/trialsearch/), and the EU Clinical Trials Register (www.clinicaltrialsregister.eu/)) to identify registered trials (up to 25th July 2018), and the websites of key organisations in the area of health and nutrition, including the following:
-
UK Department of Health;
-
Centers for Disease Control and Prevention (CDC), USA;
-
World Health Organization (WHO);
-
International Obesity Task Force; and
-
EU Platform for Action on Diet, Physical Activity and Health.
In addition, we searched the reference lists of all eligible study reports and undertook forward citation tracking (using Google Scholar) to identify further eligible studies or study reports (up to 25th July 2018). When we found non‐English language articles, we used Google Translate in the first instance to determine potential eligibility. We intended that if an article appeared to be eligible, we would have the article translated by a native language speaker or professional translation service, however no articles needed translating.
Data collection and analysis
Selection of studies
Title and abstract records retrieved by the electronic searches were imported into EPPI Reviewer 4 (ER4) systematic review software (Thomas 2010). Duplicate records were identified, reviewed manually, and removed using ER4’s automatic de‐duplication feature.
In relation to the electronic searches, search terms based on relevant intervention and comparator concepts (e.g. availab$, increas$, add$, introduc$, close$, near$, far$) are unlikely to be specific to title‐abstract records of eligible studies (even when configured in multistrand search strategies), and are also likely to feature frequently in irrelevant title‐abstract records. This is likely to result in large numbers of records being retrieved by electronic searches, which need to have sufficient sensitivity to capture all eligible studies. To address this challenge, we developed a semi‐automated screening workflow to manage the title‐abstract screening stage, deployed in ER4, which uses machine learning to assign title‐abstract records for duplicate manual screening (O'Mara‐Eves 2015). This workflow was designed to maximise recall of eligible studies while reducing screening workload to match the available resource, which we expected to allow for duplicate manual screening of up to a maximum of one‐third of retrieved records (the ‘overall screening budget’). Further details of the semi‐automated screening workflow are provided in Appendix 2.
Two review authors independently undertook duplicate screening of title and abstract records retrieved by the electronic searches. We coded title and abstract records as ‘provisionally eligible’, ‘excluded’, or ‘duplicate’ by applying the eligibility criteria described above (see Criteria for considering studies for this review). Any disagreements in the coding of title and abstract records were identified and resolved by discussion to reach a consensus between the two review authors. When they were unable to reach a consensus, a third review author acted as an arbiter.
We obtained full‐text copies of corresponding study reports for all records coded as ‘provisionally eligible’ at the title and abstract screening stage. Two review authors independently undertook duplicate screening of full‐text study reports, coding them as ‘eligible’ or ‘excluded’ by applying the eligibility criteria described above (see Criteria for considering studies for this review), with reasons for exclusion recorded. Any disagreements in the coding of full‐text study reports or reasons for exclusion were identified and resolved by discussion to reach consensus between the two review authors. In the event that any coding disagreements could not be resolved, a third review author acted as an arbiter. Bibliographic details of study reports excluded at the full‐text screening stage are provided, along with the primary reason for exclusion, in the Characteristics of excluded studies table. If we identified multiple full‐text reports of the same study, we linked and treated them as a single study. Some full‐text reports comprising multiple eligible studies were identified, and each study was treated separately. We documented the flow of records and studies through the systematic review process and have reported this using a PRISMA flow diagram (Moher 2009).
Data extraction and management
An electronic data extraction form was developed based on the Cochrane Public Health template and the form used in a previous Cochrane Review (Hollands 2015), modified to allow extraction of all data required for this review. An initial draft of this form was piloted using a selection of included studies, to ensure that it enabled reliable and accurate extraction of appropriate data, and was amended in consultation with the review team. One review author extracted data pertaining to the characteristics of included studies. Two review authors independently extracted outcome data in duplicate. When a study with more than two intervention arms was included, only outcome data pertaining to the intervention and comparison groups that met the eligibility criteria described above were included in the review, but the Characteristics of included studies table includes details of all intervention and comparison groups present in the study. Any discrepancies in extracted outcome data were identified and resolved by checking against the study report, and by discussion and consensus, with a third review author acting as an arbiter if necessary. We contacted study authors for key unpublished data that were missing from reports of included studies.
We collected the data summarised below, comprising 28 constructs. The 26 constructs in plain type represent the maximum core dataset that at the outset we anticipated would be required based on our study eligibility criteria and the design‐oriented conceptual model. It was intended that this dataset would evolve as necessary through the review process, corresponding with revisions made to the conceptual model (see Types of outcome measures), resulting in the inclusion of two additional study characteristics in italicised text. These concerned basic subtype categorisations of availability and proximity interventions, reflecting that in the review protocol, Hollands 2017b, we had presented possible subtype categorisations that would be subject to iteration or confirmation as a result of the review process. Such categorisations may be subject to further elaboration in future as the empirical or theoretical basis develops (Pechey under review).
Study characteristics
-
Study design: between‐participants or within‐participants design; individually or cluster‐randomised
-
Geographical setting: country
-
Study (intervention) setting: laboratory; field
-
Intervention type: availability; proximity
-
Availability subtype: range of different options (relative/absolute); amount of product units (relative/absolute); combination
-
Proximity subtype: distance from set point; order encountered along line
-
Product type: food; alcohol; tobacco
-
If applicable, energy (calorie) or macronutrient content of product, and/or related categorisation (healthier versus less healthy versus mixed)
-
If applicable, selection with purchasing or selection without purchasing
-
Duration of exposure
-
Relationship between manipulated product and outcome (how outcome maps onto manipulated product)
-
Relationship between manipulated product and other available products
-
Concurrent intervention component in factorial design
-
Concurrent intervention components confounded with comparison of interest
-
Socioeconomic status context
-
Summary 'Risk of bias' assessments
-
Information on funding source and potential conflicts of interest from funding
Intervention characteristics
-
Magnitude of relative difference in availability (range, amount)
-
Magnitude of absolute difference in availability (range, amount)
-
Magnitude of relative difference in proximity
-
Magnitude of absolute difference in proximity
Participant characteristics
-
Age/age group
-
Sex/gender (e.g. male, female)
-
Ethnicity
-
Socioeconomic status (e.g. occupational status; education; income; food insecurity; welfare receipt)
-
Body mass index (BMI); body weight; body weight status
-
Behavioural characteristics (e.g. dietary restraint; dietary disinhibition; level of intake or dependence, for targeted product)
-
Biological state (e.g. hunger)
These participant characteristics cover several categories of social differentiation relevant to health equity. Collecting study‐level data on these participant characteristics enabled the potential to draw inferences within our analysis concerning any differential effects of the intervention on health equity (Welch 2012). For example, proxy measures of socioeconomic status function as participant characteristics that may moderate the observed effects of the intervention on product selection and consumption. In addition, to complement investigations based on participant characteristics, we constructed a binary study‐level covariate of ‘socioeconomic status context’ based on authors' explicit descriptions of the study sample and/or setting (see ‘Study characteristics’ above) that served as a proxy for the overall study context in terms of baseline levels of social and material deprivation amongst study participants. Analysis of this study‐level covariate as a potential effect modifier enabled the potential to investigate specifically whether eligible interventions were more or less effective in a study context characterised by high versus low levels of social and material deprivation.
Outcome data
We anticipated that some eligible primary studies would include more than one eligible measure of selection or consumption. We used the measure of selection or consumption that mapped most closely onto the focus of the intervention, for example where only fruit products were manipulated, we used a measure that related specifically to fruit selection or consumption only. Where multiple products were manipulated concurrently, we used a measure that either related specifically to one of those products (if it was discernible that that product was the primary intervention focus), or captured selection or consumption of all manipulated products. If a study included only a category‐level measure that captured selection or consumption of a wider set of products beyond those that have been manipulated (but including the manipulated product), this still represented an eligible outcome for the purposes of this review providing it could be meaningfully interpreted at category level, but was considered less desirable because it required assumptions to be made about the direction of effect in relation to the manipulated product itself. Following the application of these criteria, if there remained multiple eligible outcome measures, we selected the single measure of selection or consumption that had been (pre)specified by the study authors as the primary outcome. If no primary outcome had been specified by study authors, we selected the measure of selection or consumption most proximal to health outcomes in the context of the specific intervention. For example, if a study reported measures of both energy intake and the amount of food eaten (in grams), we selected energy intake as the measure most proximal to diet‐related health outcomes, and where measures were reported relating to both intake of a healthier (e.g. low energy density) product and intake of a less‐healthy (e.g. high energy density) product, we prioritised the latter.
For all outcome data, we collected information on: outcome variable type (dichotomous, continuous); outcome variable definition; unit of measurement (if relevant); timing of measurement (immediate (≤ 1 day) or longer term (> 1 day)); and type of measure (objective, self‐report). For dichotomous outcomes, we extracted event rates in each comparison group. For continuous outcomes, we extracted mean differences, or mean changes in final measurements from baseline measurements, for each comparison group with associated standard deviations (or if standard deviations were missing, standard errors, 95% confidence intervals or relevant t‐statistics, F‐statistics, or P values). For included studies using factorial designs to investigate the effects of multiple experimental manipulations, we combined groups to capture the main effects of each relevant randomised comparison.
Assessment of risk of bias in included studies
We assessed risk of bias in the included studies using the revised Cochrane 'Risk of bias' tool for randomised trials (RoB 2.0) (Higgins 2016a), employing the additional guidance for cluster‐randomised and cross‐over trials (Eldridge 2016; Higgins 2016b). RoB 2.0 addresses five specific domains: (1) bias arising from the randomisation process; (2) bias due to deviations from intended interventions; (3) bias due to missing outcome data; (4) bias in measurement of the outcome; and (5) bias in selection of the reported result. Two review authors independently applied the tool to each included study, and recorded supporting information and justifications for judgements of risk of bias for each domain (low; high; some concerns). Any discrepancies in judgements of risk of bias or justifications for judgements were resolved by discussion to reach consensus between the two review authors, with a third review author acting as an arbiter if necessary. Following guidance given for RoB 2.0 (Section 1.3.4) (Higgins 2016a), we derived an overall summary 'Risk of bias' judgement (low; some concerns; high) for each specific outcome, whereby the overall RoB for each study was determined by the highest RoB level in any of the domains that were assessed.
Measures of treatment effect
For continuous outcomes, we calculated the standardised mean difference (SMD) with 95% confidence intervals (CIs) to express the size of the intervention effect in each study relative to the variability observed in that study. For dichotomous outcomes, we calculated the odds ratio (OR) for each included study to express the size of the relative intervention effect between comparison groups, with the uncertainty in each result being expressed by the CI. We then re‐expressed the OR as an SMD by applying the formula described in Section 9.4.6 of the Cochrane Handbook for Systematic Reviews of Interventions (Deeks 2011). We calculated SMDs and sampling variances using means, standard deviations (SDs), and sample sizes and the corresponding equations for continuous and dichotomous data. We extracted means and SDs from published figures if they had not been reported numerically. If SDs were not reported or available from authors, they were obtained using the first appropriate rule from the following:
(a) by direct calculation from statistics such as standard errors or CIs, if available;
(b) by imputation, by assuming that the ratio of SD to mean for the outcome is equal to the ratio of SD to mean calculated using raw data available for other outcomes in the same study;
(c) by imputation, by assuming that the ratio of SD to mean is equal to the ratio of SD to mean observed in other similar studies that reported both means and SDs.
Unit of analysis issues
In the case of cluster‐randomised trials, where an analysis was reported that accounted for the clustered study design, we estimated the effect on this basis, using reported test statistics (t‐statistics, F‐statistics or P values) to calculate standard errors. When this was not possible and the information was not available from the authors, we carried out an ’approximately correct’ analysis according to current guidelines in Section 16.3 of the Cochrane Handbook for Systematic Reviews of Interventions (Higgins 2011). We imputed estimates of the intracluster correlation (ICC) using estimates derived from similar studies or by using general recommendations from empirical research. In cases where it was not possible to implement these procedures, we gave the effect estimate as presented but have reported the unit of analysis error.
For included studies with a within‐participants design, we aimed to account for the design by calculating the SMD for continuous outcomes using the methods described in Section 16.4 of the Cochrane Handbook for Systematic Reviews of Interventions (Higgins 2011), where standard errors for outcome data are computed using reported test statistics or estimates of correlations. However, adjustments could not be made to standard errors to account for within‐subject designs as suitable information about within‐person correlations was not available in the studies. None of the within‐subject studies reported SDs directly, and we were already making strong assumptions to estimate the missing SDs. In order to adjust for the within‐subject design, additional unsupported assumptions regarding the correlations would need to have been made.
Final outcome values served as the primary unit of analysis. For studies assessing changes from baseline as a result of an experimental manipulation, we calculated final values based on either reported data or supplementary data obtained by contacting the study authors.
In relation to potential unit of analysis issues arising from studies with multiple eligible comparison groups, our plans are provided below in the Data synthesis section.
Dealing with missing data
We sought data that were missing from reports of included studies by contacting the study authors. Where data were missing due to participant dropout, we conducted available‐case analyses and recorded any issues related to missing data within the 'Risk of bias' assessment.
Assessment of heterogeneity
We assessed statistical heterogeneity in results by inspecting a graphical display of the estimated treatment effects from included studies along with their 95% CIs, and by formal statistical tests of homogeneity (Chi2) and measures of inconsistency (I2) and heterogeneity (Tau2).
Assessment of reporting biases
We drew funnel plots (plots of effect estimates versus the inverse of their standard errors) to inform assessment of reporting biases. We conducted statistical tests to formally investigate the degree of asymmetry using the method proposed by Egger and colleagues (Egger 1997). Results of statistical tests were interpreted based on visual inspection of the funnel plots. Asymmetry of the funnel plot may indicate publication bias or other biases related to sample size, though it may also represent a true relationship between trial size and effect size.
Data synthesis
We described and summarised the findings of included studies to address the objectives of the review. We provided a narrative synthesis describing the interventions, participants, study characteristics, and effects of eligible interventions upon prespecified outcomes (see Criteria for considering studies for this review). Our statistical analysis of the results of included studies used a series of random‐effects and fixed‐effect models to estimate summary effect sizes as SMDs with 95% CIs in terms of each specified outcome. Our planned statistical analysis comprised the following stages:
-
Stage 1: conduct separate meta‐analyses for each product type (food, alcohol, and tobacco) and, within each product type, conduct separate meta‐analyses for (i) availability interventions and (ii) proximity interventions.
Then for each meta‐analysis:
-
Stage 2: conduct a meta‐regression analysis with study characteristics (including summary risk of bias) as covariates;
-
Stage 3: conduct a meta‐regression analysis with intervention characteristics as covariates;
-
Stage 4: conduct a meta‐regression analysis with participant characteristics as covariates.
Study‐level effect sizes calculated based on outcome data from independent within‐study comparisons were directly incorporated into Stage 1 meta‐analyses. For studies that included three or more eligible comparison groups (e.g. a study of a proximity intervention placing a food product either 1 m, 2 m, or 3 m from participants), we treated each eligible within‐study comparison as providing independent outcome data, but adjusted those data to account for the dependency between multiple comparisons as described in the following paragraph. We planned to analyse data from multi‐arm studies based on incremental comparisons only. We followed this for availability interventions, whilst for the analysis of proximity interventions, we decided to consider the shortest distance as a comparator against which all other intervention arms would be compared (e.g. 1 m versus 2 m, 1 m versus 3 m, but not 2 m versus 3 m), to allow meta‐regression analyses to investigate the impact of increasing differences in proximity and because the nearest point to the participant is the logical comparator in any comparison given the mechanisms posited to underlie the intervention.
For studies contributing multiple pairwise comparisons to a meta‐analysis, provided the sample size was large enough, each pairwise comparison was included separately. We adjusted the study weights to account approximately for the statistical dependencies between comparisons by dividing the sample size of the common intervention group as evenly as possible between the comparisons. If the sample size for the common intervention group was 1 for any comparison after dividing the common intervention group, we combined intervention groups to give a single pairwise comparison. If there was an even number of groups, we divided the groups in half based on the level (i.e. low or high) of the intervention type (i.e. proximity and availability). If the number of groups was odd, the group left over as the ‘middle’ level was incorporated into the higher‐level group. We did not undertake multivariate analysis to deal with studies with multiple treatment arms as had been proposed as a possibility in the protocol, since the studies with multiple treatment arms had different numbers of arms that were not directly comparable across studies. As a post hoc sensitivity analysis, we repeated meta‐analyses but instead entered a single effect estimate for each multi‐arm study, obtained using the mean SMD and the mean variance across the multiple comparisons from that study (a conservative approach that will underestimate precision).
We planned to exclude a covariate from Stages 2, 3, or 4 of a meta‐regression analysis if useable data were available from fewer than 10 eligible studies incorporated into the corresponding Stage 1 meta‐analysis and/or covariate values did not enable sufficient discrimination between studies (e.g. if covariates are identical, with all included studies using a between‐participants design and randomising individual participants). Within each stage of a meta‐regression analysis, we proposed to test each covariate separately to identify those variables statistically associated with each outcome. Finally, we planned to estimate and present a meta‐regression model that incorporated the set of covariates that best explained statistical heterogeneity observed in the corresponding Stage 1 meta‐analysis. We planned to use the following procedure to select and incorporate covariates into this multivariable model:
-
rank those covariates identified as potentially important predictors of the outcome in Stages 2, 3, or 4 in order of the corresponding adjusted R2 values;
-
starting with the top‐ranked covariate, use a stepwise procedure to add each consecutively ranked covariate into the multivariable meta‐regression model; and
-
retain a covariate in the multivariable model only if it increases the adjusted R2 for the multivariable and no collinearity or multicollinearity with other retained covariates is detected.
In practice, we conducted meta‐regression only on the consumption outcome for proximity interventions, as there were insufficient data (fewer than 10 comparisons) for all other interventions/outcomes. Furthermore, we conducted only univariate meta‐regression analyses. Multivariate analyses were not possible due to a lack of data and given that there were not variables identified that modified the intervention effect within each stage of the analysis. Additional details and results of the meta‐regression analyses are reported in the Effects of interventions section.
Statistical analyses were conducted in R (version 3.4.2) and metafor (version 2.0‐0) (Viechtbauer 2010).
Treatment of multicomponent studies
For included studies using factorial designs to investigate the effects of multiple experimental manipulations, we combined outcome data across groups to capture the main effect attributable to each ‘availability’ or ‘proximity’ comparison. For studies of interventions with concurrent components that were unrelated to but intrinsically confounded with the manipulations of interest (namely product availability or proximity), we treated the presence of concurrent components as a study characteristic, indicating the presence or absence of one or more additional intervention components. An example of such confounded concurrent components would be when a product is made less available but also has warning labels added to its packaging (relative to that product being more available and having no additional warning labels). Our primary analyses excluded comparisons where confounded concurrent intervention components were present. We subsequently conducted sensitivity analyses whereby these comparisons were reinstated, in order to assess their impact on the results.
Certainty of evidence
We used the GRADE framework to rate the certainty of each body of evidence incorporated into meta‐analyses for (1) selection (with or without purchasing) and (2) consumption outcomes, to indicate the confidence that can be placed in summary estimates of effect (Guyatt 2011; Schünemann 2011). This is an assessment of the likelihood that the true effect will not be substantially different from what the research found. Within the GRADE approach, the certainty of a body of evidence for intervention effects is assessed based on the design of the underlying studies ‐ with RCTs initially considered high certainty ‐ and on a number of factors that can decrease or increase certainty. GRADE criteria for downgrading certainty of evidence encompass study limitations, inconsistency, imprecision, indirectness, publication bias, and other considerations (Balshem 2011). If such a criterion is identified, it is classified either as serious (leading to downgrading by one level) or very serious (downgrading by two levels). The four possible certainty ratings that can be applied range from high certainty (meaning that current evidence provides a very good indication of the likely effect, and the likelihood that the actual effect will be substantially different is low) through to moderate certainty (current evidence provides a good indication of the likely effect, and the likelihood that the actual effect of the treatment will not be substantially different is moderate); low certainty (current evidence provides some indication of the likely effect, but the likelihood that the actual effect will be substantially different is high); and very low certainty (current evidence does not provide a reliable indication of the likely effect, and the likelihood that the actual effect will be substantially different is very high). Two review authors independently undertook duplicate assessment of GRADE, with any disagreements resolved by discussion or by consulting a third review author if necessary to reach consensus.
'Summary of findings' tables
We developed 'Summary of findings' tables using GRADEpro GDT (GRADEpro GDT 2015). These tables comprise summaries of the estimated intervention effect and the number of participants and studies for each primary outcome, and include justifications underpinning GRADE assessments. We planned to present separate summary effect sizes and certainty of evidence ratings for food, alcohol, and tobacco products, and for availability and proximity interventions within each of these product types, but in practice no eligible alcohol or tobacco studies were identified. Results of random‐effects meta‐analyses are presented as SMDs with 95% CIs. To facilitate interpretation of these estimated effect sizes, we re‐expressed them employing selected familiar metrics of selection or consumption using observational data from a population‐representative sample (see Effects of interventions for details) (Hollands 2015; Schünemann 2011).
Sensitivity analysis
In addition to the aforementioned treatment of studies featuring confounded additional intervention components, we also conducted sensitivity analyses to explore the impact of any outcome data that were imputed due to missing data.
Results
Description of studies
Results of the search
The flow of studies through the systematic review process is shown in Figure 2. Electronic database searches were initially run between 1 and 4 March 2016. These retrieved a total of 233,996 study records, including duplicates. Twenty‐four additional records in the review had been previously identified from other sources, functioning as a reference set, resulting in a total of 234,020 records. Following removal of duplicates (76,899 records), 157,121 title‐abstract records were processed in accordance with the semi‐automated screening workflow described in Appendix 2. As a result of this process, 27,116 title and abstract records were screened, of which 121 articles were subject to full‐text screening. The electronic database searches were updated between 23 and 27 July 2018. For these updated searches, following removal of 7202 duplicate records, 37,864 title‐abstract records were processed in accordance with the semi‐automated workflow. This resulted in 2962 title‐abstract records being screened, with a further nine articles subject to full‐text screening.

Study flow diagram.
At full‐text screening stage, we excluded 113 articles and assessed 17 articles assessed as eligible for inclusion in the review. These 17 articles represent 20 unique studies (6 availability: Fiske 2004; Foster 2014; Kocken 2012; Pechey 2019; Roe 2013; Stubbs 2001; and 14 proximity: Cohen 2015; Engell 1996 (S1); Engell 1996 (S2); Greene 2017; Langlet 2017; Maas 2012 (S1); Maas 2012 (S2); Musher‐Eizenman 2010; Painter 2002; Privitera 2012 (S1); Privitera 2012 (S2); Privitera 2014; Wansink 2006; Wansink 2013a). Snowball screening conducted between 31 October and 2 November 2016 and again between 9 and 12 November 2018 resulted in the identification of four further studies from three full‐text articles, with one study of proximity identified through backward and forward citation searching (Kongsbak 2016), and three studies of proximity identified due to two review authors being authors on those studies, which have subsequently been published (Hunter 2018 (S1); Hunter 2018 (S2); Hunter 2019). We included a total of 24 studies in the review.
We identified registered protocols for four ongoing studies (see Characteristics of ongoing studies), and there were insufficient details available to determine eligibility for a further two studies (see Characteristics of studies awaiting classification).
Included studies
We included 24 studies involving a total of 3052 participants in the review. Fourteen studies were conducted in the USA (Cohen 2015; Engell 1996 (S1); Engell 1996 (S2); Fiske 2004; Foster 2014; Greene 2017; Musher‐Eizenman 2010; Painter 2002; Privitera 2012 (S1); Privitera 2012 (S2); Privitera 2014; Roe 2013; Wansink 2006; Wansink 2013a); five in the UK (Hunter 2018 (S1); Hunter 2018 (S2); Hunter 2019; Pechey 2019; Stubbs 2001); three in the Netherlands (Kocken 2012; Maas 2012 (S1); Maas 2012 (S2)); one in Denmark (Kongsbak 2016); and one in Sweden (Langlet 2017). We identified no eligible studies conducted in LMICs.
The majority (14/24) of the included studies were conducted in laboratory settings (Engell 1996 (S1); Engell 1996 (S2); Hunter 2018 (S1); Hunter 2018 (S2); Hunter 2019; Kongsbak 2016; Langlet 2017; Maas 2012 (S1); Maas 2012 (S2); Musher‐Eizenman 2010; Privitera 2012 (S1); Privitera 2012 (S2); Privitera 2014; Stubbs 2001); the remaining 10 studies (five availability, Fiske 2004; Foster 2014; Kocken 2012; Pechey 2019; Roe 2013, and five proximity, Cohen 2015; Greene 2017; Painter 2002; Wansink 2006; Wansink 2013a) were conducted in a wide range of field settings including shops, restaurants/cafeterias, offices, and vending machines in schools. Study participants in 17 studies were ‐ or were assumed to be ‐ adults (Engell 1996 (S1); Engell 1996 (S2); Fiske 2004; Hunter 2018 (S1); Hunter 2018 (S2); Hunter 2019; Kongsbak 2016; Maas 2012 (S1); Maas 2012 (S2); Painter 2002; Pechey 2019; Privitera 2012 (S1); Privitera 2012 (S2); Privitera 2014; Stubbs 2001; Wansink 2006; Wansink 2013a), and in six studies children under 18 years (Cohen 2015; Greene 2017; Kocken 2012; Langlet 2017; Musher‐Eizenman 2010; Roe 2013). Ages were not sufficiently specified in one study to allow classification (Foster 2014). The sex of participants was reported in 15 studies (ranging from 0% female (Engell 1996 (S1); Engell 1996 (S2); Kongsbak 2016; Stubbs 2001), to 100% female (Maas 2012 (S1); Maas 2012 (S2); Wansink 2006)), with this unspecified in nine studies (Fiske 2004; Foster 2014; Greene 2017; Kocken 2012; Musher‐Eizenman 2010; Pechey 2019; Privitera 2012 (S1); Privitera 2012 (S2); Wansink 2013a). Eleven studies reported BMI. Mean BMI of the sample was < 25 in six studies (Hunter 2018 (S1); Kongsbak 2016; Langlet 2017; Maas 2012 (S1); Maas 2012 (S2); Musher‐Eizenman 2010), and between 25 and 30 in the remaining five studies (Hunter 2018 (S2); Hunter 2019; Privitera 2012 (S1); Privitera 2012 (S2); Stubbs 2001).
In terms of socioeconomic status context of the study samples, five studies were conducted in samples purposefully comprising both high and low deprivation (Greene 2017; Hunter 2018 (S1); Hunter 2018 (S2); Hunter 2019; Pechey 2019); three were conducted in high‐deprivation contexts (Cohen 2015; Foster 2014; Kocken 2012); and the remaining 16 studies were conducted in low deprivation contexts (Engell 1996 (S1); Engell 1996 (S2); Fiske 2004; Kongsbak 2016; Langlet 2017; Maas 2012 (S1); Maas 2012 (S2); Musher‐Eizenman 2010; Painter 2002; Privitera 2012 (S1); Privitera 2012 (S2); Privitera 2014; Roe 2013; Stubbs 2001; Wansink 2006; Wansink 2013a).
All 24 included studies involved manipulations of food products, with no eligible studies focused on alcohol or tobacco products.
Six of the included studies concerned manipulations of availability (Fiske 2004; Foster 2014; Kocken 2012; Pechey 2019; Roe 2013; Stubbs 2001). In terms of the types of availability interventions used, two studies changed the absolute number of different options available (Roe 2013; Stubbs 2001), and four studies changed the relative number (proportion) of less‐healthy (to healthier) options (Fiske 2004; Foster 2014; Kocken 2012; Pechey 2019). Of the two studies that changed absolute numbers of options, Roe 2013 decreased the number of different fruit and vegetables options offered at a snack occasion, and Stubbs 2001 decreased the total number of different meal options available to participants. Of the four studies that changed relative proportions, two studies decreased (Fiske 2004; Kocken 2012), respectively, the number of high‐fat and high‐calorie options available in vending machines (with corresponding increases in low‐fat and low‐calorie options). One study decreased the number of higher‐calorie (relative to lower‐calorie) beverages on display within supermarket checkout refrigerators (Foster 2014). The remaining study decreased the proportion of less‐healthy (i.e. higher‐energy) cooked meal, snack, cold drink, and sandwich options, with a corresponding increase in healthier (i.e. lower energy) options (Pechey 2019). Two availability studies were confounded to some degree with other concurrent interventions within the same physical environment (Fiske 2004; Foster 2014), the former also manipulating the addition of labels, and the latter additionally manipulating the visibility of products (but not meeting our criteria for a proximity intervention). It should be noted that, in order to ensure consistency in treatment and interpretation of effects, the comparisons within our analysis were always coded as reducing the availability of products, irrespective of whether the intervention was conceptualised by the authors as concerning increasing or decreasing availability. Most studies (4/6) manipulated snack foods or drinks (Fiske 2004; Foster 2014; Kocken 2012; Roe 2013). The included studies of availability investigated intervention exposures over extended time periods varying between 27 days (Stubbs 2001), and six months (Foster 2014). Three availability studies used randomised between‐participants designs (Fiske 2004; Foster 2014; Kocken 2012), and three used randomised within‐participants designs (Pechey 2019; Roe 2013; Stubbs 2001).
Eighteen of the included studies concerned manipulations of proximity (Cohen 2015; Engell 1996 (S1); Engell 1996 (S2); Greene 2017; Hunter 2018 (S1); Hunter 2018 (S2); Hunter 2019; Kongsbak 2016; Langlet 2017; Maas 2012 (S1); Maas 2012 (S2); Musher‐Eizenman 2010; Painter 2002; Privitera 2012 (S1); Privitera 2012 (S2); Privitera 2014; Wansink 2006; Wansink 2013a). In terms of the types of interventions used, most studies (14/18) increased the distance at which the product was placed from a set point, in all cases being the distance from a chair, table, or desk where a participant was positioned (Engell 1996 (S1); Engell 1996 (S2); Hunter 2018 (S1); Hunter 2018 (S2); Hunter 2019; Langlet 2017; Maas 2012 (S1); Maas 2012 (S2); Musher‐Eizenman 2010; Painter 2002; Privitera 2012 (S1); Privitera 2012 (S2); Privitera 2014; Wansink 2006). All of these studies manipulated snack foods or drinks intended for immediate consumption. In these studies, the comparisons concerned relatively small distances, with the greatest distance products were placed at ranging from 0.7 m, Hunter 2018 (S1); Hunter 2018 (S2); Hunter 2019, to 12.2 m, Engell 1996 (S1). Four further studies manipulated the order of products encountered along buffet or lunch lines to increase the distance of the product upon entering that line (Cohen 2015; Greene 2017; Kongsbak 2016; Wansink 2013a), all of which manipulated components of breakfast or lunch meals. Three proximity studies were confounded to some degree with other concurrent interventions within the same physical environment (Cohen 2015; Greene 2017; Kongsbak 2016). Cohen 2015 additionally manipulated placing fruit in attractive containers and other fruit options next to the cash registers, as well as prominently displaying signage promoting fruits and vegetables. Greene 2017 made various changes including to the way in which fruits were presented and labelled. Kongsbak 2016 also manipulated whether salad components were mixed together or placed separately. Similar to our availability analysis, comparisons were always coded as reducing the proximity of products, irrespective of whether the intervention was conceptualised by the authors as concerning increasing or decreasing proximity. The included studies of proximity focused on a range of products that can be characterised as healthier in six studies (fruit, vegetables, water) (Cohen 2015; Engell 1996 (S1); Engell 1996 (S2); Greene 2017; Privitera 2012 (S1); Privitera 2012 (S2)); less healthy in six studies (chocolate) (Hunter 2018 (S1); Hunter 2018 (S2); Maas 2012 (S1); Maas 2012 (S2); Painter 2002; Wansink 2006); and a mix of healthier and less healthy in five studies (Hunter 2019; Kongsbak 2016; Langlet 2017; Musher‐Eizenman 2010; Privitera 2014; Wansink 2013a). Studies typically investigated intervention exposures that were one‐off or, if repeated, were repeated over relatively short time periods. Only four studies involved exposing participants to interventions for a period of more than one day (Cohen 2015; Greene 2017; Painter 2002; Wansink 2006). Sixteen proximity studies used randomised between‐participants designs (Cohen 2015; Engell 1996 (S1); Engell 1996 (S2); Greene 2017; Hunter 2018 (S1); Hunter 2018 (S2); Hunter 2019; Kongsbak 2016; Langlet 2017; Maas 2012 (S1); Maas 2012 (S2); Musher‐Eizenman 2010; Privitera 2012 (S1); Privitera 2012 (S2); Privitera 2014; Wansink 2013a), and two used randomised within‐participants designs (Painter 2002; Wansink 2006).
The majority of studies (15/24) reported sources of funding. There was no apparent conflict of interest in the funding of 12 studies, given explicit statements denying involvement by agencies with possible commercial conflicts of interest in their results (Cohen 2015; Foster 2014; Greene 2017; Hunter 2018 (S1); Hunter 2018 (S2); Hunter 2019; Langlet 2017; Pechey 2019; Privitera 2012 (S1); Privitera 2012 (S2); Roe 2013; Wansink 2013a). This was unclear in the remaining 12 studies.
Further details on characteristics of interventions and comparators are provided in the Characteristics of included studies section.
We contacted the authors of eight studies with requests for data or clarifications on presented data (Fiske 2004; Langlet 2017; Musher‐Eizenman 2010; Painter 2002; Pechey 2019; Stubbs 2001; Wansink 2006; Wansink 2013a). We received data from Langlet 2017 and Pechey 2019, while we included Musher‐Eizenman 2010 in analysis using data provided in the report. Regarding the remaining five studies, we imputed standard deviations for four studies using methods described in the Measures of treatment effect section (Fiske 2004; Painter 2002; Stubbs 2001; Wansink 2006). We excluded Wansink 2013a from the analysis due to reporting data that were modelled, with the raw data based on observations unobtainable.
Excluded studies
We excluded 113 studies at the full‐text screening stage. Of these, we excluded 76 studies for not featuring an eligible intervention; 27 for not using an eligible study design; nine for not assessing selection or consumption as defined; and one study for not being a report of an empirical study. Excluded studies are listed in the Characteristics of excluded studies section.
Risk of bias in included studies
We used the RoB 2.0 tool to assess risk of bias for each of the included studies. A summary of these assessments is provided in Table 1. In terms of overall risk of bias, there were concerns about risk of bias for the majority of studies (20/24), with two of these assessed as at high risk of bias (Musher‐Eizenman 2010; Wansink 2013a). A text summary is provided below for each of the six individual components of the 'Risk of bias' assessment.
| Study | Bias arising from the randomisation process | Bias arising from the timing of identification and recruitment of individual participants in relation to timing of randomisation (CRCT only) | Bias due to deviations from intended interventions | Bias due to missing outcome data | Bias in measurement of the outcome | Bias in selection of the reported result | Overall risk of bias (selection) | Overall risk of bias (consumption) |
| Availability studies | ||||||||
| Some concerns | Low risk | Low risk | Low risk | Low risk | Low risk | Some concerns | N/A | |
| Low risk | Low risk | Low risk | Low risk | Low risk | Low risk | Low risk | N/A | |
| Some concerns | Low risk | Low risk | Low risk | Low risk | Low risk | Some concerns | N/A | |
| Some concerns | N/A | Low risk | Low risk | Low risk | Low risk | Some concerns | N/A | |
| Some concerns | N/A | Low risk | Low risk | Low risk | Low risk | Some concerns | Some concerns | |
| Some concerns | N/A | Low risk | Low risk | Low risk | Low risk | N/A | Some concerns | |
| Proximity studies | ||||||||
| Some concerns | Low risk | Low risk | Low risk | Low risk | Low risk | Some concerns | Some concerns | |
| Some concerns | N/A | Low risk | Low risk | Low risk | Low risk | N/A | Some concerns | |
| Some concerns | N/A | Low risk | Low risk | Low risk | Low risk | N/A | Some concerns | |
| Some concerns | Low risk | Low risk | Low risk | Low risk | Low risk | Some concerns | Some concerns | |
| Low risk | N/A | Low risk | Low risk | Low risk | Low risk | N/A | Low risk | |
| Low risk | N/A | Low risk | Low risk | Low risk | Low risk | N/A | Low risk | |
| Low risk | N/A | Low risk | Low risk | Low risk | Low risk | N/A | Low risk | |
| Some concerns | N/A | Low risk | Low risk | Low risk | Low risk | Some concerns | N/A | |
| Some concerns | Low risk | Low risk | Low risk | Low risk | Low risk | Some concerns | Some concerns | |
| Some concerns | N/A | Low risk | Low risk | Low risk | Low risk | N/A | Some concerns | |
| Some concerns | N/A | Low risk | Low risk | Low risk | Low risk | N/A | Some concerns | |
| Some concerns | N/A | Low risk | Some concerns | Low risk | Low risk | N/A | High risk | |
| Some concerns | N/A | Some concerns | Low risk | Low risk | Low risk | N/A | Some concerns | |
| Some concerns | N/A | Low risk | Low risk | Low risk | Low risk | N/A | Some concerns | |
| Some concerns | N/A | Low risk | Low risk | Low risk | Low risk | N/A | Some concerns | |
| Some concerns | N/A | Low risk | Low risk | Low risk | Low risk | N/A | Some concerns | |
| Some concerns | N/A | Some concerns | Low risk | Low risk | Low risk | N/A | Some concerns | |
| High risk | N/A | Low risk | Low risk | Low risk | Low risk | High risk | N/A | |
CRCT: cluster‐randomised controlled trials
Justifications for assessments are available at the following (http://dx.doi.org/10.6084/m9.figshare.9159824)
Bias arising from the randomisation process. This was the most common criterion for which risk of bias was apparent, with significant concerns regarding 19/24 studies (Cohen 2015; Engell 1996 (S1); Engell 1996 (S2); Fiske 2004; Greene 2017; Kocken 2012; Kongsbak 2016; Langlet 2017; Maas 2012 (S1); Maas 2012 (S2); Musher‐Eizenman 2010; Painter 2002; Pechey 2019; Privitera 2012 (S1); Privitera 2012 (S2); Privitera 2014; Roe 2013; Stubbs 2001; Wansink 2006), due primarily to an absence of detail in describing the randomisation and allocation concealment processes. We considered one study as at high risk of bias because it could not be ruled out based on the description that participants were allocated to intervention in an alternating sequence rather than as a result of randomisation (Wansink 2013a).
Bias arising from the timing of identification and recruitment of individual participants in relation to timing of randomisation. This assessment only applied to cluster‐randomised trials (Cohen 2015; Fiske 2004; Foster 2014; Kocken 2012; Langlet 2017), and all five such studies were considered as at low risk of bias for this domain.
Bias due to deviations from intended interventions. We judged all studies to be at low risk of bias on this domain, apart from two studies for which significant concerns were identified (Painter 2002; Wansink 2006). These two studies used cross‐over designs with short wash‐out periods, meaning that it is likely that participants were aware of being exposed to the intervention and the possibility of carry‐over effects could not therefore reasonably be dismissed.
Bias due to missing outcome data. This was typically judged to be at low risk. There were substantive concerns about risk of bias for one study in which there were substantial missing data (Musher‐Eizenman 2010). Additionally, the assignment and effect of missing participants was not detailed.
Bias in measurement of the outcome. All of the included studies used objective measures of behaviour, an inclusion criterion for the review. We judged this domain as low risk for all studies.
Bias in selection of the reported result. We judged this domain as low risk for all studies. However, it is notable that, to our knowledge, only five of the included studies were preregistered with publicly available study protocols (Cohen 2015; Hunter 2018 (S1); Hunter 2018 (S2); Hunter 2019; Pechey 2019).
Effects of interventions
See: Summary of findings for the main comparison Lower versus higher availability (i.e. fewer versus more options) of food products for changing quantity of food selected or consumed; Summary of findings 2 Lower versus higher proximity (i.e. placed farther away versus placed nearer) of food products for changing quantity of food selected or consumed
We have reported results separately for both availability interventions and proximity interventions, for both selection and consumption outcomes. As we identified no study in which alcohol or tobacco products were the target of the intervention, the results of this review relate solely to food. Results of meta‐analyses are presented as standardised mean differences (SMDs) with 95% confidence intervals (CIs). Using a similar approach to re‐expressing effect sizes in a more familiar metric as we have used previously (Crockett 2018; Hollands 2015), we have also re‐expressed SMDs based on estimated average (mean) consumption levels and standard deviations (SDs) among representative samples of the UK population. For this translation, we calculated an estimate of the percentage reduction in energy consumed over a typical snack occasion, given that the included studies typically manipulated snack foods intended for immediate consumption. For selection outcomes, it was assumed that all food that is selected is consumed. We used a mean (SD) of 200 (±63) kilocalories(kcal) as a baseline value, given guidance concerning a 200 kcal threshold for energy consumption from snacks (NHS 2018). These figures were based on daily energy intake from food among UK adults (aged 19 to 64) estimated at 1773 ± 561 kcal by the most recent available years (7‐8, i.e. 2014/15 to 2015/16) of the UK National Diet and Nutrition Survey (Public Health England 2018a). However, it is important to note the limitations of such translations (Hollands 2015). Firstly, these re‐expressed values relate to UK populations (although readers could translate the results in similar fashion using representative survey data from other countries). Secondly, because such translations necessarily extrapolate beyond the scope of the included studies and data therein, they are intended only to be illustrative for guiding interpretation of the meta‐analyses. In this particular case, there is additional extrapolation in assuming that the variance associated with total daily energy intake will be proportionate for lower levels of energy intake.
Effect on selection of lower availability of food products
For our primary analysis, useable outcome data were available for three comparisons involving 154 participants and identified from three food studies that changed either the relative number (proportion) of less‐healthy (to healthier) options, or changed the absolute number of different options available (Kocken 2012; Pechey 2019; Roe 2013). Kocken 2012 decreased the number of high‐calorie options available in vending machines (with corresponding increases in low‐calorie options). Pechey 2019 changed the relative proportion of less‐healthy (i.e. higher energy) cooked meal, snack, cold drink, and sandwich options, with a corresponding change in healthier (i.e. lower energy) options. Roe 2013 changed the absolute number of different fruit and vegetable options.
Random‐effects meta‐analysis produced a summary mean effect size (SMD) of −1.13 (95% CI −1.90 to −0.37, P = 0.003), meaning that lower availability of a targeted range or category of food(s) ‐ here being a lower proportion of less‐healthy (to healthier) options or a lower absolute number of different options ‐ decreased the amount that was selected, with a large relative effect size (Figure 3; summary of findings Table for the main comparison). Our interpretation of the size of this summary effect suggests that if availability was reduced for an assumed average snack occasion of 200 (±63) kcal, adults would select 71 kcal fewer, reducing energy selected by 35.6% (59.9% to 11.7% less). The I2 statistic (64%) indicates that a substantial amount of the total variance in study‐level estimates of this effect was attributable to statistical heterogeneity, which was consistent with differences in the characteristics of the studies within this analysis. When a fixed‐effect model was used, the effect was similar: SMD −1.01 (95% CI −1.35 to −0.67, P < 0.001).
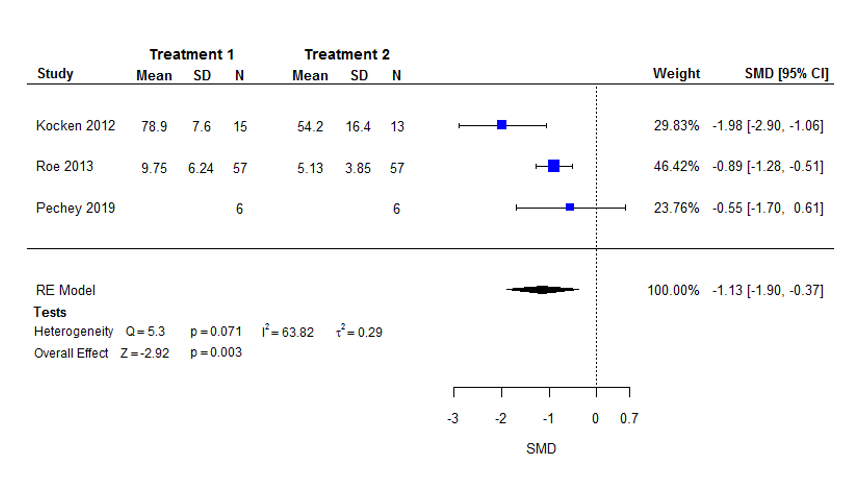
Forest plot of the standardised mean difference (SMD) in selection with higher (intervention 1) versus lower (intervention 2) availability of food products (i.e. more versus fewer options).
Assessing evidence of possible publication bias via funnel plots was not appropriate due to the low number of studies. We were unable to conduct meta‐regression analysis due to the lack of studies, with fewer than 10 data points for all variables.
GRADE assessment indicated that the evidence for this outcome is of low certainty, meaning that current evidence provides some indication of the likely effect, but the likelihood that the actual effect will be substantially different is high. We reached this judgement through consideration of the following criteria. We downgraded the current evidence by one level (i.e. serious limitations) due to study limitations because we judged the study‐level estimate of this effect to have significant concerns related to risk of bias. We also downgraded the evidence by one level due to imprecision, because even though the lower CI value indicated a small‐moderate effect, the CIs were wide, and the number of participants (sample size) incorporated into this meta‐analysis was notably small and did not exceed the optimal information size (i.e. the number of participants generated by a conventional sample size calculation for a single adequately powered trial powered conservatively to detect a small effect size). We did not downgrade the evidence for inconsistency (effect sizes were in a consistent direction with some overlap of CIs, although heterogeneity was considerable), indirectness, or for other considerations including publication bias.
No data were imputed for studies included in the primary analysis, therefore the planned sensitivity analysis concerning imputed data was not applicable. We excluded data from two additional studies from the primary analysis for this outcome due to the intervention effect being confounded as part of multicomponent interventions (Fiske 2004; Foster 2014). In a prespecified sensitivity analysis, we reinstated these data, resulting in an analysis of five comparisons, involving 172 participants, identified from five food studies (Fiske 2004; Foster 2014; Kocken 2012; Pechey 2019; Roe 2013). This did not alter the result or interpretation, with point estimates and 95% CIs being similar for both random‐effects and fixed‐effect models (random‐effects SMD: −1.01 (95% CI −1.57 to −0.45, P < 0.001); fixed‐effect SMD: −0.97 (95% CI −1.30 to −0.65, P < 0.001)).
Effect on consumption of lower availability of food products
For our primary analysis, useable outcome data were available for three comparisons involving 150 participants in two food studies that changed the absolute number of different options available (Roe 2013; Stubbs 2001). Roe 2013 changed the absolute number of different fruit and vegetable options, whilst Stubbs 2001 altered the absolute number of different meal options. Random‐effects meta‐analysis produced a summary mean effect size (SMD) of −0.55 (95% CI −1.27 to 0.18, P = 0.14) (Figure 4; summary of findings Table for the main comparison). This result indicated uncertainty about the effect of lower availability ‐ here being a lower absolute number of different options of a targeted range or category of food(s) – on amount consumed, with the point estimate indicating a moderate reduction in consumption, and wide CIs that included the possibility of a small increase in consumption. When a fixed‐effect model was used, the mean effect size was larger, with CIs not including zero: −0.84 (95% CI −1.18 to −0.49, P < 0.001). Our interpretation of the size of the summary effect from the random‐effects model suggests that if availability was reduced for an assumed average snack occasion of 200 (±63) kcal, adults would consume 35 kcal fewer, reducing energy consumed by 17.3% (40% less to 5.7% more). The I2 statistic (63%) indicates that a substantial amount of the total variance in study‐level estimates of this effect was attributable to statistical heterogeneity, which was consistent with differences in the characteristics of the two studies within this analysis. A sensitivity analysis in which a single average SMD was computed for each multi‐arm study produced SMD −0.69 (95% CI −1.63 to 0.24, P = 0.15) in a random‐effects analysis based on two results.

Forest plot of the standardised mean difference (SMD) in consumption with higher (intervention 1) versus lower (intervention 2) availability of food products (i.e. more versus fewer options).
Assessing evidence of possible publication bias via funnel plots was not appropriate due to the low number of studies. We did not conduct meta‐regression analyses due to the lack of studies, with fewer than 10 data points for all variables.
GRADE assessment indicated that the evidence for this outcome is of low certainty, meaning that current evidence provides some indication of the likely effect, but the likelihood that the actual effect will be substantially different is high. We reached this judgement through consideration of the following criteria. We downgraded the current evidence by one level (i.e. serious limitations) due to study limitations, as we judged all study‐level estimates of this effect to have significant concerns related to risk of bias. We also downgraded the evidence by one level due to imprecision. Whilst the point estimate indicated a moderate effect on reducing consumption, the CIs were wide and included the possibility of a small effect on increasing consumption. Furthermore, the number of participants (sample size) incorporated into this meta‐analysis was notably small and did not exceed the number of participants generated by a conventional sample size calculation for a single adequately powered trial, powered conservatively to detect a small effect size (optimal information size). We did not downgrade the evidence for inconsistency, as whilst statistical heterogeneity was substantial (although not considerable), effect sizes were in a consistent direction, and the meta‐analysis result was driven mainly by a single study (Roe 2013). We also did not downgrade the evidence for indirectness, as all included studies assessed participants, interventions, comparators, and outcomes that met the eligibility criteria for this review. We did not specify that any particular characteristics were more informative than others in addressing the objectives of the review, such as those conducted in particular settings, although the included studies for this outcome were from both field, Roe 2013, and laboratory, Stubbs 2001, settings. Finally, we did not downgrade the evidence for other considerations including publication bias because there was no clear evidence of such bias, and we judged that there were no applicable reasons to consider upgrading the certainty of the evidence.
Our prespecified sensitivity analyses concerning imputed data meant the removal of data from Stubbs 2001, with only the Roe 2013 data remaining, resulting in an effect size (SMD) of −1.07 (95% CI −1.47 to −0.68). This analysis did not significantly alter interpretation, and represents only a single study, but relative to our primary analysis, the point estimate indicated a larger reduction in consumption, with wide CIs that no longer include the possibility of an increase in consumption. The planned sensitivity analysis concerning additional confounded intervention components was not applicable for this outcome.
Effect on selection of lower proximity (i.e. food products placed farther away)
For our intended primary analysis of selection outcomes for proximity interventions, we identified only one study (Langlet 2017). One comparison (41 participants) found that exposure to food placed farther away resulted in a moderate reduction in its selection: SMD −0.65 (95% CI −1.29 to −0.01, P = 0.045), equivalent to adults selecting 20.5% less energy (40.6% to 0.3% less) (summary of findings Table 2).
Assessing evidence of possible publication bias via funnel plots was not appropriate due to insufficient studies. Meta‐regression analysis could also not be conducted due to insufficient studies, with fewer than 10 data points for all variables.
GRADE assessment indicated that the evidence for this outcome is of very low certainty, meaning that the current evidence does not provide a reliable indication of the likely effect, and that the likelihood that the actual effect will be substantially different is very high. We reached this judgement through consideration of the following criteria. We downgraded the current evidence by one level (i.e. serious limitations) due to study limitations because we judged the study‐level estimate of the effect to have significant concerns related to risk of bias. We also downgraded the evidence by one level for imprecision because the effect estimate derived from a single small study. We downgraded the evidence a further level for indirectness, because all the data derived from a study conducted in a laboratory setting, meaning that it may be less directly informative to real‐world implementation of the intervention. We did not downgraded the evidence for inconsistency or publication bias.
The planned sensitivity analysis concerning imputed data was not applicable for this outcome. There were additional useable outcome data from three food studies that were excluded from the primary analysis for this outcome due to the intervention effect being confounded as part of multicomponent interventions (Cohen 2015; Greene 2017; Kongsbak 2016). In a prespecified sensitivity analysis, we reinstated these data, resulting in an analysis of four comparisons (1703 participants). This did not result in an interpretation that differed from the primary analysis. Random‐effects meta‐analysis produced a summary mean effect size (SMD) of −0.71 (95% CI −1.08 to −0.33, P < 0.001), meaning that food products placed farther away resulted in a moderate decrease in selection equivalent to 22.4% less energy (34% to 10.4% less) being selected by adults on each 200 kcal snack occasion. This result was identical when a fixed‐effect model was used. The I2 statistic (0%) indicates that none of the total variance in study‐level estimates of this effect was attributable to statistical heterogeneity.
Effect on consumption of lower proximity (i.e. food products placed farther away)
For our planned primary analysis, outcome data were available for 17 comparisons, involving 1194 participants, identified from 14 food studies (Engell 1996 (S1); Engell 1996 (S2); Hunter 2018 (S1); Hunter 2018 (S2); Hunter 2019; Langlet 2017; Maas 2012 (S1); Maas 2012 (S2); Musher‐Eizenman 2010; Painter 2002; Privitera 2012 (S1); Privitera 2012 (S2); Privitera 2014; Wansink 2006). All of these studies increased the distance at which the product was placed from a set point, in all cases being the distance between a chair, table, or desk and where a participant was positioned. Random‐effects meta‐analysis produced a summary mean effect size (SMD) of −1.30 (95% CI −2.13 to −0.46, P = 0.002), meaning that placing food products farther away decreased the amount that was consumed, with a large relative effect size. This result differed in magnitude when a fixed‐effect model was used, showing a reduced summary mean effect size (SMD) of −0.55, with narrower CIs (95% CI −0.68 to −0.42, P < 0.001). However, the I2 statistic (97%) indicates that most of the total variance in study‐level estimates of this effect was attributable to statistical heterogeneity, suggesting that the source of this heterogeneity should be identified. Two studies were responsible for a significant proportion of the observed heterogeneity as a result of their outlying respective summary effect sizes of (SMD) −5.34 and −6.96 (Privitera 2012 (S1); Privitera 2012 (S2)). We have found no clear explanation for why these studies would have generated such extreme, heterogeneous estimates: study, intervention, and participant characteristics did not differ notably from other studies included in the analysis. The estimated effect sizes are larger than we consider to be plausible, therefore these data were removed from the main analysis. Removing these two studies meant that this principal analysis involved 15 comparisons (1098 participants) identified from 12 food studies (Engell 1996 (S1); Engell 1996 (S2); Hunter 2018 (S1); Hunter 2018 (S2); Hunter 2019; Langlet 2017; Maas 2012 (S1); Maas 2012 (S2); Musher‐Eizenman 2010; Painter 2002; Privitera 2014; Wansink 2006). This resulted in a reduced but still moderate effect size for a random‐effects model, with a reduced I2 statistic value of 61%: SMD −0.60 (95% CI −0.84 to −0.36, P < 0.001) (Figure 5; summary of findings Table 2). Our interpretation of the size of this summary effect suggests that that if proximity was reduced for an assumed average snack occasion of 200 (±63) kcal, adults would select 38 kcal less, reducing energy consumed by 18.9% less energy (26.5% to 11.3% less). We consider this revised analysis of 15 comparisons with outlier values excluded to be the primary analysis for this outcome, and is the result reported in the corresponding summary of findings Table 2 and used as the basis for subsequent meta‐regression analyses and sensitivity analyses described below. A similar effect was estimated when a fixed‐effect model was used: SMD −0.45 (95% CI −0.58 to −0.32, P < 0.001). A sensitivity analysis in which a single average SMD was computed for each multi‐arm study produced SMD −0.59 (95% CI −0.85 to −0.33, P < 0.001) in a random‐effects analysis based on 12 results.

Forest plot of the standardised mean difference (SMD) in consumption with higher (intervention 1) versus lower (intervention 2) proximity of food products (i.e. placed nearer versus farther away).
An asymmetrical funnel plot was observed for this analysis (Figure 6), with Egger's test giving a P < 0.001 (Z = −4.0853), suggesting the possible presence of publication bias (since the larger studies have SMD estimates nearer 0). The determination of possible publication bias informed the GRADE assessment for this outcome.
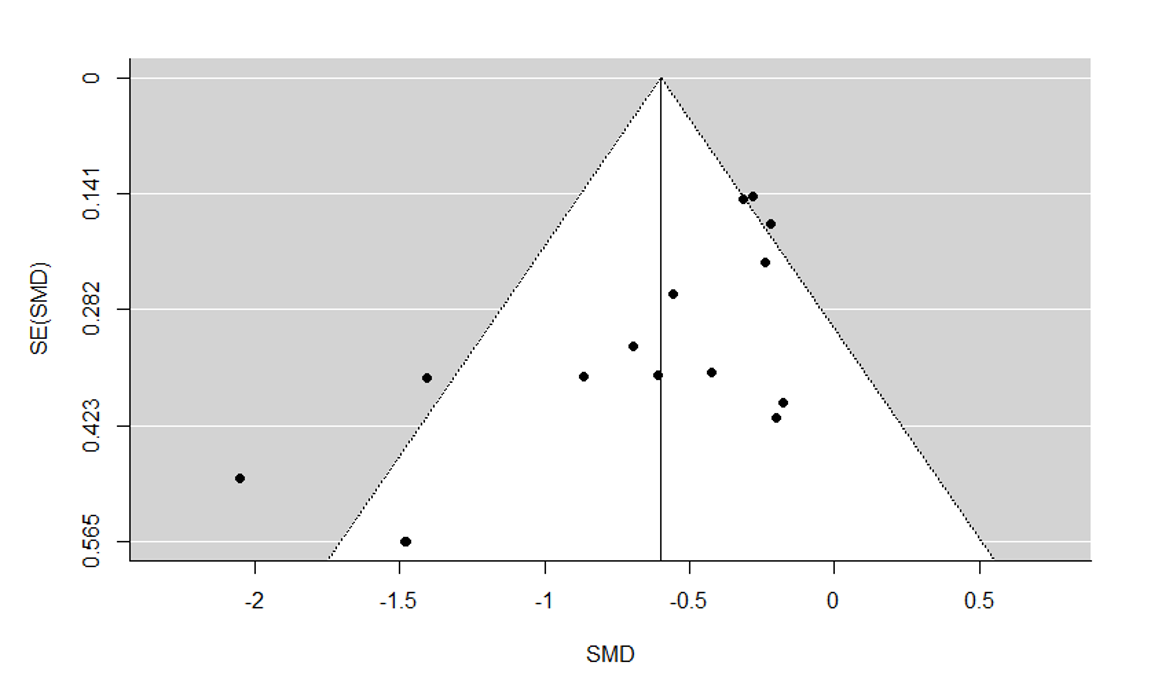
Funnel plot for meta‐analysis of consumption with higher versus lower proximity.
Potential modifiers of the effect on consumption (meta‐regression analyses)
For the effect of proximity on consumption, there were sufficient data as per our criteria (i.e. data points from at least 10 studies for at least some extracted variables) to conduct meta‐regression analyses to investigate potential effect modifiers. Whilst the majority of candidate variables were excluded due to either insufficient data or the absence of variability in data values between studies, univariable meta‐regression analysis was possible for 10 extracted variables, with numerical results presented in full in Appendix 3. We observed that four of these covariates were associated with the effect of proximity on consumption. We have outlined the stages of the meta‐regression analyses below (as described in Data synthesis), and for each stage, have highlighted any variables observed to be associated with the intervention effect.
At Stage 1, we conducted the meta‐analysis described above, followed at each subsequent stage with a meta‐regression analysis.
At Stage 2, where we examined study characteristics as covariates, the following three variables were significantly associated with the intervention effect.
-
Product‐outcome relationship. Effect sizes for lower (versus higher) proximity were larger when the specific product(s) that was manipulated was the only product available to participants, as opposed to there being other unmanipulated products available. It is plausible that the absence of any other products would increase the effect of the intervention, given less potential for its effect to be diluted.
-
Summary risk of bias. Effect sizes for lower (versus higher) proximity were larger for studies at high risk of bias, versus both low risk of bias and those where there were some concerns.
-
Socioeconomic context. Effect sizes for lower (versus higher) proximity were larger when deprivation status was low, than among studies with samples that were both high and low in deprivation.
At Stage 3, we examined intervention characteristics as covariates, and the following single variable was significantly associated with the intervention effect.
-
Absolute difference in proximity. Effect sizes for lower (versus higher) proximity were larger the farther away the product was placed relative to a comparator. Increasing distance resulting in an increased intervention effect is consistent with the theory underlying why the intervention might work.
At Stage 4, we examined participant characteristics as covariates, and found no variables to be associated with the intervention effect.
In summary, meta‐regression analyses indicated that the intervention effect was greater under four conditions: the farther away the product was placed relative to a comparator; when only the targeted product(s) (as opposed to a wider range) was available; when participants were of low (versus both high and low) deprivation status; and when the study was at high risk of bias. The results of this analysis should be interpreted with caution because the numbers of data points available for each included explanatory variable only barely exceeded the prespecified minimum level for inclusion (i.e. available data from a minimum of 10 studies). Furthermore, the associations cannot be interpreted as causal, and some of the study characteristics were correlated with each other. For example, all of the studies assessed as at high risk/some concerns of bias were in low deprivation contexts (whilst all studies with samples that were both high and low in deprivation were at low risk of bias); and studies where there were other unmanipulated products available tended to be those in which the absolute difference in proximity was greater.
GRADE assessment applied to the analysis that excluded outliers indicated that the evidence for this outcome is of low certainty, meaning that current evidence provides some indication of the likely effect, but the likelihood that the actual effect will be substantially different is high. We reached this judgement through consideration of the following criteria. We downgraded the current evidence by one level (i.e. serious limitations) due to study limitations, as we judged the majority of study‐level estimates of this effect to have significant concerns related to risk of bias. We did not downgrade the evidence for imprecision because even the lower CI value indicated a small‐to‐moderate intervention effect, and the number of participants (sample size) incorporated into this meta‐analysis was substantial and exceeded the optimal information size. We did not downgrade the evidence for inconsistency (as although heterogeneity was substantial, effect sizes were in a consistent direction with reasonable overlap of CIs) or indirectness. We downgraded the evidence by one level for publication bias because formal assessment of the degree of asymmetry present in a funnel plot suggested its presence.
Our prespecified sensitivity analyses concerning imputed data meant the removal of data from Painter 2002 and Wansink 2006 from the primary analysis. This did not alter the results or interpretation, with point estimates and 95% CIs being similar to our primary meta‐analysis (random‐effects SMD −0.66 (95% CI −0.94 to −0.37, P < 0.001); fixed‐effect SMD −0.46 (95% CI −0.60 to −0.32, P < 0.001)). We excluded data from two studies from the primary analysis for this outcome due to the intervention effect being confounded as part of multicomponent interventions (Cohen 2015; Greene 2017). In a prespecified sensitivity analysis, we reinstated these data, resulting in an analysis of 17 comparisons (2695 participants) identified from 14 food studies (Cohen 2015; Engell 1996 (S1); Engell 1996 (S2); Greene 2017; Hunter 2018 (S1); Hunter 2018 (S2); Hunter 2019; Langlet 2017; Maas 2012 (S1); Maas 2012 (S2); Musher‐Eizenman 2010; Painter 2002; Privitera 2014; Wansink 2006). This did not alter the result or interpretation, with point estimates and 95% CIs being similar to our primary meta‐analysis (random‐effects SMD −0.56 (95% CI −0.79 to −0.33, P < 0.001); fixed‐effect SMD −0.44 (95% CI −0.57 to −0.31, P < 0.001)).
Secondary outcomes
Secondary outcomes, specified as selection and consumption outcomes relating to products not manipulated by the intervention, were rarely reported. This was principally because interventions manipulated all the available products, or because outcomes relating to non‐manipulated products were not assessed. One availability study included secondary outcomes that met our criteria: Pechey 2019 reported that the intervention resulted in significantly less total energy (−7.2%) being purchased, that is energy from all food categories, whether targeted by the intervention or not. Two proximity studies included pertinent secondary outcomes. Cohen 2015 reported no effect of the intervention on selection and consumption of non‐manipulated main meals, and Kongsbak 2016 reported that the intervention resulted in less total energy being selected. Such limited reporting of these outcomes may be expected in laboratory studies featuring single or small numbers of products, but in this body of studies it was also rarely reported in field settings, which may also partly reflect the complexity of capturing and interpreting such data in complex real‐world food environments. In sum, data on secondary outcomes were sparse and difficult to compare across studies due to differing study characteristics. There was, however, a small amount of evidence suggesting that compensatory behaviour ‐ for example increased selection or consumption of non‐manipulated products ‐ did not occur. Furthermore, there was an absence of clear evidence suggesting that such compensatory behaviour did occur.
Discussion
Summary of main results
The evidence in this review suggests that people select less of a targeted range or category of food(s) when fewer options of that food are available. Because the direction of comparisons within the analysis is interchangeable, they likewise select more when more options are available. However, there was greater uncertainty about the effect of such availability interventions on consumption. A separate body of evidence suggests that people consume less food when products are placed farther away (and likewise more when placed nearer), with a less certain effect on selection. Consequently, these interventions have the potential to have beneficial or harmful effects on health, depending on the characteristics of the food(s) that they focus upon.
The summary effect sizes derived from meta‐analyses were considerable, suggesting potential impacts of between 17% and 36% on energy selected and consumed on an average snack occasion. Although such estimates are necessarily tentative due to limitations of the underlying data and the assumptions inherent to generating and applying them, if sustained effects of such magnitude were realised and extended to foods consumed over each day, reductions in daily energy intake would have the potential to make meaningful contributions to addressing major risk factors for non‐communicable disease. For example, 10‐year weight gain between 1999 and 2009 among adults in England (i.e. 9 kg at the 90th percentile) has been estimated to be equivalent to extra energy intake of around 24 kcal per day over the same period (an amount equivalent to approximately 1.4% of average daily energy intake for UK adults) (Department of Health 2011). Any sustained reductions in daily energy intake exceeding this level are therefore likely to be effective in helping to prevent further weight gain in the population. Whilst these illustrations highlight the promise of these interventions, the sustainability of their effects has yet to be established, with the majority of studies in this review featuring short‐term exposures to interventions, and because the certainty of the evidence varied and was assessed as low or very low for all outcomes, we can only have limited confidence in the effect estimates.
Importantly, the evidence base for this review was limited in quantity, often severely so, and was entirely absent for alcohol and tobacco products. Furthermore, evidence was sparse for secondary outcomes that could indicate the potential for unintended compensatory behaviour, although there was a small amount of evidence suggesting that this did not occur in response to the intervention and an absence of clear evidence suggesting that it did. Due to the lack of data, we were also unable to satisfactorily address the second objective of the review, concerning potential modifiers of the observed intervention effects (see Overall completeness and applicability of evidence).
Overall completeness and applicability of evidence
The completeness and applicability of the evidence was limited as a result of several characteristics of the evidence base. The synthesised evidence was collected from 24 included studies, with only six reporting availability interventions. In only one primary analysis (the effect of proximity on consumption) did the sample size exceed the optimal information size. The sample sizes weaken confidence that these studies enable us to address the first objective of this review. An additional impact of the limited quantity of evidence is that this reduces the representativeness of the evidence base across a myriad of possible study, intervention, and participant contexts. This means that the extent to which the results of the review apply to other contexts is uncertain. For example, the majority of studies were conducted in the USA, with no studies in LMICs, and participants were typically characterised by low social and material deprivation. These factors limit assessment of social differentiation in effects relevant to health equity. For example, while we have no reason to expect that mechanisms by which exposure to these interventions may influence behaviour will differ substantively and systematically between people living in HICs and those living in LMICs, a range of socio‐cultural, economic, and contextual differences between these groups could plausibly modify effects. Studies are needed that focus on these contexts.
A further limitation regarding completeness concerns the setting of studies. The majority of included studies were conducted in laboratory settings ‐ which even when relatively naturalistic in their design cannot convincingly replicate uncontrolled, real‐world settings ‐ although this limitation does apply differentially to availability and proximity interventions. For availability interventions, while there was a very small number of studies, the majority were conducted in field settings (namely schools, a childcare facility, worksite cafeterias, and supermarkets) and intervention exposures were over prolonged time periods. Despite this, there were insufficient data to draw meaningful conclusions specific to any one type of field setting (e.g. schools or supermarkets), given that contextual characteristics and participant behaviours are likely to differ substantially between these settings. Only four proximity studies were conducted in field settings. Laboratory‐based studies of proximity interventions, as is typical for such contexts, usually assessed one‐off exposures or repeated exposures over relatively short time periods, with correspondingly short‐term outcomes. They also usually exposed participants to a single, or small range of, snack food intended for immediate consumption, limiting the degree to which such effects can be generalised to complex real‐world food environments.
The most notable gap in this evidence base, however, was the absence of any eligible studies investigating effects of these interventions on selection or consumption of either alcohol or tobacco products. This finding is consistent with the small proportion of studies on alcohol and tobacco compared with food products, which we found in a large scoping review of interventions within physical micro‐environments (Hollands 2013a; Hollands 2013b). This may be attributable to both a greater interest in, and more opportunities for, intervening on food products due to the broad range that are available, their ubiquity in multiple environments, and the necessity of their consumption. It may also reflect the proportion of research focused on reducing consumption of tobacco and alcohol, compared with food. Research on tobacco and alcohol has tended to consider treatments for the subgroup of the population addicted to those products, whereas studies in relation to food are more likely to take a whole‐population approach. Furthermore, tobacco and alcohol are more highly regulated products in terms of where and how they can be sold, which may limit opportunities for research relative to food products.
Finally, due to the relatively small amount of available data, it was typically not possible to assess the impact of variations in characteristics between included studies on intervention effects. This meant that it was not possible to satisfactorily address the second objective of this review, namely to assess potential effect modifiers. It was only the effect of proximity on consumption that allowed meta‐regression analyses ‐ including only a small number of modifying variables ‐ to be conducted. These analyses indicated that the intervention effect was greater: the farther away the product was placed relative to a comparator; when only the targeted product(s) (as opposed to a wider range) was available; when participants were of low (versus both high and low) deprivation status; and when the study was at high risk of bias. However, because the amount of data available only barely exceeded that which we set as the absolute minimum necessary, and due to their essentially observational nature, these findings should be given considerable caution. Before they can be meaningfully interpreted, they will require confirmation and replication in further research involving larger datasets, but ultimately may prove useful in evaluating, developing, and targeting interventions. Similarly, we were typically unable to examine whether potentially important associations were absent, in other words whether intervention effects were robust to variations in key intervention and participant characteristics. For example, while meta‐regression analyses did not find that the proportion of female participants modified the intervention effect, which could add credence to the idea that altering environmental cues has the potential to impact behaviour across populations, we were unable to examine other key characteristics such as age or BMI.
Quality of the evidence
At the level of individual studies, the large majority of studies were subject to significant concerns about risk of bias, reflecting serious concerns about study limitations, compounded by unclear and incomplete reporting of study methods. Commonly, this derived from concerns about bias arising from the randomisation process, but we could not identify any obvious reason to prevent the implementation of unbiased procedures for random sequence generation and allocation concealment or reporting thereof. At the level of the evidence available for each outcome, we accounted for the significant concerns about risk of bias by downgrading each of these outcomes by one level within GRADE assessments. When also considering the full set of GRADE criteria for each outcome (detailed in Effects of interventions), we judged the evidence base to be of low certainty for the effect of availability on both selection and consumption (summary of findings Table for the main comparison); low certainty for the effect of proximity on consumption; and very low certainty for the effect of proximity on selection (summary of findings Table 2). In sum, this confers, at best, limited confidence in our estimated effects and necessitates due caution in their interpretation.
It is noted that Brian Wansink is an author on four of the studies included in the review (Greene 2017; Painter 2002; Wansink 2006; Wansink 2013a), two of which (Painter 2002; Wansink 2006) contributed data to our primary meta‐analyses. This researcher has been subject to multiple retractions of his work due to academic misconduct (Munafò 2018). To date, none of the studies included in this review have been retracted, but should this occur, we will withdraw that study’s data from updated meta‐analyses conducted as part of a future update. Whilst these retractions introduce additional uncertainty regarding the veracity of other, unretracted studies he has authored, we chose not to report analyses that remove data from any studies authored by Wansink. This would assume that Wansink was principally responsible for the data reported in all studies for which he is an author ‐ an unreasonable assumption without specific knowledge, and potentially unfair to co‐authors. Relatedly, it could also set an unwelcome precedent for consistently excluding all data linked by co‐authorship to an author who has had papers retracted due to academic misconduct.
Finally, we note that for 12 of the studies, potential commercial conflicts of interest were unclear, thus preventing us from eliminating the possibility that the review results could be biased in some way by interests of the study authors.
Potential biases in the review process
The potential for review author error and bias was reduced by involving at least two independent review authors in the selection of studies and the data extraction and study assessment processes. Whilst it remains possible that we failed to identify all relevant research for inclusion in the review, we used an extensive and highly sensitive search strategy involving a comprehensive range of databases and other sources, as well as backwards and forwards citation searches.
Agreements and disagreements with other studies or reviews
We are not aware of other systematic reviews that focus specifically on these interventions across all settings and product types and that also include a quantitative synthesis. Bucher 2016 conducted a systematic review with substantial content overlap with the 'proximity studies' within the current review. Although that review did not meta‐analyse the identified studies, the conclusions were consistent with those of the current review, namely that manipulating the order of food products or their proximity can influence food choice. A wide range of other reviews include, but are not limited to, one or both of the target interventions within a scope determined by specific settings or product types. For example, Broers 2017 conducted a systematic review of a range of nudging interventions applied to fruit and vegetable choice, concluding that the largest effect was associated with interventions that altered the placement of products. Grech 2015 reviewed evidence for nutrition interventions applied to vending machines, concluding that there was evidence that altering availability was an effective means of improving the nutritional quality of products purchased. Finally, Cameron 2016 reviewed a broad range of evidence for supermarket‐based interventions that included those changing product availability and placement, but the nature of the evidence meant that it was not possible to estimate effects of specific intervention strategies.

Final conceptual model. Changes from the provisional conceptual model (Hollands 2017b), comprising two additions, are shown in red type.

Study flow diagram.

Forest plot of the standardised mean difference (SMD) in selection with higher (intervention 1) versus lower (intervention 2) availability of food products (i.e. more versus fewer options).

Forest plot of the standardised mean difference (SMD) in consumption with higher (intervention 1) versus lower (intervention 2) availability of food products (i.e. more versus fewer options).

Forest plot of the standardised mean difference (SMD) in consumption with higher (intervention 1) versus lower (intervention 2) proximity of food products (i.e. placed nearer versus farther away).

Funnel plot for meta‐analysis of consumption with higher versus lower proximity.
| Lower versus higher availability of food products for changing quantity of food selected or consumed | |||||
| Population: Adults and children | |||||
| Outcomes | Illustrative comparative risks (95% CI) | Relative effect | Number of participants | Certainty of evidence | |
| Assumed risk: higher availability of food products (more options) | Corresponding risk: lower availability of food products (fewer options) | ||||
| Selection | Mean energy selected on an average snack occasion of 200 (±63) kcal1 | Mean energy selected on an average snack occasion would be 71 kcal (35.6%) less with lower availability (120 kcal fewer to 23 kcal fewer; 59.9% less to 11.7% less). | Mean selection in the lower availability group was 1.13 standard deviations lower (1.90 lower to 0.37 lower). | 154 | ⊕⊕⊝⊝ |
| Consumption | Mean energy intake on an average snack occasion of 200 (±63) kcal | Mean energy intake on an average snack occasion would be 35 kcal (17.3%) less with lower availability (80 kcal fewer to 11 kcal more; 40% less to 5.7% more). | Mean consumption in the lower availability group was 0.55 standard deviations lower (1.27 lower to 0.18 more). | 150 | ⊕⊕⊝⊝ |
| The basis for the assumed risk is provided in Footnotes.5 The corresponding risk (and its 95% confidence interval) is based on the assumed risk and the relative effect of the intervention (and its 95% CI). The relative effect is derived from the primary random‐effects meta‐analysis for the outcome. CI: confidence interval; kcal: kilocalories; RCT: randomised controlled trial | |||||
| GRADE Working Group grades of evidence | |||||
| 1Assumes that all foods selected are consumed. | |||||
| Lower versus higher proximity of food products for changing quantity of food selected or consumed | |||||
| Patient or population: Adults and children | |||||
| Outcomes | Illustrative comparative risks (95% CI) | Relative effect | Number of participants | Certainty of evidence | |
| Assumed risk: higher proximity of food products (placed nearer) | Corresponding risk: lower proximity of food products (placed farther away) | ||||
| Selection | Mean energy selected on an average snack occasion of 200 (±63) kcal1 | Mean energy selected on an average snack occasion would be 41 kcal (20.5%) less with lower proximity (81 kcal fewer to 1 kcal fewer; 40.6% less to 0.3% less). | Mean selection in the lower proximity group was 0.65 standard deviations lower (1.29 lower to 0.01 lower). | 41 (1 RCT; 1 comparison) | ⊕⊝⊝⊝ |
| Consumption | Mean energy intake on an average snack occasion of 200 (±63) kcal | Mean energy intake on an average snack occasion would be 38 kcal (18.9%) less with lower proximity (53 kcal fewer to 23 kcal fewer; 26.5% less to 11.3% less). | Mean consumption in the lower availability group was 0.60 standard deviations lower (0.84 lower to 0.36 lower). | 1098 (12 RCTs; 15 comparisons) | ⊕⊕⊝⊝ |
| The basis for the assumed risk is provided in Footnotes.6 The corresponding risk (and its 95% confidence interval) is based on the assumed risk and the relative effect of the intervention (and its 95% CI). The relative effect is derived from the primary random‐effects meta‐analysis for the outcome. CI: confidence interval; kcal: kilocalories; RCT: randomised controlled trial | |||||
| GRADE Working Group grades of evidence | |||||
| 1Assumes that all foods selected are consumed. | |||||
| Study | Bias arising from the randomisation process | Bias arising from the timing of identification and recruitment of individual participants in relation to timing of randomisation (CRCT only) | Bias due to deviations from intended interventions | Bias due to missing outcome data | Bias in measurement of the outcome | Bias in selection of the reported result | Overall risk of bias (selection) | Overall risk of bias (consumption) |
| Availability studies | ||||||||
| Some concerns | Low risk | Low risk | Low risk | Low risk | Low risk | Some concerns | N/A | |
| Low risk | Low risk | Low risk | Low risk | Low risk | Low risk | Low risk | N/A | |
| Some concerns | Low risk | Low risk | Low risk | Low risk | Low risk | Some concerns | N/A | |
| Some concerns | N/A | Low risk | Low risk | Low risk | Low risk | Some concerns | N/A | |
| Some concerns | N/A | Low risk | Low risk | Low risk | Low risk | Some concerns | Some concerns | |
| Some concerns | N/A | Low risk | Low risk | Low risk | Low risk | N/A | Some concerns | |
| Proximity studies | ||||||||
| Some concerns | Low risk | Low risk | Low risk | Low risk | Low risk | Some concerns | Some concerns | |
| Some concerns | N/A | Low risk | Low risk | Low risk | Low risk | N/A | Some concerns | |
| Some concerns | N/A | Low risk | Low risk | Low risk | Low risk | N/A | Some concerns | |
| Some concerns | Low risk | Low risk | Low risk | Low risk | Low risk | Some concerns | Some concerns | |
| Low risk | N/A | Low risk | Low risk | Low risk | Low risk | N/A | Low risk | |
| Low risk | N/A | Low risk | Low risk | Low risk | Low risk | N/A | Low risk | |
| Low risk | N/A | Low risk | Low risk | Low risk | Low risk | N/A | Low risk | |
| Some concerns | N/A | Low risk | Low risk | Low risk | Low risk | Some concerns | N/A | |
| Some concerns | Low risk | Low risk | Low risk | Low risk | Low risk | Some concerns | Some concerns | |
| Some concerns | N/A | Low risk | Low risk | Low risk | Low risk | N/A | Some concerns | |
| Some concerns | N/A | Low risk | Low risk | Low risk | Low risk | N/A | Some concerns | |
| Some concerns | N/A | Low risk | Some concerns | Low risk | Low risk | N/A | High risk | |
| Some concerns | N/A | Some concerns | Low risk | Low risk | Low risk | N/A | Some concerns | |
| Some concerns | N/A | Low risk | Low risk | Low risk | Low risk | N/A | Some concerns | |
| Some concerns | N/A | Low risk | Low risk | Low risk | Low risk | N/A | Some concerns | |
| Some concerns | N/A | Low risk | Low risk | Low risk | Low risk | N/A | Some concerns | |
| Some concerns | N/A | Some concerns | Low risk | Low risk | Low risk | N/A | Some concerns | |
| High risk | N/A | Low risk | Low risk | Low risk | Low risk | High risk | N/A | |
| CRCT: cluster‐randomised controlled trials Justifications for assessments are available at the following (http://dx.doi.org/10.6084/m9.figshare.9159824) | ||||||||