Altering the availability or proximity of food, alcohol, and tobacco products to change their selection and consumption
Information
- DOI:
- https://doi.org/10.1002/14651858.CD012573.pub3Copy DOI

- Database:
-
- Cochrane Database of Systematic Reviews
- Version published:
-
- 04 September 2019see what's new
- Type:
-
- Intervention
- Stage:
-
- Review
- Cochrane Editorial Group:
-
Cochrane Public Health Group
- Copyright:
-
- Copyright © 2019 The Authors. Cochrane Database of Systematic Reviews published by John Wiley & Sons, Ltd. on behalf of The Cochrane Collaboration.
- This is an open access article under the terms of the Creative Commons Attribution‐Non‐Commercial Licence, which permits use, distribution and reproduction in any medium, provided the original work is properly cited and is not used for commercial purposes.
Article metrics
Altmetric:
Cited by:
Authors
Contributions of authors
Draft the protocol: all authors
Develop a search strategy: GJH, IS
Search for trials: GJH, PC, IS
Obtain copies of trials: GJH, PC, IS
Select studies for inclusion: GJH, PC, IS, DO
Extract data from studies: GJH, PC, SEK
Enter data into Review Manager 5: GJH, PC, SEK
Carry out the analysis: SA, JPTH
Interpret the analysis: all authors
Draft the final review: all authors
Sources of support
Internal sources
-
King's College London, UK.
Database access
-
University of Cambridge, UK.
Computer provision, database access
-
University of Bristol, UK.
Computer provision
-
University College London, UK.
Computer provision
External sources
-
Department of Health Policy Research Programme in England ((PR‐UN‐0409‐10109) Policy Research Unit in Behaviour and Health), UK.
Funding for the protocol
Declarations of interest
Gareth Hollands declares no financial or other conflicts of interest.
Patrice Carter declares no financial or other conflicts of interest.
Sumayya Anwer declares no financial or other conflicts of interest.
Sarah King declares no financial or other conflicts of interest.
Susan Jebb declares no financial or other conflicts of interest.
David Ogilvie declares no financial or other conflicts of interest.
Ian Shemilt declares no financial or other conflicts of interest.
Julian Higgins declares no financial or other conflicts of interest.
Theresa Marteau declares no financial or other conflicts of interest.
Acknowledgements
Production of this review was funded by the National Institute for Health Research Policy Research Programme (Policy Research Unit in Behaviour and Health (PR‐UN‐0409‐10109)). The funders had no role in the study design, data collection, analysis, or interpretation. The views expressed in this publication are those of the authors and not necessarily those of the funders,
the NHS, the National Institute for Health Research, the Department of Health and Social Care or its arm's length bodies, and other Government Departments. We would like to acknowledge the contributions of Julie Glanville (York Health Economics Consortium, University of York, UK), who reviewed a draft of our MEDLINE search strategy; Claire Stansfield (EPPI‐Centre, UCL Institute of Education, UK), who helped to develop our search strategy for the TRoPHI database; and Patrick Condron (Information Specialist, Cochrane Public Health Group), who reviewed further iterations of our MEDLINE and Embase strategies. We would like to thank Jodie Doyle (Managing Editor) and colleagues in the Cochrane Public Health Group. We would like to thank colleagues at the EPPI‐Centre, UCL Institute of Education, UK, in particular James Thomas and Sergio Graziosi, for their help in developing technological solutions and managing those processes in order to implement a workable study identification process.
Version history
| Published | Title | Stage | Authors | Version |
| 2019 Sep 04 | Altering the availability or proximity of food, alcohol, and tobacco products to change their selection and consumption | Review | Gareth J Hollands, Patrice Carter, Sumayya Anwer, Sarah E King, Susan A Jebb, David Ogilvie, Ian Shemilt, Julian P T Higgins, Theresa M Marteau | |
| 2019 Aug 27 | Altering the availability or proximity of food, alcohol, and tobacco products to change their selection and consumption | Review | Gareth J Hollands, Patrice Carter, Sumayya Anwer, Sarah E King, Susan A Jebb, David Ogilvie, Ian Shemilt, Julian P T Higgins, Theresa M Marteau | |
| 2017 Mar 01 | Altering the availability or proximity of food, alcohol and tobacco products to change their selection and consumption | Protocol | Gareth J Hollands, Patrice Carter, Ian Shemilt, Theresa M Marteau, Susan A Jebb, Julian Higgins, David Ogilvie | |
Differences between protocol and review
1. Methods ‐ Types of studies: We excluded randomised studies that had only a single participating site with site‐level data in the intervention and/or the comparator group because this would result in the treatment effect being completely confounded with the site characteristics.
Notes
This Review contains articles on which Brian Wansink (John Dyson Professor of Marketing at Cornell University) was an author, who is known to have committed academic misconduct (https://www.bmj.com/content/363/bmj.k4309). Seventeen of his articles have been retracted as of 9th August 2019 (http://retractiondatabase.org/RetractionSearch.aspx#?auth%3dWansink). None of the 17 retracted articles authored by Wansink have been included in this Cochrane Review. The results and conclusions of the review are therefore not affected. However, four articles on which Wansink is an author, and which have not been retracted, were included in this review, and two of these four articles contributed data to the primary meta‐analyses. These retractions introduce additional uncertainty regarding the veracity of other studies Wansink has authored, including those contributing to this review. Should any study included in this review be retracted, we will withdraw that study’s data from updated meta‐analyses conducted as part of future updates of this Cochrane review.
Keywords
MeSH
Medical Subject Headings (MeSH) Keywords
Medical Subject Headings Check Words
Humans;
PICOs

Final conceptual model. Changes from the provisional conceptual model (Hollands 2017b), comprising two additions, are shown in red type.

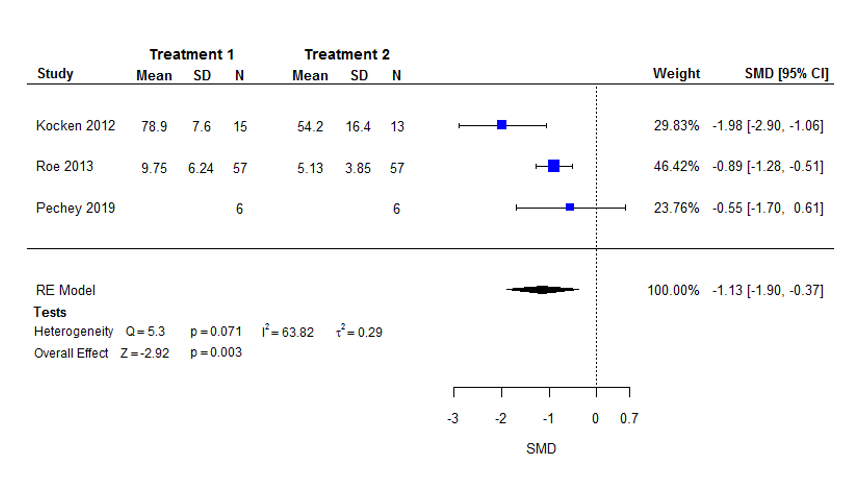
Forest plot of the standardised mean difference (SMD) in selection with higher (intervention 1) versus lower (intervention 2) availability of food products (i.e. more versus fewer options).

Forest plot of the standardised mean difference (SMD) in consumption with higher (intervention 1) versus lower (intervention 2) availability of food products (i.e. more versus fewer options).

Forest plot of the standardised mean difference (SMD) in consumption with higher (intervention 1) versus lower (intervention 2) proximity of food products (i.e. placed nearer versus farther away).
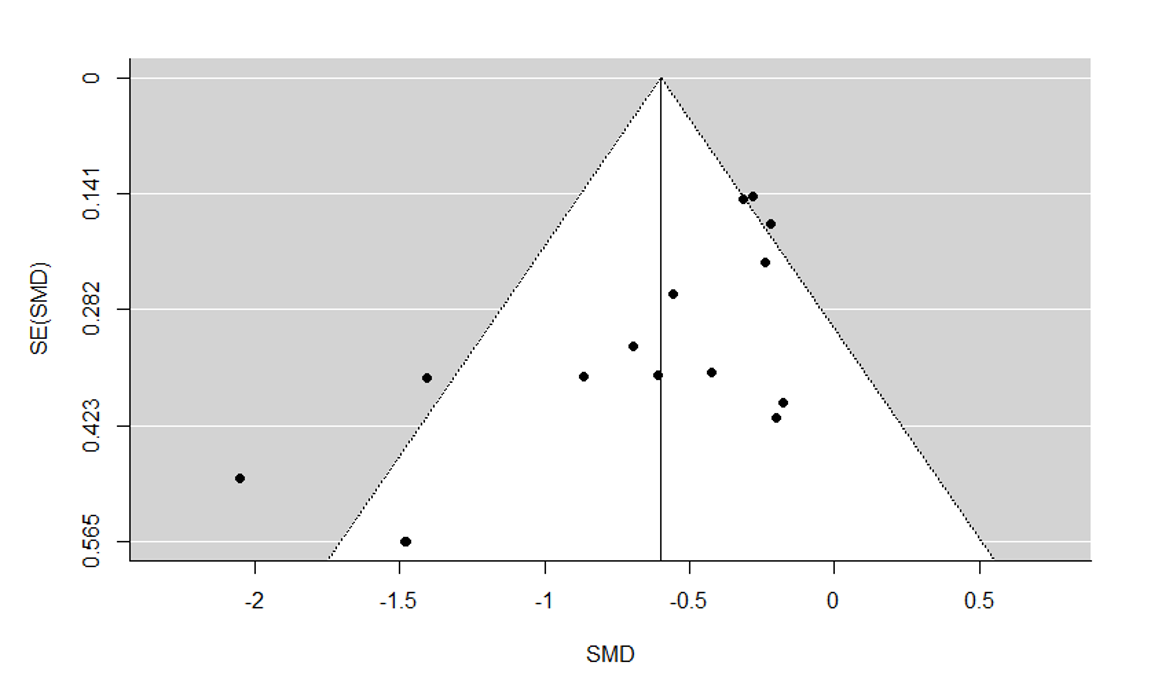
Funnel plot for meta‐analysis of consumption with higher versus lower proximity.
| Lower versus higher availability of food products for changing quantity of food selected or consumed | |||||
| Population: Adults and children | |||||
| Outcomes | Illustrative comparative risks (95% CI) | Relative effect | Number of participants | Certainty of evidence | |
| Assumed risk: higher availability of food products (more options) | Corresponding risk: lower availability of food products (fewer options) | ||||
| Selection | Mean energy selected on an average snack occasion of 200 (±63) kcal1 | Mean energy selected on an average snack occasion would be 71 kcal (35.6%) less with lower availability (120 kcal fewer to 23 kcal fewer; 59.9% less to 11.7% less). | Mean selection in the lower availability group was 1.13 standard deviations lower (1.90 lower to 0.37 lower). | 154 | ⊕⊕⊝⊝ |
| Consumption | Mean energy intake on an average snack occasion of 200 (±63) kcal | Mean energy intake on an average snack occasion would be 35 kcal (17.3%) less with lower availability (80 kcal fewer to 11 kcal more; 40% less to 5.7% more). | Mean consumption in the lower availability group was 0.55 standard deviations lower (1.27 lower to 0.18 more). | 150 | ⊕⊕⊝⊝ |
| The basis for the assumed risk is provided in Footnotes.5 The corresponding risk (and its 95% confidence interval) is based on the assumed risk and the relative effect of the intervention (and its 95% CI). The relative effect is derived from the primary random‐effects meta‐analysis for the outcome. CI: confidence interval; kcal: kilocalories; RCT: randomised controlled trial | |||||
| GRADE Working Group grades of evidence | |||||
| 1Assumes that all foods selected are consumed. | |||||
| Lower versus higher proximity of food products for changing quantity of food selected or consumed | |||||
| Patient or population: Adults and children | |||||
| Outcomes | Illustrative comparative risks (95% CI) | Relative effect | Number of participants | Certainty of evidence | |
| Assumed risk: higher proximity of food products (placed nearer) | Corresponding risk: lower proximity of food products (placed farther away) | ||||
| Selection | Mean energy selected on an average snack occasion of 200 (±63) kcal1 | Mean energy selected on an average snack occasion would be 41 kcal (20.5%) less with lower proximity (81 kcal fewer to 1 kcal fewer; 40.6% less to 0.3% less). | Mean selection in the lower proximity group was 0.65 standard deviations lower (1.29 lower to 0.01 lower). | 41 (1 RCT; 1 comparison) | ⊕⊝⊝⊝ |
| Consumption | Mean energy intake on an average snack occasion of 200 (±63) kcal | Mean energy intake on an average snack occasion would be 38 kcal (18.9%) less with lower proximity (53 kcal fewer to 23 kcal fewer; 26.5% less to 11.3% less). | Mean consumption in the lower availability group was 0.60 standard deviations lower (0.84 lower to 0.36 lower). | 1098 (12 RCTs; 15 comparisons) | ⊕⊕⊝⊝ |
| The basis for the assumed risk is provided in Footnotes.6 The corresponding risk (and its 95% confidence interval) is based on the assumed risk and the relative effect of the intervention (and its 95% CI). The relative effect is derived from the primary random‐effects meta‐analysis for the outcome. CI: confidence interval; kcal: kilocalories; RCT: randomised controlled trial | |||||
| GRADE Working Group grades of evidence | |||||
| 1Assumes that all foods selected are consumed. | |||||
| Study | Bias arising from the randomisation process | Bias arising from the timing of identification and recruitment of individual participants in relation to timing of randomisation (CRCT only) | Bias due to deviations from intended interventions | Bias due to missing outcome data | Bias in measurement of the outcome | Bias in selection of the reported result | Overall risk of bias (selection) | Overall risk of bias (consumption) |
| Availability studies | ||||||||
| Some concerns | Low risk | Low risk | Low risk | Low risk | Low risk | Some concerns | N/A | |
| Low risk | Low risk | Low risk | Low risk | Low risk | Low risk | Low risk | N/A | |
| Some concerns | Low risk | Low risk | Low risk | Low risk | Low risk | Some concerns | N/A | |
| Some concerns | N/A | Low risk | Low risk | Low risk | Low risk | Some concerns | N/A | |
| Some concerns | N/A | Low risk | Low risk | Low risk | Low risk | Some concerns | Some concerns | |
| Some concerns | N/A | Low risk | Low risk | Low risk | Low risk | N/A | Some concerns | |
| Proximity studies | ||||||||
| Some concerns | Low risk | Low risk | Low risk | Low risk | Low risk | Some concerns | Some concerns | |
| Some concerns | N/A | Low risk | Low risk | Low risk | Low risk | N/A | Some concerns | |
| Some concerns | N/A | Low risk | Low risk | Low risk | Low risk | N/A | Some concerns | |
| Some concerns | Low risk | Low risk | Low risk | Low risk | Low risk | Some concerns | Some concerns | |
| Low risk | N/A | Low risk | Low risk | Low risk | Low risk | N/A | Low risk | |
| Low risk | N/A | Low risk | Low risk | Low risk | Low risk | N/A | Low risk | |
| Low risk | N/A | Low risk | Low risk | Low risk | Low risk | N/A | Low risk | |
| Some concerns | N/A | Low risk | Low risk | Low risk | Low risk | Some concerns | N/A | |
| Some concerns | Low risk | Low risk | Low risk | Low risk | Low risk | Some concerns | Some concerns | |
| Some concerns | N/A | Low risk | Low risk | Low risk | Low risk | N/A | Some concerns | |
| Some concerns | N/A | Low risk | Low risk | Low risk | Low risk | N/A | Some concerns | |
| Some concerns | N/A | Low risk | Some concerns | Low risk | Low risk | N/A | High risk | |
| Some concerns | N/A | Some concerns | Low risk | Low risk | Low risk | N/A | Some concerns | |
| Some concerns | N/A | Low risk | Low risk | Low risk | Low risk | N/A | Some concerns | |
| Some concerns | N/A | Low risk | Low risk | Low risk | Low risk | N/A | Some concerns | |
| Some concerns | N/A | Low risk | Low risk | Low risk | Low risk | N/A | Some concerns | |
| Some concerns | N/A | Some concerns | Low risk | Low risk | Low risk | N/A | Some concerns | |
| High risk | N/A | Low risk | Low risk | Low risk | Low risk | High risk | N/A | |
| CRCT: cluster‐randomised controlled trials Justifications for assessments are available at the following (http://dx.doi.org/10.6084/m9.figshare.9159824) | ||||||||