Fármacos antiinflamatorios no esteroideos (AINE) para el dolor crónico no relacionado con el cáncer en niños y adolescentes
Información
- DOI:
- https://doi.org/10.1002/14651858.CD012537.pub2Copiar DOI

- Base de datos:
-
- Cochrane Database of Systematic Reviews
- Versión publicada:
-
- 02 agosto 2017see what's new
- Tipo:
-
- Intervention
- Etapa:
-
- Review
- Grupo Editorial Cochrane:
-
Grupo Cochrane de Dolor y cuidados paliativos
- Copyright:
-
- Copyright © 2019 The Cochrane Collaboration. Published by John Wiley & Sons, Ltd.
Cifras del artículo
Altmetric:
Citado por:
Autores
Contributions of authors
TC and CE registered the title.
TC, Phil Wiffen, and CE wrote the template protocol for the suite of children's reviews of which this review is a part.
All authors contributed to writing the protocol, and all authors agreed on the final version.
All authors were responsible for data extraction, analysis, and writing of the Discussion for the full review.
All authors will be responsible for the completion of updates.
Sources of support
Internal sources
-
No sources of support supplied
External sources
-
National Institute for Health Research (NIHR), UK.
NIHR Programme Grant, Award Reference Number: 13/89/29 (Addressing the unmet need of chronic pain: providing the evidence for treatments of pain)
Declarations of interest
CE: none known. Since CE is an author as well as the PaPaS Co‐ordinating Editor at the time of writing, we acknowledge the input of Andrew Moore who acted as Sign Off Editor for this review. CE had no input into the editorial decisions or processes for this review.
TC: none known.
BA: none known; BA is a specialist anaesthetist and intensive care physician and manages the perioperative care of children requiring surgery and those critically ill requiring intensive care.
EF: none known.
NW: none known; NW is a specialist paediatric rheumatologist and treats patients with chronic pain.
Acknowledgements
We acknowledge the contribution of Phil Wiffen to the template protocol.
We thank Chantal Wood, Neil Schechter, Jacqueline Clinch, Ewan McNicol, and Sebastian Straube for peer reviewing.
Cochrane Review Group funding acknowledgement: the National Institute for Health Research (NIHR) is the largest single funder of the Cochrane Pain, Palliative and Supportive Care Review Group. Disclaimer: the views and opinions expressed herein are those of the authors and do not necessarily reflect those of the NIHR, National Health Service (NHS), or the Department of Health.
Version history
| Published | Title | Stage | Authors | Version |
| 2017 Aug 02 | Non‐steroidal anti‐inflammatory drugs (NSAIDs) for chronic non‐cancer pain in children and adolescents | Review | Christopher Eccleston, Tess E Cooper, Emma Fisher, Brian Anderson, Nick MR Wilkinson | |
| 2017 Feb 01 | Non‐steroidal anti‐inflammatory drugs (NSAIDs) for chronic non‐cancer pain in children and adolescents | Protocol | Christopher Eccleston, Tess E Cooper, Emma Fisher, Brian Anderson, Nick MR Wilkinson | |
Differences between protocol and review
We did not consider studies with fewer than 10 participants per treatment arm for inclusion in this review, as is standard practice for this group.
Data were insufficient for pooled analyses comparing one drug to another, so we chose to do a post hoc analysis using the randomised cohorts of NSAIDs to calculate the mean response rate for any NSAID at any dose.
Notes
A restricted search in March 2019 did not identify any potentially relevant studies likely to change the conclusions. Therefore, this review has now been stabilised following discussion with the authors and editors. The review will be re‐assessed for updating in five years. If appropriate, we will update the review before this date if new evidence likely to change the conclusions is published, or if standards change substantially which necessitates major revisions.
Keywords
MeSH
Medical Subject Headings (MeSH) Keywords
- Anti-Inflammatory Agents, Non-Steroidal [adverse effects, *therapeutic use];
- Arthritis, Juvenile [*drug therapy];
- Arthritis, Rheumatoid [*drug therapy];
- Aspirin [adverse effects, therapeutic use];
- Celecoxib [adverse effects, therapeutic use];
- Chronic Disease;
- Chronic Pain [*drug therapy];
- Fenoprofen [adverse effects, therapeutic use];
- Ibuprofen [adverse effects, therapeutic use];
- Lactones [adverse effects, therapeutic use];
- Meloxicam;
- Methoxsalen [adverse effects, therapeutic use];
- Naproxen [adverse effects, therapeutic use];
- Randomized Controlled Trials as Topic;
- Sulfones [adverse effects, therapeutic use];
- Thiazines [adverse effects, therapeutic use];
- Thiazoles [adverse effects, therapeutic use];
Medical Subject Headings Check Words
Adolescent; Child; Child, Preschool; Humans;
PICO

Study flow diagram.
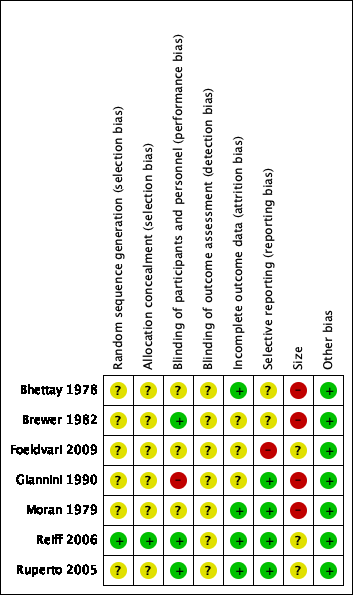
Risk of bias summary: review authors' judgements about each risk of bias item for each included study.
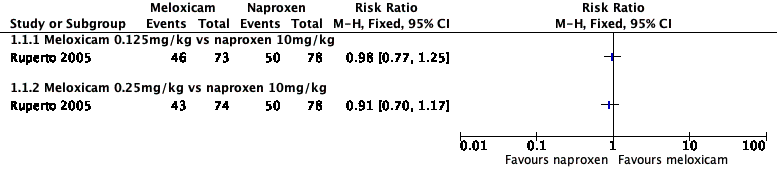
Forest plot of comparison: 1 Meloxicam versus naproxen, outcome: 1.1 Participant‐reported pain relief of 30% or greater.

Forest plot of comparison: 2 Celecoxib versus naproxen, outcome: 2.1 Participant‐reported pain relief of 30% or greater.

Forest plot of comparison: 3 Rofecoxib versus naproxen, outcome: 3.1 Participant‐reported pain relief of 30% or greater.

Forest plot of comparison: 1 Meloxicam versus naproxen, outcome: 1.2 Participant‐reported pain relief of 50% or greater.
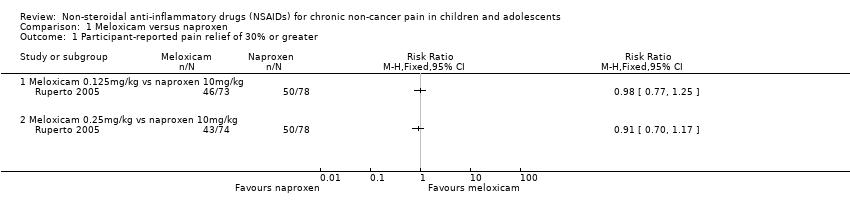
Comparison 1 Meloxicam versus naproxen, Outcome 1 Participant‐reported pain relief of 30% or greater.

Comparison 1 Meloxicam versus naproxen, Outcome 2 Participant‐reported pain relief of 50% or greater.

Comparison 2 Celecoxib versus naproxen, Outcome 1 Participant‐reported pain relief of 30% or greater.

Comparison 3 Rofecoxib versus naproxen, Outcome 1 Participant‐reported pain relief of 30% or greater.
| Meloxicam compared with naproxen for chronic non‐cancer pain | ||||||
| Patient or population: children and adolescents with chronic non‐cancer pain Settings: multicentre paediatric rheumatology tertiary care units (international) Intervention: meloxicam Comparison: naproxen | ||||||
| Outcomes | Illustrative comparative risks* (95% CI) | Relative effect | No. of participants | Quality of the evidence | Comments | |
| Naproxen | Meloxicam | |||||
| Participant‐reported pain relief of 30% or greater | 50/78 | 89/147 | N/A | 225 participants (1 study) | ⊕⊕⊝⊝ | |
| Participant‐reported pain relief of 50% or greater | 39/78 | 70/147 | N/A | 225 participants (1 study) | ⊕⊕⊝⊝ | |
| Patient Global Impression of Change much or very much improved | No data | No data | N/A | N/A | No evidence to support or refutec | |
| Any adverse event | 10/78 | 18/147 | N/A | 225 participants (1 study) | ⊕⊝⊝⊝ | |
| Serious adverse event | 10/78 | 11/147 | N/A | 225 participants (1 study) | ⊕⊝⊝⊝ | |
| Withdrawals due to adverse events | 10/78 | 10/147 | N/A | 225 participants (1 study) | ⊕⊝⊝⊝ | |
| *The basis for the assumed risk (e.g. the median control group risk across studies) is provided in footnotes. The corresponding risk (and its 95% confidence interval) is based on the assumed risk in the comparison group and the relative effect of the intervention (and its 95% CI). CI: confidence interval; N/A: not applicable | ||||||
| GRADE Working Group grades of evidence High quality: We are very confident that the true effect lies close to that of the estimate of the effect. Moderate quality: We are moderately confident in the effect estimate; the true effect is likely to be close to the estimate of effect, but there is a possibility that it is substantially different. Low quality: Our confidence in the effect estimate is limited; the true effect may be substantially different from the estimate of the effect. Very low quality: We have very little confidence in the effect estimate; the true effect is likely to be substantially different from the estimate of effect. | ||||||
| aDowngraded once for serious study limitations (risk of bias), and once for imprecision. bDowngraded three levels due to too few data and number of events are too small to be meaningful. cNo data available for this outcome, and therefore no GRADE rating has been applied and there is no evidence to support or refute. | ||||||
| Celecoxib compared with naproxen for chronic non‐cancer pain | ||||||
| Patient or population: children and adolescents with chronic non‐cancer pain Settings: 17 paediatric centres worldwide Intervention: celecoxib Comparison: naproxen | ||||||
| Outcomes | Illustrative comparative risks* (95% CI) | Relative effect | No. of participants | Quality of the evidence | Comments | |
| Naproxen | Celecoxib | |||||
| Participant‐reported pain relief of 30% or greater | 56/83 | 119/159 | N/A | 242 participants | ⊕⊕⊝⊝ | |
| Participant‐reported pain relief of 50% or greater | No data | No data | N/A | N/A | ‐ | No evidence to support or refutec |
| Patient Global Impression of Change much or very much improved | No data | No data | N/A | N/A | ‐ | No evidence to support or refutec |
| Any adverse event | No data | No data | N/A | N/A | ‐ | No evidence to support or refutec |
| Serious adverse event | 0/83 | 5/159 | N/A | 242 participants | ⊕⊝⊝⊝ | |
| Withdrawals due to adverse events | 3/83 | 10/159 | N/A | 242 participants | ⊕⊝⊝⊝ | |
| *The basis for the assumed risk (e.g. the median control group risk across studies) is provided in footnotes. The corresponding risk (and its 95% confidence interval) is based on the assumed risk in the comparison group and the relative effect of the intervention (and its 95% CI). | ||||||
| GRADE Working Group grades of evidence High quality: We are very confident that the true effect lies close to that of the estimate of the effect. Moderate quality: We are moderately confident in the effect estimate; the true effect is likely to be close to the estimate of effect, but there is a possibility that it is substantially different. Low quality: Our confidence in the effect estimate is limited; the true effect may be substantially different from the estimate of the effect. Very low quality: We have very little confidence in the effect estimate; the true effect is likely to be substantially different from the estimate of effect. | ||||||
| aDowngraded once for serious study limitations (risk of bias), and once for imprecision. bDowngraded three levels due to too few data and number of events are too small to be meaningful. cNo data available for this outcome, and therefore no GRADE rating has been applied and there is no evidence to support or refute. | ||||||
| Rofecoxib compared with naproxen for chronic non‐cancer pain | ||||||
| Patient or population: children and adolescents with chronic non‐cancer pain Settings: 41 clinical centres in Australia, Europe, Asia, Central America, South America, USA Intervention: rofecoxib Comparison: naproxen | ||||||
| Outcomes | Illustrative comparative risks* (95% CI) | Relative effect | No. of participants | Quality of the evidence | Comments | |
| Naproxen | Rofecoxib | |||||
| Participant‐reported pain relief of 30% or greater | 48/87 | 94/187 | N/A | 274 participants | ⊕⊕⊝⊝ | |
| Participant‐reported pain relief of 50% or greater | No data | No data | N/A | N/A | ‐ | No evidence to support or refutec |
| Patient Global Impression of Change much or very much improved | No data | No data | N/A | N/A | ‐ | No evidence to support or refutec |
| Any adverse event | 28/101 | 43/209 | N/A | 274 participants | ⊕⊝⊝⊝ | |
| Serious adverse event | 0/101 | 0/209 | N/A | 310 participants | ⊕⊝⊝⊝ | |
| Withdrawals due to adverse events | 3/101 | 3/209 | N/A | 310 participants | ⊕⊝⊝⊝ | |
| *The basis for the assumed risk (e.g. the median control group risk across studies) is provided in footnotes. The corresponding risk (and its 95% confidence interval) is based on the assumed risk in the comparison group and the relative effect of the intervention (and its 95% CI). | ||||||
| GRADE Working Group grades of evidence High quality: We are very confident that the true effect lies close to that of the estimate of the effect. Moderate quality: We are moderately confident in the effect estimate; the true effect is likely to be close to the estimate of effect, but there is a possibility that it is substantially different. Low quality: Our confidence in the effect estimate is limited; the true effect may be substantially different from the estimate of the effect. Very low quality: We have very little confidence in the effect estimate; the true effect is likely to be substantially different from the estimate of effect. | ||||||
| aDowngraded once for serious study limitations (risk of bias), and once for imprecision. bDowngraded three levels due to too few data and number of events were too small to be meaningful. cNo data available for this outcome, and therefore no GRADE rating has been applied and there is no evidence to support or refute. | ||||||
| Outcome or subgroup title | No. of studies | No. of participants | Statistical method | Effect size |
| 1 Participant‐reported pain relief of 30% or greater Show forest plot | 1 | Risk Ratio (M‐H, Fixed, 95% CI) | Totals not selected | |
| 1.1 Meloxicam 0.125mg/kg vs naproxen 10mg/kg | 1 | Risk Ratio (M‐H, Fixed, 95% CI) | 0.0 [0.0, 0.0] | |
| 1.2 Meloxicam 0.25mg/kg vs naproxen 10mg/kg | 1 | Risk Ratio (M‐H, Fixed, 95% CI) | 0.0 [0.0, 0.0] | |
| 2 Participant‐reported pain relief of 50% or greater Show forest plot | 1 | Risk Ratio (M‐H, Fixed, 95% CI) | Totals not selected | |
| 2.1 Meloxicam 0.125mg/kg vs naproxen 10mg/kg | 1 | Risk Ratio (M‐H, Fixed, 95% CI) | 0.0 [0.0, 0.0] | |
| 2.2 Meloxicam 0.25mg/kg vs naproxen 10mg/kg | 1 | Risk Ratio (M‐H, Fixed, 95% CI) | 0.0 [0.0, 0.0] | |
| Outcome or subgroup title | No. of studies | No. of participants | Statistical method | Effect size |
| 1 Participant‐reported pain relief of 30% or greater Show forest plot | 1 | Risk Ratio (M‐H, Fixed, 95% CI) | Totals not selected | |
| 1.1 Celecoxib 3mg/kg vs naproxen 7.5mg/kg | 1 | Risk Ratio (M‐H, Fixed, 95% CI) | 0.0 [0.0, 0.0] | |
| 1.2 Celecoxib 6mg/kg vs naproxen 7.5mg/kg | 1 | Risk Ratio (M‐H, Fixed, 95% CI) | 0.0 [0.0, 0.0] | |
| Outcome or subgroup title | No. of studies | No. of participants | Statistical method | Effect size |
| 1 Participant‐reported pain relief of 30% or greater Show forest plot | 1 | Risk Ratio (M‐H, Fixed, 95% CI) | Totals not selected | |
| 1.1 Rofecoxib 0.3 to 12.5mg/kg vs naproxen 15mg/kg | 1 | Risk Ratio (M‐H, Fixed, 95% CI) | 0.0 [0.0, 0.0] | |
| 1.2 Rofecoxib 12.5 to 25mg/kg vs naproxen 15mg/kg | 1 | Risk Ratio (M‐H, Fixed, 95% CI) | 0.0 [0.0, 0.0] | |