Fármacos antiinflamatorios no esteroideos (AINE) para el dolor crónico no relacionado con el cáncer en niños y adolescentes
Resumen
Antecedentes
El dolor es una característica común en la niñez y la adolescencia en todo el mundo, y en muchos jóvenes, el dolor es crónico. En las guías de la Organización Mundial de la Salud sobre los tratamientos farmacológicos para el dolor persistente en niños se reconoce que el dolor en este grupo etario es un problema de gran interés y significación para la salud pública en la mayoría de los países del mundo. Anteriormente, el dolor se desestimaba en la mayoría de los casos y con frecuencia no se trataba, los criterios sobre el dolor en niños han cambiado con el transcurso del tiempo y en la actualidad su alivio se considera importante.
Se diseñó una serie de siete revisiones sobre dolor crónico no relacionado con el cáncer y dolor por cáncer (en las que se estudiaron antidepresivos, antiepilépticos, antiinflamatorios no esteroideos, opiáceos y paracetamol) para examinar la evidencia sobre el dolor en niños mediante el uso de intervenciones farmacológicas.
Como se trata de la principal causa de morbilidad en el mundo actual, las enfermedades crónicas (y el dolor asociado) es un problema de salud significativo. El dolor crónico (definido como el dolor que dura tres meses o más) se puede presentar en la población pediátrica en diversas clasificaciones fisiopatológicas (nociceptivo, neuropático o idiopático), en relación con enfermedades genéticas, dolor por daño en los nervios, dolor musculoesquelético crónico, dolor abdominal crónico y otras causas desconocidas.
Los fármacos antiinflamatorios no esteroideos (AINE) se utilizan para tratar el dolor, reducir la fiebre y por sus propiedades antiinflamatorias. Se indican con frecuencia como parte del tratamiento del dolor pediátrico. En la actualidad el uso de los fármacos antiinflamatorios no esteroideos está autorizado en los países occidentales; sin embargo, su uso no está permitido en lactantes menores de tres meses. Los principales efectos adversos incluyen insuficiencia renal y trastornos gastrointestinales. Otros efectos adversos frecuentes en los niños son: diarrea, cefalea, náuseas, estreñimiento, erupción cutánea, mareos y dolor abdominal.
Objetivos
Evaluar la eficacia analgésica y los eventos adversos de los AINE utilizados para tratar el dolor no relacionado con el cáncer en niños y adolescentes, desde el nacimiento hasta los 17 años de edad, en cualquier ámbito.
Métodos de búsqueda
Se hicieron búsquedas en el Registro Cochrane Central de Ensayos Controlados (Cochrane Central Register of Controlled Trials; CENTRAL) vía Cochrane Register of Studies Online, MEDLINE vía Ovid y Embase vía Ovid desde su inicio hasta el 6 de septiembre de 2016. También se realizaron búsquedas en las listas de referencias de estudios y revisiones recuperados, así como en registros de ensayos clínicos en línea.
Criterios de selección
Ensayos controlados aleatorizados, con o sin cegamiento, de tratamiento, en cualquier dosis y por cualquier vía de administración, del dolor crónico no relacionado con el cáncer en niños y adolescentes, que comparasen un AINE con placebo o un comparador activo.
Obtención y análisis de los datos
Dos autores de la revisión, de forma independiente, evaluaron la elegibilidad de los estudios. Se programó usar datos dicotómicos para calcular el cociente de riesgos y el número necesario a tratar para un evento adicional, con el uso de métodos estándar. Se realizó la evaluación GRADE y se crearon tres tablas de "Resumen de los hallazgos".
Resultados principales
Se incluyeron siete estudios, con un total de 1074 participantes (de dos a 18 años) con poliartritis juvenil crónica o artritis reumatoide juvenil crónica. Los siete estudios compararon un AINE con un comparador activo. Ninguno de los estudios fue controlado con placebo. Ninguno de los dos estudios investigó el mismo tipo de AINE comparado con otro. No fue posible realizar un metanálisis.
El riesgo de sesgo varió. En cuanto a la asignación al azar y la ocultación de la asignación, el riesgo fue bajo en un estudio e incierto en seis. Con respecto al cegamiento de los participantes y el personal, el riesgo fue bajo en tres estudios y de incierto a alto en cuatro. En relación con el cegamiento de los evaluadores de resultados, el riesgo fue incierto en todos los estudios. En cuanto al desgaste, el riesgo fue bajo en cuatro estudios e incierto en tres. En relación con el informe selectivo, el riesgo fue bajo en cuatro estudios, incierto en dos, y alto en uno. Con respecto el tamaño, el riesgo fue incierto en tres estudios y alto en cuatro. En cuanto a otras posibles fuentes de sesgo, el riesgo fue bajo en siete estudios.
Resultados primarios
Tres estudios informaron el alivio del dolor del 30% o mayor informado por el paciente y no encontraron diferencias estadísticamente significativas en las puntuaciones de dolor entre meloxicam y naproxeno, celecoxib y naproxeno ni rofecoxib y naproxeno (P > 0,05) (evidencia de calidad baja).
Un estudio informó el alivio del dolor del 50% o mayor informado por el paciente y no encontró diferencias estadísticamente significativas en las puntuaciones de dolor entre el meloxicam en dosis baja (0,125 mg/kg) y el meloxicam en dosis alta (0,25 mg/kg) en comparación con el naproxeno 10 mg/kg (P > 0,05) (evidencia de calidad baja).
Un estudio informó el Patient Global Impression of Change: 85% de los pacientes que tomaron ibuprofeno y 90% de los que tomaron aspirina percibieron "una mejoría muy importante" (evidencia de calidad baja).
Resultados secundarios
Los participantes que informaron un evento adverso (uno o más por paciente) por fármaco fueron: aspirina 85/202; fenoprofeno 28/49; ibuprofeno 40/45; indometacina 9/30; ketoprofeno 9/30; meloxicam 18/47; naproxeno 44/202; y rofecoxib 47/209 (siete estudios) (evidencia de calidad muy baja).
Los participantes que abandonaron el estudio por un evento adverso por fármaco fueron: aspirina 16/120; celecoxib 10/159; fenoprofeno 0/49; ibuprofeno 0/45; indometacina 0/30; ketoprofeno 0/30; meloxicam 10/147; naproxeno 17/285 y rofecoxib 3/209 (evidencia de calidad muy baja).
Los participantes que presentaron un evento adverso grave por fármaco fueron: aspirina 13/120; celecoxib 5/159; fenoprofeno 0/79; ketoprofeno 0/30; ibuprofeno 4/45; indometacina 0/30; meloxicam 11/147; naproxeno 10/285 y rofecoxib 0/209 (evidencia de calidad muy baja).
Hubo muy pocos o ningún dato para las medidas de resultado secundarias restantes: Carer Global Impression of Change; necesidad de analgesia de rescate; duración y calidad del sueño; aceptabilidad del tratamiento; funcionamiento físico definido por escalas validadas; y calidad de vida definida por escalas validadas.
Calidad de la evidencia
Los resultados de baja calidad se disminuyeron dos veces debido a las limitaciones importantes de los estudios (riesgo de sesgo) y a la imprecisión. Los resultados de calidad muy baja se disminuyeron tres veces debido a la escasez de datos, o al hecho de que el número de eventos fue demasiado pequeño para ser significativo, o a ambos.
Conclusiones de los autores
Sólo se identificó un escaso número de estudios, sin datos suficientes para el análisis.
Como no fue posible realizar un metanálisis, no se pudo establecer conclusiones acerca de la eficacia ni los efectos perjudiciales del uso de los AINE para el tratamiento del dolor crónico no relacionado con el cáncer en niños y adolescentes. De manera similar, no se pudieron realizar observaciones sobre los resultados secundarios restantes: Carer Global Impression of Change; necesidad de analgesia de rescate; duración y calidad del sueño; aceptabilidad del tratamiento; funcionamiento físico y calidad de vida.
A partir de ensayos controlados aleatorizados en adultos se sabe que algunos AINE, como el ibuprofeno, el naproxeno y la aspirina, pueden ser efectivos en algunas afecciones de dolor crónico.
PICOs
Resumen en términos sencillos
Fármacos antiinflamatorios no esteroideos (AINE) para el dolor crónico no relacionado con el cáncer en niños y adolescentes
Conclusión
No hay seguridad acerca de si los AINE brindan alivio del dolor para el dolor crónico no relacionado con el cáncer en niños y adolescentes.
Antecedentes
Los niños pueden presentar dolor crónico o recurrente relacionado con trastornos genéticos, daño nervioso, dolor muscular u óseo, dolor abdominal u otras razones desconocidas. El dolor crónico se define como dolor que dura tres meses o más y se acompaña frecuentemente de cambios en la funcionalidad y el estilo de vida, así como por signos y síntomas de depresión y ansiedad.
Los fármacos antiinflamatorios no esteroideos se administran para tratar el dolor o reducir la fiebre y se utilizan con frecuencia en los niños. Incluyen fármacos sin prescripción como el ibuprofeno, la aspirina, y el naproxeno, así como fármacos que se expenden bajo prescripción médica. En la actualidad el uso de los AINE está autorizado en los países occidentales; sin embargo, no está permitida su administración en los lactantes menores de tres meses. Los efectos secundarios principales de los AINE son la insuficiencia renal y los trastornos gástricos. Otros efectos adversos frecuentes en los niños son: diarrea, cefalea, náuseas, estreñimiento, erupción cutánea, mareos, flatulencia, dolor abdominal y dispepsia.
Características de los estudios
En septiembre de 2016 se buscaron ensayos clínicos en los que se utilizaran AINE para tratar el dolor crónico. Se encontraron siete ensayos (con un total de 1074 participantes, de dos a 18 años) con poliartritis juvenil crónica o artritis reumatoide juvenil crónica, de más de tres meses de evolución.
Resultados clave
Los estudios examinaron diferentes comparaciones de aspirina, celecoxib, fenoprofeno, ibuprofeno, indometacina, ketoprofeno, meloxicam, naproxeno y rofecoxib. Ningún estudio comparó AINE con placebo. No fue posible comparar estos fármacos ni los resultados de dolor, ya que todos los estudios investigaron diferentes tipos de AINE.
Los efectos secundarios fueron frecuentes; los niños informaron problemas con la aspirina (85 de 202 participantes), el fenoprofeno (28 de 49), el ibuprofeno (40 de 45), la indometacina (nueve de 30), el ketoprofeno (nueve de 30), el meloxicam (18 de 47), el naproxeno (44 de 202) y el rofecoxib (47 de 209).
Calidad de la evidencia
La calidad de la evidencia de los estudios se calificó con el uso de cuatro niveles: muy baja, baja, moderada o alta. La evidencia de calidad muy baja significa que hay muy poca seguridad en los resultados. La evidencia de calidad alta significa que existe mucha seguridad en los resultados.
En general, la evidencia disponible fue de calidad baja o muy baja debido a la falta de datos y a algunos problemas con la realización de algunos estudios.
Authors' conclusions
Summary of findings
| Meloxicam compared with naproxen for chronic non‐cancer pain | ||||||
| Patient or population: children and adolescents with chronic non‐cancer pain Settings: multicentre paediatric rheumatology tertiary care units (international) Intervention: meloxicam Comparison: naproxen | ||||||
| Outcomes | Illustrative comparative risks* (95% CI) | Relative effect | No. of participants | Quality of the evidence | Comments | |
| Naproxen | Meloxicam | |||||
| Participant‐reported pain relief of 30% or greater | 50/78 | 89/147 | N/A | 225 participants (1 study) | ⊕⊕⊝⊝ | |
| Participant‐reported pain relief of 50% or greater | 39/78 | 70/147 | N/A | 225 participants (1 study) | ⊕⊕⊝⊝ | |
| Patient Global Impression of Change much or very much improved | No data | No data | N/A | N/A | No evidence to support or refutec | |
| Any adverse event | 10/78 | 18/147 | N/A | 225 participants (1 study) | ⊕⊝⊝⊝ | |
| Serious adverse event | 10/78 | 11/147 | N/A | 225 participants (1 study) | ⊕⊝⊝⊝ | |
| Withdrawals due to adverse events | 10/78 | 10/147 | N/A | 225 participants (1 study) | ⊕⊝⊝⊝ | |
| *The basis for the assumed risk (e.g. the median control group risk across studies) is provided in footnotes. The corresponding risk (and its 95% confidence interval) is based on the assumed risk in the comparison group and the relative effect of the intervention (and its 95% CI). CI: confidence interval; N/A: not applicable | ||||||
| GRADE Working Group grades of evidence High quality: We are very confident that the true effect lies close to that of the estimate of the effect. Moderate quality: We are moderately confident in the effect estimate; the true effect is likely to be close to the estimate of effect, but there is a possibility that it is substantially different. Low quality: Our confidence in the effect estimate is limited; the true effect may be substantially different from the estimate of the effect. Very low quality: We have very little confidence in the effect estimate; the true effect is likely to be substantially different from the estimate of effect. | ||||||
| aDowngraded once for serious study limitations (risk of bias), and once for imprecision. bDowngraded three levels due to too few data and number of events are too small to be meaningful. cNo data available for this outcome, and therefore no GRADE rating has been applied and there is no evidence to support or refute. | ||||||
| Celecoxib compared with naproxen for chronic non‐cancer pain | ||||||
| Patient or population: children and adolescents with chronic non‐cancer pain Settings: 17 paediatric centres worldwide Intervention: celecoxib Comparison: naproxen | ||||||
| Outcomes | Illustrative comparative risks* (95% CI) | Relative effect | No. of participants | Quality of the evidence | Comments | |
| Naproxen | Celecoxib | |||||
| Participant‐reported pain relief of 30% or greater | 56/83 | 119/159 | N/A | 242 participants | ⊕⊕⊝⊝ | |
| Participant‐reported pain relief of 50% or greater | No data | No data | N/A | N/A | ‐ | No evidence to support or refutec |
| Patient Global Impression of Change much or very much improved | No data | No data | N/A | N/A | ‐ | No evidence to support or refutec |
| Any adverse event | No data | No data | N/A | N/A | ‐ | No evidence to support or refutec |
| Serious adverse event | 0/83 | 5/159 | N/A | 242 participants | ⊕⊝⊝⊝ | |
| Withdrawals due to adverse events | 3/83 | 10/159 | N/A | 242 participants | ⊕⊝⊝⊝ | |
| *The basis for the assumed risk (e.g. the median control group risk across studies) is provided in footnotes. The corresponding risk (and its 95% confidence interval) is based on the assumed risk in the comparison group and the relative effect of the intervention (and its 95% CI). | ||||||
| GRADE Working Group grades of evidence High quality: We are very confident that the true effect lies close to that of the estimate of the effect. Moderate quality: We are moderately confident in the effect estimate; the true effect is likely to be close to the estimate of effect, but there is a possibility that it is substantially different. Low quality: Our confidence in the effect estimate is limited; the true effect may be substantially different from the estimate of the effect. Very low quality: We have very little confidence in the effect estimate; the true effect is likely to be substantially different from the estimate of effect. | ||||||
| aDowngraded once for serious study limitations (risk of bias), and once for imprecision. bDowngraded three levels due to too few data and number of events are too small to be meaningful. cNo data available for this outcome, and therefore no GRADE rating has been applied and there is no evidence to support or refute. | ||||||
| Rofecoxib compared with naproxen for chronic non‐cancer pain | ||||||
| Patient or population: children and adolescents with chronic non‐cancer pain Settings: 41 clinical centres in Australia, Europe, Asia, Central America, South America, USA Intervention: rofecoxib Comparison: naproxen | ||||||
| Outcomes | Illustrative comparative risks* (95% CI) | Relative effect | No. of participants | Quality of the evidence | Comments | |
| Naproxen | Rofecoxib | |||||
| Participant‐reported pain relief of 30% or greater | 48/87 | 94/187 | N/A | 274 participants | ⊕⊕⊝⊝ | |
| Participant‐reported pain relief of 50% or greater | No data | No data | N/A | N/A | ‐ | No evidence to support or refutec |
| Patient Global Impression of Change much or very much improved | No data | No data | N/A | N/A | ‐ | No evidence to support or refutec |
| Any adverse event | 28/101 | 43/209 | N/A | 274 participants | ⊕⊝⊝⊝ | |
| Serious adverse event | 0/101 | 0/209 | N/A | 310 participants | ⊕⊝⊝⊝ | |
| Withdrawals due to adverse events | 3/101 | 3/209 | N/A | 310 participants | ⊕⊝⊝⊝ | |
| *The basis for the assumed risk (e.g. the median control group risk across studies) is provided in footnotes. The corresponding risk (and its 95% confidence interval) is based on the assumed risk in the comparison group and the relative effect of the intervention (and its 95% CI). | ||||||
| GRADE Working Group grades of evidence High quality: We are very confident that the true effect lies close to that of the estimate of the effect. Moderate quality: We are moderately confident in the effect estimate; the true effect is likely to be close to the estimate of effect, but there is a possibility that it is substantially different. Low quality: Our confidence in the effect estimate is limited; the true effect may be substantially different from the estimate of the effect. Very low quality: We have very little confidence in the effect estimate; the true effect is likely to be substantially different from the estimate of effect. | ||||||
| aDowngraded once for serious study limitations (risk of bias), and once for imprecision. bDowngraded three levels due to too few data and number of events were too small to be meaningful. cNo data available for this outcome, and therefore no GRADE rating has been applied and there is no evidence to support or refute. | ||||||
Background
Pain is a common feature of childhood and adolescence around the world, and for many young people, that pain is chronic. The World Health Organization guidelines for pharmacological treatments for persisting pain in children acknowledge that pain in children is a major public health concern of high significance in most parts of the world (WHO 2012). While in the past, pain was largely dismissed and was frequently left untreated, views on children's pain have changed over time, and relief of pain is now seen as important. Since the 1970s, studies comparing child and adult pain management have revealed a variety of responses to pain, fuelling the need for a more in‐depth focus on paediatric pain (Caes 2016).
Infants (zero to 12 months), children (1 to 9 years), and adolescents (10 to 18 years), WHO 2012, account for 27% (1.9 billion) of the world's population (United Nations 2015); the proportion of those aged 14 years and under ranges from 12% (in Hong Kong) to 50% (in Niger) (World Bank 2014). However, little is known about the pain management needs of this population. For example, in the Cochrane Library, approximately 12 reviews produced by the Cochrane Pain, Palliative and Supportive Care Review Group in the past 18 years have been specifically concerned with children and adolescents, compared to over 100 reviews specific to adults. Additional motivating factors for investigating children's pain include the vast amount of unmanaged pain in the paediatric population and the development of new technologies and treatments. We convened an international group of leaders in paediatric pain to design a suite of seven reviews in chronic pain and cancer pain (looking at antidepressants, antiepileptic drugs, non‐steroidal anti‐inflammatory drugs (NSAIDs), opioids, and paracetamol as priority areas) in order to review the evidence under a programme grant for children's pain utilising pharmacological interventions in children and adolescents (Appendix 1).
This review is based on a template for reviews of pharmacotherapies used to relieve pain in infants, children and adolescents. The aim is for all reviews to use the same methods, based on new criteria for what constitutes reliable evidence (Appendix 2) (Moore 2010a; Moore 2012). This review focused on NSAIDs to treat chronic non‐cancer pain.
Description of the condition
This review focused on chronic non‐cancer pain experienced by children and adolescents as a result of any type of chronic disease that occurs throughout the global paediatric population. Children's level of pain can be mild, moderate, or severe, and pain management is an essential element of patient management during all care stages of chronic disease.
As the leading cause of morbidity in the world today, chronic disease (and its associated pain) is a major health concern. Chronic pain can arise in the paediatric population in a variety of pathophysiological classifications: nociceptive, neuropathic, idiopathic. Chronic pain is pain that lasts three months or longer and may be accompanied by changes in lifestyle, personality, and functional abilities, as well as by signs and symptoms of depression (Ripamonti 2008).
Whilst diagnostic and perioperative procedures performed to treat chronic diseases are a known common cause of pain in these patients, this review did not cover perioperative pain or adverse effects of treatments such as mucositis.
Description of the intervention
Non‐steroidal anti‐inflammatory drugs are used to treat pain, reduce fever, and for their anti‐inflammation properties, and are commonly used within paediatric pain management (Blanca‐Lopez 2015). The two main types of NSAID are selective and non‐selective, which refers to the ability of the NSAID to inhibit specific types of COX enzymes (Misurac 2013). Non‐steroidal anti‐inflammatory drugs are currently licensed for use in Western countries, however they are not approved for use in infants under three months of age (WHO 2012). Non‐steroidal anti‐inflammatory drugs are also widely used for patent ductus arteriosus closure in neonates.
Currently available NSAIDs include: aceclofenac, acetylsalicylic acid, celecoxib, choline magnesium trisalicylates, diclofenac, etodolac, etoricoxib, fenoprofen, ibuprofen, indomethacin, ketoprofen, ketorolac, mefenamic acid, meloxicam, nabumetone, naproxen, parecoxib, phenylbutazone, piroxicam, sulindac, tenoxicam, and tiaprofenic acid (BNF 2016).
Non‐steroidal anti‐inflammatory drugs are used in a variety of doses and are commonly prescribed to children with pain as an oral tablet or liquid formulation. The recommended dose for ibuprofen (for example) is 5 to 10 mg/kg every six to eight hours, with a maximum daily dose of 1200 mg. Additionally, the maximum daily dose recommended for naproxen is 1000 mg per day (WHO 2012). The recommendation for paediatric patients is to use the lowest dose, for the shortest duration possible to control symptoms (NICE 2015); hence, NSAIDs are also used in conjunction with paracetamol to reduce the amount of NSAID administered to children (WHO 2012).
The two primary adverse effects of NSAIDs are renal impairment and gastrointestinal issues (NICE 2015). Common side effects in children include diarrhoea, headache, nausea, constipation, rash, dizziness, flatulence, abdominal pain, and dyspepsia (WHO 2012). Other adverse effects include hepatic function impairment, contraindications with allergic disorders (hypersensitivity to aspirin, asthma, angioedema, urticaria, rhinitis), cardiac impairment, Reye's syndrome, antiplatelet effects, coagulation defects, and dangerous environmental harms (particularly seen in diclofenac). The long‐term safety of the use of NSAIDs in children is unclear (Blanca‐Lopez 2015). However, some safety assessments of ibuprofen in children have been compared with paracetamol and not found a significant increased risk for serious adverse events or main causes of hospitalisation (acute gastrointestinal bleeding, acute renal failure, anaphylaxis, or Reye's syndrome) (Lesko 1995; Lesko 1997; Lesko 1999).
How the intervention might work
One current hypothesis is that damage to the peripheral nerves is followed by an inflammatory reaction that relates to increased production of prostaglandins, amplifying sodium currents and calcium influx in peripheral nociceptive neurons, and enhancing neurotransmitter release in the central nervous system and depolarisation of second‐order nociceptive neurons (Vo 2009). Preclinical data suggest an immune pathogenesis of neuropathic pain, but clinical evidence of a central role of the immune system is less clear (Calvo 2012). Non‐steroidal anti‐inflammatory drugs inhibit the production of prostaglandins, and thus could lessen the peripheral and central sensory hypersensitivity that occurs with nerve injury‐associated inflammation. Non‐steroidal anti‐inflammatory drugs have been shown to reduce sensory hypersensitivity in animal models (Hasnie 2007; Kawakami 2002).
Why it is important to do this review
The paediatric population is at risk of inadequate management of pain (AMA 2013). Some conditions that would be aggressively treated in adult patients are being managed with insufficient analgesia in younger populations (AMA 2013). Although there have been repeated calls for best evidence to treat children's pain, such as Eccleston 2003, there are no easily available summaries of the most effective paediatric pain relief.
This review formed part of a Programme Grant addressing the unmet needs of people with chronic pain, commissioned by the National Institute for Health Research (NIHR) in the UK. This topic was identified in June 2015 during consultation with experts in paediatric pain. Please see Appendix 1 for full details of the meeting. The standards used to assess evidence in chronic pain trials have changed substantially in recent years, with particular attention being paid to trial duration, withdrawals, and statistical imputation following withdrawal, all of which can substantially alter estimates of efficacy. The most important change was to encourage a move from using average pain scores, or average change in pain scores, to the number of people who have a large decrease in pain (by at least 50%). Pain intensity reduction of 50% or more has been shown to correlate with improvements in comorbid symptoms, function, and quality of life (Moore 2011a). These standards are set out in the reference guide for pain studies (AUREF 2012).
Objectives
To assess the analgesic efficacy and adverse events of NSAIDs used to treat chronic non‐cancer pain in children and adolescents aged between birth and 17 years, in any setting.
Methods
Criteria for considering studies for this review
Types of studies
We only included randomised controlled trials, with or without blinding, and participant‐ or observer‐reported outcomes.
Full journal publication was required, with the exception of online clinical trial results, summaries of otherwise unpublished clinical trials, and abstracts with sufficient data for analysis. We included studies published in any language. We excluded abstracts (usually meeting reports) or unpublished data, non‐randomised studies, studies of experimental pain, case reports, and clinical observations.
Types of participants
We included studies of infants, children, and adolescents, aged from birth to 17 years old, with chronic or recurrent pain (lasting for three months or longer), arising from genetic conditions, neuropathy, or other conditions. These included but were not limited to chronic musculoskeletal pain and chronic abdominal pain.
We excluded studies of perioperative pain, acute pain, cancer pain, and pain associated with primary disease or its treatment. We excluded headache and migraine (particularly prophylaxis), as these are addressed in separate Cochrane reviews.
We included studies of participants with more than one type of chronic pain, and then analysed results according to the primary condition.
Types of interventions
We included studies reporting interventions prescribing NSAIDs for the relief of chronic pain, by any route, in any dose, with comparison to placebo or any active comparator.
Types of outcome measures
In order to be eligible for inclusion in this review, studies had to report pain assessment, as well as meeting the other selection criteria.
We included trials measuring pain intensity and pain relief assessed using validated tools such as numerical rating scale (NRS), visual analogue scale (VAS), Faces Pain Scale ‐ Revised (FPS‐R), Colour Analogue Scale (CAS), or any other validated numerical rating scale.
We were particularly interested in Pediatric Initiative on Methods, Measurement, and Pain Assessment in Clinical Trials (PedIMMPACT) definitions for moderate and substantial benefit in chronic pain studies (PedIMMPACT 2008). These are defined as: at least 30% pain relief over baseline (moderate); at least 50% pain relief over baseline (substantial); much or very much improved on Patient Global Impression of Change (PGIC) scale (moderate); very much improved on PGIC (substantial).
These outcomes differ from those used in most earlier reviews, concentrating as they do on dichotomous outcomes where pain responses do not follow a normal (Gaussian) distribution. People with chronic pain desire high levels of pain relief, ideally more than 50% pain intensity reduction, and ideally having no worse than mild pain (Moore 2013a; O'Brien 2010).
We also recorded any reported adverse events. We reported the timing of outcome assessments.
Primary outcomes
-
Participant‐reported pain relief of 30% or greater
-
Participant‐reported pain relief of 50% or greater
-
PGIC much or very much improved
In the absence of self reported pain, we considered the use of 'other‐reported' pain, typically by an observer such as a parent, carer, or healthcare professional (Stinson 2006; von Baeyer 2007).
Secondary outcomes
We identified the following with reference to the PedIMMPACT recommendations, which suggest core outcome domains and measures for consideration in paediatric acute and chronic/recurrent pain clinical trials (PedIMMPACT 2008).
-
Carer Global Impression of Change
-
Requirement for rescue analgesia
-
Sleep duration and quality
-
Acceptability of treatment
-
Physical functioning as defined by validated scales
-
Quality of life as defined by validated scales
-
Any adverse events
-
Withdrawals due to adverse events
-
Any serious adverse event. Serious adverse events typically include any untoward medical occurrence or effect that at any dose results in death, is life‐threatening, requires hospitalisation or prolongation of existing hospitalisation, results in persistent or significant disability or incapacity, is a congenital anomaly or birth defect, is an 'important medical event' that may jeopardise the participant, or may require an intervention to prevent one of the above characteristics or consequences.
Search methods for identification of studies
We developed the search strategy based on previous strategies used within the Cochrane Pain, Palliative and Supportive Care Review Group and carried out the searches.
Electronic searches
We searched the following databases:
-
Cochrane Central Register of Controlled Trials (CENTRAL) (via the Cochrane Register of Studies Online), searched 6 September 2016;
-
MEDLINE (via Ovid) 1946 to September week 2 2016, searched 6 September 2016;
-
Embase (via Ovid) 1974 to 2016 week 38, searched 6 September 2016..
We used medical subject headings (MeSH) or equivalent and text word terms. We restricted our search to randomised controlled trials and clinical trials. There were no language or date restrictions. The focus of the keywords in our search terms was on chronic pain and NSAIDs. We tailored searches to individual databases. The search strategies for MEDLINE, Embase, and CENTRAL are in Appendix 3, Appendix 4, and Appendix 5, respectively.
Searching other resources
We searched ClinicalTrials.gov (www.clinicaltrials.gov) and the World Health Organization International Clinical Trials Registry Platform (WHO ICTRP) (apps.who.int/trialsearch/) on 6 September 2016 for ongoing trials. In addition, we checked reference lists of reviews and retrieved articles for additional studies, and performed citation searches on key articles. We planned to contact experts in the field for unpublished and ongoing trials. We planned to contact study authors for additional information where necessary.
Data collection and analysis
We performed separate analyses according to particular chronic pain conditions. We combined different chronic pain conditions in analyses for exploratory purposes only.
Selection of studies
Two review authors independently determined study eligibility by reading the abstract of each study identified by the search. Review authors independently eliminated studies that clearly did not satisfy the inclusion criteria, and obtained full copies of the remaining studies. Two review authors independently read these studies to select those that met the inclusion criteria, a third review author adjudicating in the event of disagreement. We did not anonymise the studies in any way before assessment. We included a PRISMA flow chart in Figure 1 to illustrate the results of the search and the process of screening and selecting studies for inclusion in the review (Moher 2009), as recommended in section 11.2.1 of the Cochrane Handbook for Systematic Reviews of Interventions (Higgins 2011). We included studies in the review irrespective of whether measured outcome data were reported in a ‘usable’ way.

Study flow diagram.
Data extraction and management
We obtained full copies of the studies, and two review authors independently carried out data extraction. Where this information was available, we extracted data on pain condition, number of participants treated, drug and dosing regimen, study design (placebo or active control), study duration and follow‐up, analgesic outcome measures and results, withdrawals, and adverse events (participants experiencing any adverse event or serious adverse event). We collated multiple reports of the same study, so that each study rather than each report was the unit of interest in the review. We collected characteristics of the included studies in sufficient detail to populate a ‘Characteristics of included studies’ table.
We used a template data extraction form and checked for agreement before entry into Cochrane's statistical software Review Manager 5 (RevMan 2014).
If a study had more than two intervention arms, we only included the data from the intervention and control groups that met the eligibility criteria. If we included multi‐arm studies, we planned to analyse multiple intervention groups in an appropriate way that avoided arbitrary omission of relevant groups and double‐counting of participants.
Assessment of risk of bias in included studies
Two review authors independently assessed risk of bias for each study, using the criteria outlined in the Cochrane Handbook for Systematic Reviews of Interventions (Higgins 2011).
We completed a 'Risk of bias' table for each included study using the Cochrane 'Risk of bias' tool in Review Manager 5 (RevMan 2014).
We assessed the following for each study. Any disagreements were resolved by discussion between review authors or by consulting a third review author when necessary.
-
Random sequence generation (checking for possible selection bias). We assessed the method used to generate the allocation sequence as: low risk of bias (i.e. any truly random process, e.g. random number table; computer random number generator); or unclear risk of bias (when the method used to generate the sequence is not clearly stated). We excluded studies that used a non‐random process and were therefore at high risk of bias (e.g. odd or even date of birth; hospital or clinic record number).
-
Allocation concealment (checking for possible selection bias). The method used to conceal allocation to interventions prior to assignment determines whether intervention allocation could have been foreseen in advance of, or during, recruitment, or changed after assignment. We assessed the methods as: low risk of bias (e.g. telephone or central randomisation; consecutively numbered, sealed, opaque envelopes); or unclear risk of bias (when the method is not clearly stated). We excluded studies that did not conceal allocation and were therefore at a high risk of bias (e.g. open list).
-
Blinding of participants and personnel (checking for possible performance bias). We assessed any methods used to blind the participants and personnel from knowledge of which intervention a participant received. We assessed the methods as: low risk of bias (study states that the participants and personnel involved were blinded to treatment groups); unclear risk of bias (study does not state whether or not participants and personnel were blinded to treatment groups); or high risk of bias (participants or personnel were not blinded) (as stated in Types of studies, we included trials with or without blinding, and participant‐ or observer‐reported outcomes).
-
Blinding of outcome assessment (checking for possible detection bias). We assessed any methods used to blind the outcome assessors from knowledge of which intervention a participant received. We assessed the methods as: low risk of bias (e.g. study states that it was single‐blinded and describes the method used to achieve blinding of the outcome assessor); unclear risk of bias (study states that outcome assessors were blinded but does not provide an adequate description of how this was achieved); or high risk of bias (outcome assessors were not blinded) (as stated in Types of studies, we included trials with or without blinding, and participant‐ or observer‐reported outcomes).
-
Incomplete outcome data (checking for possible attrition bias due to the amount, nature, and handling of incomplete outcome data). We assessed the methods used to deal with incomplete data as: low risk of bias (i.e. less than 10% of participants did not complete the study or used 'baseline observation carried forward' (BOCF) analysis, or both); unclear risk of bias (used 'last observation carried forward' (LOCF) analysis); or high risk of bias (used 'completer' analysis).
-
Selective reporting (checking for possible reporting bias). We assessed the methods used to report the outcomes of the study as: low risk of bias (if all planned outcomes in the protocol or methods were reported in the results); unclear risk of bias (if there was not a clear distinction between planned outcomes and reported outcomes); or high risk of bias (if some planned outcomes from the protocol or methods were clearly not reported in the results).
-
Size of study (checking for possible biases confounded by small size) (Dechartres 2013; Dechartres 2014; McQuay 1998; Nüesch 2010; Thorlund 2011). We assessed studies as being at low risk of bias (200 participants or more per treatment arm); unclear risk of bias (50 to 199 participants per treatment arm); or high risk of bias (fewer than 50 participants per treatment arm).
-
Other bias, such as multiple publications, financial declarations, participants with conflicts of interest. We assessed studies for any additional sources of bias as low, unclear, or high risk of bias, and provided rationale.
Measures of treatment effect
Where dichotomous data were available, we calculated a risk ratio (RR) with 95% confidence interval (CI) and meta‐analysed the data as appropriate. We calculated numbers needed to treat for an additional beneficial outcome (NNTBs) where appropriate (McQuay 1998); for unwanted effects the NNTB becomes the number needed to treat for an additional harmful outcome (NNTH) and is calculated in the same manner. Where continuous data were reported, we used appropriate methods to combine these data in the meta‐analysis.
Unit of analysis issues
We accepted randomisation to the individual participant only. We split the control treatment arm between active treatment arms in a single study if the active treatment arms were not combined for analysis. We only accepted studies with minimum 10 participants per treatment arm.
Dealing with missing data
We used intention‐to‐treat analysis where the intention‐to‐treat population consisted of participants who were randomised, took at least one dose of the assigned study medication, and provided at least one post baseline assessment. We assigned missing participants zero improvement wherever possible.
Assessment of heterogeneity
We identified and measured heterogeneity as recommended in Chapter 9 of the Cochrane Handbook for Systematic Reviews of Interventions (Higgins 2011). We dealt with clinical heterogeneity by combining studies that examined similar conditions. We undertook and presented a meta‐analysis only if we judged participants, interventions, comparisons, and outcomes to be sufficiently similar to ensure a clinically meaningful answer. We assessed statistical heterogeneity visually and by using the I² statistic (L'Abbé 1987). When I² was greater than 50%, we considered the possible reasons.
Assessment of reporting biases
We assessed the risk of reporting bias, as recommended in chapter 8 of the Cochrane Handbook for Systematic Reviews of Interventions (Higgins 2011).
The aim of this review was to use dichotomous outcomes of known utility and of value to patients (Hoffman 2010; Moore 2010b; Moore 2010c; Moore 2010d; Moore 2013a). The review did not depend on what the authors of the original studies chose to report or not, though clearly difficulties would arise in studies failing to report any dichotomous results. We extracted and used continuous data, which probably reflect efficacy and utility poorly, and may be useful for illustrative purposes only.
We assessed publication bias using a method designed to detect the amount of unpublished data with a null effect required to make any result clinically irrelevant (usually taken to mean a number needed to treat (NNT) of 10 or higher) (Moore 2008).
Data synthesis
We planned to use a fixed‐effect model for meta‐analysis. We used a random‐effects model for meta‐analysis if there was significant clinical heterogeneity and we considered it appropriate to combine studies. We conducted our analysis using the primary outcomes of pain and adverse events, and planned to calculate the NNTHs for adverse events. We used the Cochrane software program Review Manager 5 (RevMan 2014).
Quality of the evidence
To analyse data, two review authors independently rated the quality of each outcome. We used the GRADE approach to assess the quality of the body of evidence related to each of the key outcomes, and reported our judgement in a 'Summary of findings' table per Chapter 12 of the Cochrane Handbook (Appendix 6) (Higgins 2011).
In addition, there may be circumstances where the overall rating for a particular outcome would need to be adjusted per GRADE guidelines (Guyatt 2013a). For example, if there are so few data that the results are highly susceptible to the random play of chance, or if studies used LOCF imputation in circumstances where there were substantial differences in adverse event withdrawals, one would have no confidence in the result, and would need to downgrade the quality of the evidence by three levels, to very low quality. In addition, in circumstances where no data were reported for an outcome, we planned to report that there was no evidence to support or refute (Guyatt 2013b).
'Summary of findings' table
We included two 'Summary of findings' tables as set out in the Cochrane Pain, Palliative and Supportive Care Review Group’s author guide (AUREF 2012), and recommended in section 4.6.6 of the Cochrane Handbook for Systematic Reviews of Interventions (Higgins 2011). We justified and documented all assessments of the quality of the body of evidence.
In an attempt to interpret reliability of the findings for this systematic review, we assessed the summarised data using the GRADE guidelines (Appendix 6) to rate the quality of the body of evidence of each of the key outcomes listed in Types of outcome measures per Chapter 12 of the Cochrane Handbook (Guyatt 2011; Higgins 2011), as appropriate. Utilising the explicit criteria against study design, risk of bias, imprecision, inconsistency, indirectness, and magnitude of effect, we summarised the evidence in an informative, transparent, and succinct 'Summary of findings' table or 'Evidence profile' table (Guyatt 2011).
Subgroup analysis and investigation of heterogeneity
We planned to perform subgroup analyses where a minimum number of data were available (at least 200 participants per treatment arm). We planned to analyse according to age group; type of drug; geographical location or country; type of control group; baseline measures; frequency, dose, and duration of drugs; and nature of drug.
We planned to investigate whether the results of subgroups were significantly different by inspecting the overlap of confidence intervals and performing the test for subgroup differences available in Review Manager 5.
Sensitivity analysis
We did not plan to carry out any sensitivity analysis because the evidence base is known to be too small to allow reliable analysis; we did not plan to pool results from chronic pain of different origins in the primary analyses. We examined details of dose escalation schedules in the unlikely circumstance that this could provide some basis for a sensitivity analysis.
Results
Description of studies
Results of the search
A PRISMA flow diagram of the search results is shown in Figure 1.
The three main databases searches revealed 4872 titles, of which 1408 duplicates were removed. Our searches of ClinicalTrials.gov and the WHO ICTRP yielded no additional eligible studies.
We screened the remaining 3464 titles and abstracts for eligibility, removing 3450 as ineligible studies.
We read the full‐text reports of the remaining 14 studies. We found seven to be ineligible. We identified no ongoing studies.
Seven studies fulfilled the eligibility criteria, and provided data. Due to these studies comparing different types of NSAIDs, none could be entered into a quantitative meta‐analysis.
Included studies
We included seven studies in this review. See Characteristics of included studies.
Bhettay 1978 investigated 30 participants (2 to 16 years of age) in a multicentre, randomised, double‐blind, active comparator‐controlled, cross‐over study. Participants had a diagnosis of juvenile chronic arthritis. The report did not state gender ratios. Participants were split into two groups, and the administration of drugs (ketoprofen versus indomethacin) was randomised. Participants received doses depending on weight. Participants < 20 kg received oral capsules of ketoprofen 25 mg capsule twice daily; participants > 20 kg received ketoprofen capsules x 2 = 50 mg twice daily, or participants < 20 kg received indomethacin 25 mg capsule twice daily; participants > 20 kg received indomethacin capsules x 2 = 50 mg twice daily, for five weeks. People were excluded if known history of contraindications to study drugs; receiving gold, d‐penicillamine, or corticosteroids; or in a state of remission.
Brewer 1982 investigated 99 participants in a multicentre, randomised, double‐blind, active comparator‐controlled, parallel‐group study. Participants had a diagnosis of functional abdominal pain, functional dyspepsia, and irritable bowel syndrome according to the Rome II criteria (see Brewer 1982). Participants were 8 to 17 years old; 73% were female. Participants received oral capsules of aspirin 1500 mg/m2/d increased to 3000 mg/m2/d, maximum 5450 mg/d (n = 49), or fenoprofen 900 mg/m2/d increased to 1800 mg/m2/d, maximum 3200 mg/d (n = 50), for 12 weeks. The study did not report exclusion criteria.
Foeldvari 2009 investigated 242 participants in a multicentre, randomised, double‐blind, active comparator‐controlled, parallel‐group study. Participants had a diagnosis of pauciarticular or polyarticular course juvenile rheumatoid arthritis (JRA), with or without systemic onset, according to American College of Rheumatology (ACR) criteria; > 1 swollen joint with limited motion; parent global assessment ≥ 10 mm (visual analogue scale (VAS) 100 mm). Participants were 2 to 16 years old; 70% were female. Participants received oral capsules of celecoxib 50 mg/5 mL oral suspension (target dose approximately 3 mg/kg twice daily) (n = 77); celecoxib 100 mg/5 mL oral suspension (target dose approximately 6 mg/kg twice daily) (n = 82); or naproxen 125 mg/5 mL oral suspension (target dose approximately 7.5 mg/kg twice daily) (n = 83), for 12 weeks. People were excluded if they had active systemic manifestations; oral corticosteroid doses ≤ 0.2 mg/kg/day or 10 mg prednisone or methotrexate < 1 mg/kg/week.
Giannini 1990 investigated 92 participants in a multicentre, randomised, double‐blind, active comparator‐controlled, parallel‐group study. Participants had a diagnosis of any of the three types of JRA (systemic, pauciarticular, or polyarticular); minimum one joint with active arthritis; free of other chronic illness. Participants were 2 to 15 years old; 83% were female. Participants received ibuprofen suspension (concentration 100 mg/5 mL) + placebo aspirin (n = 45); or aspirin 200 mg tablet (participant weight 10 to 30 kg) or 300 mg capsules (participant weight > 30 kg) + placebo ibuprofen (n = 47). At week 2, physicians had the option to increase dose to 40 mg/kg/day ibuprofen or 80 mg/kg/day aspirin, provided there were no significant side effects. Exclusion criteria included those who did not complete the 72‐hour washout period of all other NSAIDs; previous ibuprofen or slower‐acting antirheumatic drugs at least 3 months before entry; immunosuppressive therapy at least 6 months before entry; acute illnesses that might interfere with or compromise the absorption of the medication.
Moran 1979 investigated 23 participants in a multicentre, randomised, double‐blind, active comparator‐controlled, cross‐over study. Participants had a diagnosis of seronegative juvenile polyarthritis with disease sufficiently active to be considered in need of an anti‐inflammatory analgesic agent. Participants were 5 to 16 years old; gender ratios were not stated. Participants received naproxen 10 mg/kg/24 hours given as a suspension in 2 divided doses; or aspirin soluble 80 mg/kg/day, divided into 4 doses, for 2 x 4 weeks. The study did not report exclusion criteria.
Reiff 2006 investigated 310 participants in a multicentre, randomised, double‐blind, double‐dummy, active comparator‐controlled, parallel‐group study. Participants had a diagnosis of pauciarticular (oligo) or polyarticular course JRA for ≥ 3 months meeting the ACR criteria for JRA, with a patient assessment of overall well‐being (0 to 100 VAS) of > 90 and at least one swollen joint. Participants were 2 to 17 years old (2 to 11 years = children; 12 to 17 years = adolescents); 73% were female. Participants (N = 209) received: (children) lower‐dose rofecoxib 0.3 mg/kg/day maximum 12.5 mg/day, or higher‐dose rofecoxib 0.6 mg/kg/day maximum 25 mg/day; (adolescents) rofecoxib 12.5 or 25 mg daily; or (N = 101): (children) naproxen 15 mg/kg/day 5 mg oral suspension; (adolescents) 15 mg/kg/day maximum 1000 mg/day, for 12 weeks. People were excluded if they had active systemic JRA symptoms within 3 months of randomisation or if they were not within the 5th to 95th percentile of weight for height; hypersensitivity to aspirin and/or an NSAID; unstable antirheumatic medication regimens; requiring alkylating agents, anticonvulsants, warfarin, or rifampicin; female participants who had reached menarche were required to be in a non‐gravid state as determined by measurement of serum beta‐human chorionic gonadotropin.
Ruperto 2005 investigated 90 participants in a multicentre, randomised, double‐blind, active comparator‐controlled, parallel‐group study. Participants had a diagnosis of juvenile idiopathic arthritis (JIA) (Durban criteria); NSAID therapy is required; have at least two joints with active arthritis plus abnormal results in at least two of any of the five remaining JIA core set criteria. Participants were 2 to 16 years old; 65% were male. Participants received oral capsules of meloxicam 0.125 mg/kg, plus a placebo naproxen tablet, one dose per day (n = 73); or meloxicam 0.25 mg/kg, plus a placebo naproxen tablet, one dose per day (n = 74); or naproxen 5 mg/kg, twice per day (n = 78); for 48 weeks. People were excluded if they had current systemic manifestations; abnormal laboratory results unrelated to JIA; pregnancy, breastfeeding; bleeding disorders; peptic ulcer in past six months; hypersensitivity to NSAIDs; other rheumatic conditions; other medications related to rheumatic conditions; taking other NSAIDs.
Excluded studies
See Characteristics of excluded studies.
We excluded seven studies in this review. Five investigated pain in adults, and two were not randomised controlled trials.
Risk of bias in included studies
A summary of the 'Risk of bias' assessment is in Figure 2. Full details of 'Risk of bias' assessments are in the Characteristics of included studies tables.
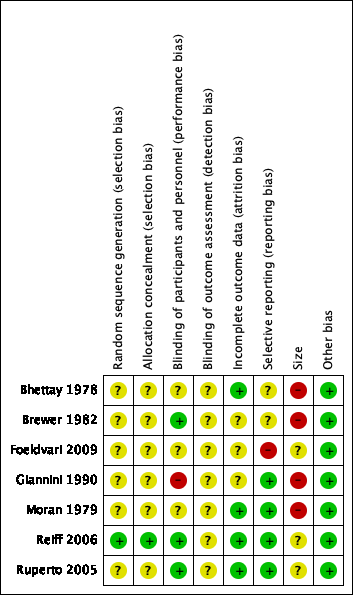
Risk of bias summary: review authors' judgements about each risk of bias item for each included study.
Allocation
Random sequence generation
One study adequately described the methods used to randomise participants (Reiff 2006). We judged this study as at low risk of selection bias for random sequence generation.
Six studies were stated as randomised but no methods used to randomise the participants were described (Bhettay 1978; Brewer 1982; Foeldvari 2009; Giannini 1990; Moran 1979; Ruperto 2005). We judged these studies as at unclear risk of selection bias for random sequence generation.
Allocation concealment
One study adequately described the methods used to conceal treatment group from participants (Reiff 2006). We judged this study as at low risk of selection bias for allocation concealment.
Six studies did not describe any methods used to conceal treatment group from participants (Bhettay 1978; Brewer 1982; Foeldvari 2009; Giannini 1990; Moran 1979; Ruperto 2005). We judged these studies as at unclear risk of selection bias for allocation concealment.
Blinding
Performance bias
Three studies adequately described the methods used to maintain blinding in both participants and study personnel from knowledge of the treatment groups (Brewer 1982; Reiff 2006; Ruperto 2005). We judged these studies as at low risk of performance bias.
Three studies were stated as double‐blind but the methods used to maintain blinding in both participants and study personnel from knowledge of the treatment groups were not adequately described (Bhettay 1978; Foeldvari 2009; Moran 1979). We judged these studies as at unclear risk of performance bias.
One study attempted to double‐blind, however as one treatment was liquid and the other was a tablet it seemed possible that the participants could have known which treatment they received (Giannini 1990). We judged this study as at high risk of performance bias.
Detection bias
None of the studies adequately described the methods used to conceal and blind the outcome assessors from knowledge of the treatment groups (Bhettay 1978; Brewer 1982; Foeldvari 2009; Giannini 1990; Moran 1979; Reiff 2006; Ruperto 2005). We judged all seven included studies as at unclear risk of detection bias.
Incomplete outcome data
Four studies adequately accounted for all participants from the recruitment stage, through randomisation until follow‐up, including counting all withdrawals (Bhettay 1978; Moran 1979; Reiff 2006; Ruperto 2005). We judged these studies as at low risk of attrition bias.
In three studies, the authors did not report whether there were significant differences between completers and non‐completers (Brewer 1982; Foeldvari 2009; Giannini 1990). We judged these studies as at unclear risk of attrition bias.
Selective reporting
Four studies adequately reported on all the planned outcomes as initially listed in the methods sections (Giannini 1990; Moran 1979; Reiff 2006; Ruperto 2005). We judged these studies as at low risk of reporting bias.
Two studies did not adequately report in their results all outcomes that were planned in the methods sections. In Bhettay 1978, many data such as the means and standard deviations, or blood sedimentation rate, haemoglobin level, platelet, and white cell count, were not reported clearly. In Brewer 1982, the authors stated that "all investigators used an identical protocol and case report forms". However, outcomes were not set out clearly in the methods, and we were unable to locate a protocol. We judged these studies as at unclear risk of reporting bias.
In one study, Foeldvari 2009, the Pediatric Quality of Life Inventory score outcome data had been planned but were not reported. We judged this study as at high risk of reporting bias.
Other potential sources of bias
Size
No studies investigated a study population of more than 200 participants per treatment arm, therefore we judged none as at low risk of bias with regard to size.
Three studies investigated study populations between 225 and 310 participants, which resulted in 50 to 200 participants per treatment arm (Foeldvari 2009; Reiff 2006; Ruperto 2005). We judged these studies as at unclear risk of bias with regard to size.
Four studies investigated study populations between 23 and 99 participants, which resulted in fewer than 50 participants per treatment arm (Bhettay 1978; Brewer 1982; Giannini 1990; Moran 1979). We judged these studies as at high risk of bias with regard to size.
Other
We found no other potential sources of bias. We judged all seven included studies as at low risk of bias for this domain.
Effects of interventions
See: Summary of findings for the main comparison Meloxicam compared with naproxen for chronic non‐cancer pain; Summary of findings 2 Celecoxib compared with naproxen for chronic non‐cancer pain; Summary of findings 3 Rofecoxib compared with naproxen for chronic non‐cancer pain
Results and outcomes of the individual studies are in Appendix 7 (efficacy), and Appendix 8 (adverse events and withdrawals).
Of the seven included studies, no two studies investigated the same type of NSAID compared with another type, therefore none could be entered into a quantitative meta‐analysis; see table below. The qualitative analysis of results follows.
Table 1: Types of drug interventions and conditions of included studies
| Study | Interventions | Condition |
| ketoprofen vs indomethacin | juvenile chronic arthritis | |
| aspirin vs fenoprofen | juvenile rheumatoid arthritis | |
| celecoxib vs naproxen | juvenile rheumatoid arthritis | |
| Ibuprofen vs aspirin | juvenile rheumatoid arthritis | |
| naproxen vs aspirin | juvenile chronic polyarthritis | |
| naproxen vs rofecoxib | juvenile rheumatoid arthritis | |
| meloxicam vs naproxen | juvenile idiopathic arthritis |
Comparison 1: NSAIDs versus an active comparator
Primary outcomes
Participant‐reported pain relief of 30% or greater
Three studies reported participant‐reported pain relief of 30% or greater.
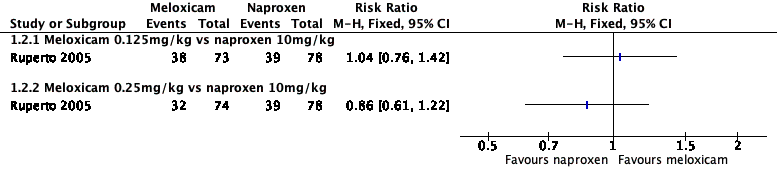
Analysis 1.1, displayed in a forest plot for illustrative purposes only (Figure 3), shows the difference between low‐dose meloxicam (0.125 mg/kg) and high‐dose meloxicam (0.25 mg/kg) versus naproxen (10 mg/kg) is not statistically significant (P > 0.05) (low‐quality evidence) (Ruperto 2005).

Forest plot of comparison: 1 Meloxicam versus naproxen, outcome: 1.1 Participant‐reported pain relief of 30% or greater.
Analysis 2.1, displayed in a forest plot for illustrative purposes only (Figure 4), shows the difference between low‐dose celecoxib (3 mg/kg) and high‐dose celecoxib (6 mg/kg) versus naproxen (10 mg/kg) is not statistically significant (P > 0.05) (low‐quality evidence) (Foeldvari 2009).
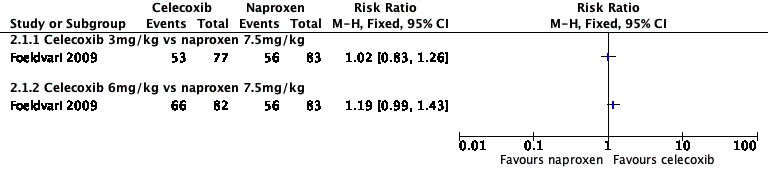
Forest plot of comparison: 2 Celecoxib versus naproxen, outcome: 2.1 Participant‐reported pain relief of 30% or greater.
Analysis 3.1, displayed in a forest plot for illustrative purposes only (Figure 5), shows the difference between low‐dose rofecoxib (0.3 mg/kg, maximum 12.5 mg/kg) and high‐dose rofecoxib (0.6 mg/kg, maximum 25.0 mg/kg) versus naproxen (15 mg/kg) is not statistically significant (P > 0.05) (low‐quality evidence) (Reiff 2006).

Forest plot of comparison: 3 Rofecoxib versus naproxen, outcome: 3.1 Participant‐reported pain relief of 30% or greater.
We consider the available data for this outcome to be low‐quality evidence, downgraded once for serious study limitations (risk of bias) and once for imprecision. See summary of findings Table for the main comparison; summary of findings Table 2; summary of findings Table 3.
The remaining four studies did not report participant‐reported pain relief of 30% or greater (Bhettay 1978; Brewer 1982; Giannini 1990; Moran 1979).
Participant‐reported pain relief of 50% or greater
One study reported participant‐reported pain relief of 50% or greater.
Analysis 1.2, displayed in a forest plot for illustrative purposes only (Figure 6), shows the difference between low‐dose meloxicam (0.125 mg/kg) and high‐dose meloxicam (0.25 mg/kg) is not statistically significant (P > 0.05) (low‐quality evidence) (Ruperto 2005).
Forest plot of comparison: 1 Meloxicam versus naproxen, outcome: 1.2 Participant‐reported pain relief of 50% or greater.
We consider the available data for this outcome to be low‐quality evidence, downgraded once for serious study limitations (risk of bias) and once for imprecision.
The remaining six studies did not report participant‐reported pain relief of 50% or greater (Bhettay 1978; Brewer 1982; Foeldvari 2009; Giannini 1990; Moran 1979; Reiff 2006).
Patient Global Impression of Change much or very much improved
One study reported PGIC.
Giannini 1990 reported very much improved for ibuprofen 22/26 participants (85%) and for aspirin 18/20 participants (90%) (low‐quality evidence).
We consider the available data for this outcome to be low‐quality evidence, downgraded once for serious study limitations (risk of bias) and once for imprecision.
The remaining six studies did not report PGIC (Bhettay 1978; Brewer 1982; Foeldvari 2009; Moran 1979; Reiff 2006; Ruperto 2005).
Quality of the evidence
We downgraded some outcomes twice to low quality due to serious study limitations (risk of bias) and imprecision. We downgraded some outcomes three times to very low‐quality due too few data and the fact that the number of events was too small to be meaningful.
Secondary outcomes
Carer Global Impression of Change
Four studies reported Carer Global Impression of Change in pain scores.
Brewer 1982 reported parent global assessment of participant response (satisfactory) to therapy: fenoprofen 69% and aspirin 61.5%. Foeldvari 2009 reported parent global assessment of overall well‐being (100‐millimetre VAS), least squares mean change from baseline (standard error): celecoxib 3 mg/kg: ‐17.96 (2.42); celecoxib 6 mg/kg: ‐20.45 (2.34); naproxen 7.5 mg/kg: ‐18.25 (2.33). Giannini 1990 reported Carer Global Impression of Change: ibuprofen: 33/42 (79%) and aspirin: 29/35 (83%). Ruperto 2005 reported Carer global impression of disease activity change (VAS 0 to 100) ± (standard deviation), at three months: low‐dose meloxicam: 17.6 ± 20.2; high‐dose meloxicam: 21.9 ± 23.6; naproxen: 20.8 ± 22.4, and at 12 months: low‐dose meloxicam: 13.4 ± 17.6; high‐dose meloxicam: 17.2 ± 22.5; naproxen: 15.9 ± 21.3 (low‐quality evidence).
We consider the available data for this outcome to be low‐quality evidence, downgraded once for serious study limitations (risk of bias) and once for imprecision.
The remaining three studies did not report Carer Global Impression of Change in pain scores (Bhettay 1978; Moran 1979; Reiff 2006).
Additional information
These four studies, as well as Reiff 2006, also reported Physician or Investigator Global Impression of Change. Brewer 1982 reported physician global assessment of participant response: fenoprofen: 62% and aspirin: 63%. Foeldvari 2009 reported physician global assessment of disease activity (100‐millimetre VAS), least squares mean change from baseline (standard error): celecoxib 3 mg/kg: ‐21.07 (1.86); celecoxib 6 mg/kg: ‐23.27 (1.80); naproxen 7.5 mg/kg: ‐21.88 (1.79). Giannini 1990 reported Investigator Global Evaluation: ibuprofen: 34/44 (78%) and aspirin: 27/35 (77%). Reiff 2006 reported investigators' global assessment of disease activity: mean change from baseline (95% confidence interval (CI)): low‐dose rofecoxib: ‐12.45 (95% CI ‐14.95 to ‐9.94); high‐dose rofecoxib: ‐13.27 (95% CI ‐15.88 to ‐10.65); naproxen: ‐12.05 (95% CI ‐14.60 to ‐9.50). Reiff 2006 also reported participant/parent global assessment of pain, mean change from baseline (95%CI): low‐dose rofecoxib: ‐12.50 (95% CI ‐15.98 to ‐9.02); high‐dose rofecoxib: ‐13.12 (95% CI ‐16.75 to ‐9.48); naproxen: ‐8.43 (95% CI ‐11.98 to ‐4.88). Ruperto 2005 reported physician global impression of disease activity change (VAS 0 to 100) ± (standard deviation), at three months: low‐dose meloxicam: 19.4 ± 20.7; high‐dose meloxicam: 20.6 ± 20.3; naproxen: 21.1 ± 19.2, and at 12 months: low‐dose meloxicam: 15.4 ± 20.5; high‐dose meloxicam: 16.8 ± 19.0; naproxen: 14.4 ± 16.7 (no judgement of quality of evidence).
Requirement for rescue analgesia
No studies reported data on this outcome.
Sleep duration and quality
No studies reported data on this outcome.
Acceptability of treatment
One study reported acceptability of treatment.
Moran 1979 reported participants' medication preference at the end of the trial. Of the 23 participants who took part in both the naproxen period and the aspirin period, zero rated naproxen much better; 9 rated naproxen better; 9 rated both drug periods equal; 4 rated aspirin better; and 1 rated aspirin much better (very low‐quality evidence).
We consider the available data for this outcome to be very low‐quality evidence, as the number of events was too small to be meaningful.
The remaining six included studies did not report acceptability of treatment (Bhettay 1978; Brewer 1982; Foeldvari 2009; Giannini 1990; Reiff 2006; Ruperto 2005).
Physical functioning as defined by validated scales
Three studies reported physical functioning.
Foeldvari 2009 reported the parent assessment of physical functioning, Child Health Assessment Questionnaire, disability index (CHAQ‐DI) 0 to 3, least squares mean change from baseline (standard error): celecoxib 3 mg/kg: ‐0.28 (0.05): celecoxib 6 mg/kg: ‐0.32 (0.05): naproxen 7.5 mg/kg: ‐0.31 (0.05). Reiff 2006 reported CHAQ‐DI: mean change from baseline (95% CI): low‐dose rofecoxib: ‐0.11 (95% CI ‐0.18 to ‐0.05); high‐dose rofecoxib: ‐0.15 (95% CI ‐0.21 to ‐0.08); naproxen: ‐0.12 (95% CI ‐0.18 to ‐0.05). Ruperto 2005 reported CHAQ‐DI (0 to 3 points) at three months: low‐dose meloxicam: 0.4 ± 0.5; high‐dose meloxicam: 0.5 ± 0.6; naproxen: 0.5 ± 0.6, and at 12 months: low‐dose meloxicam: 0.3 ± 0.4; high‐dose meloxicam: 0.4 ± 0.6; naproxen: 0.3 ± 0.5 (low‐quality evidence).
We consider the available data for this outcome to be low‐quality evidence, downgraded once for serious study limitations (risk of bias) and once for imprecision.
The remaining four studies did not report physical functioning (Bhettay 1978; Brewer 1982; Giannini 1990; Moran 1979).
Quality of life as defined by validated scales
Two studies reported quality of life.
Foeldvari 2009 reported improved Pediatric Quality of Life Inventory scores. Participants in the celecoxib 6 mg/kg twice‐daily or naproxen 7.5 mg/kg twice‐daily groups scored higher than those in the celecoxib 3 mg/kg twice‐daily group, but results were non‐significant (data not shown in publication). It is unclear whether differences are between groups or over time. Reiff 2006 reported participant/parent assessment of overall well‐being: mean change from baseline (95% CI) (proportion of improvement from baseline): low‐dose rofecoxib: ‐11.57 (95% CI ‐14.78 to ‐8.36) (74.3%); high‐dose rofecoxib: ‐12.08 (95% CI ‐15.44 to ‐8.73) (76%); naproxen: ‐8.56 (95% CI ‐11.85 to ‐5.27) (73%) (low‐quality evidence).
We consider the available data for this outcome to be low‐quality evidence, downgraded once for serious study limitations (risk of bias) and once for imprecision.
The remaining six studies did not report quality of life (Bhettay 1978; Brewer 1982; Giannini 1990; Moran 1979; Ruperto 2005).
Any adverse events
Six studies reported adverse events.
Participants reporting an adverse event (one or more per person) by drug were: aspirin 85/120; fenoprofen 28/49; ibuprofen 40/45; indomethacin 9/30; ketoprofen 9/30; meloxicam 113/147; naproxen 102/202; and rofecoxib 43/209 (Bhettay 1978; Brewer 1982; Giannini 1990; Moran 1979; Reiff 2006). In addition there were unclear data on adverse events from 159 celecoxib participants and 83 naproxen participants (very low‐quality evidence) (Foeldvari 2009).
We consider the available data for this outcome to be very low‐quality evidence, as the number of events was too small to be meaningful.
Withdrawals due to adverse events
All seven studies reported withdrawals due to adverse events.
Participants withdrawn due to an adverse event by drug were: aspirin 16/120; celecoxib 10/159; fenoprofen 0/49; ibuprofen 0/45; indomethacin 0/30; ketoprofen 0/30; meloxicam 10/147; naproxen 17/285; and rofecoxib 3/209 (very low‐quality evidence) (Bhettay 1978; Brewer 1982; Foeldvari 2009; Giannini 1990; Moran 1979; Reiff 2006; Ruperto 2005).
We consider the available data for this outcome to be very low‐quality evidence, due to a lack of available data, and the number of events was too small to be meaningful.
Any serious adverse event
All seven studies reported serious adverse events.
We considered serious adverse events to be hospitalisation or death, however in many cases this level of detail defining a serious adverse event was not provided.
Participants experiencing a serious adverse event by drug were: aspirin 13/120; celecoxib 5/159; fenoprofen 0/79; ketoprofen 0/30; ibuprofen 4/45; indomethacin 0/30; meloxicam 11/147; naproxen 10/285; and rofecoxib 0/209 (very low‐quality evidence) (Bhettay 1978; Brewer 1982; Foeldvari 2009; Giannini 1990; Moran 1979; Reiff 2006; Ruperto 2005).
We consider the available data for this outcome to be very low‐quality evidence, due to a lack of available data, and the number of events was too small to be meaningful.
Quality of the evidence
We downgraded some outcomes twice down to low quality due to serious study limitations (risk of bias) and imprecision. We downgraded some outcomes three times to very low‐quality due too few data and the fact that the number of events was too small to be meaningful.
For some outcomes, no data were reported and therefore there was no evidence to support or refute the use of NSAIDs to treat chronic non‐cancer pain in children and adolescents.
Comparison 2: NSAIDs versus placebo
None of the included studies addressed our second comparison of an NSAID versus placebo. Due to the lack of data, there is no evidence to support or refute the use of NSAIDs compared with a placebo to treat chronic non‐cancer pain in children and adolescents.
Mean response rate for any NSAID at any dose
As data were insufficient for pooled analyses comparing one drug to another, we performed a post hoc analysis using the randomised cohorts of NSAIDs to calculate the mean response rate for any NSAID at any dose. For our primary outcome of at least 50% pain relief, the mean response rate was 45.5%, and the weighted mean by size of the treatment group was 47.3%. This means that nearly 1 in every 2 people will achieve at least 50% pain relief from treatment with one of these NSAIDs. For our primary outcome of at least 30% pain relief, the mean response rate was 26.0%, and the weighted mean by size of the treatment group was 29.1%. This means that about 1 in every 4 people will achieve at least 30% pain relief from treatment with one of these NSAIDs.
Discussion
Summary of main results
We included seven studies in this review reporting data from 1074 participants (aged 2 to 18 years), comparing various combinations of the following NSAIDs: aspirin, celecoxib, fenoprofen, ibuprofen, indomethacin, ketoprofen, meloxicam, naproxen, and rofecoxib. No studies compared the intervention drug with placebo.
No two included studies investigated the same type of NSAID compared with another type of NSAID. Consequently, no studies could be entered into a quantitative meta‐analysis.
Risk of bias for the included studies varied. For randomisation and allocation concealment, one study was low risk and six were unclear risk. For blinding of participants and personnel, three studies were low risk and four were unclear to high risk. For blinding of outcome assessors, all studies were unclear risk. For attrition, four studies were low risk and three were unclear risk. For selective reporting, four studies were low risk, two were unclear risk, and one was high risk. For size, three studies were unclear risk and four were high risk. For other potential sources of bias, seven studies were low risk.
There is no evidence from randomised controlled trials to suggest that NSAIDs are effective in treating chronic non‐cancer pain in children or adolescents, nor do we have evidence to suggest that one NSAID is more effective than another. We were unable to comment on harm.
Overall completeness and applicability of evidence
We identified only a small number of studies (seven), with insufficient data for analysis, of any combination of NSAIDs. As only three studies, Foeldvari 2009, Reiff 2006, and Ruperto 2005, addressed our primary outcome, we compared low doses with high doses of meloxicam, celecoxib, or rofecoxib versus naproxen to investigate 30% and 50% pain relief responders, and found no difference in effect.
As we could undertake no meta‐analysis, we are unable to comment on efficacy from the use of NSAIDs to treat chronic non‐cancer pain in children and adolescents. Similarly, we cannot comment on our remaining secondary outcomes: Carer Global impression of Change; requirement for rescue analgesia; sleep duration and quality; acceptability of treatment; physical functioning; and quality of life. We found small numbers of (mild) adverse effects across the different NSAIDs, and small numbers of serious adverse effects, however none resulted in hospitalisation or death.
All seven studies evaluated participants with musculoskeletal disease‐related pain. We identified no studies in non‐arthritis populations.
The suite of reviews
This review is part of a suite of reviews on pharmacological interventions for chronic pain and cancer‐related pain in children and adolescents (Appendix 1). Taking a broader view on this suite of reviews, some pharmacotherapies (investigated in our other reviews) are likely to provide more data than others. The results were thus as expected considering that randomised controlled trials in children are known to be limited. The results have the potential to inform policymaking decisions for funding future clinical trials into NSAID treatment of child and adolescent pain, therefore any results (large or small) are important in order to capture a snapshot of the current evidence for NSAIDs.
Quality of the evidence
Of the seven included studies, only one study clearly described randomisation methods, and only three studies described double‐blinding methods, however all studies provided information about withdrawals, dropouts, and adverse events.
The studies recruited participants with adequate baseline pain, but not all reported clinically useful outcome measures.
The studies themselves were of moderate quality, however the number of studies and sample sizes for some comparisons were somewhat limited, given what is known about study size and estimates of effect for outcomes derived from studies with few participants and events (Dechartres 2013; Dechartres 2014; McQuay 1998; Nüesch 2010; Thorlund 2011).
We consider the overall quality of the evidence for NSAIDs versus an active comparator or a placebo, across our primary and secondary outcomes with available data?, to be low or very‐low quality.
We downgraded some outcomes twice to low quality due to serious study limitations (risk of bias) and imprecision. We downgraded some outcomes three times to very low‐quality due too few data and the fact that the number of events was too small to be meaningful.
For some outcomes, no data were available and therefore there was no evidence to support or refute the use of NSAIDs to treat chronic non‐cancer pain in children and adolescents.
Potential biases in the review process
We carried out extensive searches of major databases using broad search criteria, and also searched two large clinical trial registries. We consider it to be unlikely that we have missed relevant studies.
Agreements and disagreements with other studies or reviews
We were not able to identify any published systematic reviews on this topic.
Risk of bias summary: review authors' judgements about each risk of bias item for each included study.
Forest plot of comparison: 1 Meloxicam versus naproxen, outcome: 1.1 Participant‐reported pain relief of 30% or greater.
Forest plot of comparison: 2 Celecoxib versus naproxen, outcome: 2.1 Participant‐reported pain relief of 30% or greater.
Forest plot of comparison: 3 Rofecoxib versus naproxen, outcome: 3.1 Participant‐reported pain relief of 30% or greater.
Forest plot of comparison: 1 Meloxicam versus naproxen, outcome: 1.2 Participant‐reported pain relief of 50% or greater.

Comparison 1 Meloxicam versus naproxen, Outcome 1 Participant‐reported pain relief of 30% or greater.

Comparison 1 Meloxicam versus naproxen, Outcome 2 Participant‐reported pain relief of 50% or greater.

Comparison 2 Celecoxib versus naproxen, Outcome 1 Participant‐reported pain relief of 30% or greater.

Comparison 3 Rofecoxib versus naproxen, Outcome 1 Participant‐reported pain relief of 30% or greater.
| Meloxicam compared with naproxen for chronic non‐cancer pain | ||||||
| Patient or population: children and adolescents with chronic non‐cancer pain Settings: multicentre paediatric rheumatology tertiary care units (international) Intervention: meloxicam Comparison: naproxen | ||||||
| Outcomes | Illustrative comparative risks* (95% CI) | Relative effect | No. of participants | Quality of the evidence | Comments | |
| Naproxen | Meloxicam | |||||
| Participant‐reported pain relief of 30% or greater | 50/78 | 89/147 | N/A | 225 participants (1 study) | ⊕⊕⊝⊝ | |
| Participant‐reported pain relief of 50% or greater | 39/78 | 70/147 | N/A | 225 participants (1 study) | ⊕⊕⊝⊝ | |
| Patient Global Impression of Change much or very much improved | No data | No data | N/A | N/A | No evidence to support or refutec | |
| Any adverse event | 10/78 | 18/147 | N/A | 225 participants (1 study) | ⊕⊝⊝⊝ | |
| Serious adverse event | 10/78 | 11/147 | N/A | 225 participants (1 study) | ⊕⊝⊝⊝ | |
| Withdrawals due to adverse events | 10/78 | 10/147 | N/A | 225 participants (1 study) | ⊕⊝⊝⊝ | |
| *The basis for the assumed risk (e.g. the median control group risk across studies) is provided in footnotes. The corresponding risk (and its 95% confidence interval) is based on the assumed risk in the comparison group and the relative effect of the intervention (and its 95% CI). CI: confidence interval; N/A: not applicable | ||||||
| GRADE Working Group grades of evidence High quality: We are very confident that the true effect lies close to that of the estimate of the effect. Moderate quality: We are moderately confident in the effect estimate; the true effect is likely to be close to the estimate of effect, but there is a possibility that it is substantially different. Low quality: Our confidence in the effect estimate is limited; the true effect may be substantially different from the estimate of the effect. Very low quality: We have very little confidence in the effect estimate; the true effect is likely to be substantially different from the estimate of effect. | ||||||
| aDowngraded once for serious study limitations (risk of bias), and once for imprecision. bDowngraded three levels due to too few data and number of events are too small to be meaningful. cNo data available for this outcome, and therefore no GRADE rating has been applied and there is no evidence to support or refute. | ||||||
| Celecoxib compared with naproxen for chronic non‐cancer pain | ||||||
| Patient or population: children and adolescents with chronic non‐cancer pain Settings: 17 paediatric centres worldwide Intervention: celecoxib Comparison: naproxen | ||||||
| Outcomes | Illustrative comparative risks* (95% CI) | Relative effect | No. of participants | Quality of the evidence | Comments | |
| Naproxen | Celecoxib | |||||
| Participant‐reported pain relief of 30% or greater | 56/83 | 119/159 | N/A | 242 participants | ⊕⊕⊝⊝ | |
| Participant‐reported pain relief of 50% or greater | No data | No data | N/A | N/A | ‐ | No evidence to support or refutec |
| Patient Global Impression of Change much or very much improved | No data | No data | N/A | N/A | ‐ | No evidence to support or refutec |
| Any adverse event | No data | No data | N/A | N/A | ‐ | No evidence to support or refutec |
| Serious adverse event | 0/83 | 5/159 | N/A | 242 participants | ⊕⊝⊝⊝ | |
| Withdrawals due to adverse events | 3/83 | 10/159 | N/A | 242 participants | ⊕⊝⊝⊝ | |
| *The basis for the assumed risk (e.g. the median control group risk across studies) is provided in footnotes. The corresponding risk (and its 95% confidence interval) is based on the assumed risk in the comparison group and the relative effect of the intervention (and its 95% CI). | ||||||
| GRADE Working Group grades of evidence High quality: We are very confident that the true effect lies close to that of the estimate of the effect. Moderate quality: We are moderately confident in the effect estimate; the true effect is likely to be close to the estimate of effect, but there is a possibility that it is substantially different. Low quality: Our confidence in the effect estimate is limited; the true effect may be substantially different from the estimate of the effect. Very low quality: We have very little confidence in the effect estimate; the true effect is likely to be substantially different from the estimate of effect. | ||||||
| aDowngraded once for serious study limitations (risk of bias), and once for imprecision. bDowngraded three levels due to too few data and number of events are too small to be meaningful. cNo data available for this outcome, and therefore no GRADE rating has been applied and there is no evidence to support or refute. | ||||||
| Rofecoxib compared with naproxen for chronic non‐cancer pain | ||||||
| Patient or population: children and adolescents with chronic non‐cancer pain Settings: 41 clinical centres in Australia, Europe, Asia, Central America, South America, USA Intervention: rofecoxib Comparison: naproxen | ||||||
| Outcomes | Illustrative comparative risks* (95% CI) | Relative effect | No. of participants | Quality of the evidence | Comments | |
| Naproxen | Rofecoxib | |||||
| Participant‐reported pain relief of 30% or greater | 48/87 | 94/187 | N/A | 274 participants | ⊕⊕⊝⊝ | |
| Participant‐reported pain relief of 50% or greater | No data | No data | N/A | N/A | ‐ | No evidence to support or refutec |
| Patient Global Impression of Change much or very much improved | No data | No data | N/A | N/A | ‐ | No evidence to support or refutec |
| Any adverse event | 28/101 | 43/209 | N/A | 274 participants | ⊕⊝⊝⊝ | |
| Serious adverse event | 0/101 | 0/209 | N/A | 310 participants | ⊕⊝⊝⊝ | |
| Withdrawals due to adverse events | 3/101 | 3/209 | N/A | 310 participants | ⊕⊝⊝⊝ | |
| *The basis for the assumed risk (e.g. the median control group risk across studies) is provided in footnotes. The corresponding risk (and its 95% confidence interval) is based on the assumed risk in the comparison group and the relative effect of the intervention (and its 95% CI). | ||||||
| GRADE Working Group grades of evidence High quality: We are very confident that the true effect lies close to that of the estimate of the effect. Moderate quality: We are moderately confident in the effect estimate; the true effect is likely to be close to the estimate of effect, but there is a possibility that it is substantially different. Low quality: Our confidence in the effect estimate is limited; the true effect may be substantially different from the estimate of the effect. Very low quality: We have very little confidence in the effect estimate; the true effect is likely to be substantially different from the estimate of effect. | ||||||
| aDowngraded once for serious study limitations (risk of bias), and once for imprecision. bDowngraded three levels due to too few data and number of events were too small to be meaningful. cNo data available for this outcome, and therefore no GRADE rating has been applied and there is no evidence to support or refute. | ||||||
| Outcome or subgroup title | No. of studies | No. of participants | Statistical method | Effect size |
| 1 Participant‐reported pain relief of 30% or greater Show forest plot | 1 | Risk Ratio (M‐H, Fixed, 95% CI) | Totals not selected | |
| 1.1 Meloxicam 0.125mg/kg vs naproxen 10mg/kg | 1 | Risk Ratio (M‐H, Fixed, 95% CI) | 0.0 [0.0, 0.0] | |
| 1.2 Meloxicam 0.25mg/kg vs naproxen 10mg/kg | 1 | Risk Ratio (M‐H, Fixed, 95% CI) | 0.0 [0.0, 0.0] | |
| 2 Participant‐reported pain relief of 50% or greater Show forest plot | 1 | Risk Ratio (M‐H, Fixed, 95% CI) | Totals not selected | |
| 2.1 Meloxicam 0.125mg/kg vs naproxen 10mg/kg | 1 | Risk Ratio (M‐H, Fixed, 95% CI) | 0.0 [0.0, 0.0] | |
| 2.2 Meloxicam 0.25mg/kg vs naproxen 10mg/kg | 1 | Risk Ratio (M‐H, Fixed, 95% CI) | 0.0 [0.0, 0.0] | |
| Outcome or subgroup title | No. of studies | No. of participants | Statistical method | Effect size |
| 1 Participant‐reported pain relief of 30% or greater Show forest plot | 1 | Risk Ratio (M‐H, Fixed, 95% CI) | Totals not selected | |
| 1.1 Celecoxib 3mg/kg vs naproxen 7.5mg/kg | 1 | Risk Ratio (M‐H, Fixed, 95% CI) | 0.0 [0.0, 0.0] | |
| 1.2 Celecoxib 6mg/kg vs naproxen 7.5mg/kg | 1 | Risk Ratio (M‐H, Fixed, 95% CI) | 0.0 [0.0, 0.0] | |
| Outcome or subgroup title | No. of studies | No. of participants | Statistical method | Effect size |
| 1 Participant‐reported pain relief of 30% or greater Show forest plot | 1 | Risk Ratio (M‐H, Fixed, 95% CI) | Totals not selected | |
| 1.1 Rofecoxib 0.3 to 12.5mg/kg vs naproxen 15mg/kg | 1 | Risk Ratio (M‐H, Fixed, 95% CI) | 0.0 [0.0, 0.0] | |
| 1.2 Rofecoxib 12.5 to 25mg/kg vs naproxen 15mg/kg | 1 | Risk Ratio (M‐H, Fixed, 95% CI) | 0.0 [0.0, 0.0] | |