Fármacos antiinflamatorios no esteroideos (AINE) para el dolor crónico no relacionado con el cáncer en niños y adolescentes
References
References to studies included in this review
Jump to:
References to studies excluded from this review
Jump to:
Additional references
Jump to:
Characteristics of studies
Characteristics of included studies [ordered by study ID]
Jump to:
| Methods | Allocation: randomised Blinding: double‐blind Controlled: placebo Centre: multicentre Arm: 2 arms, cross‐over design | |
| Participants | Inclusion criteria: children with juvenile chronic arthritis Exclusion criteria: known history of contraindications to study drugs; receiving gold, d‐penicillamine, or corticosteroids; in a state of remission Baseline characteristics N = 30 Age: mean not reported, range 2 to 16 years Gender: male (unstated); female (unstated) Number randomised: intervention (15); control (15) Number completed: intervention (15); control (15) Setting and location: South Africa | |
| Interventions | Intervention group (N = 15): indomethacin (2 weeks), cross‐over ketoprofen (2 weeks) Control group (N = 15): ketoprofen (2 weeks), cross‐over indomethacin (2 weeks) Participants < 20 kg: ketoprofen 25 mg capsule twice daily; participants > 20 kg: ketoprofen capsules x 2 = 50 mg twice daily Participants < 20 kg: indomethacin 25 mg capsule twice daily; participants > 20 kg: indomethacin capsules x 2 = 50 mg twice daily Study duration: 5 weeks | |
| Outcomes | Primary outcomes
Secondary outcomes
| |
| Notes | Sources of funding: Maybaker (SA) (Pty) Ltd provided drug supplies. | |
| Risk of bias | ||
| Bias | Authors' judgement | Support for judgement |
| Random sequence generation (selection bias) | Unclear risk | Comment: Randomised drug administration, not participants |
| Allocation concealment (selection bias) | Unclear risk | Comment: Insufficient information |
| Blinding of participants and personnel (performance bias) | Unclear risk | Comment: Insufficient information |
| Blinding of outcome assessment (detection bias) | Unclear risk | Quote: Insufficient information |
| Incomplete outcome data (attrition bias) | Low risk | Comment: All participants were accounted for. Lost to follow‐up and withdrawals explained. |
| Selective reporting (reporting bias) | Unclear risk | Comment: Means and standard deviations not reported, nor blood sedimentation rate, haemoglobin level, platelet and white cell count. |
| Size | High risk | Comment: Total participants = 30 (< 50 per treatment arm) |
| Other bias | Low risk | Comment: No other potential sources of bias found. |
| Methods | Allocation: randomised Blinding: double‐blind Controlled: active comparator Centre: multicentre Arm: 2 arms, parallel groups | |
| Participants | Inclusion criteria: children with juvenile rheumatoid arthritis Exclusion criteria: unstated Baseline characteristics N = 99 Age: range unstated; mean age 8.5 years Gender: male (23); female (76) Number randomised: fenoprofen (49); aspirin (50) Number completed: fenoprofen (47); aspirin (40) Setting and location: multicentre, location unstated | |
| Interventions | Intervention group (N = 49): aspirin 1500 mg/m2/day increased to 3000 mg/m2/day, maximum 5450 mg/day Control group (N = 50): fenoprofen 900 mg/m2/day increased to 1800 mg/m2/day, maximum 3200 mg/day Study duration: 12 weeks | |
| Outcomes | Primary outcomes
Secondary outcomes
| |
| Notes | Sources of funding: unstated | |
| Risk of bias | ||
| Bias | Authors' judgement | Support for judgement |
| Random sequence generation (selection bias) | Unclear risk | Quote: "99 patients were randomized into the study" Comment: No information regarding method of randomisation |
| Allocation concealment (selection bias) | Unclear risk | Quote: Insufficient information |
| Blinding of participants and personnel (performance bias) | Low risk | Quote: "capsules containing either fenoprofen or ASA were white opaque size #2 for the 0.5 to 0.75m2 groups, and white opaque size #1 for the 0.76m2 and over groups. Therefore it was impossible to determine which drug the subjects were receiving by observing capsule size, colour, or administration regimen" |
| Blinding of outcome assessment (detection bias) | Unclear risk | Comment: Insufficient information |
| Incomplete outcome data (attrition bias) | Unclear risk | Comment: All participants were accounted for. Lost to follow‐up and withdrawals explained. However, authors do not report whether there were significant differences between completers and non‐completers. |
| Selective reporting (reporting bias) | Unclear risk | Quote: "all investigators used an identical protocol and case report forms" Comment: No outcomes were not set out in the methods. Unable to locate protocol. |
| Size | High risk | Comment: Total participants = 99 (< 50 per treatment arm) |
| Other bias | Low risk | Comment: No other potential sources of bias found. |
| Methods | Allocation: randomised Blinding: double‐blind Controlled: active comparator Centre: multicentre Arm: 2 arms, parallel groups | |
| Participants | Inclusion criteria: children ≥ 9 kg, with pauciarticular of polyarticular course JRA, with or without systemic onset, according to ACR criteria; > 1 swollen joint with limited motion; parent global assessment ≥ 10 mm (100‐millimetre VAS) Exclusion criteria: active systemic manifestations; oral corticosteroid doses ≤ 0.2 mg/kg/day or 10 mg prednisone or methotrexate < 1 mg/kg/week Baseline characteristics N = 242 Age: 2 to 16 years Gender: male (71); female (171) Number randomised: intervention A (77); intervention B (82); control (83) Number completed: intervention A (67); intervention B (71); control (74) Setting and location: 17 centres worldwide | |
| Interventions | Intervention group (N = 77): celecoxib 50 mg/5 mL oral suspension (target dose approximately 3 mg/kg twice daily) Intervention group (N = 82): celecoxib 100 mg/5 mL oral suspension (target dose approximately 6 mg/kg twice daily) Control group (N = 83): naproxen 125 mg/5 mL oral suspension (target dose approximately 7.5 mg/kg twice daily) Study duration: 12 weeks | |
| Outcomes | Primary outcomes
Secondary outcomes
| |
| Notes | Sources of funding: editorial support funded by Pfizer | |
| Risk of bias | ||
| Bias | Authors' judgement | Support for judgement |
| Random sequence generation (selection bias) | Unclear risk | Quote: "children were randomly assigned to 1 of 3 treatment groups in a 1:1:1 ratio ... randomized according to the allocation number provided by an interactive voice response system" |
| Allocation concealment (selection bias) | Unclear risk | Comment: Insufficient information |
| Blinding of participants and personnel (performance bias) | Unclear risk | Comment: Insufficient information |
| Blinding of outcome assessment (detection bias) | Unclear risk | Comment: Insufficient information |
| Incomplete outcome data (attrition bias) | Unclear risk | Comment: All participants were accounted for. Lost to follow‐up and withdrawals explained. However, authors do not report whether there were significant differences between completers and non‐completers. |
| Selective reporting (reporting bias) | High risk | Comment: Secondary outcome data not reported (e.g. Pediatric Quality of Life Inventory) |
| Size | Unclear risk | Comment: Total participants = 242 (between 50 and 200 per treatment arm) |
| Other bias | Low risk | Comment: No other potential sources of bias found. |
| Methods | ||
| Participants | ||
| Interventions | Intervention group (N = 45): ibuprofen suspension (concentration 100 mg/5 mL) + placebo aspirin Control group (N = 47): aspirin 200 mg tablet (participant weight 10 to 30 kg) or 300 mg capsules (participant weight > 30 kg) + placebo ibuprofen Week 2: physician's option to increase dose to 40 mg/kg/day ibuprofen or 80 mg/kg/day aspirin, provided no significant side effects Study duration: 12 weeks | |
| Outcomes | ||
| Notes | ||
| Risk of bias | ||
| Bias | Authors' judgement | Support for judgement |
| Random sequence generation (selection bias) | Unclear risk | Quote: "patients were randomly assigned, in random blocks of four within each centre, to receive ibuprofen or aspirin" |
| Allocation concealment (selection bias) | Unclear risk | Quote: "patients were assigned numbers sequentially, on the basis of body weight, from blocks of numbers allotted to each site" Quote: "Before initiation of this trial, each centre was given a list of consecutive numbers from Boots Pharamceuticals. Patients were assigned numbers in the sequence in which they entered the study" Quote: "Patients received one of the two active medications plus a dummy of the alternative agent" |
| Blinding of participants and personnel (performance bias) | High risk | Quote: "Patients received one of the two active medications plus a dummy of the alternative agent" Comment: The study personnel would have known what they were giving the participants (as one was a liquid and the other was a tablet). |
| Blinding of outcome assessment (detection bias) | Unclear risk | Comment: Insufficient information |
| Incomplete outcome data (attrition bias) | Unclear risk | Comment: All participants were accounted for. Lost to follow‐up and withdrawals explained. However, authors do not report whether there were significant differences between completers and non‐completers. |
| Selective reporting (reporting bias) | Low risk | Comment: All planned outcomes from the methods were reported in the results. |
| Size | High risk | Comment: Total participants = 92 (< 50 per treatment arm) |
| Other bias | Low risk | Comment: No other potential sources of bias found. |
| Methods | Allocation: randomised Blinding: double‐blind Controlled: active comparator Centre: single Arm: 2 arms, cross‐over design; 4 weeks, followed by cross‐over and a further 4 weeks | |
| Participants | Inclusion criteria: children suffering from seronegative juvenile polyarthritis; disease sufficiently active to be considered in need of an anti‐inflammatory analgesic agent Exclusion criteria: unstated Baseline characteristics N = 23 Age: 5 to 16 years; median 11 to 12 years Gender: male (unstated); female (unstated) Number randomised: intervention (23); control (23) Number completed: intervention (22); control (20) Setting and location: unstated | |
| Interventions | Intervention group (N = 23): naproxen 10 mg/kg/24 hrs given as a suspension in 2 divided doses Control group (N = 23): aspirin soluble 80 mg/kg/day, divided into 4 doses Study duration: 2 x 4 weeks | |
| Outcomes | Primary outcomes
Secondary outcomes
| |
| Notes | Sources of funding: unstated | |
| Risk of bias | ||
| Bias | Authors' judgement | Support for judgement |
| Random sequence generation (selection bias) | Unclear risk | Quote: "random allocation for either ... drug" |
| Allocation concealment (selection bias) | Unclear risk | Comment: Insufficient information |
| Blinding of participants and personnel (performance bias) | Unclear risk | Quote: "placebo suspension and tablets were given to make the study double‐blind" |
| Blinding of outcome assessment (detection bias) | Unclear risk | Quote: "placebo suspension and tablets were given to make the study double‐blind" |
| Incomplete outcome data (attrition bias) | Low risk | Comment: All participants were accounted for. Lost to follow‐up and withdrawals explained. |
| Selective reporting (reporting bias) | Low risk | Comment: All planned outcomes from the methods were reported in the results. |
| Size | High risk | Comment: Total participants = 23 (< 50 per treatment arm) |
| Other bias | Low risk | Comment: No other potential sources of bias found. |
| Methods | Allocation: randomised Blinding: double‐blind, double‐dummy Controlled: active comparator Centre: multicentre Arm: 2 arms, parallel groups | |
| Participants | Inclusion criteria: children with pauci‐ (oligo) or polyarticular course JRA for ≥ 3 months meeting the ACR criteria for juvenile rheumatoid arthritis. Must have patient assessment of overall well‐being (0‐to‐100 VAS) of > 90 with at least 1 swollen joint. Exclusion criteria: active systemic JRA symptoms within 3 months of randomisation or if they were not within the 5th to 95th percentile of weight for height; hypersensitivity to aspirin and/or an NSAID; unstable antirheumatic medication regimens; requiring alkylating agents, anticonvulsants, warfarin, or rifampicin; female patients who had reached menarche were required to be in a non‐gravid state as determined by measurement of serum beta‐human chorionic gonadotropin. Baseline characteristics N = 310 Age: 2 to 17 years; mean 9.9 years Gender: male (83); female (227) Number randomised: intervention A (109); intervention B (100); control (101) Number completed: intervention A (99); intervention B (95); control (91) Setting and location: 41 clinical centres in Australia, Europe, Asia, Central America, South America, USA | |
| Interventions | Intervention group (N = 209): (children) low‐dose rofecoxib 0.3 mg/kg/day maximum 12.5 mg/day, or high‐dose rofecoxib 0.6 mg/kg/day maximum 25 mg/day; (adolescents) rofecoxib 12.5 or 25 mg daily Control group (N = 101): (children) naproxen 15 mg/kg/day 5 mg oral suspension; (adolescents) 15 mg/kg/day maximum 1000 mg/day Study duration: 12 weeks (+ 52‐week open‐label extension) | |
| Outcomes | Primary outcomes
Secondary outcomes
| |
| Notes | Sources of funding: unstated | |
| Risk of bias | ||
| Bias | Authors' judgement | Support for judgement |
| Random sequence generation (selection bias) | Low risk | Quote: "randomisation to treatment groups in equal proportions was performed using a computer‐generated allocation schedule. Treatment assignment was stratified based on joint involvement (pauci‐ or polyarticular course) and age group (2‐11 years or 12‐17 years)." |
| Allocation concealment (selection bias) | Low risk | Quote: "randomisation to treatment groups in equal proportions was performed using a computer‐generated allocation schedule. Treatment assignment was stratified based on joint involvement (pauci‐ or polyarticular course) and age group (2‐11 years or 12‐17 years)." |
| Blinding of participants and personnel (performance bias) | Low risk | Quote: "to maintain blinding to treatment assignment during the base study, each patient received 2 coded test products ‐ active or identical‐appearing placebo" |
| Blinding of outcome assessment (detection bias) | Unclear risk | Comment: Insufficient information |
| Incomplete outcome data (attrition bias) | Low risk | Comment: All participants were accounted for. Lost to follow‐up and withdrawals explained. |
| Selective reporting (reporting bias) | Low risk | Comment: All planned outcomes from the methods section were reported in the results. |
| Size | Unclear risk | Comment: Total participants = 310 (between 50 and 200 per treatment arm) |
| Other bias | Low risk | Comment: No other potential sources of bias found. |
| Methods | Allocation: randomised Blinding: double‐blind, double‐dummy Controlled: active comparator Centre: multicentre Arm: 3 arms, parallel groups | |
| Participants | Inclusion criteria: diagnosis of JIA (Durban criteria); NSAID therapy is required; have at least 2 joints with active arthritis plus abnormal results in at least 2 of any of the 5 remaining JIA core set criteria Exclusion criteria: current systemic manifestations; abnormal laboratory results unrelated to JIA; pregnancy, breastfeeding; bleeding disorders; peptic ulcer in past 6 months; hypersensitivity to NSAIDs; other rheumatic conditions; other medications related to rheumatic conditions; taking other NSAIDs Baseline characteristics N = 225 Age: 2 to 16 years Gender: male (148); female (67) Number randomised: meloxicam low (73); meloxicam high (74); naproxen (78) Number completed: meloxicam low (58); meloxicam high (63); naproxen (61) Setting and location: 34 paediatric rheumatology tertiary care units in Austria, Belgium, France, Germany, Italy, Russia, and the UK | |
| Interventions | Intervention group 1 (N = 73): meloxicam 0.125 mg/kg, 1 dose per day Intervention group 2 (N = 74): meloxicam 0.25 mg/kg, 1 dose per day Control group (N = 78): naproxen 5 mg/kg, twice per day Placebo 'naproxen' tablets for the meloxicam groups and placebo 'meloxicam' tablets for the naproxen group Study duration: 48 weeks | |
| Outcomes | Primary outcomes
Secondary outcomes
| |
| Notes | Sources of funding: grant from Boehringer Ingelheim Pharma GmbH & Co. KG, Biberach, Germany, to the Paediatric Rheumatology International Trials Organisation | |
| Risk of bias | ||
| Bias | Authors' judgement | Support for judgement |
| Random sequence generation (selection bias) | Unclear risk | Quote: "patients were allocated to 1 of the 3 treatment groups in a 1:1:1 randomization scheme" Comment: Randomisation method not described. |
| Allocation concealment (selection bias) | Unclear risk | Comment: No description of allocation concealment |
| Blinding of participants and personnel (performance bias) | Low risk | Quote: "to keep the trial blinded, children in the meloxicam group also received naproxen placebo suspension and vice versa, in a double‐dummy design" |
| Blinding of outcome assessment (detection bias) | Unclear risk | Comment: Insufficient information |
| Incomplete outcome data (attrition bias) | Low risk | Comment: All participants were accounted for. Loss to follow‐up and withdrawals explained. However, authors do not report whether there were significant differences between completers and non‐completers. |
| Selective reporting (reporting bias) | Low risk | Comment: All planned outcomes from the methods were reported in the results. |
| Size | Unclear risk | Comment: Total participants = 225 (between 50 and 200 per treatment arm) |
| Other bias | Low risk | Comment: No other potential sources of bias found. |
ACR: American College of Rheumatology; CHAQ: Child Health Assessment Questionnaire; ESR: erythrocyte sedimentation rate;JIA: juvenile idiopathic arthritis; JRA: juvenile rheumatoid arthritis; VAS: visual analogue scale.
Characteristics of excluded studies [ordered by study ID]
Jump to:
| Study | Reason for exclusion |
| Population: adults | |
| Allocation: not a randomised controlled trial | |
| Population: adults | |
| Population: adults | |
| Population: adults | |
| Allocation: not a randomised controlled trial | |
| Population: adults |
Data and analyses
| Outcome or subgroup title | No. of studies | No. of participants | Statistical method | Effect size |
| 1 Participant‐reported pain relief of 30% or greater Show forest plot | 1 | Risk Ratio (M‐H, Fixed, 95% CI) | Totals not selected | |
| Analysis 1.1  Comparison 1 Meloxicam versus naproxen, Outcome 1 Participant‐reported pain relief of 30% or greater. | ||||
| 1.1 Meloxicam 0.125mg/kg vs naproxen 10mg/kg | 1 | Risk Ratio (M‐H, Fixed, 95% CI) | 0.0 [0.0, 0.0] | |
| 1.2 Meloxicam 0.25mg/kg vs naproxen 10mg/kg | 1 | Risk Ratio (M‐H, Fixed, 95% CI) | 0.0 [0.0, 0.0] | |
| 2 Participant‐reported pain relief of 50% or greater Show forest plot | 1 | Risk Ratio (M‐H, Fixed, 95% CI) | Totals not selected | |
| Analysis 1.2  Comparison 1 Meloxicam versus naproxen, Outcome 2 Participant‐reported pain relief of 50% or greater. | ||||
| 2.1 Meloxicam 0.125mg/kg vs naproxen 10mg/kg | 1 | Risk Ratio (M‐H, Fixed, 95% CI) | 0.0 [0.0, 0.0] | |
| 2.2 Meloxicam 0.25mg/kg vs naproxen 10mg/kg | 1 | Risk Ratio (M‐H, Fixed, 95% CI) | 0.0 [0.0, 0.0] | |
| Outcome or subgroup title | No. of studies | No. of participants | Statistical method | Effect size |
| 1 Participant‐reported pain relief of 30% or greater Show forest plot | 1 | Risk Ratio (M‐H, Fixed, 95% CI) | Totals not selected | |
| Analysis 2.1  Comparison 2 Celecoxib versus naproxen, Outcome 1 Participant‐reported pain relief of 30% or greater. | ||||
| 1.1 Celecoxib 3mg/kg vs naproxen 7.5mg/kg | 1 | Risk Ratio (M‐H, Fixed, 95% CI) | 0.0 [0.0, 0.0] | |
| 1.2 Celecoxib 6mg/kg vs naproxen 7.5mg/kg | 1 | Risk Ratio (M‐H, Fixed, 95% CI) | 0.0 [0.0, 0.0] | |
| Outcome or subgroup title | No. of studies | No. of participants | Statistical method | Effect size |
| 1 Participant‐reported pain relief of 30% or greater Show forest plot | 1 | Risk Ratio (M‐H, Fixed, 95% CI) | Totals not selected | |
| Analysis 3.1  Comparison 3 Rofecoxib versus naproxen, Outcome 1 Participant‐reported pain relief of 30% or greater. | ||||
| 1.1 Rofecoxib 0.3 to 12.5mg/kg vs naproxen 15mg/kg | 1 | Risk Ratio (M‐H, Fixed, 95% CI) | 0.0 [0.0, 0.0] | |
| 1.2 Rofecoxib 12.5 to 25mg/kg vs naproxen 15mg/kg | 1 | Risk Ratio (M‐H, Fixed, 95% CI) | 0.0 [0.0, 0.0] | |

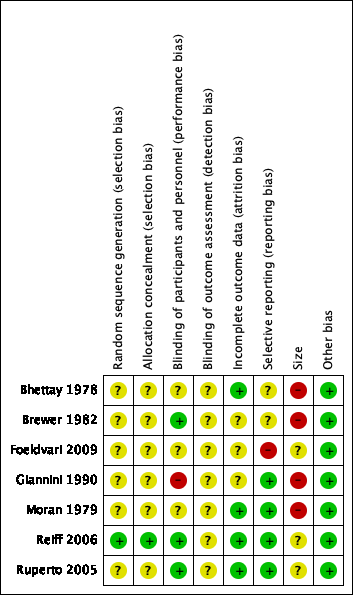
Risk of bias summary: review authors' judgements about each risk of bias item for each included study.

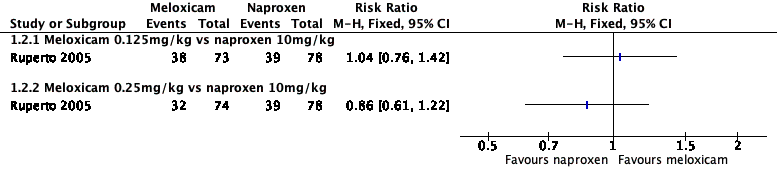
Forest plot of comparison: 1 Meloxicam versus naproxen, outcome: 1.1 Participant‐reported pain relief of 30% or greater.
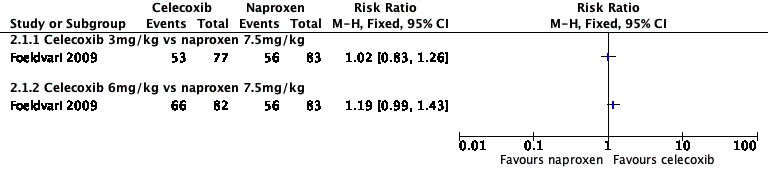
Forest plot of comparison: 2 Celecoxib versus naproxen, outcome: 2.1 Participant‐reported pain relief of 30% or greater.

Forest plot of comparison: 3 Rofecoxib versus naproxen, outcome: 3.1 Participant‐reported pain relief of 30% or greater.
Forest plot of comparison: 1 Meloxicam versus naproxen, outcome: 1.2 Participant‐reported pain relief of 50% or greater.
Comparison 1 Meloxicam versus naproxen, Outcome 1 Participant‐reported pain relief of 30% or greater.
Comparison 1 Meloxicam versus naproxen, Outcome 2 Participant‐reported pain relief of 50% or greater.
Comparison 2 Celecoxib versus naproxen, Outcome 1 Participant‐reported pain relief of 30% or greater.
Comparison 3 Rofecoxib versus naproxen, Outcome 1 Participant‐reported pain relief of 30% or greater.
| Meloxicam compared with naproxen for chronic non‐cancer pain | ||||||
| Patient or population: children and adolescents with chronic non‐cancer pain Settings: multicentre paediatric rheumatology tertiary care units (international) Intervention: meloxicam Comparison: naproxen | ||||||
| Outcomes | Illustrative comparative risks* (95% CI) | Relative effect | No. of participants | Quality of the evidence | Comments | |
| Naproxen | Meloxicam | |||||
| Participant‐reported pain relief of 30% or greater | 50/78 | 89/147 | N/A | 225 participants (1 study) | ⊕⊕⊝⊝ | |
| Participant‐reported pain relief of 50% or greater | 39/78 | 70/147 | N/A | 225 participants (1 study) | ⊕⊕⊝⊝ | |
| Patient Global Impression of Change much or very much improved | No data | No data | N/A | N/A | No evidence to support or refutec | |
| Any adverse event | 10/78 | 18/147 | N/A | 225 participants (1 study) | ⊕⊝⊝⊝ | |
| Serious adverse event | 10/78 | 11/147 | N/A | 225 participants (1 study) | ⊕⊝⊝⊝ | |
| Withdrawals due to adverse events | 10/78 | 10/147 | N/A | 225 participants (1 study) | ⊕⊝⊝⊝ | |
| *The basis for the assumed risk (e.g. the median control group risk across studies) is provided in footnotes. The corresponding risk (and its 95% confidence interval) is based on the assumed risk in the comparison group and the relative effect of the intervention (and its 95% CI). CI: confidence interval; N/A: not applicable | ||||||
| GRADE Working Group grades of evidence High quality: We are very confident that the true effect lies close to that of the estimate of the effect. Moderate quality: We are moderately confident in the effect estimate; the true effect is likely to be close to the estimate of effect, but there is a possibility that it is substantially different. Low quality: Our confidence in the effect estimate is limited; the true effect may be substantially different from the estimate of the effect. Very low quality: We have very little confidence in the effect estimate; the true effect is likely to be substantially different from the estimate of effect. | ||||||
| aDowngraded once for serious study limitations (risk of bias), and once for imprecision. bDowngraded three levels due to too few data and number of events are too small to be meaningful. cNo data available for this outcome, and therefore no GRADE rating has been applied and there is no evidence to support or refute. | ||||||
| Celecoxib compared with naproxen for chronic non‐cancer pain | ||||||
| Patient or population: children and adolescents with chronic non‐cancer pain Settings: 17 paediatric centres worldwide Intervention: celecoxib Comparison: naproxen | ||||||
| Outcomes | Illustrative comparative risks* (95% CI) | Relative effect | No. of participants | Quality of the evidence | Comments | |
| Naproxen | Celecoxib | |||||
| Participant‐reported pain relief of 30% or greater | 56/83 | 119/159 | N/A | 242 participants | ⊕⊕⊝⊝ | |
| Participant‐reported pain relief of 50% or greater | No data | No data | N/A | N/A | ‐ | No evidence to support or refutec |
| Patient Global Impression of Change much or very much improved | No data | No data | N/A | N/A | ‐ | No evidence to support or refutec |
| Any adverse event | No data | No data | N/A | N/A | ‐ | No evidence to support or refutec |
| Serious adverse event | 0/83 | 5/159 | N/A | 242 participants | ⊕⊝⊝⊝ | |
| Withdrawals due to adverse events | 3/83 | 10/159 | N/A | 242 participants | ⊕⊝⊝⊝ | |
| *The basis for the assumed risk (e.g. the median control group risk across studies) is provided in footnotes. The corresponding risk (and its 95% confidence interval) is based on the assumed risk in the comparison group and the relative effect of the intervention (and its 95% CI). | ||||||
| GRADE Working Group grades of evidence High quality: We are very confident that the true effect lies close to that of the estimate of the effect. Moderate quality: We are moderately confident in the effect estimate; the true effect is likely to be close to the estimate of effect, but there is a possibility that it is substantially different. Low quality: Our confidence in the effect estimate is limited; the true effect may be substantially different from the estimate of the effect. Very low quality: We have very little confidence in the effect estimate; the true effect is likely to be substantially different from the estimate of effect. | ||||||
| aDowngraded once for serious study limitations (risk of bias), and once for imprecision. bDowngraded three levels due to too few data and number of events are too small to be meaningful. cNo data available for this outcome, and therefore no GRADE rating has been applied and there is no evidence to support or refute. | ||||||
| Rofecoxib compared with naproxen for chronic non‐cancer pain | ||||||
| Patient or population: children and adolescents with chronic non‐cancer pain Settings: 41 clinical centres in Australia, Europe, Asia, Central America, South America, USA Intervention: rofecoxib Comparison: naproxen | ||||||
| Outcomes | Illustrative comparative risks* (95% CI) | Relative effect | No. of participants | Quality of the evidence | Comments | |
| Naproxen | Rofecoxib | |||||
| Participant‐reported pain relief of 30% or greater | 48/87 | 94/187 | N/A | 274 participants | ⊕⊕⊝⊝ | |
| Participant‐reported pain relief of 50% or greater | No data | No data | N/A | N/A | ‐ | No evidence to support or refutec |
| Patient Global Impression of Change much or very much improved | No data | No data | N/A | N/A | ‐ | No evidence to support or refutec |
| Any adverse event | 28/101 | 43/209 | N/A | 274 participants | ⊕⊝⊝⊝ | |
| Serious adverse event | 0/101 | 0/209 | N/A | 310 participants | ⊕⊝⊝⊝ | |
| Withdrawals due to adverse events | 3/101 | 3/209 | N/A | 310 participants | ⊕⊝⊝⊝ | |
| *The basis for the assumed risk (e.g. the median control group risk across studies) is provided in footnotes. The corresponding risk (and its 95% confidence interval) is based on the assumed risk in the comparison group and the relative effect of the intervention (and its 95% CI). | ||||||
| GRADE Working Group grades of evidence High quality: We are very confident that the true effect lies close to that of the estimate of the effect. Moderate quality: We are moderately confident in the effect estimate; the true effect is likely to be close to the estimate of effect, but there is a possibility that it is substantially different. Low quality: Our confidence in the effect estimate is limited; the true effect may be substantially different from the estimate of the effect. Very low quality: We have very little confidence in the effect estimate; the true effect is likely to be substantially different from the estimate of effect. | ||||||
| aDowngraded once for serious study limitations (risk of bias), and once for imprecision. bDowngraded three levels due to too few data and number of events were too small to be meaningful. cNo data available for this outcome, and therefore no GRADE rating has been applied and there is no evidence to support or refute. | ||||||
| Outcome or subgroup title | No. of studies | No. of participants | Statistical method | Effect size |
| 1 Participant‐reported pain relief of 30% or greater Show forest plot | 1 | Risk Ratio (M‐H, Fixed, 95% CI) | Totals not selected | |
| 1.1 Meloxicam 0.125mg/kg vs naproxen 10mg/kg | 1 | Risk Ratio (M‐H, Fixed, 95% CI) | 0.0 [0.0, 0.0] | |
| 1.2 Meloxicam 0.25mg/kg vs naproxen 10mg/kg | 1 | Risk Ratio (M‐H, Fixed, 95% CI) | 0.0 [0.0, 0.0] | |
| 2 Participant‐reported pain relief of 50% or greater Show forest plot | 1 | Risk Ratio (M‐H, Fixed, 95% CI) | Totals not selected | |
| 2.1 Meloxicam 0.125mg/kg vs naproxen 10mg/kg | 1 | Risk Ratio (M‐H, Fixed, 95% CI) | 0.0 [0.0, 0.0] | |
| 2.2 Meloxicam 0.25mg/kg vs naproxen 10mg/kg | 1 | Risk Ratio (M‐H, Fixed, 95% CI) | 0.0 [0.0, 0.0] | |
| Outcome or subgroup title | No. of studies | No. of participants | Statistical method | Effect size |
| 1 Participant‐reported pain relief of 30% or greater Show forest plot | 1 | Risk Ratio (M‐H, Fixed, 95% CI) | Totals not selected | |
| 1.1 Celecoxib 3mg/kg vs naproxen 7.5mg/kg | 1 | Risk Ratio (M‐H, Fixed, 95% CI) | 0.0 [0.0, 0.0] | |
| 1.2 Celecoxib 6mg/kg vs naproxen 7.5mg/kg | 1 | Risk Ratio (M‐H, Fixed, 95% CI) | 0.0 [0.0, 0.0] | |
| Outcome or subgroup title | No. of studies | No. of participants | Statistical method | Effect size |
| 1 Participant‐reported pain relief of 30% or greater Show forest plot | 1 | Risk Ratio (M‐H, Fixed, 95% CI) | Totals not selected | |
| 1.1 Rofecoxib 0.3 to 12.5mg/kg vs naproxen 15mg/kg | 1 | Risk Ratio (M‐H, Fixed, 95% CI) | 0.0 [0.0, 0.0] | |
| 1.2 Rofecoxib 12.5 to 25mg/kg vs naproxen 15mg/kg | 1 | Risk Ratio (M‐H, Fixed, 95% CI) | 0.0 [0.0, 0.0] | |