Intervenciones de eSalud para la ansiedad y la depresión en niños y adolescentes con enfermedades físicas crónicas
Resumen
Antecedentes
Las enfermedades físicas crónicas afectan de un 10% a un 12% de niños y adolescentes en todo el mundo; estos individuos están en mayor riesgo de desarrollo de problemas psicológicos, en particular ansiedad y depresión. El acceso al tratamiento en persona para dichos problemas a menudo es limitado, y por lo general, las intervenciones disponibles no se han examinado con esta población. A medida que mejora la tecnología, las intervenciones de eSalud (administradas vía medios digitales, como ordenadores y teléfonos inteligentes y que varían desde programas sencillos basados en texto hasta programas multimedia e interactivos, juegos serios, realidad virtual y programas de biorretroalimentación) ofrecen una solución potencial para considerar las necesidades psicológicas de este grupo de jóvenes.
Objetivos
Evaluar la efectividad de las intervenciones de eSalud en comparación con placebo de atención, placebo psicológico, tratamiento habitual, controles en lista de espera, o tratamientos no psicológicos para tratar la ansiedad y la depresión en niños y adolescentes con enfermedades físicas crónicas.
Métodos de búsqueda
Se hicieron búsquedas en el registro de ensayos controlados del Grupo Cochrane de Trastornos Mentales Comunes (Cochrane Common Mental Disorders Group's Controlled Trials Register) (CCMDTR hasta mayo 2016), Registro Cochrane Central de Ensayos Controlados (Cochrane Central Register of Controlled Trials) (CENTRAL) (Issue 8, 2017), Web of Science (1900 ‐ 18 agosto 2016, actualizado 31 agosto 2017) y en Ovid MEDLINE, Embase, PsycINFO (búsqueda cruzada de 2016 al 18 de agosto de 2017). Se realizaron búsquedas manuales en las actas de congresos relevantes, listas de referencias de los artículos incluidos y en la literatura gris hasta mayo de 2016. También se buscaron registros internacionales de ensayos para identificar ensayos no publicados o en curso.
Criterios de selección
Se incluyeron ensayos controlados aleatorios (ECA), ensayos con asignación al azar grupal, y ensayos cruzados (cross‐over) de las intervenciones de eSalud para el tratamiento de cualquier tipo de trastorno físico crónico en niños y adolescentes (de 0 a 18 años de edad), y que medían los cambios en los síntomas o los diagnósticos de la ansiedad, la depresión o la depresión subumbral. Se definieron las enfermedades físicas crónicas como las que presentaban una duración de más de tres meses. Se evaluaron los síntomas de la ansiedad y la depresión mediante escalas de calificación validadas administradas por el paciente o el médico basadas en los criterios del DSM III, IV o 5 (American Psychological Association 2013), o ICD 9 o 10 (Organización Mundial de la Salud 1992). Los trastornos formales de depresión y ansiedad se diagnosticaron mediante entrevistas clínicas estructuradas. El placebo de atención, el tratamiento habitual, la lista de espera, el placebo psicológico y otros tratamientos no psicológicos fueron comparadores elegibles.
Obtención y análisis de los datos
Dos autores de la revisión revisaron de forma independiente títulos, resúmenes y artículos de texto completo; las discrepancias se resolvieron mediante discusión o se abordaron con un tercer autor. Cuando estuvo disponible, se utilizó el odds ratio (OR) para comparar los datos dicotómicos y las diferencias de medias estandarizadas (DME) para analizar los datos continuos, ambos con intervalos de confianza (IC) del 95%. Se realizaron metanálisis cuando los tratamientos, los participantes, y la pregunta clínica fundamental eran adecuadamente similares. En caso contrario, se realizó un análisis narrativo.
Resultados principales
Se incluyeron cinco ensayos de tres intervenciones (Breathe Easier Online, Web‐MAP, y terapia cognitivo‐conductual [TCC] multimodal), que incluían a 463 participantes de 10 a 18 años de edad. Cada ensayo contribuyó al menos con un metanálisis. Los ensayos incluyeron a niños y adolescentes con enfermedades físicas crónicas, como cefalea crónica (migraña, cefalea tensional y otros), trastornos de dolor crónico (abdominal, musculoesquelético y otros), enfermedades respiratorias crónicas (asma, fibrosis quística y otras) y síntomas de ansiedad o depresión. Los participantes se seleccionaron de contextos comunitarios y hospitalarios de países de ingresos altos.
Para el resultado primario del cambio en los síntomas de depresión versus cualquier control, hubo evidencia de muy baja calidad que significó que no pudo determinarse si las intervenciones de eSalud fueron claramente mejores que cualquier comparador (DME ‐0,06; IC del 95%: ‐0,35 a 0,23; cinco ECA, 441 participantes). Para el resultado primario del cambio en los síntomas de ansiedad versus cualquier comparador, hubo evidencia de muy baja calidad que significa que no fue posible determinar si las intervenciones de eSalud fueron claramente mejores que cualquier comparador (DME ‐0,07; IC del 95%: ‐0,29 a 0,14; dos ECA, 324 participantes). Para el resultado primario de la aceptabilidad del tratamiento, hubo evidencia de muy baja calidad de que las intervenciones de eSalud fueron menos aceptables que cualquier comparador (DME 0,46; IC del 95%: 0,23 a 0,69; dos ECA, 304 participantes).
Para el resultado secundario de la calidad de vida, hubo evidencia de muy baja calidad que significó que no fue posible determinar si las intervenciones de eSalud fueron claramente mejores que cualquier comparador (DME ‐0,83; IC del 95%: ‐1,53 a ‐0,12; un ECA, 34 participantes). Para el resultado secundario del funcionamiento, hubo evidencia de muy baja calidad que significa que no fue posible determinar si las intervenciones de eSalud fueron claramente mejores que cualquier comparador (DME ‐0,08; IC del 95%: ‐0,33 a 0,18; tres ECA, 368 participantes). Para el resultado secundario del estado de la enfermedad física crónica, hubo evidencia de muy baja calidad que significa que no fue posible determinar si las intervenciones de eSalud fueron claramente mejores que cualquier comparador (DME 0,06; IC del 95%: ‐0,12 a 0,24; cinco ECA, 463 participantes).
El riesgo de selección se consideró bajo en la mayoría de los ensayos. Sin embargo, el riesgo de sesgo debido al cegamiento inadecuado de los participantes o los evaluadores de resultado se consideró poco claro o alto en todos los ensayos. Sólo un estudio tenía un protocolo publicado; dos ensayos tuvieron datos de resultado incompletos. Todos los ensayos fueron realizados por los desarrolladores de la intervención, lo cual introdujo otro sesgo posible. Ningún autor informó efectos adversos.
Conclusiones de los autores
Actualmente, el área de las intervenciones de eSalud para el tratamiento de la ansiedad o la depresión en niños y adolescentes con enfermedades físicas crónicas está limitada a cinco ensayos de baja calidad. La evidencia de muy baja calidad significa que los efectos de las intervenciones de eSalud son inciertos en este momento, en especial en los niños de menos de 10 años de edad.
Aunque es demasiado temprano para recomendar las intervenciones de eSalud para esta población clínica, debido al número creciente, y a la mejoría global en el acceso a la tecnología, parece haber espacio para el desarrollo y la evaluación de tratamientos aceptables y efectivos basados en tecnologías adaptadas a niños y adolescentes con enfermedades físicas crónicas.
PICO
Resumen en términos sencillos
Intervenciones de eSalud para la ansiedad y la depresión en niños y adolescentes con enfermedades físicas crónicas
¿Por qué es importante esta revisión?
Más de uno de cada diez niños y adolescentes a nivel global presenta enfermedades físicas crónicas, como asma, diabetes, y cáncer. Presentan una mayor probabilidad de desarrollar problemas psicológicos, que incluyen ansiedad o depresión. El tratamiento de dichos problemas de forma temprana puede prevenir las dificultades con las amistades, la vida familiar, la escuela y los futuros problemas de salud mental. El acceso a la terapia tradicionalmente administrada cara a cara puede ser difícil, debido al número limitado de servicios. Debido a que la tecnología mejora, y los tratamientos comienzan a estar disponibles para el ordenador y los teléfonos móviles, las intervenciones de eSalud (administradas por medios digitales y que varían de programas sencillos basados en texto hasta programas multimedia e interactivos, juegos serios, realidad virtual y programas de biorretroalimentación) pueden ser útiles para tratar la ansiedad y la depresión en niños y adolescentes.
¿A quién le interesará esta revisión?
Esta revisión será de interés para los padres, los niños y los adolescentes, los profesionales de la salud mental, las comisiones de servicios, y los profesionales que cuidan a los niños con enfermedades físicas crónicas.
¿Qué preguntas pretende contestar esta revisión?
Esta revisión pretende dar respuesta a las siguientes preguntas: 1) ¿Las intervenciones de eSalud son mejores que un rango seleccionado de otros tratamientos o la lista de espera para la reducción de los síntomas de ansiedad y depresión en niños y adolescentes con enfermedades físicas crónicas? y 2) ¿Las intervenciones de eSalud son aceptables para estos niños y adolescentes?
¿Qué estudios se incluyeron en la revisión?
Se efectuaron búsquedas en las bases de datos de referencia para encontrar todos los ensayos controlados aleatorios, los ensayos con asignación al azar grupal y los ensayos cruzados (cross‐over) de las intervenciones de eSalud para el tratamiento de la ansiedad o la depresión en niños y adolescentes con enfermedades físicas crónicas publicados entre 1970 y agosto de 2017. Los ensayos tenían que ser ensayos controlados aleatorios que incluían a niños y jóvenes con síntomas o diagnósticos formales de ansiedad o depresión. Se incluyeron cinco ensayos con un total de 463 pacientes jóvenes en la revisión.
¿Qué dice la evidencia de la revisión?
Se incluyeron cinco ensayos de tres intervenciones de eSalud (Breathe Easier Online, Web‐MAP, y terapia cognitivo‐conductual [TCC] multimodal), realizadas con niños de 10 a 18 años de edad. Aunque algunas de estas intervenciones fueron aceptables para los usuarios, ninguna de ellas fue claramente mejor que un rango seleccionado de otras terapias o la lista de espera para reducir los síntomas de ansiedad o depresión. La calidad muy baja de la evidencia significa que en este momento no se conocen los efectos de las intervenciones de eSalud, en especial en niños menores de diez años de edad. Los autores de la revisión calificaron el riesgo general de sesgo en los ensayos como alto o incierto.
¿Qué debería suceder a continuación?
Debe realizarse investigación adicional para desarrollar intervenciones de eSalud más efectivas para tratar la ansiedad y la depresión en niños y adolescentes con enfermedades físicas crónicas.
Authors' conclusions
Summary of findings
| E‐healthinterventions versus any comparator for anxiety and depression in children and adolescents with long‐term physical conditions | ||||||
| Patient or population: children and adolescents, aged 10 to 18 years, with long‐term physical conditions | ||||||
| Outcomes | Anticipated absolute effects* (95% CI) | Relative effect | № of participants | Quality of the evidence | Comments | |
| Risk with any comparator | Risk with e‐health interventions | |||||
| Depression (postintervention) | The mean self‐reported depression score in the intervention group was 0.06 standard mean deviations lower (0.35 lower to 0.23 higher) | ‐ | 441 | ⊕⊝⊝⊝ | A standard mean deviation of ‐0.06 represents a small difference between groups | |
| Anxiety (postintervention) | The mean self‐reported anxiety score in the intervention group was 0.07 standard mean deviations lower (0.29 lower to 0.14 higher) | ‐ | 324 | ⊕⊝⊝⊝ | A standard mean deviation of ‐0.07 represents a small difference between groups | |
| Treatment acceptability (postintervention) | The mean self‐reported treatment acceptability score in the intervention group was 0.46 standard mean deviations higher (0.23 higher to 0.69 higher) | ‐ | 304 | ⊕⊝⊝⊝ | A standard mean deviation of 0.46 represents a small difference between groups | |
| Quality of life (postintervention) | The mean self‐reported quality of life score in the intervention group was 0.83 standard mean deviations lower | ‐ | 34 | ⊕⊝⊝⊝ | A standard mean deviation of ‐0.83 represents a large difference between groups | |
| Functioning (postintervention) | The mean self‐reported level of functioning in the intervention group was 0.08 standard mean deviations lower | ‐ | 368 | ⊕⊝⊝⊝ | A standard mean deviation of ‐0.08 represents a small difference between groups | |
| Status of long‐term physical condition (postintervention) | The mean self‐reported long‐term physical condition symptom score was 0.06 standard mean deviations higher | ‐ | 463 | ⊕⊕⊝⊝ | A standard mean deviation of 0.06 represents a small difference between groups | |
| *The risk in the intervention group (and its 95% confidence interval) is based on the assumed risk in the comparison group and the relative effect of the intervention (and its 95% CI). | ||||||
| GRADE Working Group grades of evidence | ||||||
| a We downgraded quality due to a lack of clarity about blinding of participants and outcome assessors, incomplete outcome data, and the fact that all studies were conducted by the developers of the e‐health interventions. b We downgraded for inconsistency due to studies having moderate heterogeneity. c We downgraded for indirectness because most or all of the interventions were not designed to treat anxiety or depression as the primary focus. d We downgraded for imprecision as the upper and lower limits of the confidence intervals include both potential for harm and potential for benefit e We downgraded for imprecision as the total sample size was less than 400 as per guidance from the Consumer and Communication Cochrane Review Group (Ryan 2016) | ||||||
Background
Description of the condition
Long‐term conditions or chronic illnesses of childhood are variably defined in the literature, but usually include physical, psychological, or cognitive problems lasting more than three months, which impair functioning (Van der Lee 2007). It is estimated that internationally, 10% to 12% of children are affected by long‐term physical conditions (Eiser 1997). Asthma is the most common long‐term physical condition of childhood, followed by diabetes and epilepsy (Burkart 2002). Less common long‐term physical conditions include respiratory conditions, such as cystic fibrosis and bronchiectasis; cardiovascular conditions, such as congenital heart disease; gastrointestinal conditions, such as Crohn’s disease; renal conditions, such as chronic kidney disease; neurological conditions, such as muscular dystrophy; chronic pain; cancer; and others (Burkart 2002). In some developed countries, the prevalence of long‐term conditions is now greater than acute illnesses (Halfon 2010). Epidemiological trials show that the risk of psychological difficulties, particularly anxiety and depression, is substantially increased in children and adolescents with long‐term physical conditions (Cadman 1987; Gortmaker 1990; Newacheck 1991; Opolski 2005; Pless 1971; Wallander 1995; Weiland 1992).
Anxiety disorders are common, occurring in 2.6% to 5.2% of children under 12 years, and in 5% to 19% of all children and adolescents (Costello 2004). The presentation of anxiety disorders varies with age, from separation anxiety, undifferentiated worries, and somatic complaints in younger children, to specific phobias, panic disorder, and social anxiety in older children and adolescents. Childhood anxiety disorders often persist into adolescence and early adulthood, and yet they often remain untreated or are diagnosed late (Last 1996; Last 1997; Schneier 1992). Anxiety disorders are associated with poor academic performance, and personal and social dysfunction (Pine 2009). They may also be comorbid with depression (Kovacs 1989), substance abuse (Kushner 1990), attention deficit hyperactivity disorder (ADHD), and conduct disorder (Bittner 2007), and are associated with suicidal behaviours and death by suicide (Hill 2011). Anxiety has been identified in children and young people with long‐term physical conditions as an area of clinical significance, although precise data on its incidence in this population is not available (Benton 2007; Pao 2011). It may arise from a number of different mechanisms, including confrontation by dangerous stimuli, such as threatening symptoms of illness, distressing procedures, or unpredictable events; increased fear of death in life‐threatening diseases; having a reduced sense of control over one’s circumstances; experiencing peer rejection or parental overprotection; and experiencing illness‐specific symptoms, such as shortness of breath in asthma (Lewis 2003; Pinquart 2011). Risk factors for developing anxiety in people with long‐term conditions include younger age, female gender, and type of illness (Hermanns 2005).
Depression is another common, yet under‐recognised, problem, with an overall prevalence of 0.4% to 2.5% in primary school children, and 0.4% to 8.3% in adolescents (Birmaher 1996a). A 30‐year trial of American children indicated a depression rate of 2.8% in children under the age of 13 years, and of 5.6% in young people aged 13 to 18 years (Costello 2004). Rates rise rapidly during adolescence (Feehan 1993; Feehan 1994; Fergusson 1993; Fergusson 2001). By the age of 19 years, between a fifth and a quarter of young people have suffered from a depressive disorder (Lewinsohn 1998; Rhode 2013). Depression is associated with poor academic performance, social dysfunction, substance abuse, and attempted and completed suicide (Birmaher 1996a; Birmaher 1996b; Brent 1986; Brent 2002; Fleming 1993; Rao 1995; Rhode 1994). Even subthreshold depression is associated with an increased risk of later depression (Gonzales‐Tejera 2005), substance abuse (Judd 2002), suicidal behaviours (Fergusson 2006), and mortality (Cuijpers 2002). Depression may be comorbid with anxiety in 15.9% to 61.9% of children identified as either anxious or depressed, and measures of anxiety and depression are highly correlated (Brady 1992). Depression has also been identified as occurring more commonly in children and adolescents with long‐term physical conditions, although precise data on its incidence in this population is not available (Dantzer 2003; Pinquart 2011). Depressive symptoms have been reported in as many as 40% of children with a long‐term condition and socialisation problems (Denny 2014). Risk factors for depression in long‐term conditions are thought to include low self‐esteem and a negative attributional style (Burke 1999).
Description of the intervention
Psychological interventions are defined as any psychotherapeutic treatment (talking therapy) specifically designed to change cognition, behaviour, or both, with the intention of improving mental health outcomes (Eccleston 2012). Evidence regarding interventions for psychological problems in children with long‐term physical conditions is limited (Compas 2012). The majority of interventions specifically designed for children and adolescents with long‐term physical conditions focus on compliance with medical treatment, education about the medical condition, and improving aspects of medical care (Fielding 1999; Smith 1986). Psychological issues, especially anxiety and depression, are usually addressed using standard psychological treatments, which may or may not have been tested in this population. Access to such therapies may be limited, depending upon the availability of community child and adolescent mental health services, paediatric consultation liaison services, and other community‐based health services.
E‐health is an emerging and fast‐developing field of research and practice that involves the application of digital technologies (i.e. those delivered via digital means, such as computers and smart phones) to support or deliver health interventions. E‐health programmes have many advantages: the fidelity of the intervention process is embedded in the programme, patients can access treatment at their convenience, and they can work at their own pace, in privacy. Computers may be preferable for some who are unable (e.g. those living in rural areas) or reluctant (e.g. many adolescents) to seek traditional face‐to‐face care (Fleming 2015). E‐health interventions can take various forms, from reasonably simple, predominantly text‐based programmes (e.g. websites offering information), through multimedia and interactive programmes that can incorporate emails or text messages, all the way to sophisticated applications, such as virtual reality systems (e.g. used as a distraction to reduce pain in children; Law 2011). They may also include serious games (Fleming 2015), and biofeedback programmes that use galvanic skin response and heart variability sensors, to detect stress‐related physiological changes, e.g. used for stress management (Pop‐Jordanova 2010), or relaxation training (Amon 2008).
Given the greater likelihood of psychological issues in children and adolescents with long‐term physical conditions, and the increasing availability of e‐health technology, it is pertinent to consider the value of e‐health‐based psychological therapies and interventions in addressing these conditions, whether the computer programmes are of generic design or specifically designed for this population. A growing body of evidence suggests that computer‐delivered interventions are feasible and potentially efficacious in delivering compliance‐ and treatment‐related behavioural therapies to children and adolescents with long‐term physical conditions, and their families (Stinson 2009). Furthermore, a review of 15 trials has suggested that children with chronic health conditions may be less likely to drop out from computerised interventions than from face‐to‐face interventions (Dunn 2011). The UK's National Institute for Health and Care Excellence (NICE) endorsed computerised interventions (based on cognitive behavioural therapy (CBT)) as the preferred first line of treatment for mild to moderate depression and anxiety (NICE 2006). There is limited evidence that computerised CBT may be useful for treating depression in adults with long‐term physical conditions (Sharp 2014). Whether or not this is the same for children and adolescents with long‐term physical conditions remains to be determined, as does the effectiveness of other models of computerised psychotherapy with this population.
How the intervention might work
The aetiologies of both anxiety and depression are complex, and include biological, psychological, and social factors (Cicchetti 1998; Davidson 2002; Goodyer 2000; Lewinsohn 1994; McCauley 2001). Although modalities, such as behaviour therapies (Martell 2001), third wave CBTs (Hayes 2004), psychodynamic therapies (McQueen 2008), humanistic therapies, integrative therapies (Mufson 2004), and systemic therapies (Carr 2006), may all be used to treat these conditions in face‐to‐face settings, we anticipate that the majority of e‐health interventions designed to address anxiety and depression are likely to be based upon the principles of CBT, and to include an element of education about the psychological problem being addressed. Potential mechanisms for the main categories of psychological therapies are as follows.
Behaviour therapies aim to constructively change patients’ behaviour towards their symptoms using operant conditioning. Common components used to treat anxiety and depression include psycho‐education (Guerney 1971), relaxation training (Lowe 2002), and behavioural activation (BA (Jacobsen 1996; Martell 2001)). Biofeedback techniques may also be used (Schwartz 2003).
CBT helps to link thoughts, feelings, and behaviour, and target the situations or triggers that generate emotional responses. Cognitive appraisal of triggers and altering cognitions, in order to change mood and behaviour, are supported. CBT for depression is based on the cognitive model of depression that proposed that individuals prone to depression have cognitive distortions, which result in a negative view of themselves, the world, and the future (Beck 1976). People with pessimistic 'attribution styles' have a bias toward viewing negative events as stable and self‐induced, versus positive events as transient and out of their control (Abramson 1978). This leads to a state of 'learned helplessness' and hopelessness (Petersen 1993; Seligman 1979), as well as passivity, in the face of challenges (McCauley 2001). CBT for depression in children and adolescents involves helping the child to: (1) recognise and evaluate their thoughts, and identify different levels of mood in themselves, (2) recognise thoughts and behaviours that have contributed to this mood, (3) develop coping strategies to address them via effective problem‐solving, and (4) evaluate outcomes. CBT has been shown to improve depression in children and adolescents (Harrington 1998; Reinecke 1998; Weisz 2017), and prevent relapse (Paykel 1999), although long‐term results in trials have contradictory findings (Fonagy 2005). CBT for anxiety is based on Beck’s cognitive model of anxiety, which proposes that fear and anxiety are learned responses that can be 'unlearned'. CBT for anxiety in children and adolescents involves helping the child to: (1) recognise anxious feelings and bodily reactions, (2) clarify thoughts or cognitions in anxiety‐provoking situations, (3) develop effective coping skills via modified self‐talk, modelling, reality or in vivo exposure, role playing, and relaxation training, and (4) evaluate outcomes (Silverman 1996). An element of treatment, known as systematic desensitisation, involves pairing anxiety stimuli, in vivo or by imagination, in a gradually‐increasing hierarchy with competing relaxing stimuli, such as pleasant images and muscle relaxation (James 2013). Recent advances have identified optimal methods of delivering exposure work, including deepened extinction, variability, and affect labelling (Craske 2014).
Third wave CBTs include acceptance and commitment therapy (ACT (Hayes 1999; Hayes 2004)), compassionate mind training (CMT), also known as compassion‐focused therapy (Gilbert 2005; Gilbert 2009), functional analytic psychotherapy (FAP (Kohlenberg 1991)), metacognitive therapy for depression (Wells 2008; Wells 2009), and dialectical behaviour therapy (Koons 2001; Linehan 1993). These approaches use a combination of cognitive, behavioural, and mindfulness techniques to assist people to manage situations without thought suppression or experiential avoidance (Hoffman 2008).
Psychodynamic therapies aim to resolve internal conflicts stemming from difficulties in past relationships and experiences (for example, sexual abuse). Such conflicts are thought to cause anxiety or psychic pain, and are ’repressed’ into the unconscious through the use of defence mechanisms (Bateman 2000). Although some defence mechanisms are adaptive, some are developmentally immature, and can cause harm. Psychoanalytic (sometimes called psychodynamic) psychotherapy attempts to explore, through talking, playing (with younger children), and forming a therapeutic relationship, how earlier experiences influence and perhaps seriously distort current thoughts, feelings, behaviours (actions), and relationships (McQueen 2008).
Humanistic therapies include grief therapy, supportive therapy, and transactional analysis. These therapies are based on the premise that people are ‘self‐actualising’, that is, they have an inherent tendency to develop their potential, and they are self‐aware, free to choose how they live, and are responsible for the choices they make (Rogers 1951; Maslow 1970). Individualised, rather than manualised or prescribed methods, are undertaken to help them address their situation (Cain 2002).
Integrative therapies include interpersonal therapy (IPT), which addresses interpersonal conflict, difficulty with role transitions, and experiences of loss, all of which are well‐known risk factors for the development of depressive disorders in young people (Birmaher 1996a; Lewinsohn 1994; McCauley 2001). Preponents have proposed that IPT works by activating several interpersonal change mechanisms, including: (1) enhancing social support, (2) decreasing interpersonal stress, (3) facilitating emotional processing, and (4) improving interpersonal skills (Lipsitz 2013). It has been shown to be effective in the treatment of teenage depression (Bolton 2007; Mufson 1996; Mufson 2004).
Systemic therapies include family therapy, which is based on the premise that family members can influence one another’s well‐being, and have a significant effect on both the development of symptoms, and the outcomes of interventions (Carr 2006). There are a number of forms of family therapy, including structural family therapy, which centres on individual physiological vulnerability, dysfunctional transactional styles, and the role the sick child plays in facilitating conflict avoidance (Liebman 1974; Minuchin 1978). Systems therapy, including Milan and post‐Milan family therapy, attempts to elicit changes in the family dynamic, by presenting information that encourages family members to reflect on their own behaviour within the family dynamic (Selvini 1978). Strategic family therapy acknowledges the effect of the illness on all family members, and focuses on inducing a change in symptoms by highlighting paradoxical intentions of family members (Madanes 1981). Attachment‐based family therapy (ABFT) combines elements of attachment theory and family systems theory, and parents are encouraged to sensitively respond to young people. It has been shown to be better than waiting‐list control for treating depression, and to lead to faster resolution of depressive symptoms, and less suicidal ideation than waiting‐list control (Diamond 2002). ABFT has also been shown to lead to greater client and family satisfaction and retention when combined with CBT, than when CBT is used alone for treating anxiety in young people (Siqueland 2005).
Delivery of these psychological interventions via digital makes them potentially more cost‐effective and widely available. They are able to be accessed by those who may otherwise not engage in treatment, and mean that people can work at their own pace, access treatment as and when they need it, and do so in privacy.
Why it is important to do this review
As the field of e‐health is a relatively new one, the evidence base regarding the effectiveness of e‐health interventions, especially in a population, such as people with long‐term conditions, is currently limited. This review aims to fill a gap in the literature by identifying and evaluating randomised controlled trials (RCTs) of e‐health‐based interventions that directly or indirectly address anxiety or depression in children and adolescents with long‐term physical conditions. Establishing this evidence base will inform the clinical use of existing effective resources, and guide the development of newer and potentially more cost‐effective and globally dispersible forms of treatment for this growing population.
Due to the unique qualities of e‐health interventions, and the rapidly growing nature of this new field of healthcare, e‐health interventions for addressing anxiety and depression in children and adolescents with long‐term physical conditions are being considered separately from non‐e‐health interventions by the same authors in a related review (Thabrew 2017a). This review also sits alongside a review of serious games for treating depression in children and adolescents who do not have a long‐term condition (Fleming 2015). A few existing Cochrane reviews have already investigated the value of psychological therapies for anxiety and depression in adults, children, and adolescents (Barak 2008). Of the latter, one review addressed the prevention of depression in children and adolescents without specifically addressing those with long‐term conditions (Hetrick 2016). Two reviews addressed the treatment of depression (Cox 2014), and anxiety (James 2013), in children and adolescents, but again not specifically in those with long‐term conditions. Two reviews have addressed psychological interventions for depression in adolescents who have a single condition, such as congenital heart disease (Lane 2013), or pain (Eccleston 2014), and one review has focused on interventions for parents, rather than for children (Eccleston 2012).
Objectives
To assess the effectiveness of e‐health interventions in comparison with attention placebos, psychological placebos, treatment as usual, waiting‐list controls, or non‐psychological treatments for treating anxiety and depression in children and adolescents with long‐term physical conditions.
Methods
Criteria for considering studies for this review
Types of studies
We included all randomised controlled trials (RCTs) and cluster‐randomised trials. We also included cross‐over trials, only using the data from the first phase, in order to avoid carry‐over effects. We excluded observational trials, quasi‐randomised trials, and non‐randomised trials. We did not exclude any trial on the basis of language of publication or publication status.
Types of participants
Age
We included trials involving children and adolescents aged 0 to 18 years (or those that had at least 80% of the sample within this age range).
Diagnosis
We included trials whose participants had any single or mixed long‐term physical condition of more than three‐months' duration, and measurable symptoms of anxiety, depression, or subthreshold depression. Symptoms of anxiety and depression were assessed using patient or clinician‐administered validated rating scales (Sadock 2005), based on DSM III, IV or 5 (American Psychological Association 2013), or ICD 9 or 10 (World Health Organization 1992) criteria. Formal depressive and anxiety disorders were diagnosed using structured clinical interviews.
Comorbidities
We included trials with participants with any mixed, long‐term conditions, and with both anxiety and depression. We included trials of participants who may also have had any type of comorbid physical condition (e.g. asthma, diabetes, epilepsy), or another mental health condition (e.g. attention deficit hyperactivity disorder, obsessive compulsive disorder, schizophrenia).
Setting
We included trials involving those treated in hospital or community settings.
Types of interventions
Experimental intervention
Experimental interventions included any e‐health intervention that had measured changes in anxiety or depression, and that had been tested in children and adolescents with long‐term conditions. These may have been delivered via the Internet (e.g. static or interactive websites, automated emails, or web‐based applications), mobile telephones (e.g. automated phone calls or short text messages), or smartphones (e.g. mobile websites or smartphone applications). These may have been entirely individually used (self‐help) or therapist‐supported, and may have included parental participation, but not telemental health, where psychological intervention was provided remotely, via telephone, chatroom, email, or videoconferencing, and not interventions that were designed only for parents. Eligible modalities of therapy included the following.
-
Cognitive behavioural therapy (CBT (Harrington 1998; Reinecke 1998; Weisz 2006)).
-
Behaviour therapies (e.g. relaxation training (Lowe 2002)).
-
Third wave CBTs (e.g. acceptance and commitment therapy (Hayes 1999)).
-
Other psychologically‐oriented therapies (e.g. mixed models of therapy, such as CBT plus relaxation training).
Comparator intervention
Comparator interventions included any of the following.
-
Attention placebo (AP): a control condition in which the control group received an intervention that mimicked the time and attention received by the intervention group, but was not thought to be active.
-
Treatment as usual (TAU): participants could receive any appropriate medical care during the course of the trial on a naturalistic basis, including standard psychological or pharmacotherapeutic care, usual care, or no treatment.
-
Waiting list (WL): as in TAU, patients in the WL‐ control could receive any appropriate medical care during the course of the trial on a naturalistic basis.
-
Psychological placebo (PP): a control condition that was regarded as inactive in a trial by researchers, but was regarded as active by the participants.
-
Other non‐psychological therapies (e.g. pharmacotherapy for depression or anxiety).
Main planned comparisons
-
e‐health interventions for anxiety or depression versus any comparator
-
e‐health interventions for anxiety or depression versus attention placebo (AP)
-
e‐health interventions for anxiety or depression versus treatment as usual (TAU)
-
e‐health interventions for anxiety or depression versus waiting list (WL)
-
e‐health interventions for anxiety or depression versus psychological placebo (PP)
-
e‐health interventions for anxiety or depression versus other non‐psychological therapies (e.g. pharmacotherapy for depression or anxiety)
Types of outcome measures
We focused outcome measures on the individual child rather than the wider family. We evaluated the difference between the treatment group and the control group separately for anxiety and depression, using the following outcomes.
Primary outcomes
-
Treatment efficacy: we measured changes in severity of anxiety and depression symptoms separately, using validated scales for each of these conditions (e.g. Children's Depression Inventory (CDI) for childhood depression (Kovacs 1989); State‐Trait Anxiety Inventory (STAI) for anxiety (Spielberger 1983)). We analysed clinician‐rated scales separately from those rated by the children, young people, parents, and others (e.g. teachers). We interpreted statistically‐significant results by taking into account the clinical significance of each scale (using T‐scores if these were available for all scales).
-
Treatment acceptability: as reported by quantitative measures of treatment acceptability (e.g. the Treatment Evaluation Inventory‐Short Form (Newton 2004)), the number of participants who dropped out for any reason, and because of adverse events.
Secondary outcomes
-
Changes in caseness (remission or response): we measured these separately, using similar validated scales for each of the conditions.
-
Suicide‐related behaviour: we assessed as the number of a) deaths by suicide, b) suicide attempts, and c) episodes of deliberate self harm, either reported or measured, using validated scales (Osman 2001).
-
Improvement in quality of life: we measured using validated scales (e.g. Paediatric Quality of Life inventory (PedsQL (Varni 2004)).
-
Functioning, as a proxy for psychological well‐being: we measured using validated scales (e.g. Children's Global Assessment Scale (CGAS (Shaffer 1984)).
-
Status of long‐term physical condition: we measured using validated scales (e.g. Paediatric Asthma Symptom Scale (PASS (Lara 2000)). Note: As the only physical outcome that was available was a change in pain, we labelled the outcome 'Pain' in the analysis section.
-
Adherence to treatment of long‐term physical condition.
-
School or college attendance (e.g. reduction in number of days missed).
-
Economic benefits (e.g. reduction of costs of treatment, number of appointments with general practitioners, use of additional treatments, ability to study or work).
Timing of outcome assessment
We undertook clustering and comparison of outcome measures at similar time periods. The primary time point was short‐term change (i.e. at the end of treatment). We assessed short‐term and long‐term (three months or more beyond the end of treatment) outcome measures separately. If multiple long‐term measures had been provided, we had planned to use the one furthest from the intervention, as this was most relevant to understanding the enduring nature of the therapeutic effect.
Hierarchy of outcome measures
For trials presenting a range of symptom measures (e.g. multiple depression scales), we used the scale ranked highest according to the following five criteria: appropriateness to children and adolescents, reliability, construct validity, agreement with clinical interview, and track record in psychopharmacological research.
For depression, we ranked them, from highest to lowest, as follows: Schedule for Affective Disorders and Schizophrenia for School‐Age Children (Kiddie‐SADS (Kaufman1997)), Children's Depression Rating Scale (CDRS (Poznanski 1985)), Bellevue Index of Depression (BID (Petti 1978)), Children's Depression Inventory (CDI (Kovacs 1985)), Hamilton Depression Rating Scale (HAM‐D (Hamilton 1967)), Depressive Adjective Checklist (DACL (Lubin 1965)), then others (Hazell 2002).
For anxiety, we ranked them, from highest to lowest, as follows: Anxiety Disorder Interview Schedule (ADIS (Silverman 1988)), Multidimensional Anxiety Scale for Children (MASC (March 1997)), Paediatric Anxiety Rating Scale (PARS (PARS 2002)), Social Phobia and Anxiety Inventory for Children (SPAI‐C (Beidel 2000)), Social Anxiety Scale for Children‐Revised (SASC‐R (La Greca 1988)), Fear Survey Schedule for Children‐Revised (FSSC (Olendick 1983)), Revised Children’s Manifest Anxiety Scale (RCMAS (Reynolds 1978)), State‐Trait Anxiety Inventory for Children (STAI‐C (Spielberger 1973)), Screen for Child Anxiety‐Related Emotional Disorders (SCARED (Birmaher 1999)), Hamilton Anxiety Rating Scale (HARS (Maier 1988)), then others (based on Myers 2002).
Search methods for identification of studies
Cochrane Common Mental Disorders Controlled Trials Register (CCMD‐CTR)
The Cochrane Common Mental Disorders Group maintained a specialised register of randomised controlled trials, the CCMDCTR (to June 2016). This register contains over 40,000 reference records (reports of RCTs) for anxiety disorders, depression, bipolar disorder, eating disorders, self harm, and other mental disorders within the scope of the Cochrane Common Mental Disorders Group (CCMDG). The CCMD‐CTR is a partially trials‐based register with more than 50% of reference records tagged to approximately 12,500 individually PICO‐coded trial records. Reports of trials that are included in the register were collated from (weekly) generic searches of MEDLINE (from 1950), Embase (from 1974), and PsycINFO (from 1967), quarterly searches of the Cochrane Central Register of Controlled Trials (CENTRAL), and review‐specific searches of additional databases. Reports of trials were also sourced from international trial registries, drug companies, the handsearching of key journals, conference proceedings, and other (non‐Cochrane) systematic reviews and meta‐analyses. Details of CCMDG's core search strategies used to identify RCTs, can be found on the Group's website. We have included an example of the core MEDLINE search in Appendix 1.
The register fell out of date with the Editorial Group’s move from Bristol to York in the summer of 2016
The CCMDCTR was current to 16 May 2016 when we last ran the search.
Electronic searches
Searches for this review have been through a number of iterations. The Group's Information Specialist initially ran a broad search of the Cochrane Common Mental Disorders Controled Trials Register (CCMDCTR), using the following terms (16 May 2016). The search of the CCMDCTR was not repeated in August 2017 as the register was out‐of‐date at this time.
CCMDCTR‐Studies register
Condition = (anxiety or depressi* or mood or mutism or neuroses or neurotic or “obsessive compulsive” or panic or *phobi* or psychoneuroses or “stress disorder*” or “psychological stress” or “school refusal”)
and Comorbidity = not empty
and Age Group = (child or adolescent)
We screened these records for e‐health‐based interventions in this population.
CCMDCTR‐References register
The Information Specialist searched the references register, using a more sensitive set of terms, to find additional untagged and uncoded reports of RCTs (Appendix 2).
The CCMD's Information Specialist conducted complementary searches on the following bibliographic databases, using relevant subject headings (controlled vocabularies) and search syntax, appropriate to each resource.
-
The Cochrane Central Register of Controlled Trials (CENTRAL) via the Cochrane Register of Studies Online (CRSO; searched 9 June 2016 and 18 August 2017 (Appendix 3)).
-
Other Cochrane Library databases (CDSR, DARE, HTA; searched 9 June 2016 and 18 August 2017)
In August 2017, the Information Specialist ran a search of CENTRAL (2017, Issue 8), and a cross‐search of Ovid MEDLINE, Embase and PsycINFO (searched 18 August 2017 (Appendix 4)).
We searched the following resources:
-
Web of Scence Core Collection (Science, Social Science and Conference Proceeding indices (SCI, SSCI, CPCI‐S, CPCI‐SSH; searched 18 August 2016 and 31 August 2017) (employing the same search strategy as displayed in Appendix 2, but amending NEXT to NEAR/x and adding an RCT filter (random* OR "cross over" OR crossover or trial OR trials).
-
International trial registries via the World Health Organization's trials portal (ICTRP) and ClinicalTrials.gov pm 27 May 2016 and 29 August 2018 to identify unpublished or ongoing trials.
We did not apply any restrictions on date, language or publication status to the searches.
Searching other resources
Handsearching
We handsearched relevant conference proceedings (those titles not already indexed in Embase or PsycINFO, or already handsearched for CENTRAL) as follows:
-
Annual Meeting of the American Academy of Child and Adolescent Psychiatry (AACAP; searched from 2000 onwards); and
-
International Conference of the European Federation for Medical Informatics (MIE; searched via Studies in Health Technology and Informatics journal).
Reference lists
We checked the reference lists of all included trials and relevant systematic reviews to identify additional trials, missed from the original electronic searches (for example, unpublished or in‐press citations).
Grey literature
We searched sources of grey literature via the following websites: Open Grey www.opengrey.eu/ and the National Guidlines Clearing House www.guideline.gov/
Correspondence
We contacted authors of included trials, and subject experts for information on unpublished or ongoing trials.
Data collection and analysis
Selection of studies
Two authors (HT and SW), in conjunction with the CCMDG editorial office, conducted the searches. Two authors (HT and JH) independently screened the titles and abstracts of the records identified. They discarded trials that obviously did not fulfil inclusion criteria at this stage of the screening process. We retrieved the full texts of eligible or potentially‐eligible trials for independent full‐text inspection by two authors (HT and JH). We resolved any discrepancies by discussion, or by involving a third author (KS) as necessary. We listed the reasons for exclusion in the‘Characteristics of excluded trials’ table. We kept notes that described the selection process in enough detail to complete a PRISMA flow diagram (Figure 1).
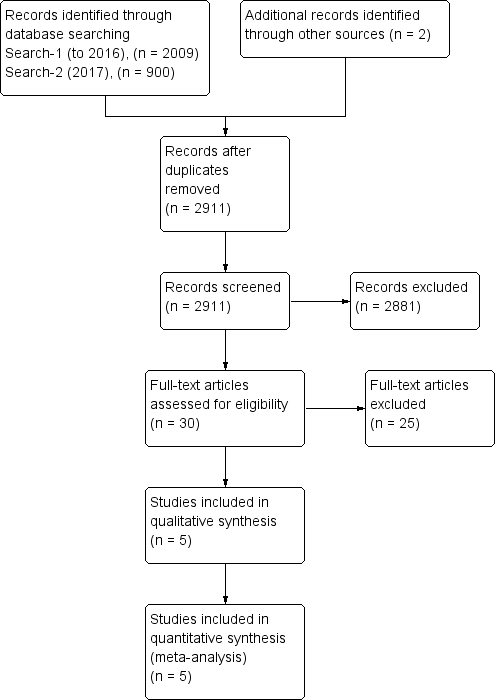
Study flow diagram.
Data extraction and management
Two authors (HT and KS) independently extracted data on trial characteristics, methodology, participant characteristics, intervention characteristics, outcome measures, and outcome data, using Covidence® software (Covidence). We contacted authors to obtain additional information when required. After agreement, one author (HT) transferred data into RevMan 5.3 for analysis (RevMan 2014). We used the format that would allow us to include the maximum numbers of trials (events and total number of patients for each group; mean, standard deviations (SDs), and number of patients included in each group; or generic inverse variance if necessary). We resolved disagreements by discussion, or with the help of the third author (SH).
Assessment of risk of bias in included studies
We assessed risk of bias for each included trial, using Cochrane’s ’Risk of bias’ tool (Higgins 2011). We considered the following sources of bias.
-
Sequence generation: was the allocation sequence adequately generated?
-
Allocation concealment: was allocation adequately concealed?
-
Blinding of participants and care providers for each main outcome or class of outcomes: was knowledge of the allocated treatment adequately prevented during the trial?
-
Blinding of outcome assessors for each main outcome or class of outcomes: was knowledge of the allocated treatment adequately prevented during the trial?
-
Incomplete outcome data for each main outcome or class of outcomes: did more than 10% of participants withdraw and were incomplete outcome data adequately addressed? This figure was used in a previous review of the prevention of depression in children and adolescents (Hetrick 2016).
-
Selective outcome reporting: are reports of the trial free of any suggestion of selective outcome reporting?
-
Other sources of bias: was the trial apparently free of other problems that could put it at high risk of bias? Additional items included here were therapist qualifications, treatment fidelity, and researcher allegiance or conflict of interest.
A description of what was reported to have happened in each trial was independently extracted by two authors (HT and KS), and a judgement on the risk of bias was made for each source, based on the following three categories.
-
Low risk of bias.
-
Unclear risk of bias.
-
High risk of bias.
Any disagreement was resolved by discussion, or with the help of the third author (SH). For cluster‐randomised trials, we had planned to assess risk of bias by considering recruitment bias, baseline imbalance, loss of cluster, incorrect analysis, and comparability with individual randomised trials, in addition to the typical sources. The level of risk of bias was noted in both the body of the review and the ‘Summary of findings’ table.
Measures of treatment effect
We used odds ratio (OR) to compare dichotomous data and standardised mean differences (SMD) to analyse continuous data when different scales were used across studies to measure an outcome, and mean difference when the same scale was used across studies or when there was only one study included in a meta‐analysis. We considered SMD effect sizes of 0.2 to be small, 0.5 to be medium, and ≥ 0.8 to be large (Pace 2011). We used a 95% confidence interval. When an effect was discovered, we had planned to calculate a number needed to treat for an additional beneficial outcome (NNTB) for the primary outcome from the OR, as this value was less likely to be affected by the side (benefit or harm) to which the data were entered (Cates 2002; Deeks 2000; Visual Rx).
We undertook meta‐analyses only where this was meaningful, i.e. if the treatments, participants, and the underlying clinical question were similar enough for pooling to make sense. We narratively described skewed data reported as medians and interquartile ranges. Where multiple trial arms were reported in a single trial, we included only the relevant arms.
We combined all types of e‐health interventions in the main analyses, and where data allowed, had planned to conduct subgroup analyses to investigate any differences between them.
Unit of analysis issues
Cluster‐randomised trials
We had planned to include and analyse cluster‐randomised trials, as long as proper adjustment for the intra‐cluster correlation could be undertaken, as described in the Cochrane Handbook for Systematic Reviews of Interventions (Higgins 2011).
Cross‐over trials
Due to the risk of carry‐over effects in cross‐over trials, we had planned to only analyse data from the first phase of the trial.
Studies with multiple treatment groups
Where trials had additional arms that were not e‐health interventions, we only included the data relating to the therapy and one control arm in the review. If a trial had more than two arms that met the inclusion criteria, for example two e‐health interventions and a control arm, we split data from the control arm equally to produce two (or more) pairwise comparisons.
Dealing with missing data
We contacted the authors for apparently missing data. We used intention‐to‐treat (ITT) analysis where this was reported, and mentioned in the 'Risk of bias' table whether or not ITT analysis was done. For continuous data, we used last observation carried forward (LOCF). If necessary, we had planned to conduct a sensitivity analysis to ascertain the effect of multiple missing data management techniques. Where trials did not report the standard deviations (SDs) of continuous measure scores and the original authors were unable to provide them, we calculated the SD from the standard error (SE) or P values (Altman 1996), or from CI, T values, or P values, as described in section 7.7.3 of the Cochrane Handbook for Systematic Reviews of Interventions (Higgins 2011). If this was not possible, we used the baseline SD. If means were based on imputed data and were all that was available, we used N ‐ dropout.
Assessment of heterogeneity
Before pooling results and carrying out any meta‐analysis, we considered clinical heterogeneity and the role of subgroup analyses to address it. We quantified statistical heterogeneity using the I² statistic, with data entered in the way (benefit or harm) that yielded the lowest amount. The amount, depending on the value obtained for the I² statistic (Higgins 2003), was qualified as:
-
might not be important (0 to 40%);
-
may represent moderate heterogeneity (30% to 60%);
-
may represent substantial heterogeneity (50% to 90%); and
-
may represent considerable heterogeneity (75% to 100%).
We took into account (i) magnitude and direction of effects and (ii) strength of evidence for heterogeneity (e.g. the p‐value from the chi‐squared test, or a confidence interval (CI) for I2). All heterogeneity was explored, but comparisons with moderate and higher heterogeneity (I² statistic > 30%) was further explored using one of the following methods: Egger’s regression intercept to assess the possibility of a small trial effect (Rucker 2011); visual forest plot inspection (with trials placed in order according to a specific moderator or subgroup (categorical moderators), or meta‐regressions (continuous moderators)).
Assessment of reporting biases
If more than 10 trials were included, we had planned to enter their data into a funnel plot (trial effect versus trial size) in order to evaluate overt publication bias. A symmetrical funnel plot is likely to indicate low publication bias while an asymmetric funnel plot is likely to indicate likely publication bias. The number of trials required to reduce the P value of a statistically significant finding to 0.05 (not statistically significant) is also used to evaluate the robustness of the findings. A high classical fail‐safe number indicates that the conclusions are unlikely to be reversed by new trials, while a low classical fail‐safe number indicates that they may be more likely to be reversed in the future. Finally, we had planned to use Duval and Tweedie’s trim and fill analysis to estimate what the effect size (OR, risk ratio, etc.) would be if there was no publication bias (Duval 2000).
Data synthesis
When available and sufficiently clinically and statistically homogenous, we combined data from included trials in meta‐analyses using the random treatment effects given the expected clinical diversity in the interventions being delivered across various conditions. For consistency we used the random‐effects model even when only one trial was included in a meta‐analysis; it is also the case that the fixed‐effects and random‐effects models give the same result when there is only one trial. We presented the characteristics of included and excluded trials in tables. We presented the 'Risk of bias' assessment in a 'Risk of bias' graph. As we were anticipating heterogeneity of data, we had planned to analyse the data in RevMan 5.3 using a random‐effects model. We presented results for each comparison as forest plots, when appropriate. We provided narrative summaries for comparisons with fewer than two available trials, and those with a moderate or high level of statistical heterogeneity, following heterogeneity exploration.
Subgroup analysis and investigation of heterogeneity
For each condition (anxiety or depression), in order to better understand the factors that contributed to an effective intervention, we performed these subgroup analyses for the primary outcomes when there were sufficient trials.
-
Type of experimental therapy (e.g. CBT, other therapy). This was undertaken because different types of therapies are known to have varied underlying theoretical bases and often result in different effect sizes (e.g. Watanabe 2007).
-
Type of control therapy (e.g. active comparators (such as attention placebo, psychological placebo, and other non‐psychological therapies) and non‐active comparators (such as treatment as usual and waiting list)) as defined by previous researchers (Weisz 2006). Control intervention type has been shown to influence effect sizes (e.g. Furakawa 2014).
-
Modality of delivery (e.g. individual, group). Different modalities of therapy have been shown to result in different effect sizes during the treatment of a range of conditions (Wierzbicki 1987).
-
Dose of treatment (number of completed sessions). Although different therapies will have different total durations, it was of interest to identify therapies that most efficiently resulted in symptomatic improvement.
-
Therapist assistance. There is some evidence that adherence and outcome may be influenced by therapist assistance (Andersson 2009).
-
Form of measurement (e.g. self‐rated, parent‐rated, clinician‐rated). Different types of rating scales have been shown to contribute differently to the prediction of outcomes (Uher 2012).
-
Type of long‐term physical conditions (e.g. asthma, diabetes). This was undertaken to identify whether these therapies were more or less effective for children (0 to 12 years old) and young people (13 to 18 years old) with different types of physical illness, and in order to make recommendations regarding the targeted use of these therapies.
-
Category of depressive symptoms. There was a possibility that sub‐threshold and threshold depressive symptoms may respond differently to therapies (Costello 1992).
-
Target of intervention. Interventions targeted at children or adolescents may be differently effective to those targeted at families (Aydin 2014).
-
Participant factors (e.g. sex, age). Younger and older people have been shown to have different effect sizes following similar therapies, so results were analysed according to four clinically‐relevant subgroups of age (0 to 8, 9 to 12, 13 to 15, and 16 to 18 years old (Bennett 2013)).
The feasibility of undertaking these analyses depended upon the number, quality, and heterogeneity of included trials.
Sensitivity analysis
In order to test the robustness of decisions made during the review process, sensitivity analyses were planned for the primary outcomes only, based on:
-
allocation concealment;
-
dropout rate; and
-
blinding of outcome assessors.
We had planned to run three separate sensitivity analyses: one where we removed those trials at high or unclear risk of bias for allocation concealment; one where we removed those trials at high or unclear risk of bias for outcome assessor blinding; and one where we removed those trials at high or unclear risk of bias for missing data. We also had planned to run a sensitivity analysis in which we removed those trials where more than 20% of participants did not complete the post‐intervention outcome assessment. The first two have been shown to have the largest impact on treatment effect (Schulz 1995).
'Summary of findings' table
We constructed a 'Summary of findings' table for each comparison between e‐health and any comparator with regard to the following outcomes.
-
Change in severity of anxiety symptoms post‐intervention
-
Change in severity of depressive symptoms post‐intervention
-
Change in quality of life measures post‐intervention
-
Change in functioning measures post‐intervention
-
Change in status of long‐term physical condition post‐intervention
In the 'Summary of findings' tables, we used the principles of the GRADE approach to assess the extent to which there could be confidence that the obtained effect estimate reflected the true underlying effect (Guyatt 1998). The quality of a body of evidence was judged on the basis of the included trials’ risks of bias, the directness of the evidence, unexplained heterogeneity, imprecision, and the risk of publication bias. A criterion of <400 participants for imprecision was used based on Consumer and Communication Cochrane Review Group (Ryan 2016). We used the average rate in all the arms of included trials as the ’assumed risk’ for each outcome. As we were not aiming to target any particularly high‐ or low‐risk populations, all the tables were for medium‐risk populations. We used GRADEpro GDT to develop the 'Summary of findings' table (GRADEpro GDT).
Resultados
Descripción de los estudios
Resultados de la búsqueda
We found 2009 citations using the search strategy run between May and August 2016, from which we identified 30 abstracts as potentially relevant. The authors of six trials were contacted for additional information (Aubin 2014; Blackwell 2012; Cheng 2013; Clarke 2015; Ketchen 2006; Quittner 2013). One author reported that their trial had been prematurely discontinued due to lack of funding (Quittner 2013). The ANZCTR record of Clarke 2015 showed that the trial had been discontinued for unspecified reasons, and we received no reply from the other four authors. Following review of the full‐text articles, 25 trials were excluded, and five trials were included in the review, each of which contributed data to at least one analysis (Law 2015; Newcombe 2012; Palermo 2009; Palermo 2016a; Trautmann 2010).
CCMD's information specialist ran an update search on 18 August 2017, and retrieved 900 further records (after de‐duplication). We screened these and identified no new studies. An updated search of other databases yielded two new study reports, one was excluded (Starbright programme) and the other was an additional reference to a study already listed as ongoing see Figure 1 for further details.
Estudios incluidos
Five trials were included in this review, with characteristics as follows (see also Characteristics of included studies).
Design
All five included trials were randomised controlled trials, undertaken between 1997 and 2016. One trial had multiple treatment groups (Trautmann 2010). We did not identify any suitable cluster‐randomised or cross‐over trials.
Sample sizes
Sample sizes ranged from 42 (Newcombe 2012), to 273 (Palermo 2016a).
Settings
Three of the included trials were conducted in the USA (Law 2015; Palermo 2009; Palermo 2016a), one was undertaken in Australia (Newcombe 2012), and one in Germany (Trautmann 2010). Apart from one trial in which a community sample was recruited by advertisements, trials were usually undertaken with outpatients in community clinic settings (Trautmann 2010). These included a neurology clinic (Law 2015, a respiratory clinic (Newcombe 2012), and one or more pain clinics (Palermo 2009; Palermo 2016a). No trials were conducted in inpatient or other settings.
Participants
Participants were aged between 10 and 18 years. Age ranges in individual trials were as follows: 11 to 17 years, mean 14.5 years (Law 2015); 10 to 17 years, mean 13.5 years (Newcombe 2012); 11 to 17 years, mean 14.8 years (Palermo 2009); 11 to 17 years, mean 14.7 years (Palermo 2016a); and 10 to 18 years, mean 12.7 years (Trautmann 2010). Between 15% and 50% of participants were male. The proportion of males in individual trials was as follows: 15% (Law 2015): 50% (Newcombe 2012): 30% (Palermo 2009); 25% (Palermo 2016a); 45% (Trautmann 2010). The ethnicity of participants varied between trials. Individual trial demographics were as follows: 92% White, 3% Black,5% Asian, 8% multi‐racial (Law 2015); 100% White (Newcombe 2012); 90% Caucasian (Palermo 2009); 85% Anglo‐American, 5% African American, 1% Hispanic, 6% Other, 2% missing (Palermo 2016a); and unspecified (Trautmann 2010). All participants had a long‐term physical condition and symptoms of either anxiety or depression, but none had formal diagnoses of anxiety or depressive disorders. Baseline levels of anxiety were rated as subthreshold in Law 2015, and mild in Palermo 2016a. Baseline levels of depression were as subthreshold in four trials, and mild in Palermo 2016a.
The main type of long‐term physical conditions targeted by identified interventions were pain‐related disorders. These included: migraine, tension headache, other headache (Law 2015); chronic idiopathic pain (Palermo 2009): headache, abdominal pain, musculoskeletal pain, other pain (Palermo 2016a); and migraine and tension headache (Trautmann 2010). Only Newcombe 2012 targeted asthma, cystic fibrosis, and other respiratory illness. Three out of five trials that identified severity of long‐term physical conditions rated participants as having a mild to moderate level of symptoms. These included having headaches for 6 out of 10 days and a pain intensity of 4.5 out of 10 (Law 2015); a Forced Expiratory Volume in 1 second (FEV1) of around 75% (Newcombe 2012); and having headaches for 10.7 days a month and a pain intensity rating of 5.2 out of 10 (Trautmann 2010). Two trials did not report the severity of participants’ long‐term physical conditions (Palermo 2009; Palermo 2016a). In three of the five included trials, people with medical comorbid conditions were excluded. In Law 2015, young people with developmental disabilities were also excluded and in Palermo 2016a, young people with psychiatric conditions were also excluded. Two authors made no mention of the inclusion or exclusion of young people with comorbid medical or psychological conditions (Newcombe 2012; Trautmann 2010).
Inclusion criteria varied considerably between trials, partly due to the heterogeneity of long‐term physical conditions (see Characteristics of included studies for details of individual trials). Exclusion criteria were more consistent, and included the lack of Internet access (Law 2015), difficulties with language (Law 2015; Newcombe 2012; ; Palermo 2009; Palermo 2016a), the inability to use a computer (Newcombe 2012; Palermo 2016a), not residing at home (Palermo 2016a), previous or current use of psychotherapy, especially CBT (Palermo 2009; Trautmann 2010), and recently starting prophylactic medication for headache (Trautmann 2010). Two trials excluded people with serious psychiatric symptoms, but not symptoms of anxiety or depression (Newcombe 2012; Palermo 2016a). Three trials reported there were no pre‐treatment differences between groups (Law 2015; Newcombe 2012; Trautmann 2010; ; ). The author of Palermo 2009 reported that their intervention group was slightly, and non‐significantly, younger than their control group, while the author of Palermo 2016a identified that their intervention group was more likely to be Anglo‐American than their control group.
Interventions
Three of the included trials evaluated the same intervention, namely Web‐MAP, a web‐based intervention for managing chronic pain (Law 2015; Palermo 2009; Palermo 2016a). The other two trials evaluated an online intervention (Breathe Easier Online) for improving respiratory function (Newcombe 2012), and an online form of multimodal CBT training for reducing headache (Trautmann 2010). All of these interventions were delivered online, and Trautmann 2010 also included a set of relaxation exercises on a computer disc (CD). Two of the three interventions (Web‐MAP and multimodal CBT training) used CBT as their therapeutic modality. Components of these interventions included education about pain, recognition of stress and negative emotions, deep breathing and relaxation, the implementation of coping skills at school, the development of cognitive skills (e.g. reducing negative thoughts), education about sleep hygiene and lifestyle, activity pacing and scheduling, and relapse prevention. The third intervention (Breathe Easier Online) was based on problem‐solving therapy. All were adapted from existing face‐to‐face individual or group therapies, and were delivered using a manualised format. None of the interventions used biofeedback.
One of the interventions (Web‐MAP) included modules for both children and parents, while the other two (Breathe Easier Online and multimodal CBT training) only included modules for children. The duration of interventions was relatively similar. Web‐MAP included eight child modules (of 30 minutes each) and eight parent modules (of 30 minutes each) to be completed over an eight‐week period; Breathe Easier Online included six child modules (of one hour each) to be completed over a nine‐week period; and multimodal CBT training included six child modules (of one hour each) to be completed over an eight‐week period. All interventions included some form of homework, usually behavioural assignments, although these were more clearly quantified in trials of Web‐MAP (six assignments) than those of the other two interventions. Web‐MAP included up to one hour of online coaching (review of assignments and asynchronous feedback) by a post‐doctoral fellow or trained therapist. Breathe Easier Online included ‘minimal’ therapist support (an unquantified amount of troubleshooting and review of assignments). Multimodal CBT training included up to an hour of therapist support (review of assignments and two booster contacts at week four and week eight).
Two trials used attention placebo control conditions. Palermo 2016a used an Internet education programme about chronic pain, with an unspecified number of modules over the same duration as the primary intervention. Trautmann 2010 had two control arms: i) applied relaxation via CD with differential, cue‐controlled, and full relaxation procedures delivered in modules over six weeks, with homework exercises and weekly email contact by a therapist; and ii) an educational intervention involving an hour‐long online education about chronic headache, and weekly follow‐up email contact by a therapist to check on the maintenance of a headache diary. The educational intervention arm was deemed a more suitable comparator during data analysis, as it included an online component. Two of the trials used treatment as usual as a control intervention. In Law 2015, treatment as usual included a variable number of sessions of psychological therapy (including CBT for pain) or physiotherapy, with or without medication, over the same duration as the primary intervention. In Palermo 2009, treatment as usual included any kind of psychological therapy or waiting list, over the same duration as the primary intervention. Newcombe 2012 used a waiting list control. No trials used psychological placebo or non‐psychological therapies as control conditions. Adjunctive treatments were allowed alongside the primary intervention in two trials. Law 2015 allowed medication, psychological therapy (including CBT for pain) and physiotherapy. Palermo 2009 allowed the use of medication and physiotherapy. The use of adjunctive treatment was not described by the other three trials (Trautmann 2010; Newcombe 2012; Palermo 2016a).
Primary outcomes
Treatment efficacy was evaluated using validated scales that measured changes in the severity of symptoms of either anxiety or depression. A greater number of trials measured changes in depression symptoms than changes in anxiety symptoms. Changes in the severity of anxiety symptoms were measured using the Revised Children’s Manifest Anxiety Scale (RCMAS 2) in Law 2015, and the pain‐specific anxiety subscale of the Bath Adolescent Pain Questionnaire in Palermo 2016a. Changes in the severity of depression symptoms were measured using the Childhood Depression Inventory in Trautmann 2010 and Law 2015, the Centre for Epidemiological trials Depression scale for children (CES‐D C) in Newcombe 2012, the depression subscale of the Revised Child Anxiety and Depression Scale (RCADS) in Palermo 2009, and the depression‐specific subscale of the Bath Adolescent Pain Questionnaire in Palermo 2016a.
Treatment acceptability was quantitatively evaluated using validated scales in four trials. These included the Intervention Satisfaction Scale (ISS) in Newcombe 2012, the Treatment Evaluation Inventory – Short Form (TEI‐SF) in Palermo 2009 and Palermo 2016a, and the Patient Therapist Alliance (PTA) in Trautmann 2010. In addition to these measures, we assessed treatment acceptability based on the number of dropouts and adverse outcomes.
Secondary outcomes
Changes in ‘caseness’ (remission or response) of anxiety or depression were not reported by any of the included trials, neither was suicide‐related behaviour, defined as the number of a) deaths by suicide, b) suicide attempts, and c) episodes of deliberate self‐harm, either reported, or measured using validated scales (Osman 2001). Only Trautmann 2010 measured improvement in quality of life following intervention, using the KINDL‐R, a German scale that included six dimensions of the Health‐Related Quality of Life Scale. Functioning, as a proxy for psychological well‐being, was measured using the Child activity Limitations Interview (CALI) in three trials (Law 2015; Palermo 2009; Palermo 2016a), and the Social Problem‐Solving Inventory – Revised (Short Form) in one trial (Newcombe 2012). Status of the long‐term physical condition was assessed in Newcombe 2012 with the Forced Expiratory Volume in 1 second (FEV1); in Palermo 2009 and Palermo 2016a with an 11‐point pain intensity scale; and in Trautmann 2010, using the frequency of headaches per week recorded in a diary. Adherence to the treatment of the long‐term physical condition was not assessed by any of the trials, neither was school or college attendance (e.g. reduction in number of days missed), or economic benefits (e.g. reduction of costs of treatment, number of appointments with general practitioners, use of additional treatments, ability to trial or work).
Estudios excluidos
We excluded 25 trials from this review. Seven were excluded as neither changes in anxiety nor changes in depression were measured during these trials (Al‐Haggar 2006; Berndt 2014; Fernandes 2015; Hanberger 2013; Newton 2013; Nijhof 2011; Stinson 2010). Eight were excluded as they were identified as not being randomised controlled trials, cluster‐randomised controlled trials, or cross‐over trials (Blocher 2013; Holden 1999; Holden 2002; Ketchen 2006; Li 2011; Reigada 2013; Seitz 2014; Tung 2015). Seven were excluded as they did not include an e‐Health intervention arm (Alemi 2014; Kotses 1991; Liu 2001; Sansom‐Daly 2012; Yetwin 2012; Zinchenko 2014; Piaserico 2016). Two trials were excluded as they were not undertaken with children with long‐term physical conditions (O'Hea 2013; Pham 2016). One was excluded as it was not an individual trial report (systematic review (Miller 2012)).
Ongoing studies
Searches to August 2017 identified a total of five ongoing studies. Three trials were reported as ongoing during our original search in July 2016. These included a trial of iACT, an interactive mHealth monitoring system to enhance psychotherapy for adolescents with sickle cell disease (Cheng 2013), a pilot randomised trial of a cognitive behavioural treatment for insomnia and depression in adolescents (Clarke 2015), and a trial of U‐care, an internet‐based self‐help programme of psychosocial support and psychological treatment (Mattson 2013). Although an ANZCTR report stated that one trial had been stopped early, no reply was received from the author when we contacted them for confirmation (Clarke 2015). Two further study protocols were identified during an update of the search in August 2017. These were protocols for a trial of web‐based cognitive behavioural therapy for anxiety and depression in youth with chronic illness (Benson 2015), and for a randomised controlled trial of e‐Health mindfulness‐based intervention versus in‐person mindfulness for adolescents with chronic illness (Kaufman 2017). For further details, please see the Characteristics of ongoing studies table.
Studies awaiting classification
Five studies classed as awaiting classification, as only an abstract with insufficient data was available, despite contacting the authors multiple times (Aubin 2014; Blackwell 2012; Quittner 2013; Sansom‐Daly 2014; Sansom‐Daly 2015). For further details, please see the 'Characteristics of studies awaiting classification' table.
Riesgo de sesgo de los estudios incluidos
For details of the risk of bias judgements for each trial using Cochrane criteria, see Characteristics of included studies. We have presented a graphical representation of the overall risk of bias in included trials in Figure 2 and Figure 3.
Asignación
Random sequence generation
The risk of bias for random sequence generation was considered low in all trials, as online number generation was used, and in most cases (apart from Newcombe 2012), this was associated with block randomisation.
Allocation concealment
The risk of bias for allocation concealment was considered low in three of the five trials. In these trials, participants had been allocated by one of the following methods: a 1:1 ratio via password‐protected spreadsheet accessible only to research coordinator (Law 2015); group assignment via identity numbers in sealed envelopes that were only opened by the research coordinator at the end of the trial (Palermo 2009); and pre‐programmed assignment within the Web‐MAP intervention (Palermo 2016a). In the other two trials, risk of bias for allocation concealment was rated as unclear because the method used was not adequately described (Newcombe 2012; Trautmann 2010).
Cegamiento
Participants and personnel
The risk of bias for blinding of participants and research assistants was rated as unclear or high in all trials. In three trials, these individuals were reportedly not blinded, due to the nature of the intervention (Law 2015; Palermo 2009; Palermo 2016a). In the other two trials, blinding was not clearly described (Newcombe 2012; Trautmann 2010).
Outcome assessors
The risk of bias for blinding of outcome assessors was rated as unclear in all trials. Outcome measurement was completed online by the participants in two (Law 2015; Palermo 2016a), and blinding was not described in three (Newcombe 2012; Palermo 2009; Trautmann 2010).
Datos incompletos de resultados
The risk of bias for incomplete outcome data was rated as low in two trials, as the dropout rates were relatively low and reasons for attrition and exclusion were adequately reported (Newcombe 2012; Palermo 2016a). We rated three trials as having a high risk of bias for incomplete outcome data because inadequate methods were used for ITT analysis (Law 2015; Palermo 2009), or because more than 10% of post‐intervention data was not collected (Law 2015; Trautmann 2010).
Informe selectivo
Only one trial had a full trial protocol that was consistent with the trial report (Palermo 2016b). As none of the other trials had a published trial protocol, these were judged to be of unclear risk of bias.
Otras fuentes potenciales de sesgo
All three interventions tested during the five included trials were conducted by developers of those interventions, so trials were considered at high risk of bias in this regard.
Efectos de las intervenciones
Data were only available for some of the primary and secondary outcomes that we had planned to assess. Therefore, we provided a narrative analysis for all outcomes, and a meta‐analysis for selected outcomes. Pain was the only type of symptom for the long‐term physical conditions for which meta‐analysable data were available, so this outcome was labelled 'Pain' in relevant tables. As trials reported pre‐intervention and post‐intervention scores using different scales for almost all outcomes, standardised mean differences (SMD) were used to pool results in accordance with the recommendation of the Cochrane Handbook for Systematic Reviews of Interventions (Higgins 2011).
Comparison 1: E‐health interventions versus any comparator
See Summary of findings table 1.
1.1 Treatment efficacy
Using GRADE criteria, there was very low‐quality evidence from all five trials, involving 441 participants, meaning it is not clear whether there are differences between e‐health interventions and comparators in reducing symptoms of depression immediately post‐intervention (SMD ‐0.06, 95% CI ‐0.35 to 0.23; I² = 41%; Analysis 1.1), or at three to six‐month follow‐up (SMD 0.04, 95% CI ‐0.18 to 0.25; I² = 0%; Analysis 1.2).
Two trials, involving 324 participants, measured changes in symptoms of anxiety (Law 2015; Palermo 2016a). These trials offered very low‐quality evidence meaning it is not clear whether there are differences between e‐health interventions and comparators in reducing symptoms of anxiety either immediately post‐intervention (SMD ‐0.07, 95% CI ‐0.29 to 0.14; I² = 0%; Analysis 1.3), or three to six months later (SMD 0.02, 95% CI ‐0.20 to 0.24; I² = 0%; Analysis 1.4).
1.2 Treatment acceptability
Treatment acceptability was gauged on the basis of quantitative measures of acceptability, dropouts, and adverse events. Treatment acceptability was quantitatively measured immediately post‐intervention in both experimental and control groups by two trials, involving 304 participants (Palermo 2016a; Trautmann 2010). Given the very low‐quality evidence from these trials it could not be determined whether e‐health interventions were less acceptable to users than any comparator when measured immediately‐post intervention (SMD 0.46, 95% CI 0.23 to 0.69; I² = 0%; Analysis 1.5). Despite this comparative finding, the authors of one trial reported that most children (SD = 1.8) and parents (SD = 1.9) had good treatment engagement with the intervention, completing a mean of 7/8 modules, and with nobody dropping out of the trial in either group (Palermo 2016a).
One potential treatment‐related adverse effect (thoughts of self‐harm in response to a behavioural assignment) was identified during this trial (Palermo 2016a). The authors of the other trial did not report any adverse outcomes, but reported that 4/24 (16.6%) dropped out of the experimental group and 1/19 (5.3%) dropped out of the control group (Trautmann 2010). Reasons for dropping out included lack of motivation, headache while reading online material, and computer problems. The Chi² test did not reveal any significant differences in these reasons between experimental and control groups.
Secondary outcomes
1.3 Change in caseness (remission or response)
No data were available for this outcome.
1.4 Suicide‐related behaviour
No data were available for this outcome.
1.5 Improvements in quality of life
Improvements in quality of life were only assessed by one trial, involving 34 participants (Trautmann 2010). This trial provided very low‐quality evidence that the e‐health intervention was better at improving quality of life than any comparator immediately post‐intervention (MD ‐0.30, 95% CI ‐0.54 to ‐0.06; Analysis 1.6), but not six months after completion of the intervention (MD 0.10, 95% CI ‐0.19 to 0.39; Analysis 1.7).
1.6 Functioning
Changes in functioning were assessed by three trials, involving 372 participants (Law 2015; Palermo 2009; Palermo 2016a). Given the very low‐quality evidence it could not be determined whether e‐health interventions were more effective than any comparator in improving functioning, when measured either immediately post‐intervention (SMD ‐0.08, 95% CI ‐0.33 to 0.18; I² = 17%; Analysis 1.8), or three months later (SMD ‐0.13, 95% CI ‐0.35 to 0.09; I² = 0%; Analysis 1.9).
1.7 Status of the long‐term physical condition
The status of the long‐term physical condition was assessed by changes in pain and respiratory function by all five trials, involving 463 participants. Given the low‐quality evidence it could not be determined whether e‐health interventions were more effective than any comparator in reducing pain immediately post‐intervention (SMD 0.06, 95% CI ‐0.12 to 0.24; I² = 0%; Analysis 1.10), or three to six months later (SMD 0.10, 95% CI ‐0.11 to 0.32; I² = 0%; Analysis 1.11) .
1.8 Adherence to treatment of long‐term physical condition
No data were available for this outcome.
1.9 School or college attendance
No data were available for this outcome.
1.10 Economic benefits
No data were available for this outcome.
Comparison 2: E‐health interventions versus attention placebo
Two trials, involving 304 participants, contributed data to this comparison (Palermo 2016a; Trautmann 2010).
Primary outcomes
2.1 Treatment efficacy
There was very low‐quality evidence from two trials, involving 304 participants. Therefore, it could not be determined whether e‐health interventions were more effective than attention placebo in reducing symptoms of depression immediately post‐intervention (SMD 0.11, 95% CI ‐0.11 to 0.34; I² = 0%; Analysis 2.1) or by three‐ to six‐month follow‐up (SMD 0.02, 95% CI ‐0.21 to 0.25; I² = 0%; Analysis 2.2).
Only one trial, involving 269 participants, measured changes in symptoms of anxiety (Palermo 2016a). There was not enough good quality evidence to determine if there were differences between e‐health interventions and attention placebo in reducing symptoms of anxiety either immediately post‐intervention (MD ‐0.29, 95% CI ‐1.73 to 1.15; Analysis 2.3), or three to six months later (MD 0.12, 95% CI ‐1.27 to 1.51; Analysis 2.4).
2.2 Treatment acceptability
Treatment acceptability was quantitatively measured immediately post‐intervention in both experimental and control groups by two trials involving 304 participants. These trials provided very low‐quality evidence that e‐health interventions were less acceptable to users than attention placebo (SMD 0.46, 95% CI 0.23 to 0.69; I² = 0%; Analysis 2.5). Potential reasons are explored in the discussion section. Despite this comparative finding, the authors of Palermo 2016a reported that most children (SD = 1.8) and parents (SD = 1.9) had good treatment engagement, completing a mean of 7/8 modules, and with nobody dropping out of the trial in either group.
One potential treatment‐related adverse effect (thoughts of self‐harm in response to a behavioural assignment) was identified during this trial. The authors of Trautmann 2010 did not report any adverse outcomes, but reported that 4/24 (16.6%) dropped out of the experimental group and 1/19 (5.3%) dropped out of the control group. Reasons for dropping out included lack of motivation, headache while reading online material, and computer problems. The Chi² test did not reveal any significant differences in these reasons between experimental and control groups.
Secondary outcomes
2.3 Change in caseness (remission or response)
No data were available for this outcome.
2.4 Suicide‐related behaviour
No data were available for this outcome.
2.5 Improvements in quality of life
Improvements in quality of life were only assessed by one trial, involving 34 participants (Trautmann 2010). This trial provided very low‐quality evidence that e‐health interventions were better at improving quality of life than attention placebo immediately post‐intervention (MD ‐0.30, 95% CI ‐0.54 to ‐0.06; Analysis 2.6), but not six months after completion of the intervention (MD ‐0.10, 95% CI ‐0.19 to 0.39; Analysis 2.7).
2.6 Functioning
Changes in functioning were assessed by one trial involving 269 participants (Palermo 2016a). This trial provided very low‐quality evidence, therefore it was not possible to determine whether e‐health interventions were more effective than attention placebo in improving functioning either immediately post‐intervention (MD 0.03, 95% CI ‐1.05 to 1.11; Analysis 2.8), or three months later (MD ‐0.72, 95% CI ‐1.84 to 0.40; Analysis 2.9).
2.7 Status of the long‐term physical condition
The status of the long‐term physical condition was assessed by changes in pain by two trials involving 302 participants. Together, they provided low‐quality evidence meaning it could not be determined whether e‐health interventions were more effective than attention placebo in reducing pain immediately post‐intervention (SMD 0.03, 95% CI ‐0.34 to 0.40; I² = 32%; Analysis 2.10), or three to six months later (SMD 0.13, 95% CI ‐0.10 to 0.36; Analysis 2.11).
2.8 Adherence to treatment of long‐term physical condition
No data were available for this outcome.
2.9 School or college attendance
No data were available for this outcome.
2.10 Economic benefits
No data were available for this outcome.
Comparison 3: E‐health interventions versus treatment as usual
One trial involving 77 participants contributed data to this comparison (Law 2015).
Primary outcomes
3.1 Treatment efficacy
There was very low‐quality evidence from one trial, involving 77 participants. Therefore it could not be determined whether e‐health interventions were more effective than treatment as usual in reducing symptoms of depression immediately post‐intervention (MD ‐1.18, 95% CI ‐6.60 to 4.24; Analysis 3.1), or by three‐ to six‐month follow‐up (MD 1.01, 95% CI ‐3.39 to 5.41; Analysis 3.2).
Similarly, it could not be detemrined whether e‐health interventions were more effective than treatment as usual at reducing symptoms of anxiety immediately post‐intervention (MD ‐1.99, 95% CI ‐7.31 to 3.33; Analysis 3.3), or by three‐ to six‐month follow‐up (MD 0.46, 95% CI ‐5.34 to 6.26; Analysis 3.4).
3.2 Treatment acceptability
No data were available for this outcome.
Secondary outcomes
3.3 Change in caseness (remission or response)
No data were available for this outcome.
3.4 Suicide‐related behaviour
No data were available for this outcome.
3.5 Improvements in quality of life
No data were available for this outcome.
3.6 Functioning
Changes in functioning were assessed by one trial involving 77 participants. This trial provided very low‐quality evidence meaning that it could not be determined whether e‐health interventions were more effective than treatment as usual in improving functioning either immediately post‐intervention (MD ‐0.03, 95% CI ‐2.56 to 2.50; Analysis 3.5), or three to six months later (MD ‐0.08, 95% CI ‐2.76 to 2.60; Analysis 3.6).
3.7 Status of the long‐term physical condition
The status of the long‐term physical condition was assessed by changes in pain by one trial involving 77 participants.This trial provided low‐quality evidence meaning that it could not be determined whether e‐health interventions were more effective than treatment as usual in reducing pain immediately post‐intervention (MD ‐0.07, 95% CI ‐1.05 to 0.91; Analysis 3.7), or three to six months later (MD ‐0.05, 95% CI ‐1.34 to 1.24; Analysis 3.8).
3.8 Adherence to treatment of long‐term physical condition
No data were available for this outcome.
3.9 School or college attendance
No data were available for this outcome.
3.10 Economic benefits
No data were available for this outcome.
Comparison 4: E‐health interventions versus waiting list
Two trials, involving 87 participants, contributed data to this comparison (Newcombe 2012, Palermo 2009).
Primary outcomes
4.1 Treatment efficacy
There was very low‐quality evidence from two trials involving 87 participants. Therefore it could not be determined whether e‐health interventions were more effective than waiting list in reducing symptoms of depression immediately post‐intervention (SMD ‐0.40, 95% CI ‐0.91 to 0.11; I² = 28%; Analysis 4.1).
Neither of these trials assessed the effectiveness of e‐health interventions in reducing symptoms of depression at three to six months, nor did they measure symptoms of anxiety immediately post‐intervention, or at three to six months.
4.2 Treatment acceptability
Neither trial measured treatment acceptability in both the experimental or control groups, therefore, we could not undertake a meta‐analysis.
One trial measured treatment acceptability in the experimental group immediately post‐intervention using the Intervention Satisfaction Scale (ISS), and its authors reported that 18/19 (95%) participants said they were happy to do the programme and 15/19 (79%) thoroughly enjoyed it. Most participants (18/19 (95%)) said they would recommend the programme to others. Only two participants dropped out of the experimental group and the remainder completed all six modules (Newcombe 2012). The other trial measured treatment acceptability in the experimental group immediately post‐intervention using theTreatment Evaluation Inventory – Short Form (TEI‐SF), and its authors reported that children and parents in the experimental group reported moderate to high ratings of treatment acceptability (child report mean = 3.55, SD = 0.80; parent report mean = 3.82, SD = 0.50), and global satisfaction (child report mean = 3.68, SD = 0.84; parent report mean = 4.09, SD = 0.61). Child and parent reports were positively correlated (r = 0.50, P = 0.02 and r = 0.53, P = 0.01, respectively). Children completed a mean of 7.11 (SD = 1.86) out of eight modules, and 26/48 (77%) completed all eight modules, while parents competed a mean of 6.42 (SD = 2.24) modules, and 14/26 (54%) completed all eight modules. The number of modules completed by families was not significantly correlated with immediate post‐treatment primary or secondary outcomes, and dropouts were not reported (Palermo 2009).
Neither trial described any adverse events.
Secondary outcomes
4.3 Change in caseness (remission or response)
No data were available for this outcome.
4.4 Suicide‐related behaviour
No data were available for this outcome.
4.5 Improvements in quality of life
No data were available for this outcome.
4.6 Functioning
Changes in functioning were assessed by one trial involving 48 participants. This trial provided very low‐quality evidence meaning that it could not be determined whether e‐health interventions were more effective than a waiting list in improving functioning immediately post‐intervention (MD ‐3.31, 95% CI ‐6.90 to 0.28; Analysis 4.2). No data were available regarding changes in functioning at three to six months.
4.7 Improvement in symptoms of long‐term physical condition
The status of the long‐term physical condition, measured by changes in lung function or pain, was assessed by two trials involving 84 participants. These trials provided very low‐quality evidence meaning that it could not be determined whether e‐health interventions were more effective than a waiting list in reducing symptoms of the long‐term physical condition immediately post‐intervention (SMD 0.08, 95% CI ‐0.55 to 0.72; I² = 53%; Analysis 4.3). No data were available regarding symptoms of the long‐term physical condition at three to six months.
4.8 Adherence to treatment of long‐term physical condition
No data were available for this outcome.
4.9 School or college attendance
No data were available for this outcome.
4.10 Economic benefits
No data were available for this outcome.
Comparison 5: E‐health interventions versus psychological placebo
There were no included trials relevant to this comparison.
Comparison 6: E‐health interventions versus other non‐psychological therapies
There were no included trials relevant to this comparison.
Subgroup analyses
We anticipated considerable clinical and methodological heterogeneity in the trials included in this review, so planned a range of subgroup analyses on the type of experimental therapy, type of control therapy, modality of delivery, dose of treatment, therapist assistance, form of measurement, type of long‐term physical condition, category of depressive symptoms, target of intervention, and participant factors. However, data were only available to undertake four of these subgroup analyses for the primary outcomes.
1 Type of experimental therapy
Included in the analysis were four trials involving 402 participants who had undertaken cognitive behaviour therapy (CBT) and one trial of 39 participants who had undertaken a non‐CBT intervention (Newcombe 2012). Results indicated that the type of experimental therapy did make a difference to the change in symptoms of depression immediately post‐intervention (Chi² = 4.55, df = 1 (P = 0.03), I² = 78%; Analysis 5.1), however due to the small number of studies, we do not think this finding is reliable. No data were available to comment on the association between the type of experimental therapy and later changes in symptoms of depression, immediate changes in symptoms of anxiety, later changes in symptoms of anxiety or treatment acceptability.
2 Type of comparator
Included in the analysis were two trials involving 153 participants who had received attention placebo (Palermo 2016a; Trautmann 2010), one trial involving 23 participants who had received treatment as usual (Law 2015), and two trials involving 42 participants who had received waiting‐list control interventions (Newcombe 2012; Palermo 2009). Results indicated that the type of comparator did not make any difference to the change in symptoms of depression immediately post‐intervention (Chi² = 3.53, df = 2 (P = 0.17), I² = 43.3%; Analysis 6.1), change in symptoms of depression three to six months later (Chi² = 0.10, df = 1 (P = 0.75), I² = 0%; Analysis 6.2), change in symptoms of anxiety immediately post‐intervention (Chi² = 0.26, df = 1 (P = 0.61), I² = 0%; Analysis 6.3), or change in symptoms of anxiety three to six months later (Chi² = 0.01, df = 1 (P = 0.94), I² = 0%; Analysis 6.4).
3 Type of long‐term physical condition
Included in the analysis were four trials involving 402 participants who had pain related conditions (Law 2015; Palermo 2009; Palermo 2016a; Trautmann 2010), and one trial of 39 participants who had non‐pain‐related conditions (Newcombe 2012). Results indicated that the type of long‐term physical condition did make a difference in the change in symptoms of depression immediately post‐intervention (Chi² = 4.56, df = 1 (P = 0.03), I² = 78.1%; Analysis 7.1), however, due to the small number of studies, we do not think this finding is reliable.
No data were available to comment on the association between the type of long‐term physical condition and later changes in symptoms of depression, immediate changes in symptoms of anxiety, later changes in symptoms of anxiety, or treatment acceptability.
4 Target of intervention: Child and parent versus child only
Included in the analysis were three trials involving 367 participants, in which experimental interventions were targeted at parents and children (Law 2015; Palermo 2009; Palermo 2016a), and two trials involving 74 participants, in which experimental interventions were only targeted at children (Newcombe 2012; Trautmann 2010). Results indicated that the target of intervention did not make any difference to the change in symptoms of depression immediately post‐intervention (Chi² = 0.09, df = 1 (P = 0.76), I² = 0%; Analysis 8.1).
No data were available to comment on the association between the target of intervention and later changes in symptoms of depression, immediate changes in symptoms of anxiety, later changes in symptoms of anxiety or treatment acceptability.
Sensitivity analyses
Due to the limited number of identified trials, we did not undertake planned sensitivity analyses of the primary outcomes on the bases of allocation concealment, blinding of outcome assessors, or dropout rates.
Reporting Bias
Given that this review explored a relatively new area of research, we aimed to minimise reporting bias by undertaking comprehensive searches of key databases and other sources of technological reporting. Due to the limited number of included trials and known association of SMDs with a degree of standard error, inspection of funnel plots for the primary outcome measures was of limited value in informing us about the likely presence of publication bias (Higgins 2011). We did not identify any other obvious sources of reporting bias during the review process.
Discussion
Summary of main results
The primary objectives of this review were to evaluate the treatment efficacy and acceptability of e‐health interventions for treating anxiety and depression in children with long‐term physical conditions. From the limited data available, we concluded that the current evidence failed to clearly demonstrate that existing e‐health interventions were better than any type of comparator at reducing symptoms of anxiety or depression in this audience. Although there was qualitative data to suggest the acceptability of this treatment modality to this audience, quantitative measures of treatment acceptability suggested that existing e‐health interventions may, in some cases, be less acceptable than attention placebo interventions. This may be explained by the extra therapeutic demands, such as the completion of cognitive behavioural therapy (CBT) exercises and homework associated with active interventions.
Secondary aims of this review included identifying changes in caseness of anxiety or depression, quality of life, status of long‐term physical conditions, adherence to treatment of long‐term physical conditions, functioning, quality of life, school or college attendance, and economic benefits associated with the use of e‐health interventions. Data were only available for some of these outcomes. Despite being primarily designed to improve the status of long‐term physical conditions, there was not enought high quality evidence to determine whether the e‐health interventions included in this review were better than any type of placebo intervention at improving symptoms of long‐term physical conditions. Similarly, there was not enough evidence to determine whether they were clearly better than any type of placebo intervention at improving functioning, or quality of life, suggesting room for the development of more efficacious e‐health interventions for this clinical population. Our main findings are summarised in the summary of findings Table for the main comparison.
Subgroup analysis was only feasible for four factors, namely, the type of intervention, type of comparator, type of long‐term physical condition, and target audience for the intervention. Within the limited selection of trials, there was no evidence of a clear impact of any of these factors on the size of the treatment effect.
Overall completeness and applicability of evidence
We identified a very limited number of trials from which to draw conclusions, and the limitation of the review to randomised controlled trials may have led to the exclusion of data from quasi‐randomised and non‐randomised trials of e‐health interventions for treating anxiety or depression in the target population. Most trials were undertaken with adolescents, making it hard to comment on the effectiveness of these interventions on children younger than 10 years of age, or the value of parental involvement in their use, particularly for younger children. Despite appreciating that the intellectual, emotional, and psychological maturity of young people changes so significantly over even a few years, we had hoped to subgroup our findings by age band, but were unable to do so (Petersen 1995). All included trials were conducted in high income countries, making it similarly impossible to determine the likely effectiveness of these interventions for children and adolescents living in lower income countries, who might have greater need for such seemingly cost‐effective therapies. Most included trials were undertaken with adolescents with chronic pain conditions, making it imprudent to generalise findings to children and adolescents with other long‐term physical conditions. Most included interventions were also designed to detect differences in symptoms of the long‐term physical health condition (four trials), or functioning (one trial), rather than anxiety or depression, rendering them less likely to achieve a reduction in anxiety or depression symptoms. Most participants in these studies had subthreshold levels of anxiety or depression, and it is possible that the effect of these interventions on these conditions may have been masked by a floor effect. Only one trial was specifically powered to detect an improvement in psychosocial well‐being (Newcombe 2012).
The five included trials tested only three interventions, namely Web‐MAP, which is a CBT‐based treatment for adolescent pain; Breathe Easier Online, a problem‐solving intervention adapted for children with respiratory conditions; and a multi‐modal CBT‐based training programme for children with recurrent headache. This reflects the newness of the field of e‐health research, and confirms the fact that there is significant room for the development of other e‐health interventions. A variety of control interventions were used in the included trials. Only two trials tested e‐health interventions against the most stringent type of comparator, an attention placebo. Outcome measurement was generally short‐term in nature, immediately post‐intervention and three to six months later. No trials measured longer‐term outcomes. Significant markers of treatment effectiveness, such as suicide‐related behaviour, adherence to treatment of long‐term physical conditions, and markers of functional and social impact, such as school attendance and economic benefits were not collected during any of the identified trials, making it difficult to appreciate the wider implications of these interventions.
Quality of the evidence
The quality of the evidence for all outcomes for which there were data was low or very low quality. With the exception of randomisation, we assessed almost all domains to be of unclear or high risk of bias across (Figure 2; Figure 3). None of the included trials were designed to investigate the effect of e‐health interventions on anxiety or depression. There was considerable heterogeneity of results as evident from I² results, magnitude, and the bidirectional nature of effect. Only one trial had an available trial protocol, making the others at unclear risk of selective reporting. As there were not enough trials to conduct funnel plot evaluation, we were unable to be certain there was no publication bias.
Potential biases in the review process
None of the review authors were involved in any of the trials, however HT, KS, SM, and SH are all involved in the development of e‐health interventions for treating psychological problems in children and adolescents. Previous reviewers have drawn attention to the ‘file drawer’ effect of smaller trials with negative short‐term results, and despite conducting as thorough a search as we could of key databases, trial registries, and other sources, we may have missed some trials of existing e‐health interventions (Sansom‐Daly 2014). However, it is likely that the results of this review reflected a genuine lack of e‐health interventions designed to treat anxiety and depression in children and adolescents with long‐term physical conditions.
Agreements and disagreements with other studies or reviews
This review addresses novel areas of practice and research, therefore, the limited number of eligible trials is not surprising. It echoes the sparse findings of three recent and related systematic reviews. The first reviewed mobile phone messaging to facilitate self‐management of long‐term illnesses, and only identified four interventions, with limited evidence of efficacy (de Jongh 2012). The second reviewed psychological interventions for depression in adolescents and adults with congenital heart disease, did not find any trials that met the criteria for analysis (Lane 2013). The third reviewed psychological interventions for mental health disorders in children with chronic illness (Bennett 2015). They identified only ten trials, including one trial of computerised CBT for anxiety and depression, in children and adolescents with epilepsy (Blocher 2013). Similar to the studies included in our reviews, this non‐randomised, single arm pilot trial demonstrated preliminary evidence of the intervention’s efficacy, without any adverse effects. The variability in the type of comparator in our review was consistent with previous reviews of related areas, including a systematic review of psychological therapies for the management of chronic and recurrent pain in children and adolescents (Eccleston 2014). Like these reviewers, we found it difficult to be certain how much of the efficacy of interventions was related to the interventions themselves versus other factors, such as clinician attention.
Due to the small number of included trials and no evidence of clear improvement in anxiety or depression, it was not possible to identify specific features of e‐health interventions that might improve outcomes of interest. Our subgroup analysis of CBT and non‐CBT‐based interventions did not show any discernible difference between these therapies. This is in contrast to a previous systematic review of psychological interventions for parents of children and adolescents with chronic illness that showed that CBT was more beneficial for reducing children’s primary symptoms, while problem‐solving therapy that included parents improved parental adaptive behaviour and parental mental health (Eccleston 2015). All of the included therapies were derived from existing models of psychotherapy, and it is likely that further experimentation with the delivery of such models online will need to continue to achieve the ideal design.

Study flow diagram.
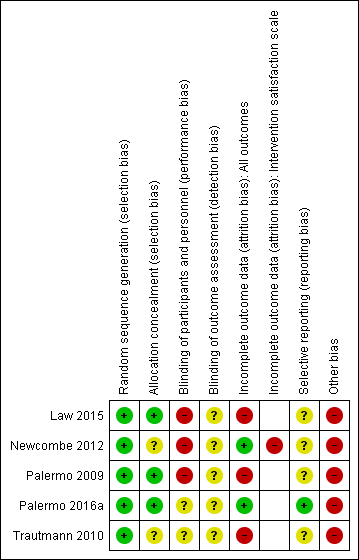
Risk of bias summary: review authors' judgements about each risk of bias item for each included study
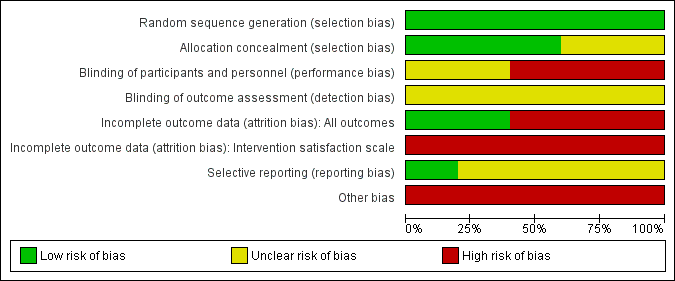
Risk of bias graph: review authors' judgements about each risk of bias item presented as percentages across all included studies
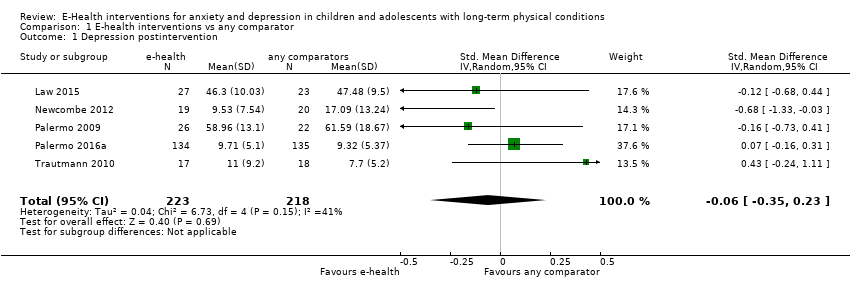
Comparison 1 E‐health interventions vs any comparator, Outcome 1 Depression postintervention.

Comparison 1 E‐health interventions vs any comparator, Outcome 2 Depression 3‐ to 6‐month follow‐up.

Comparison 1 E‐health interventions vs any comparator, Outcome 3 Anxiety postintervention.
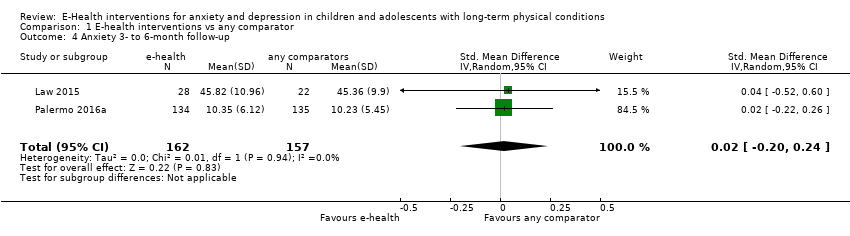
Comparison 1 E‐health interventions vs any comparator, Outcome 4 Anxiety 3‐ to 6‐month follow‐up.

Comparison 1 E‐health interventions vs any comparator, Outcome 5 Treatment acceptability postintervention.

Comparison 1 E‐health interventions vs any comparator, Outcome 6 Quality of life postintervention.
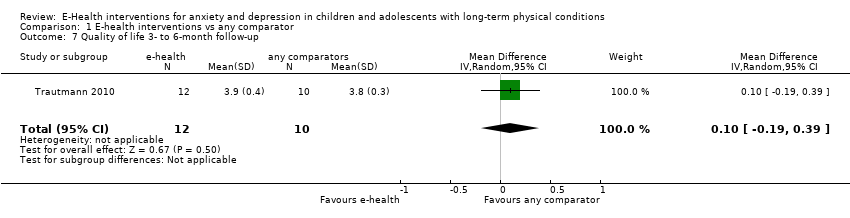
Comparison 1 E‐health interventions vs any comparator, Outcome 7 Quality of life 3‐ to 6‐month follow‐up.

Comparison 1 E‐health interventions vs any comparator, Outcome 8 Functioning postintervention.

Comparison 1 E‐health interventions vs any comparator, Outcome 9 Functioning 3‐ to 6‐month follow‐up.

Comparison 1 E‐health interventions vs any comparator, Outcome 10 Status of long‐term physical condition postintervention.

Comparison 1 E‐health interventions vs any comparator, Outcome 11 Status of long‐term physical condition 3‐ to 6‐month follow‐up.

Comparison 2 E‐health interventions vs attention placebo, Outcome 1 Depression postintervention.
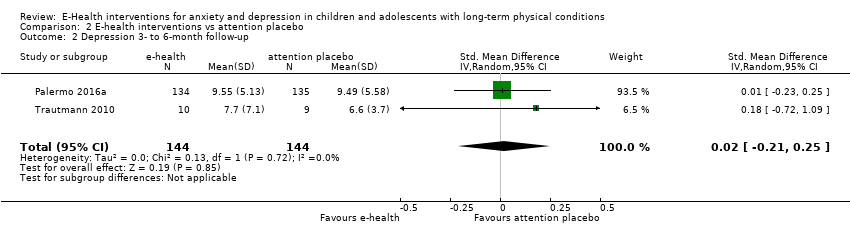
Comparison 2 E‐health interventions vs attention placebo, Outcome 2 Depression 3‐ to 6‐month follow‐up.
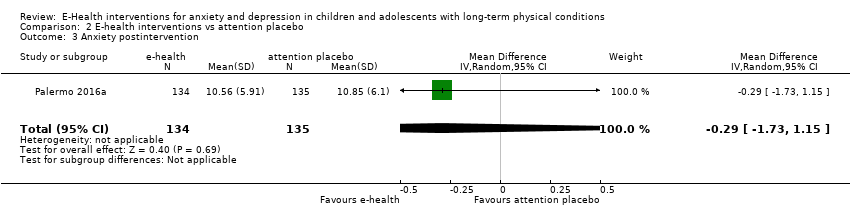
Comparison 2 E‐health interventions vs attention placebo, Outcome 3 Anxiety postintervention.
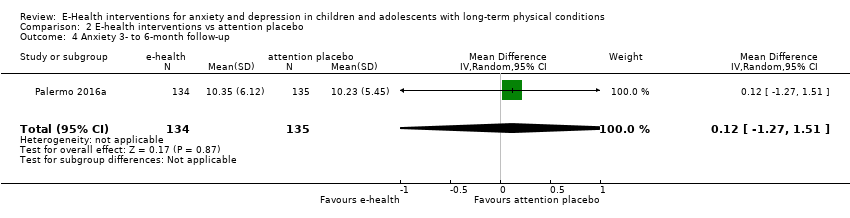
Comparison 2 E‐health interventions vs attention placebo, Outcome 4 Anxiety 3‐ to 6‐month follow‐up.

Comparison 2 E‐health interventions vs attention placebo, Outcome 5 Treatment acceptability postintervention.

Comparison 2 E‐health interventions vs attention placebo, Outcome 6 Quality of life postintervention.

Comparison 2 E‐health interventions vs attention placebo, Outcome 7 Quality of life 6‐month follow‐up.

Comparison 2 E‐health interventions vs attention placebo, Outcome 8 Functioning postintervention.
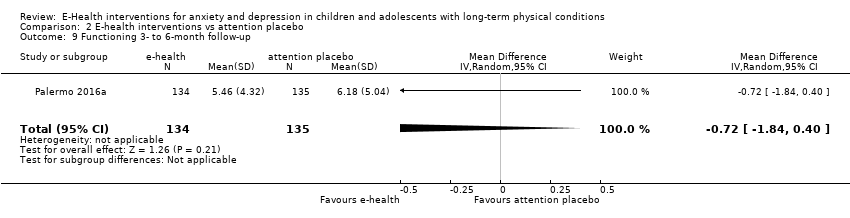
Comparison 2 E‐health interventions vs attention placebo, Outcome 9 Functioning 3‐ to 6‐month follow‐up.

Comparison 2 E‐health interventions vs attention placebo, Outcome 10 Status of long‐term physical condition postintervention.

Comparison 2 E‐health interventions vs attention placebo, Outcome 11 Status of long‐term physical condition 3‐ to 6‐month follow‐up.

Comparison 3 E‐health interventions vs treatment as usual (TAU), Outcome 1 Depression postintervention.

Comparison 3 E‐health interventions vs treatment as usual (TAU), Outcome 2 Depression 3‐month follow‐up.
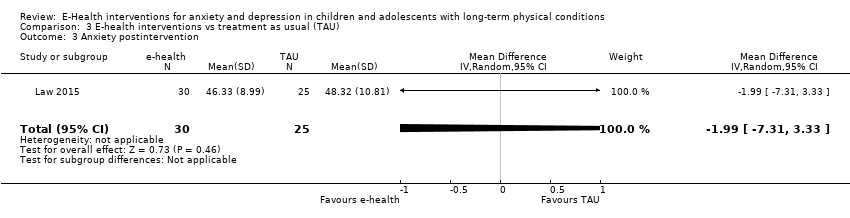
Comparison 3 E‐health interventions vs treatment as usual (TAU), Outcome 3 Anxiety postintervention.
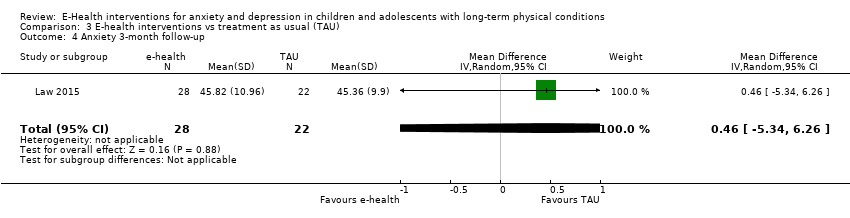
Comparison 3 E‐health interventions vs treatment as usual (TAU), Outcome 4 Anxiety 3‐month follow‐up.
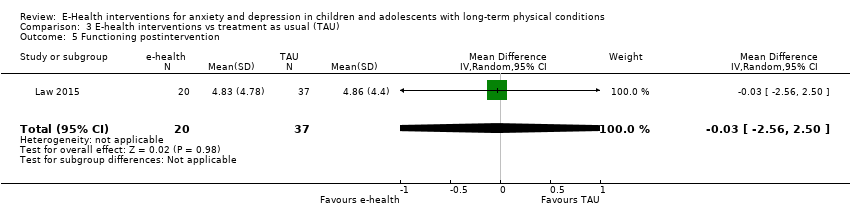
Comparison 3 E‐health interventions vs treatment as usual (TAU), Outcome 5 Functioning postintervention.
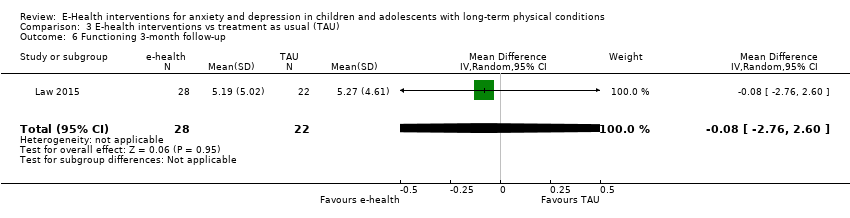
Comparison 3 E‐health interventions vs treatment as usual (TAU), Outcome 6 Functioning 3‐month follow‐up.
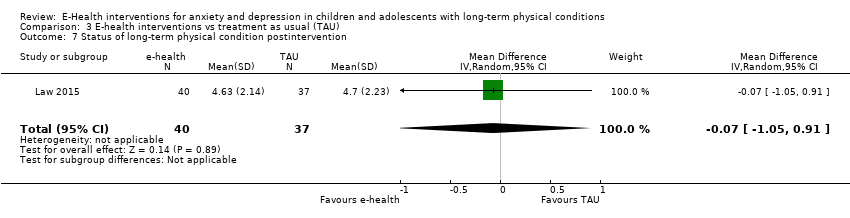
Comparison 3 E‐health interventions vs treatment as usual (TAU), Outcome 7 Status of long‐term physical condition postintervention.
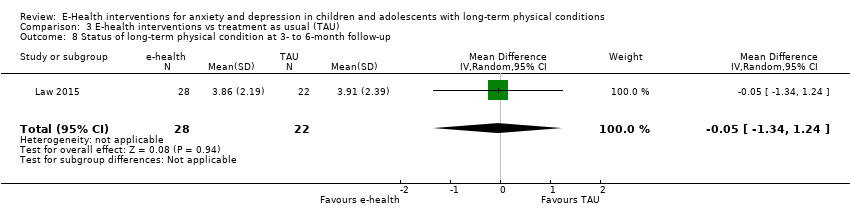
Comparison 3 E‐health interventions vs treatment as usual (TAU), Outcome 8 Status of long‐term physical condition at 3‐ to 6‐month follow‐up.
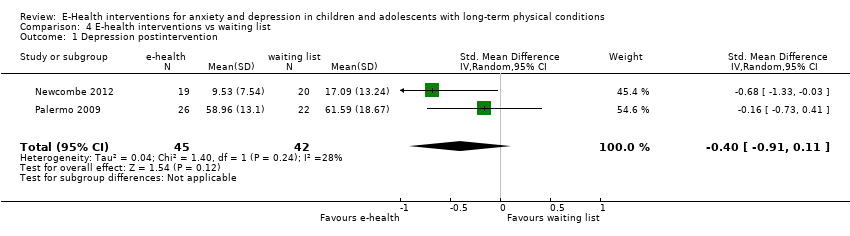
Comparison 4 E‐health interventions vs waiting list, Outcome 1 Depression postintervention.

Comparison 4 E‐health interventions vs waiting list, Outcome 2 Functioning postintervention.

Comparison 4 E‐health interventions vs waiting list, Outcome 3 Status of long‐term physical condition postintervention.
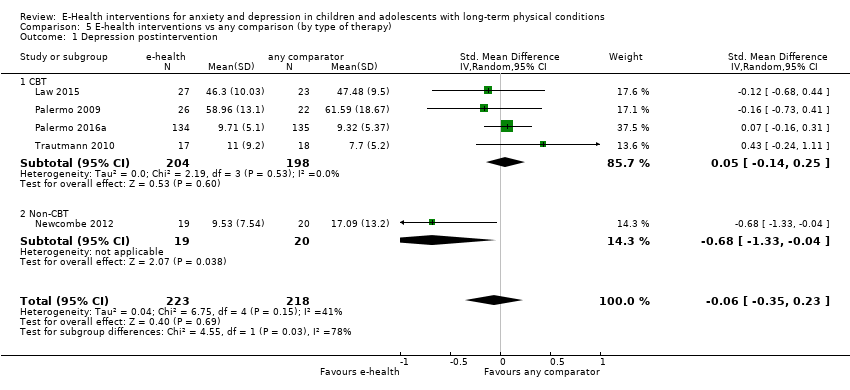
Comparison 5 E‐health interventions vs any comparison (by type of therapy), Outcome 1 Depression postintervention.
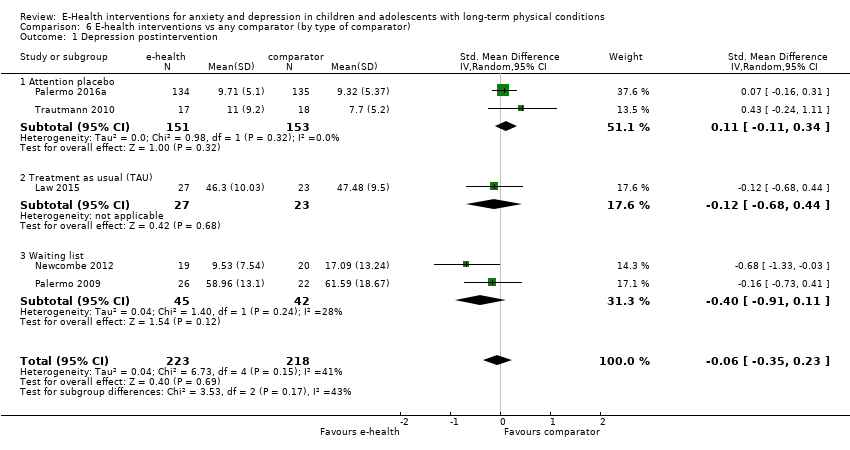
Comparison 6 E‐health interventions vs any comparator (by type of comparator), Outcome 1 Depression postintervention.
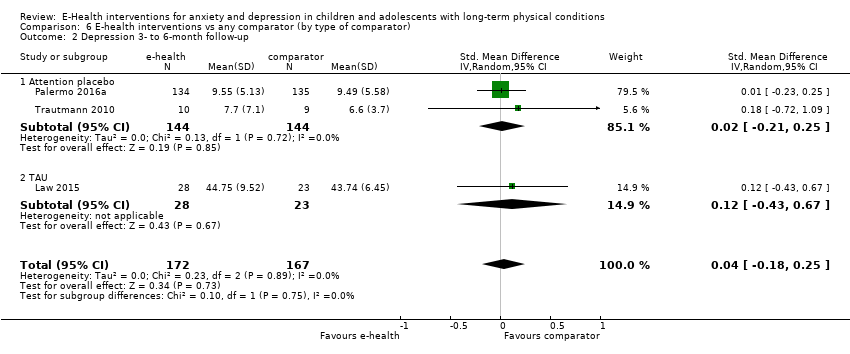
Comparison 6 E‐health interventions vs any comparator (by type of comparator), Outcome 2 Depression 3‐ to 6‐month follow‐up.
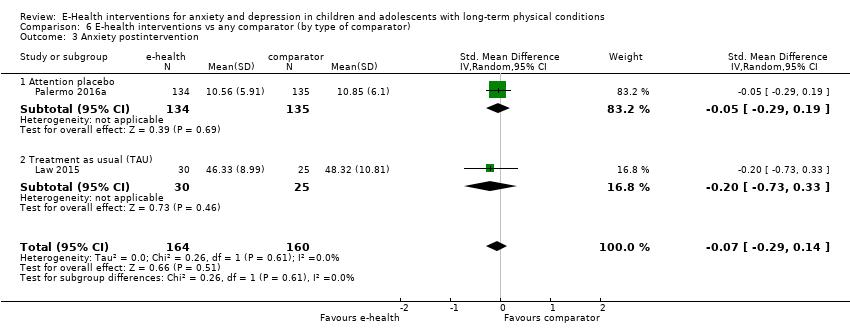
Comparison 6 E‐health interventions vs any comparator (by type of comparator), Outcome 3 Anxiety postintervention.
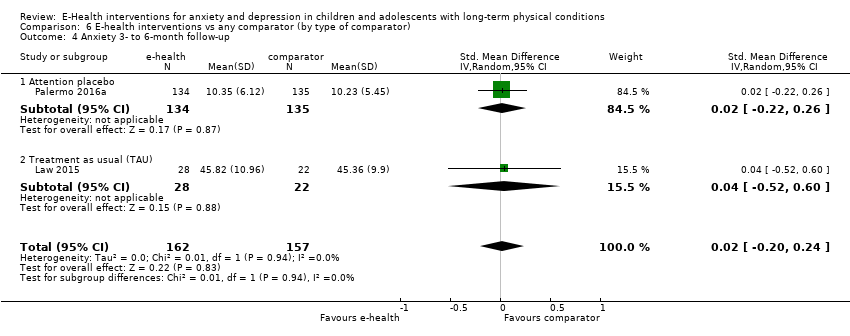
Comparison 6 E‐health interventions vs any comparator (by type of comparator), Outcome 4 Anxiety 3‐ to 6‐month follow‐up.
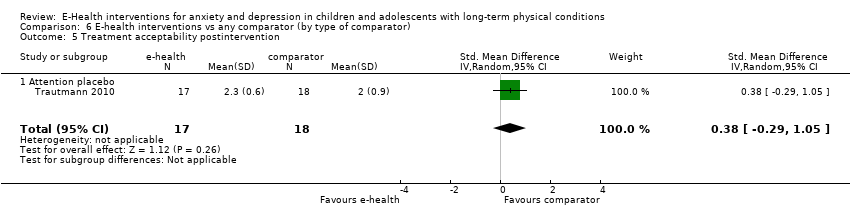
Comparison 6 E‐health interventions vs any comparator (by type of comparator), Outcome 5 Treatment acceptability postintervention.
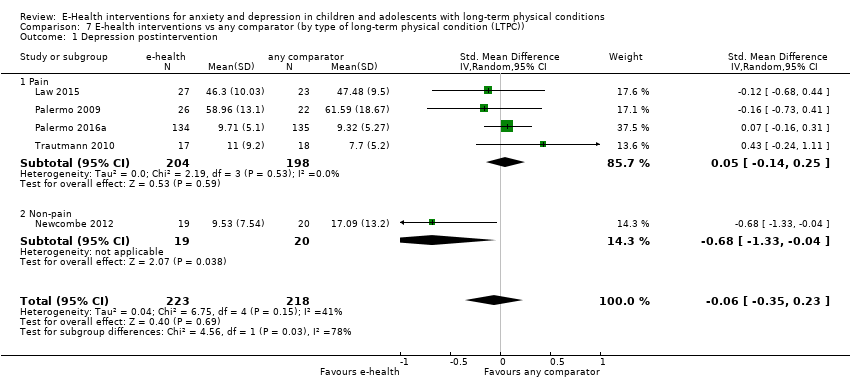
Comparison 7 E‐health interventions vs any comparator (by type of long‐term physical condition (LTPC)), Outcome 1 Depression postintervention.
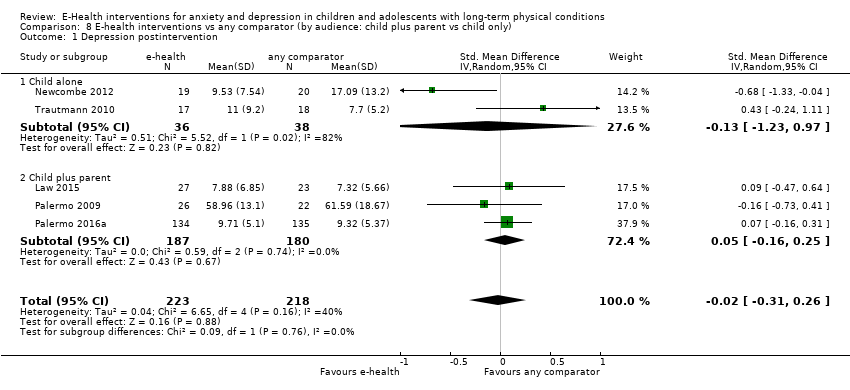
Comparison 8 E‐health interventions vs any comparator (by audience: child plus parent vs child only), Outcome 1 Depression postintervention.
| E‐healthinterventions versus any comparator for anxiety and depression in children and adolescents with long‐term physical conditions | ||||||
| Patient or population: children and adolescents, aged 10 to 18 years, with long‐term physical conditions | ||||||
| Outcomes | Anticipated absolute effects* (95% CI) | Relative effect | № of participants | Quality of the evidence | Comments | |
| Risk with any comparator | Risk with e‐health interventions | |||||
| Depression (postintervention) | The mean self‐reported depression score in the intervention group was 0.06 standard mean deviations lower (0.35 lower to 0.23 higher) | ‐ | 441 | ⊕⊝⊝⊝ | A standard mean deviation of ‐0.06 represents a small difference between groups | |
| Anxiety (postintervention) | The mean self‐reported anxiety score in the intervention group was 0.07 standard mean deviations lower (0.29 lower to 0.14 higher) | ‐ | 324 | ⊕⊝⊝⊝ | A standard mean deviation of ‐0.07 represents a small difference between groups | |
| Treatment acceptability (postintervention) | The mean self‐reported treatment acceptability score in the intervention group was 0.46 standard mean deviations higher (0.23 higher to 0.69 higher) | ‐ | 304 | ⊕⊝⊝⊝ | A standard mean deviation of 0.46 represents a small difference between groups | |
| Quality of life (postintervention) | The mean self‐reported quality of life score in the intervention group was 0.83 standard mean deviations lower | ‐ | 34 | ⊕⊝⊝⊝ | A standard mean deviation of ‐0.83 represents a large difference between groups | |
| Functioning (postintervention) | The mean self‐reported level of functioning in the intervention group was 0.08 standard mean deviations lower | ‐ | 368 | ⊕⊝⊝⊝ | A standard mean deviation of ‐0.08 represents a small difference between groups | |
| Status of long‐term physical condition (postintervention) | The mean self‐reported long‐term physical condition symptom score was 0.06 standard mean deviations higher | ‐ | 463 | ⊕⊕⊝⊝ | A standard mean deviation of 0.06 represents a small difference between groups | |
| *The risk in the intervention group (and its 95% confidence interval) is based on the assumed risk in the comparison group and the relative effect of the intervention (and its 95% CI). | ||||||
| GRADE Working Group grades of evidence | ||||||
| a We downgraded quality due to a lack of clarity about blinding of participants and outcome assessors, incomplete outcome data, and the fact that all studies were conducted by the developers of the e‐health interventions. b We downgraded for inconsistency due to studies having moderate heterogeneity. c We downgraded for indirectness because most or all of the interventions were not designed to treat anxiety or depression as the primary focus. d We downgraded for imprecision as the upper and lower limits of the confidence intervals include both potential for harm and potential for benefit e We downgraded for imprecision as the total sample size was less than 400 as per guidance from the Consumer and Communication Cochrane Review Group (Ryan 2016) | ||||||
| Outcome or subgroup title | No. of studies | No. of participants | Statistical method | Effect size |
| 1 Depression postintervention Show forest plot | 5 | 441 | Std. Mean Difference (IV, Random, 95% CI) | ‐0.06 [‐0.35, 0.23] |
| 2 Depression 3‐ to 6‐month follow‐up Show forest plot | 3 | 339 | Std. Mean Difference (IV, Random, 95% CI) | 0.04 [‐0.18, 0.25] |
| 3 Anxiety postintervention Show forest plot | 2 | 324 | Std. Mean Difference (IV, Random, 95% CI) | ‐0.07 [‐0.29, 0.14] |
| 4 Anxiety 3‐ to 6‐month follow‐up Show forest plot | 2 | 319 | Std. Mean Difference (IV, Random, 95% CI) | 0.02 [‐0.20, 0.24] |
| 5 Treatment acceptability postintervention Show forest plot | 2 | 304 | Std. Mean Difference (IV, Random, 95% CI) | 0.46 [0.23, 0.69] |
| 6 Quality of life postintervention Show forest plot | 1 | 34 | Mean Difference (IV, Random, 95% CI) | ‐0.30 [‐0.54, ‐0.06] |
| 7 Quality of life 3‐ to 6‐month follow‐up Show forest plot | 1 | 22 | Mean Difference (IV, Random, 95% CI) | 0.10 [‐0.19, 0.39] |
| 8 Functioning postintervention Show forest plot | 3 | 368 | Std. Mean Difference (IV, Random, 95% CI) | ‐0.08 [‐0.33, 0.18] |
| 9 Functioning 3‐ to 6‐month follow‐up Show forest plot | 2 | 319 | Std. Mean Difference (IV, Random, 95% CI) | ‐0.13 [‐0.35, 0.09] |
| 10 Status of long‐term physical condition postintervention Show forest plot | 5 | 463 | Std. Mean Difference (IV, Random, 95% CI) | 0.06 [‐0.12, 0.24] |
| 11 Status of long‐term physical condition 3‐ to 6‐month follow‐up Show forest plot | 3 | 340 | Std. Mean Difference (IV, Random, 95% CI) | 0.10 [‐0.11, 0.32] |
| Outcome or subgroup title | No. of studies | No. of participants | Statistical method | Effect size |
| 1 Depression postintervention Show forest plot | 2 | 304 | Std. Mean Difference (IV, Random, 95% CI) | 0.11 [‐0.11, 0.34] |
| 2 Depression 3‐ to 6‐month follow‐up Show forest plot | 2 | 288 | Std. Mean Difference (IV, Random, 95% CI) | 0.02 [‐0.21, 0.25] |
| 3 Anxiety postintervention Show forest plot | 1 | 269 | Mean Difference (IV, Random, 95% CI) | ‐0.29 [‐1.73, 1.15] |
| 4 Anxiety 3‐ to 6‐month follow‐up Show forest plot | 1 | 269 | Mean Difference (IV, Random, 95% CI) | 0.12 [‐1.27, 1.51] |
| 5 Treatment acceptability postintervention Show forest plot | 2 | 304 | Std. Mean Difference (IV, Random, 95% CI) | 0.46 [0.23, 0.69] |
| 6 Quality of life postintervention Show forest plot | 1 | 34 | Mean Difference (IV, Random, 95% CI) | ‐0.30 [‐0.54, ‐0.06] |
| 7 Quality of life 6‐month follow‐up Show forest plot | 1 | 22 | Mean Difference (IV, Random, 95% CI) | 0.10 [‐0.19, 0.39] |
| 8 Functioning postintervention Show forest plot | 1 | 269 | Mean Difference (IV, Random, 95% CI) | 0.03 [‐1.05, 1.11] |
| 9 Functioning 3‐ to 6‐month follow‐up Show forest plot | 1 | 269 | Mean Difference (IV, Random, 95% CI) | ‐0.72 [‐1.84, 0.40] |
| 10 Status of long‐term physical condition postintervention Show forest plot | 2 | 302 | Std. Mean Difference (IV, Random, 95% CI) | 0.03 [‐0.34, 0.40] |
| 11 Status of long‐term physical condition 3‐ to 6‐month follow‐up Show forest plot | 2 | 290 | Std. Mean Difference (IV, Random, 95% CI) | 0.13 [‐0.10, 0.36] |
| Outcome or subgroup title | No. of studies | No. of participants | Statistical method | Effect size |
| 1 Depression postintervention Show forest plot | 1 | 50 | Mean Difference (IV, Random, 95% CI) | ‐1.18 [‐6.60, 4.24] |
| 2 Depression 3‐month follow‐up Show forest plot | 1 | 51 | Mean Difference (IV, Random, 95% CI) | 1.01 [‐3.39, 5.41] |
| 3 Anxiety postintervention Show forest plot | 1 | 55 | Mean Difference (IV, Random, 95% CI) | ‐1.99 [‐7.31, 3.33] |
| 4 Anxiety 3‐month follow‐up Show forest plot | 1 | 50 | Mean Difference (IV, Random, 95% CI) | 0.46 [‐5.34, 6.26] |
| 5 Functioning postintervention Show forest plot | 1 | 57 | Mean Difference (IV, Random, 95% CI) | ‐0.03 [‐2.56, 2.50] |
| 6 Functioning 3‐month follow‐up Show forest plot | 1 | 50 | Mean Difference (IV, Random, 95% CI) | ‐0.08 [‐2.76, 2.60] |
| 7 Status of long‐term physical condition postintervention Show forest plot | 1 | 77 | Mean Difference (IV, Random, 95% CI) | ‐0.07 [‐1.05, 0.91] |
| 8 Status of long‐term physical condition at 3‐ to 6‐month follow‐up Show forest plot | 1 | 50 | Mean Difference (IV, Random, 95% CI) | ‐0.05 [‐1.34, 1.24] |
| Outcome or subgroup title | No. of studies | No. of participants | Statistical method | Effect size |
| 1 Depression postintervention Show forest plot | 2 | 87 | Std. Mean Difference (IV, Random, 95% CI) | ‐0.40 [‐0.91, 0.11] |
| 2 Functioning postintervention Show forest plot | 1 | 48 | Mean Difference (IV, Random, 95% CI) | ‐3.31 [‐6.90, 0.28] |
| 3 Status of long‐term physical condition postintervention Show forest plot | 2 | 84 | Std. Mean Difference (IV, Random, 95% CI) | 0.08 [‐0.55, 0.72] |
| Outcome or subgroup title | No. of studies | No. of participants | Statistical method | Effect size |
| 1 Depression postintervention Show forest plot | 5 | 441 | Std. Mean Difference (IV, Random, 95% CI) | ‐0.06 [‐0.35, 0.23] |
| 1.1 CBT | 4 | 402 | Std. Mean Difference (IV, Random, 95% CI) | 0.05 [‐0.14, 0.25] |
| 1.2 Non‐CBT | 1 | 39 | Std. Mean Difference (IV, Random, 95% CI) | ‐0.68 [‐1.33, ‐0.04] |
| Outcome or subgroup title | No. of studies | No. of participants | Statistical method | Effect size |
| 1 Depression postintervention Show forest plot | 5 | 441 | Std. Mean Difference (IV, Random, 95% CI) | ‐0.06 [‐0.35, 0.23] |
| 1.1 Attention placebo | 2 | 304 | Std. Mean Difference (IV, Random, 95% CI) | 0.11 [‐0.11, 0.34] |
| 1.2 Treatment as usual (TAU) | 1 | 50 | Std. Mean Difference (IV, Random, 95% CI) | ‐0.12 [‐0.68, 0.44] |
| 1.3 Waiting list | 2 | 87 | Std. Mean Difference (IV, Random, 95% CI) | ‐0.40 [‐0.91, 0.11] |
| 2 Depression 3‐ to 6‐month follow‐up Show forest plot | 3 | 339 | Std. Mean Difference (IV, Random, 95% CI) | 0.04 [‐0.18, 0.25] |
| 2.1 Attention placebo | 2 | 288 | Std. Mean Difference (IV, Random, 95% CI) | 0.02 [‐0.21, 0.25] |
| 2.2 TAU | 1 | 51 | Std. Mean Difference (IV, Random, 95% CI) | 0.12 [‐0.43, 0.67] |
| 3 Anxiety postintervention Show forest plot | 2 | 324 | Std. Mean Difference (IV, Random, 95% CI) | ‐0.07 [‐0.29, 0.14] |
| 3.1 Attention placebo | 1 | 269 | Std. Mean Difference (IV, Random, 95% CI) | ‐0.05 [‐0.29, 0.19] |
| 3.2 Treatment as usual (TAU) | 1 | 55 | Std. Mean Difference (IV, Random, 95% CI) | ‐0.20 [‐0.73, 0.33] |
| 4 Anxiety 3‐ to 6‐month follow‐up Show forest plot | 2 | 319 | Std. Mean Difference (IV, Random, 95% CI) | 0.02 [‐0.20, 0.24] |
| 4.1 Attention placebo | 1 | 269 | Std. Mean Difference (IV, Random, 95% CI) | 0.02 [‐0.22, 0.26] |
| 4.2 Treatment as usual (TAU) | 1 | 50 | Std. Mean Difference (IV, Random, 95% CI) | 0.04 [‐0.52, 0.60] |
| 5 Treatment acceptability postintervention Show forest plot | 1 | 35 | Std. Mean Difference (IV, Random, 95% CI) | 0.38 [‐0.29, 1.05] |
| 5.1 Attention placebo | 1 | 35 | Std. Mean Difference (IV, Random, 95% CI) | 0.38 [‐0.29, 1.05] |
| Outcome or subgroup title | No. of studies | No. of participants | Statistical method | Effect size |
| 1 Depression postintervention Show forest plot | 5 | 441 | Std. Mean Difference (IV, Random, 95% CI) | ‐0.06 [‐0.35, 0.23] |
| 1.1 Pain | 4 | 402 | Std. Mean Difference (IV, Random, 95% CI) | 0.05 [‐0.14, 0.25] |
| 1.2 Non‐pain | 1 | 39 | Std. Mean Difference (IV, Random, 95% CI) | ‐0.68 [‐1.33, ‐0.04] |
| Outcome or subgroup title | No. of studies | No. of participants | Statistical method | Effect size |
| 1 Depression postintervention Show forest plot | 5 | 441 | Std. Mean Difference (IV, Random, 95% CI) | ‐0.02 [‐0.31, 0.26] |
| 1.1 Child alone | 2 | 74 | Std. Mean Difference (IV, Random, 95% CI) | ‐0.13 [‐1.23, 0.97] |
| 1.2 Child plus parent | 3 | 367 | Std. Mean Difference (IV, Random, 95% CI) | 0.05 [‐0.16, 0.25] |