Scolaris Content Display Scolaris Content Display

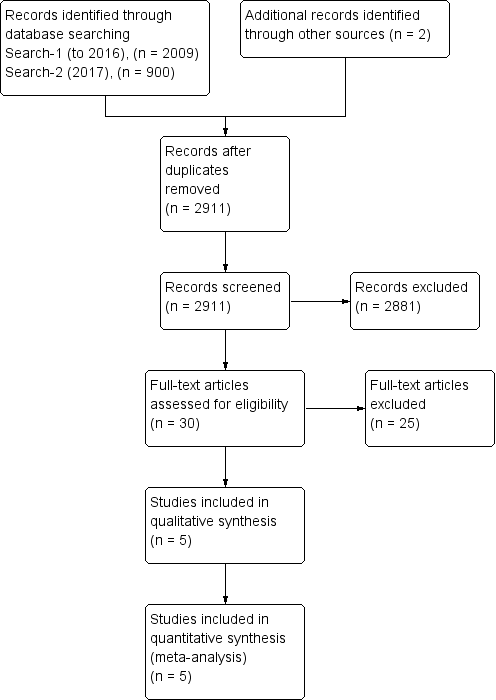
Study flow diagram.
Figuras y tablas -
Figure 1

Study flow diagram.

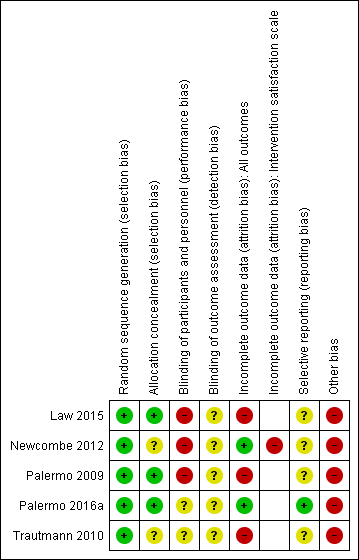
Risk of bias summary: review authors' judgements about each risk of bias item for each included study
Figuras y tablas -
Figure 2

Risk of bias summary: review authors' judgements about each risk of bias item for each included study

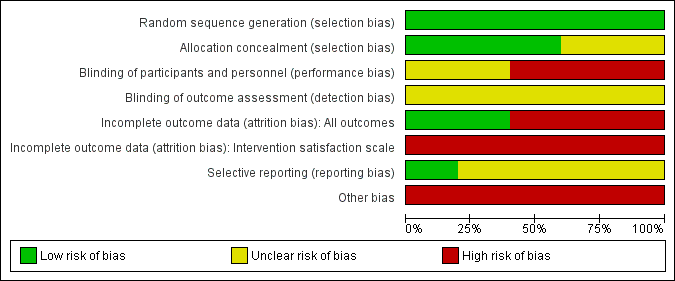
Risk of bias graph: review authors' judgements about each risk of bias item presented as percentages across all included studies
Figuras y tablas -
Figure 3

Risk of bias graph: review authors' judgements about each risk of bias item presented as percentages across all included studies

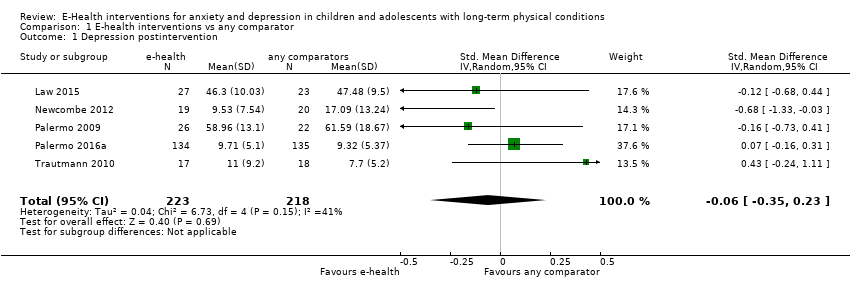
Comparison 1 E‐health interventions vs any comparator, Outcome 1 Depression postintervention.
Figuras y tablas -
Analysis 1.1

Comparison 1 E‐health interventions vs any comparator, Outcome 1 Depression postintervention.

Comparison 1 E‐health interventions vs any comparator, Outcome 2 Depression 3‐ to 6‐month follow‐up.
Figuras y tablas -
Analysis 1.2

Comparison 1 E‐health interventions vs any comparator, Outcome 2 Depression 3‐ to 6‐month follow‐up.

Comparison 1 E‐health interventions vs any comparator, Outcome 3 Anxiety postintervention.
Figuras y tablas -
Analysis 1.3

Comparison 1 E‐health interventions vs any comparator, Outcome 3 Anxiety postintervention.

Comparison 1 E‐health interventions vs any comparator, Outcome 4 Anxiety 3‐ to 6‐month follow‐up.
Figuras y tablas -
Analysis 1.4

Comparison 1 E‐health interventions vs any comparator, Outcome 4 Anxiety 3‐ to 6‐month follow‐up.

Comparison 1 E‐health interventions vs any comparator, Outcome 5 Treatment acceptability postintervention.
Figuras y tablas -
Analysis 1.5

Comparison 1 E‐health interventions vs any comparator, Outcome 5 Treatment acceptability postintervention.

Comparison 1 E‐health interventions vs any comparator, Outcome 6 Quality of life postintervention.
Figuras y tablas -
Analysis 1.6

Comparison 1 E‐health interventions vs any comparator, Outcome 6 Quality of life postintervention.

Comparison 1 E‐health interventions vs any comparator, Outcome 7 Quality of life 3‐ to 6‐month follow‐up.
Figuras y tablas -
Analysis 1.7

Comparison 1 E‐health interventions vs any comparator, Outcome 7 Quality of life 3‐ to 6‐month follow‐up.

Comparison 1 E‐health interventions vs any comparator, Outcome 8 Functioning postintervention.
Figuras y tablas -
Analysis 1.8

Comparison 1 E‐health interventions vs any comparator, Outcome 8 Functioning postintervention.

Comparison 1 E‐health interventions vs any comparator, Outcome 9 Functioning 3‐ to 6‐month follow‐up.
Figuras y tablas -
Analysis 1.9

Comparison 1 E‐health interventions vs any comparator, Outcome 9 Functioning 3‐ to 6‐month follow‐up.

Comparison 1 E‐health interventions vs any comparator, Outcome 10 Status of long‐term physical condition postintervention.
Figuras y tablas -
Analysis 1.10

Comparison 1 E‐health interventions vs any comparator, Outcome 10 Status of long‐term physical condition postintervention.

Comparison 1 E‐health interventions vs any comparator, Outcome 11 Status of long‐term physical condition 3‐ to 6‐month follow‐up.
Figuras y tablas -
Analysis 1.11
Comparison 1 E‐health interventions vs any comparator, Outcome 11 Status of long‐term physical condition 3‐ to 6‐month follow‐up.

Comparison 2 E‐health interventions vs attention placebo, Outcome 1 Depression postintervention.
Figuras y tablas -
Analysis 2.1

Comparison 2 E‐health interventions vs attention placebo, Outcome 1 Depression postintervention.

Comparison 2 E‐health interventions vs attention placebo, Outcome 2 Depression 3‐ to 6‐month follow‐up.
Figuras y tablas -
Analysis 2.2

Comparison 2 E‐health interventions vs attention placebo, Outcome 2 Depression 3‐ to 6‐month follow‐up.

Comparison 2 E‐health interventions vs attention placebo, Outcome 3 Anxiety postintervention.
Figuras y tablas -
Analysis 2.3

Comparison 2 E‐health interventions vs attention placebo, Outcome 3 Anxiety postintervention.

Comparison 2 E‐health interventions vs attention placebo, Outcome 4 Anxiety 3‐ to 6‐month follow‐up.
Figuras y tablas -
Analysis 2.4

Comparison 2 E‐health interventions vs attention placebo, Outcome 4 Anxiety 3‐ to 6‐month follow‐up.

Comparison 2 E‐health interventions vs attention placebo, Outcome 5 Treatment acceptability postintervention.
Figuras y tablas -
Analysis 2.5

Comparison 2 E‐health interventions vs attention placebo, Outcome 5 Treatment acceptability postintervention.

Comparison 2 E‐health interventions vs attention placebo, Outcome 6 Quality of life postintervention.
Figuras y tablas -
Analysis 2.6

Comparison 2 E‐health interventions vs attention placebo, Outcome 6 Quality of life postintervention.

Comparison 2 E‐health interventions vs attention placebo, Outcome 7 Quality of life 6‐month follow‐up.
Figuras y tablas -
Analysis 2.7

Comparison 2 E‐health interventions vs attention placebo, Outcome 7 Quality of life 6‐month follow‐up.

Comparison 2 E‐health interventions vs attention placebo, Outcome 8 Functioning postintervention.
Figuras y tablas -
Analysis 2.8

Comparison 2 E‐health interventions vs attention placebo, Outcome 8 Functioning postintervention.

Comparison 2 E‐health interventions vs attention placebo, Outcome 9 Functioning 3‐ to 6‐month follow‐up.
Figuras y tablas -
Analysis 2.9

Comparison 2 E‐health interventions vs attention placebo, Outcome 9 Functioning 3‐ to 6‐month follow‐up.

Comparison 2 E‐health interventions vs attention placebo, Outcome 10 Status of long‐term physical condition postintervention.
Figuras y tablas -
Analysis 2.10

Comparison 2 E‐health interventions vs attention placebo, Outcome 10 Status of long‐term physical condition postintervention.

Comparison 2 E‐health interventions vs attention placebo, Outcome 11 Status of long‐term physical condition 3‐ to 6‐month follow‐up.
Figuras y tablas -
Analysis 2.11

Comparison 2 E‐health interventions vs attention placebo, Outcome 11 Status of long‐term physical condition 3‐ to 6‐month follow‐up.

Comparison 3 E‐health interventions vs treatment as usual (TAU), Outcome 1 Depression postintervention.
Figuras y tablas -
Analysis 3.1

Comparison 3 E‐health interventions vs treatment as usual (TAU), Outcome 1 Depression postintervention.

Comparison 3 E‐health interventions vs treatment as usual (TAU), Outcome 2 Depression 3‐month follow‐up.
Figuras y tablas -
Analysis 3.2

Comparison 3 E‐health interventions vs treatment as usual (TAU), Outcome 2 Depression 3‐month follow‐up.

Comparison 3 E‐health interventions vs treatment as usual (TAU), Outcome 3 Anxiety postintervention.
Figuras y tablas -
Analysis 3.3

Comparison 3 E‐health interventions vs treatment as usual (TAU), Outcome 3 Anxiety postintervention.

Comparison 3 E‐health interventions vs treatment as usual (TAU), Outcome 4 Anxiety 3‐month follow‐up.
Figuras y tablas -
Analysis 3.4

Comparison 3 E‐health interventions vs treatment as usual (TAU), Outcome 4 Anxiety 3‐month follow‐up.

Comparison 3 E‐health interventions vs treatment as usual (TAU), Outcome 5 Functioning postintervention.
Figuras y tablas -
Analysis 3.5

Comparison 3 E‐health interventions vs treatment as usual (TAU), Outcome 5 Functioning postintervention.

Comparison 3 E‐health interventions vs treatment as usual (TAU), Outcome 6 Functioning 3‐month follow‐up.
Figuras y tablas -
Analysis 3.6

Comparison 3 E‐health interventions vs treatment as usual (TAU), Outcome 6 Functioning 3‐month follow‐up.

Comparison 3 E‐health interventions vs treatment as usual (TAU), Outcome 7 Status of long‐term physical condition postintervention.
Figuras y tablas -
Analysis 3.7

Comparison 3 E‐health interventions vs treatment as usual (TAU), Outcome 7 Status of long‐term physical condition postintervention.

Comparison 3 E‐health interventions vs treatment as usual (TAU), Outcome 8 Status of long‐term physical condition at 3‐ to 6‐month follow‐up.
Figuras y tablas -
Analysis 3.8

Comparison 3 E‐health interventions vs treatment as usual (TAU), Outcome 8 Status of long‐term physical condition at 3‐ to 6‐month follow‐up.

Comparison 4 E‐health interventions vs waiting list, Outcome 1 Depression postintervention.
Figuras y tablas -
Analysis 4.1

Comparison 4 E‐health interventions vs waiting list, Outcome 1 Depression postintervention.

Comparison 4 E‐health interventions vs waiting list, Outcome 2 Functioning postintervention.
Figuras y tablas -
Analysis 4.2

Comparison 4 E‐health interventions vs waiting list, Outcome 2 Functioning postintervention.

Comparison 4 E‐health interventions vs waiting list, Outcome 3 Status of long‐term physical condition postintervention.
Figuras y tablas -
Analysis 4.3

Comparison 4 E‐health interventions vs waiting list, Outcome 3 Status of long‐term physical condition postintervention.

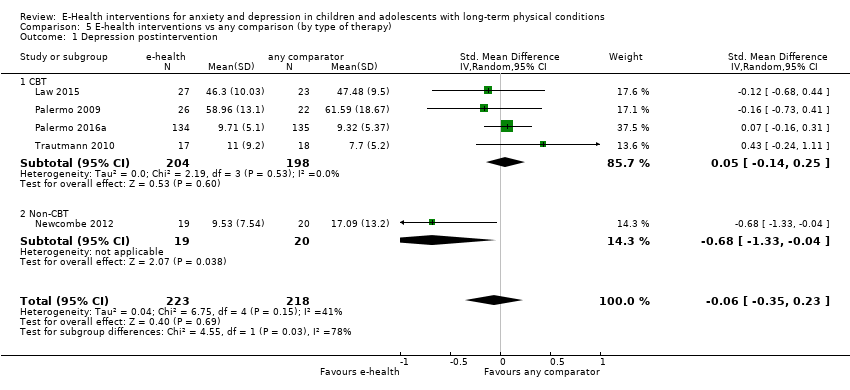
Comparison 5 E‐health interventions vs any comparison (by type of therapy), Outcome 1 Depression postintervention.
Figuras y tablas -
Analysis 5.1

Comparison 5 E‐health interventions vs any comparison (by type of therapy), Outcome 1 Depression postintervention.

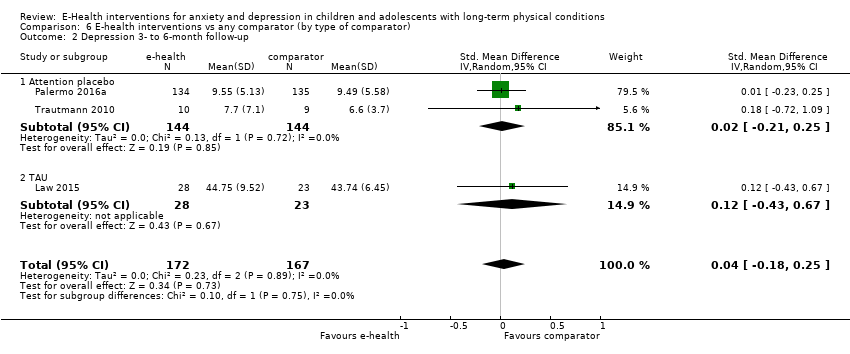
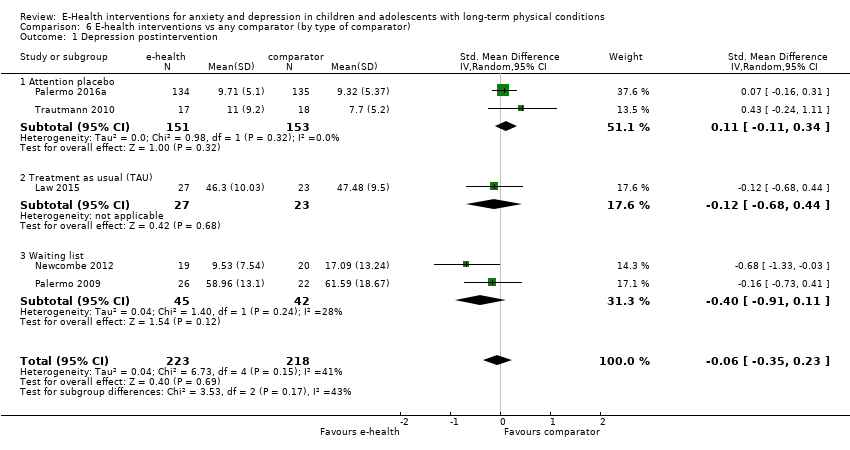
Comparison 6 E‐health interventions vs any comparator (by type of comparator), Outcome 1 Depression postintervention.
Figuras y tablas -
Analysis 6.1

Comparison 6 E‐health interventions vs any comparator (by type of comparator), Outcome 1 Depression postintervention.

Comparison 6 E‐health interventions vs any comparator (by type of comparator), Outcome 2 Depression 3‐ to 6‐month follow‐up.
Figuras y tablas -
Analysis 6.2

Comparison 6 E‐health interventions vs any comparator (by type of comparator), Outcome 2 Depression 3‐ to 6‐month follow‐up.

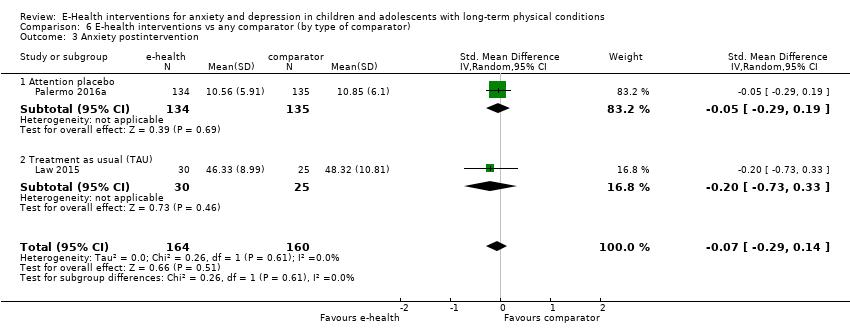
Comparison 6 E‐health interventions vs any comparator (by type of comparator), Outcome 3 Anxiety postintervention.
Figuras y tablas -
Analysis 6.3

Comparison 6 E‐health interventions vs any comparator (by type of comparator), Outcome 3 Anxiety postintervention.

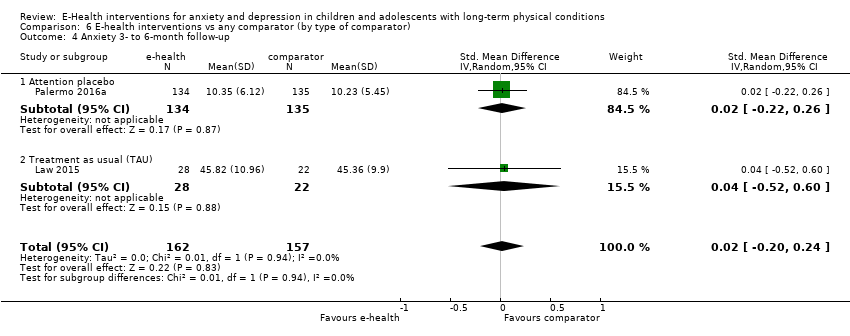
Comparison 6 E‐health interventions vs any comparator (by type of comparator), Outcome 4 Anxiety 3‐ to 6‐month follow‐up.
Figuras y tablas -
Analysis 6.4

Comparison 6 E‐health interventions vs any comparator (by type of comparator), Outcome 4 Anxiety 3‐ to 6‐month follow‐up.

Comparison 6 E‐health interventions vs any comparator (by type of comparator), Outcome 5 Treatment acceptability postintervention.
Figuras y tablas -
Analysis 6.5

Comparison 6 E‐health interventions vs any comparator (by type of comparator), Outcome 5 Treatment acceptability postintervention.

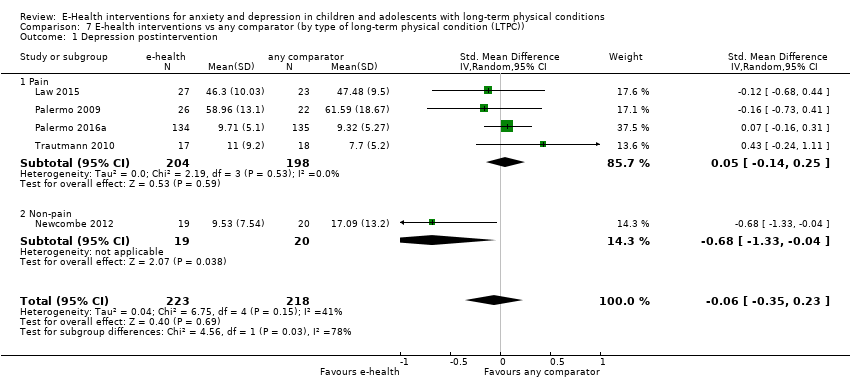
Comparison 7 E‐health interventions vs any comparator (by type of long‐term physical condition (LTPC)), Outcome 1 Depression postintervention.
Figuras y tablas -
Analysis 7.1

Comparison 7 E‐health interventions vs any comparator (by type of long‐term physical condition (LTPC)), Outcome 1 Depression postintervention.

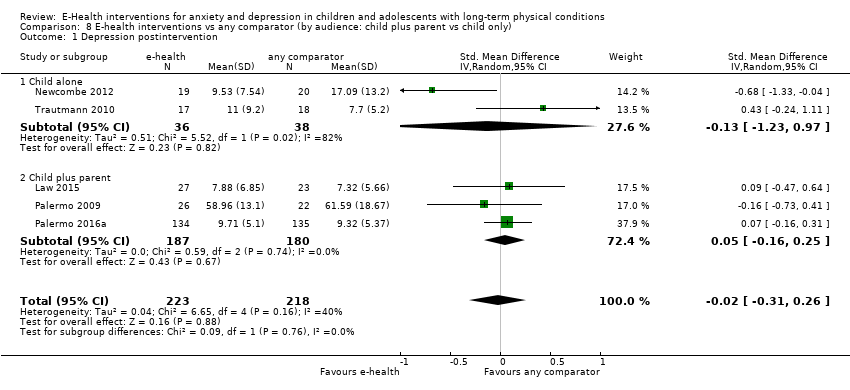
Comparison 8 E‐health interventions vs any comparator (by audience: child plus parent vs child only), Outcome 1 Depression postintervention.
Figuras y tablas -
Analysis 8.1

Comparison 8 E‐health interventions vs any comparator (by audience: child plus parent vs child only), Outcome 1 Depression postintervention.

Summary of findings for the main comparison. EHealth interventions compared to any comparator for anxiety and depression in children and adolescents with long‐term physical conditions

E‐healthinterventions versus any comparator for anxiety and depression in children and adolescents with long‐term physical conditions

Patient or population: children and adolescents, aged 10 to 18 years, with long‐term physical conditions
Setting: paediatric outpatient clinics and community
Intervention: e‐health interventions
Comparison: any comparator, including attention placebo, treatment as usual, and waiting list

Outcomes

Anticipated absolute effects* (95% CI)

Relative effect
(95% CI)

№ of participants
(studies)

Quality of the evidence
(GRADE)

Comments

Risk with any comparator

Risk with e‐health interventions

Depression (postintervention)

The mean self‐reported depression score in the intervention group was 0.06 standard mean deviations lower (0.35 lower to 0.23 higher)

441
(5 RCTs)

⊕⊝⊝⊝
VERY LOW a, b, c, d

A standard mean deviation of ‐0.06 represents a small difference between groups

Anxiety (postintervention)

The mean self‐reported anxiety score in the intervention group was 0.07 standard mean deviations lower (0.29 lower to 0.14 higher)

324
(2 RCTs)

⊕⊝⊝⊝
VERY LOW a, c, e

A standard mean deviation of ‐0.07 represents a small difference between groups

Treatment acceptability (postintervention)

The mean self‐reported treatment acceptability score in the intervention group was 0.46 standard mean deviations higher (0.23 higher to 0.69 higher)

304
(2 RCTs)

⊕⊝⊝⊝
VERY LOW a, c, e

A standard mean deviation of 0.46 represents a small difference between groups

Quality of life (postintervention)

The mean self‐reported quality of life score in the intervention group was 0.83 standard mean deviations lower
(1.53 lower to 0.12 lower)

34
(1 RCT)

⊕⊝⊝⊝
VERY LOW a, c, e

A standard mean deviation of ‐0.83 represents a large difference between groups

Functioning (postintervention)

The mean self‐reported level of functioning in the intervention group was 0.08 standard mean deviations lower
(0.33 lower to 0.18 higher)

368
(3 RCTs)

⊕⊝⊝⊝
VERY LOW a, c, e

A standard mean deviation of ‐0.08 represents a small difference between groups

Status of long‐term physical condition (postintervention)

The mean self‐reported long‐term physical condition symptom score was 0.06 standard mean deviations higher
(0.12 lower to 0.24 higher)

463
(5 RCTs)

⊕⊕⊝⊝
LOW a, c

A standard mean deviation of 0.06 represents a small difference between groups

*The risk in the intervention group (and its 95% confidence interval) is based on the assumed risk in the comparison group and the relative effect of the intervention (and its 95% CI).

CI: Confidence interval; RR: Risk ratio; OR: Odds ratio;

GRADE Working Group grades of evidence
High quality: We are very confident that the true effect lies close to that of the estimate of the effect
Moderate quality: We are moderately confident in the effect estimate: The true effect is likely to be close to the estimate of the effect, but there is a possibility that it is substantially different
Low quality: Our confidence in the effect estimate is limited: The true effect may be substantially different from the estimate of the effect
Very low quality: We have very little confidence in the effect estimate: The true effect is likely to be substantially different from the estimate of effect

a We downgraded quality due to a lack of clarity about blinding of participants and outcome assessors, incomplete outcome data, and the fact that all studies were conducted by the developers of the e‐health interventions.

b We downgraded for inconsistency due to studies having moderate heterogeneity.

c We downgraded for indirectness because most or all of the interventions were not designed to treat anxiety or depression as the primary focus.

d We downgraded for imprecision as the upper and lower limits of the confidence intervals include both potential for harm and potential for benefit

e We downgraded for imprecision as the total sample size was less than 400 as per guidance from the Consumer and Communication Cochrane Review Group (Ryan 2016)

Figuras y tablas -
Summary of findings for the main comparison. EHealth interventions compared to any comparator for anxiety and depression in children and adolescents with long‐term physical conditions
Comparison 1. E‐health interventions vs any comparator

Outcome or subgroup title

No. of studies

No. of participants

Statistical method

Effect size

1 Depression postintervention Show forest plot

5

441

Std. Mean Difference (IV, Random, 95% CI)

‐0.06 [‐0.35, 0.23]

2 Depression 3‐ to 6‐month follow‐up Show forest plot

3

339

Std. Mean Difference (IV, Random, 95% CI)

0.04 [‐0.18, 0.25]

3 Anxiety postintervention Show forest plot

2

324

Std. Mean Difference (IV, Random, 95% CI)

‐0.07 [‐0.29, 0.14]

4 Anxiety 3‐ to 6‐month follow‐up Show forest plot

2

319

Std. Mean Difference (IV, Random, 95% CI)

0.02 [‐0.20, 0.24]

5 Treatment acceptability postintervention Show forest plot

2

304

Std. Mean Difference (IV, Random, 95% CI)

0.46 [0.23, 0.69]

6 Quality of life postintervention Show forest plot

1

34

Mean Difference (IV, Random, 95% CI)

‐0.30 [‐0.54, ‐0.06]

7 Quality of life 3‐ to 6‐month follow‐up Show forest plot

1

22

Mean Difference (IV, Random, 95% CI)

0.10 [‐0.19, 0.39]

8 Functioning postintervention Show forest plot

3

368

Std. Mean Difference (IV, Random, 95% CI)

‐0.08 [‐0.33, 0.18]

9 Functioning 3‐ to 6‐month follow‐up Show forest plot

2

319

Std. Mean Difference (IV, Random, 95% CI)

‐0.13 [‐0.35, 0.09]

10 Status of long‐term physical condition postintervention Show forest plot

5

463

Std. Mean Difference (IV, Random, 95% CI)

0.06 [‐0.12, 0.24]

11 Status of long‐term physical condition 3‐ to 6‐month follow‐up Show forest plot

3

340

Std. Mean Difference (IV, Random, 95% CI)

0.10 [‐0.11, 0.32]

Figuras y tablas -
Comparison 1. E‐health interventions vs any comparator
Comparison 2. E‐health interventions vs attention placebo

Outcome or subgroup title

No. of studies

No. of participants

Statistical method

Effect size

1 Depression postintervention Show forest plot

2

304

Std. Mean Difference (IV, Random, 95% CI)

0.11 [‐0.11, 0.34]

2 Depression 3‐ to 6‐month follow‐up Show forest plot

2

288

Std. Mean Difference (IV, Random, 95% CI)

0.02 [‐0.21, 0.25]

3 Anxiety postintervention Show forest plot

1

269

Mean Difference (IV, Random, 95% CI)

‐0.29 [‐1.73, 1.15]

4 Anxiety 3‐ to 6‐month follow‐up Show forest plot

1

269

Mean Difference (IV, Random, 95% CI)

0.12 [‐1.27, 1.51]

5 Treatment acceptability postintervention Show forest plot

2

304

Std. Mean Difference (IV, Random, 95% CI)

0.46 [0.23, 0.69]

6 Quality of life postintervention Show forest plot

1

34

Mean Difference (IV, Random, 95% CI)

‐0.30 [‐0.54, ‐0.06]

7 Quality of life 6‐month follow‐up Show forest plot

1

22

Mean Difference (IV, Random, 95% CI)

0.10 [‐0.19, 0.39]

8 Functioning postintervention Show forest plot

1

269

Mean Difference (IV, Random, 95% CI)

0.03 [‐1.05, 1.11]

9 Functioning 3‐ to 6‐month follow‐up Show forest plot

1

269

Mean Difference (IV, Random, 95% CI)

‐0.72 [‐1.84, 0.40]

10 Status of long‐term physical condition postintervention Show forest plot

2

302

Std. Mean Difference (IV, Random, 95% CI)

0.03 [‐0.34, 0.40]

11 Status of long‐term physical condition 3‐ to 6‐month follow‐up Show forest plot

2

290

Std. Mean Difference (IV, Random, 95% CI)

0.13 [‐0.10, 0.36]

Figuras y tablas -
Comparison 2. E‐health interventions vs attention placebo
Comparison 3. E‐health interventions vs treatment as usual (TAU)

Outcome or subgroup title

No. of studies

No. of participants

Statistical method

Effect size

1 Depression postintervention Show forest plot

1

50

Mean Difference (IV, Random, 95% CI)

‐1.18 [‐6.60, 4.24]

2 Depression 3‐month follow‐up Show forest plot

1

51

Mean Difference (IV, Random, 95% CI)

1.01 [‐3.39, 5.41]

3 Anxiety postintervention Show forest plot

1

55

Mean Difference (IV, Random, 95% CI)

‐1.99 [‐7.31, 3.33]

4 Anxiety 3‐month follow‐up Show forest plot

1

50

Mean Difference (IV, Random, 95% CI)

0.46 [‐5.34, 6.26]

5 Functioning postintervention Show forest plot

1

57

Mean Difference (IV, Random, 95% CI)

‐0.03 [‐2.56, 2.50]

6 Functioning 3‐month follow‐up Show forest plot

1

50

Mean Difference (IV, Random, 95% CI)

‐0.08 [‐2.76, 2.60]

7 Status of long‐term physical condition postintervention Show forest plot

1

77

Mean Difference (IV, Random, 95% CI)

‐0.07 [‐1.05, 0.91]

8 Status of long‐term physical condition at 3‐ to 6‐month follow‐up Show forest plot

1

50

Mean Difference (IV, Random, 95% CI)

‐0.05 [‐1.34, 1.24]

Figuras y tablas -
Comparison 3. E‐health interventions vs treatment as usual (TAU)
Comparison 4. E‐health interventions vs waiting list

Outcome or subgroup title

No. of studies

No. of participants

Statistical method

Effect size

1 Depression postintervention Show forest plot

2

87

Std. Mean Difference (IV, Random, 95% CI)

‐0.40 [‐0.91, 0.11]

2 Functioning postintervention Show forest plot

1

48

Mean Difference (IV, Random, 95% CI)

‐3.31 [‐6.90, 0.28]

3 Status of long‐term physical condition postintervention Show forest plot

2

84

Std. Mean Difference (IV, Random, 95% CI)

0.08 [‐0.55, 0.72]

Figuras y tablas -
Comparison 4. E‐health interventions vs waiting list
Comparison 5. E‐health interventions vs any comparison (by type of therapy)

Outcome or subgroup title

No. of studies

No. of participants

Statistical method

Effect size

1 Depression postintervention Show forest plot

5

441

Std. Mean Difference (IV, Random, 95% CI)

‐0.06 [‐0.35, 0.23]

1.1 CBT

4

402

Std. Mean Difference (IV, Random, 95% CI)

0.05 [‐0.14, 0.25]

1.2 Non‐CBT

1

39

Std. Mean Difference (IV, Random, 95% CI)

‐0.68 [‐1.33, ‐0.04]

Figuras y tablas -
Comparison 5. E‐health interventions vs any comparison (by type of therapy)
Comparison 6. E‐health interventions vs any comparator (by type of comparator)

Outcome or subgroup title

No. of studies

No. of participants

Statistical method

Effect size

1 Depression postintervention Show forest plot

5

441

Std. Mean Difference (IV, Random, 95% CI)

‐0.06 [‐0.35, 0.23]

1.1 Attention placebo

2

304

Std. Mean Difference (IV, Random, 95% CI)

0.11 [‐0.11, 0.34]

1.2 Treatment as usual (TAU)

1

50

Std. Mean Difference (IV, Random, 95% CI)

‐0.12 [‐0.68, 0.44]

1.3 Waiting list

2

87

Std. Mean Difference (IV, Random, 95% CI)

‐0.40 [‐0.91, 0.11]

2 Depression 3‐ to 6‐month follow‐up Show forest plot

3

339

Std. Mean Difference (IV, Random, 95% CI)

0.04 [‐0.18, 0.25]

2.1 Attention placebo

2

288

Std. Mean Difference (IV, Random, 95% CI)

0.02 [‐0.21, 0.25]

2.2 TAU

1

51

Std. Mean Difference (IV, Random, 95% CI)

0.12 [‐0.43, 0.67]

3 Anxiety postintervention Show forest plot

2

324

Std. Mean Difference (IV, Random, 95% CI)

‐0.07 [‐0.29, 0.14]

3.1 Attention placebo

1

269

Std. Mean Difference (IV, Random, 95% CI)

‐0.05 [‐0.29, 0.19]

3.2 Treatment as usual (TAU)

1

55

Std. Mean Difference (IV, Random, 95% CI)

‐0.20 [‐0.73, 0.33]

4 Anxiety 3‐ to 6‐month follow‐up Show forest plot

2

319

Std. Mean Difference (IV, Random, 95% CI)

0.02 [‐0.20, 0.24]

4.1 Attention placebo

1

269

Std. Mean Difference (IV, Random, 95% CI)

0.02 [‐0.22, 0.26]

4.2 Treatment as usual (TAU)

1

50

Std. Mean Difference (IV, Random, 95% CI)

0.04 [‐0.52, 0.60]

5 Treatment acceptability postintervention Show forest plot

1

35

Std. Mean Difference (IV, Random, 95% CI)

0.38 [‐0.29, 1.05]

5.1 Attention placebo

1

35

Std. Mean Difference (IV, Random, 95% CI)

0.38 [‐0.29, 1.05]

Figuras y tablas -
Comparison 6. E‐health interventions vs any comparator (by type of comparator)
Comparison 7. E‐health interventions vs any comparator (by type of long‐term physical condition (LTPC))

Outcome or subgroup title

No. of studies

No. of participants

Statistical method

Effect size

1 Depression postintervention Show forest plot

5

441

Std. Mean Difference (IV, Random, 95% CI)

‐0.06 [‐0.35, 0.23]

1.1 Pain

4

402

Std. Mean Difference (IV, Random, 95% CI)

0.05 [‐0.14, 0.25]

1.2 Non‐pain

1

39

Std. Mean Difference (IV, Random, 95% CI)

‐0.68 [‐1.33, ‐0.04]

Figuras y tablas -
Comparison 7. E‐health interventions vs any comparator (by type of long‐term physical condition (LTPC))
Comparison 8. E‐health interventions vs any comparator (by audience: child plus parent vs child only)

Outcome or subgroup title

No. of studies

No. of participants

Statistical method

Effect size

1 Depression postintervention Show forest plot

5

441

Std. Mean Difference (IV, Random, 95% CI)

‐0.02 [‐0.31, 0.26]

1.1 Child alone

2

74

Std. Mean Difference (IV, Random, 95% CI)

‐0.13 [‐1.23, 0.97]

1.2 Child plus parent

3

367

Std. Mean Difference (IV, Random, 95% CI)

0.05 [‐0.16, 0.25]

Figuras y tablas -
Comparison 8. E‐health interventions vs any comparator (by audience: child plus parent vs child only)