Intervenciones de eSalud para la ansiedad y la depresión en niños y adolescentes con enfermedades físicas crónicas
Información
- DOI:
- https://doi.org/10.1002/14651858.CD012489.pub2Copiar DOI

- Base de datos:
-
- Cochrane Database of Systematic Reviews
- Versión publicada:
-
- 15 agosto 2018see what's new
- Tipo:
-
- Intervention
- Etapa:
-
- Review
- Grupo Editorial Cochrane:
-
Grupo Cochrane de Trastornos mentales comunes
- Copyright:
-
- Copyright © 2018 The Cochrane Collaboration. Published by John Wiley & Sons, Ltd.
Cifras del artículo
Altmetric:
Citado por:
Autores
Contributions of authors
| Task | Who undertook the task? |
| Draft the protocol | Hiran Thabrew |
| Develop a search strategy (in conjunction with CCMDs Information Specialist) | Hiran Thabrew, Karolina Stasiak, Stephen Wong |
| Select which trials to include (2 people + 1 arbiter in the event of dispute) | Hiran Thabrew, Karolina Stasiak and Stephen Wong |
| Extract data from trials (2 people + 1 arbiter in the event of dispute) | Hiran Thabrew, Jessica Huss and Karolina Stasiak |
| Undertake 'Risk of bias' assessments (2 people + 1 arbiter in the event of dispute) | Hiran Thabrew, Sarah Hetrick, Karolina Stasiak |
| Enter data into RevMan 5 (Cochrane software) | Hiran Thabrew, Karolina Stasiak |
| Carry out the analysis | Hiran Thabrew, Sarah Hetrick |
| Interpret the analysis | Hiran Thabrew, Sarah Hetrick, Sally Merry |
| Draft the final review | Hiran Thabrew, Karolina Stasiak, Sarah Hetrick, Sally Merry |
| Produce the 'Summary of findings' tables | Hiran Thabrew |
| Check final review meets all mandatory MECIR standards before submission | Hiran Thabrew |
| Keep the review up to date | Hiran Thabrew, Karolina Stasiak, Sarah Hetrick, Sally Merry |
Sources of support
Internal sources
-
University of Auckland, New Zealand.
Salaries of authors
External sources
-
Oakley Foundation, New Zealand.
Equipment and research assistance
-
Starship Foundation, New Zealand.
Equipment and research assistance
-
National Institute for Health Research (NIHR), UK.
Single largest funder of the CCMD group
Declarations of interest
Sally Merry and Karolina Stasiak have been involved in designing and trialing SPARX, an online and CD‐ROM based interactive health game for adolescents with depression.
Acknowledgements
The authors acknowledge the valuable contributions of the Cochrane Common Mental Disorders Group (CCMDG), including Sarah Dawson (Information Specialist), Jessica Sharp (Managing Editor), and Rachel Churchill (Co‐ordinating Editor). We are also very grateful to Anne Wilson from the Philson Library at the University of Auckland for assisting us with some of the search processes.
This review was supported by funding from the Starship Foundation and Oakley Foundation in New Zealand.
Cochrane Group funding acknowledgement
The National Institute for Health Research (NIHR) is the largest single funder of the Cochrane Common Mental Disorders Group.
Disclaimer
The views and opinions expressed herein are those of the authors and do not necessarily reflect those of the NIHR, National Health Service (NHS), or the Department of Health.
Version history
| Published | Title | Stage | Authors | Version |
| 2018 Aug 15 | E‐Health interventions for anxiety and depression in children and adolescents with long‐term physical conditions | Review | Hiran Thabrew, Karolina Stasiak, Sarah E Hetrick, Stephen Wong, Jessica H Huss, Sally N Merry | |
| 2017 Jan 09 | eHealth interventions for anxiety and depression in children and adolescents with long‐term physical conditions | Protocol | Hiran Thabrew, Karolina Stasiak, Sarah E Hetrick, Stephen Wong, Jessica H Huss, Sally N Merry | |
Differences between protocol and review
We made five amendments to the plan outlined in our review protocol. Firstly, we did not conduct a cited reference search on the Web of Science database as planned. Secondly, due to the small number of identified trials, we included an additional comparison group, e‐health interventions versus any comparator and based our Summary of Findings table on this group. Thirdly, as a number of trials had undertaken quantitative analyses of treatment acceptability, we decided to triangulate our judgement regarding treatment acceptability by including: i) quantitative measures of acceptability, ii) the number of dropouts, and iii) adverse events. Fourthly, as Covidence® software became available following the drafting of the review protocol, we extracted data using this software, and not the data extraction sheet that was described in the protocol. Finally, we ensured that it was clear in our methods that where only one trial was included in the meta‐analysis that the mean difference was used (and included in the text an explanation that this would also be used in the case where an outcome was measured by the same scale across trials, which did not occur in this review) and ensured that we were expicit in describing our data synthesis method for meta‐analysis (random effects model across all meta‐analyses even when only one trial was included for consistency).
Keywords
MeSH
Medical Subject Headings (MeSH) Keywords
Medical Subject Headings Check Words
Adolescent; Child; Humans;
PICO
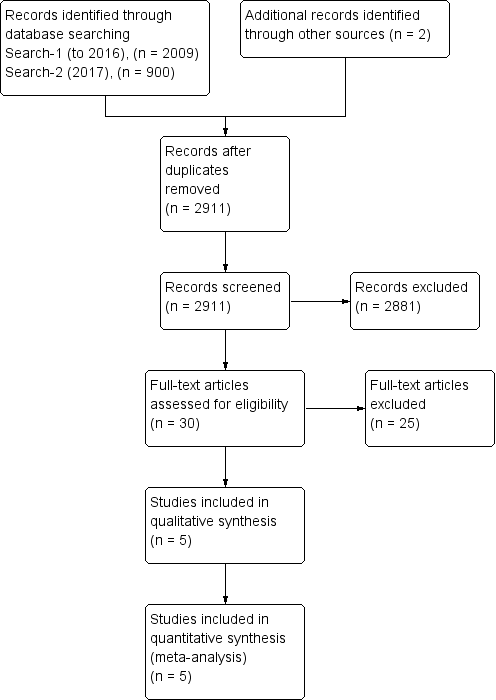
Study flow diagram.
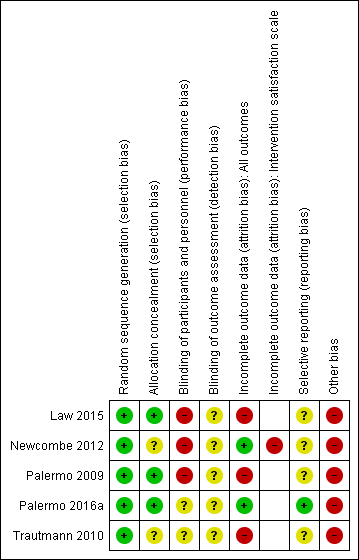
Risk of bias summary: review authors' judgements about each risk of bias item for each included study
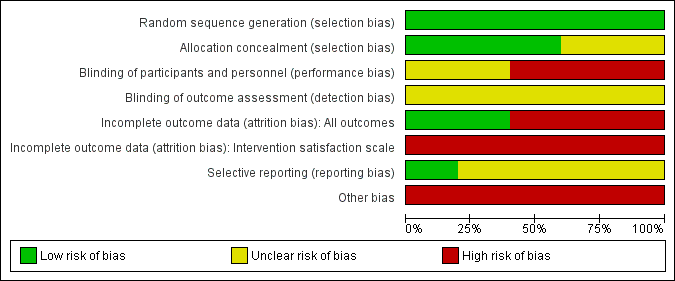
Risk of bias graph: review authors' judgements about each risk of bias item presented as percentages across all included studies
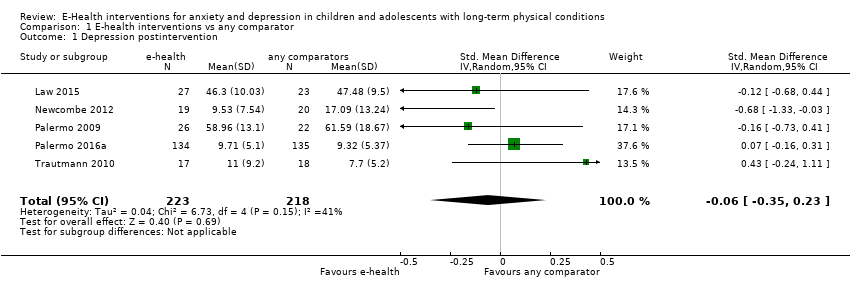
Comparison 1 E‐health interventions vs any comparator, Outcome 1 Depression postintervention.

Comparison 1 E‐health interventions vs any comparator, Outcome 2 Depression 3‐ to 6‐month follow‐up.

Comparison 1 E‐health interventions vs any comparator, Outcome 3 Anxiety postintervention.
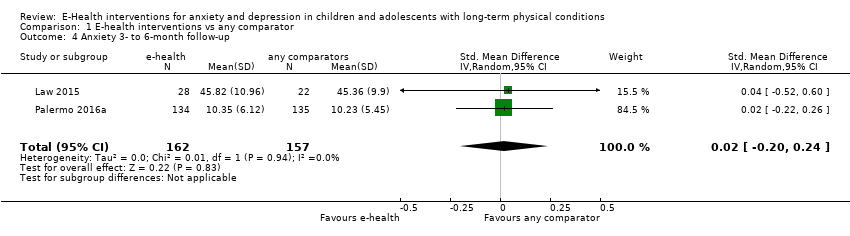
Comparison 1 E‐health interventions vs any comparator, Outcome 4 Anxiety 3‐ to 6‐month follow‐up.

Comparison 1 E‐health interventions vs any comparator, Outcome 5 Treatment acceptability postintervention.

Comparison 1 E‐health interventions vs any comparator, Outcome 6 Quality of life postintervention.
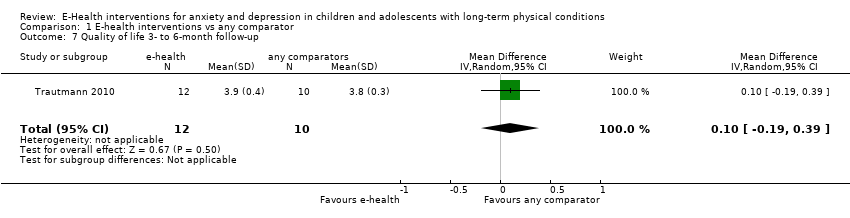
Comparison 1 E‐health interventions vs any comparator, Outcome 7 Quality of life 3‐ to 6‐month follow‐up.

Comparison 1 E‐health interventions vs any comparator, Outcome 8 Functioning postintervention.

Comparison 1 E‐health interventions vs any comparator, Outcome 9 Functioning 3‐ to 6‐month follow‐up.

Comparison 1 E‐health interventions vs any comparator, Outcome 10 Status of long‐term physical condition postintervention.

Comparison 1 E‐health interventions vs any comparator, Outcome 11 Status of long‐term physical condition 3‐ to 6‐month follow‐up.

Comparison 2 E‐health interventions vs attention placebo, Outcome 1 Depression postintervention.
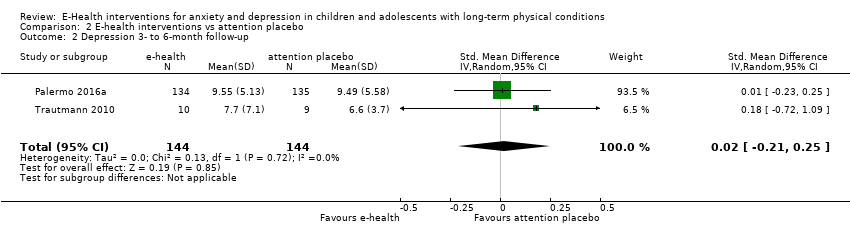
Comparison 2 E‐health interventions vs attention placebo, Outcome 2 Depression 3‐ to 6‐month follow‐up.
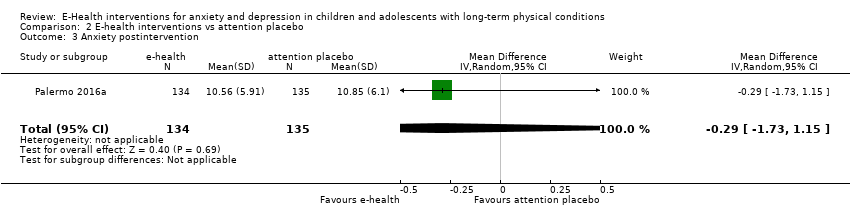
Comparison 2 E‐health interventions vs attention placebo, Outcome 3 Anxiety postintervention.
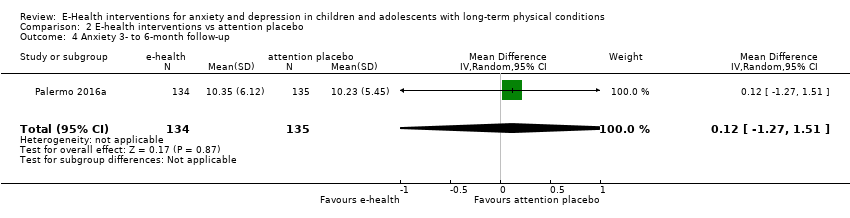
Comparison 2 E‐health interventions vs attention placebo, Outcome 4 Anxiety 3‐ to 6‐month follow‐up.

Comparison 2 E‐health interventions vs attention placebo, Outcome 5 Treatment acceptability postintervention.

Comparison 2 E‐health interventions vs attention placebo, Outcome 6 Quality of life postintervention.

Comparison 2 E‐health interventions vs attention placebo, Outcome 7 Quality of life 6‐month follow‐up.

Comparison 2 E‐health interventions vs attention placebo, Outcome 8 Functioning postintervention.
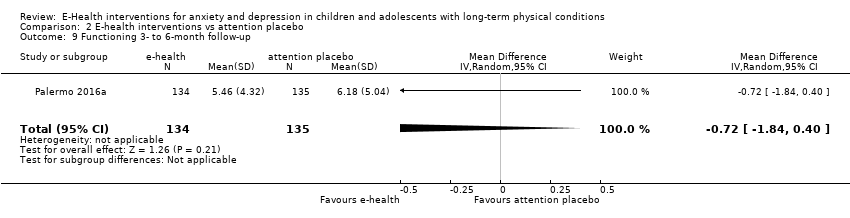
Comparison 2 E‐health interventions vs attention placebo, Outcome 9 Functioning 3‐ to 6‐month follow‐up.

Comparison 2 E‐health interventions vs attention placebo, Outcome 10 Status of long‐term physical condition postintervention.

Comparison 2 E‐health interventions vs attention placebo, Outcome 11 Status of long‐term physical condition 3‐ to 6‐month follow‐up.

Comparison 3 E‐health interventions vs treatment as usual (TAU), Outcome 1 Depression postintervention.

Comparison 3 E‐health interventions vs treatment as usual (TAU), Outcome 2 Depression 3‐month follow‐up.
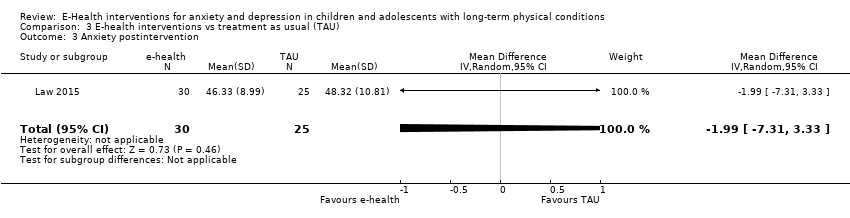
Comparison 3 E‐health interventions vs treatment as usual (TAU), Outcome 3 Anxiety postintervention.
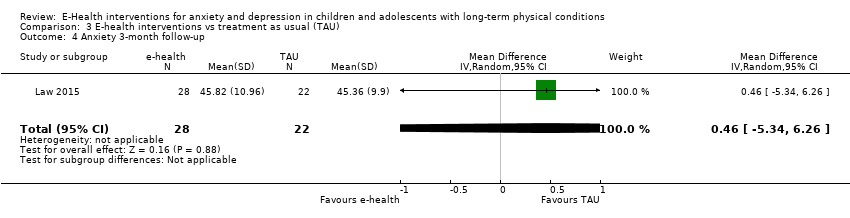
Comparison 3 E‐health interventions vs treatment as usual (TAU), Outcome 4 Anxiety 3‐month follow‐up.
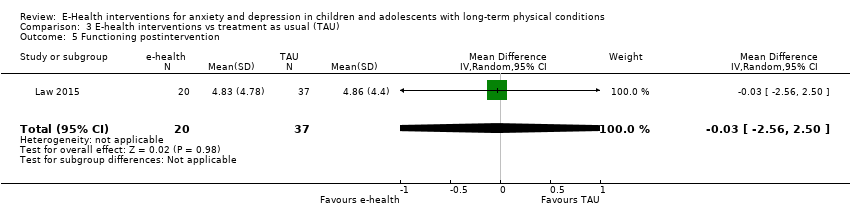
Comparison 3 E‐health interventions vs treatment as usual (TAU), Outcome 5 Functioning postintervention.
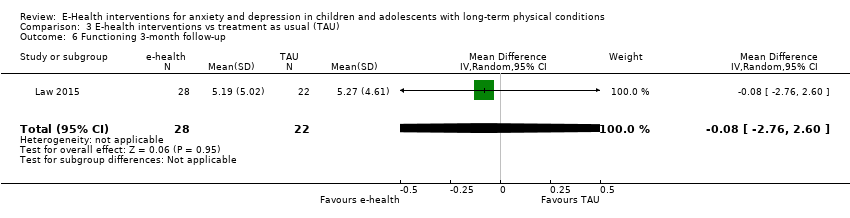
Comparison 3 E‐health interventions vs treatment as usual (TAU), Outcome 6 Functioning 3‐month follow‐up.
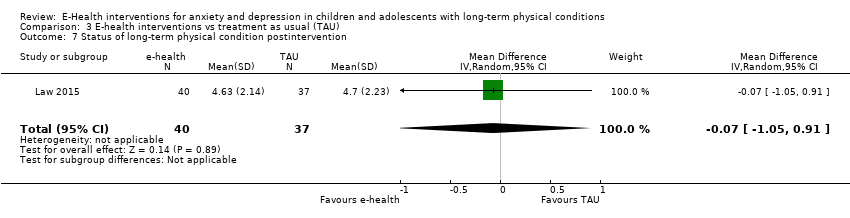
Comparison 3 E‐health interventions vs treatment as usual (TAU), Outcome 7 Status of long‐term physical condition postintervention.
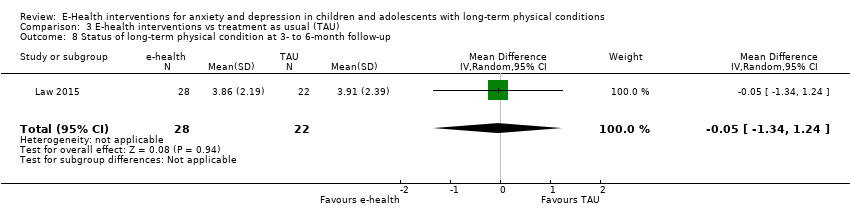
Comparison 3 E‐health interventions vs treatment as usual (TAU), Outcome 8 Status of long‐term physical condition at 3‐ to 6‐month follow‐up.
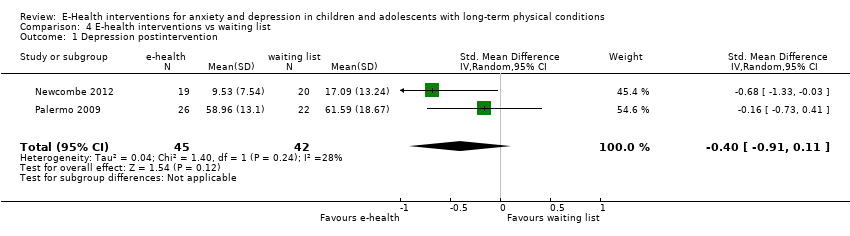
Comparison 4 E‐health interventions vs waiting list, Outcome 1 Depression postintervention.

Comparison 4 E‐health interventions vs waiting list, Outcome 2 Functioning postintervention.

Comparison 4 E‐health interventions vs waiting list, Outcome 3 Status of long‐term physical condition postintervention.
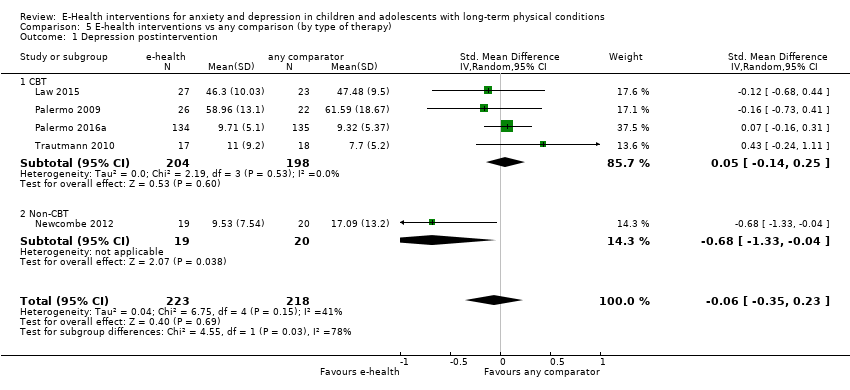
Comparison 5 E‐health interventions vs any comparison (by type of therapy), Outcome 1 Depression postintervention.
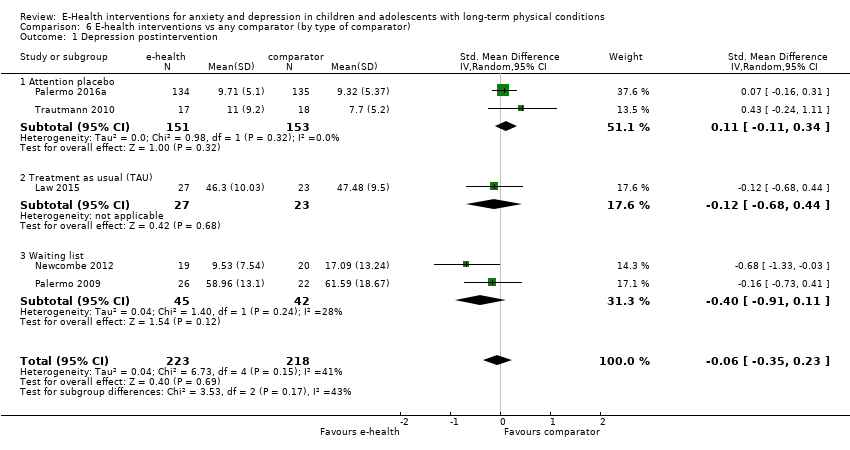
Comparison 6 E‐health interventions vs any comparator (by type of comparator), Outcome 1 Depression postintervention.
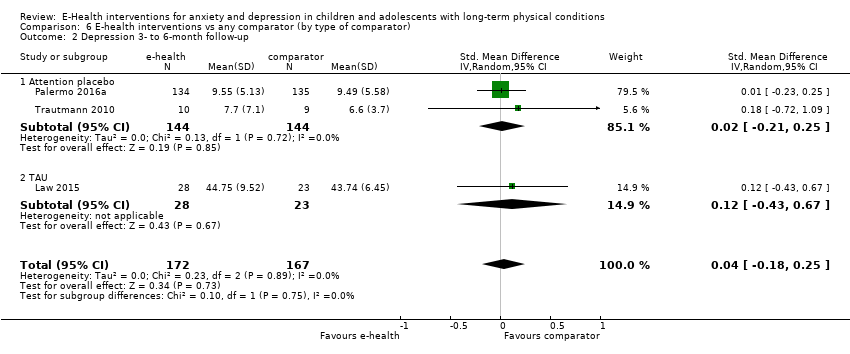
Comparison 6 E‐health interventions vs any comparator (by type of comparator), Outcome 2 Depression 3‐ to 6‐month follow‐up.
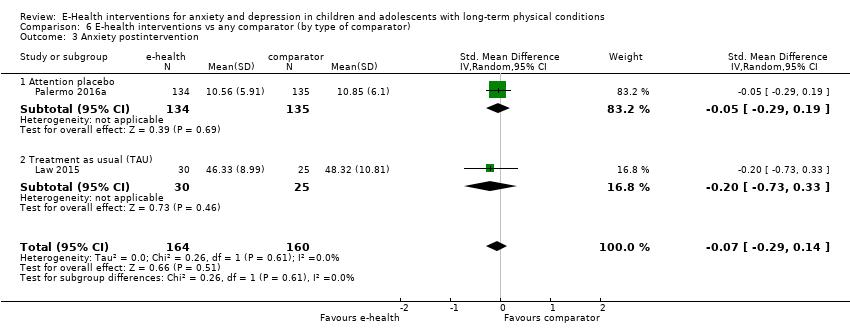
Comparison 6 E‐health interventions vs any comparator (by type of comparator), Outcome 3 Anxiety postintervention.
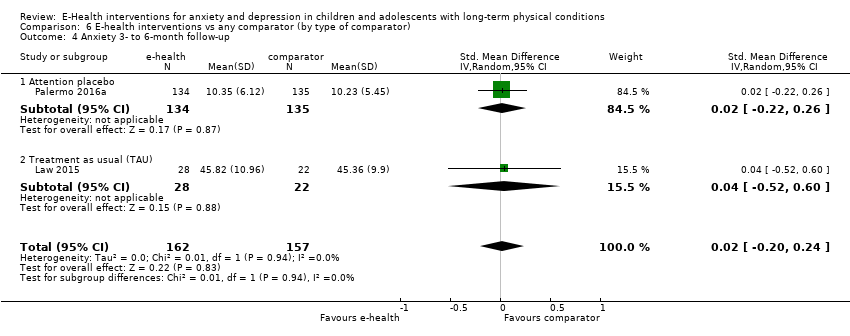
Comparison 6 E‐health interventions vs any comparator (by type of comparator), Outcome 4 Anxiety 3‐ to 6‐month follow‐up.
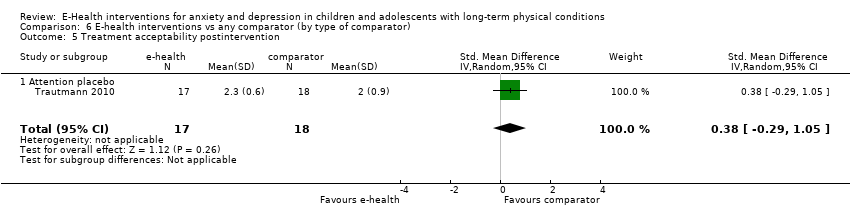
Comparison 6 E‐health interventions vs any comparator (by type of comparator), Outcome 5 Treatment acceptability postintervention.
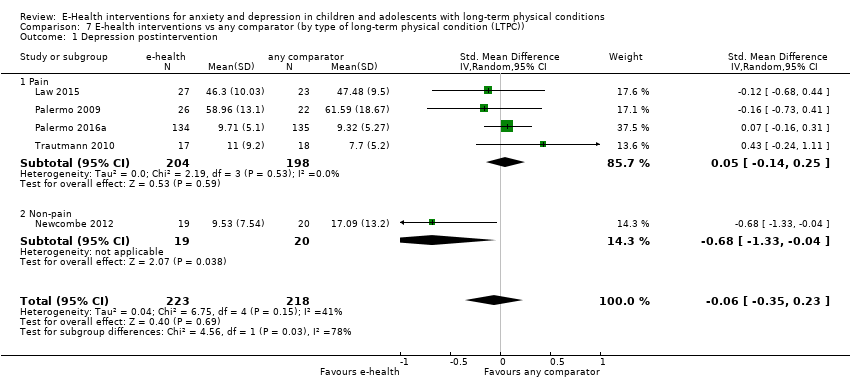
Comparison 7 E‐health interventions vs any comparator (by type of long‐term physical condition (LTPC)), Outcome 1 Depression postintervention.
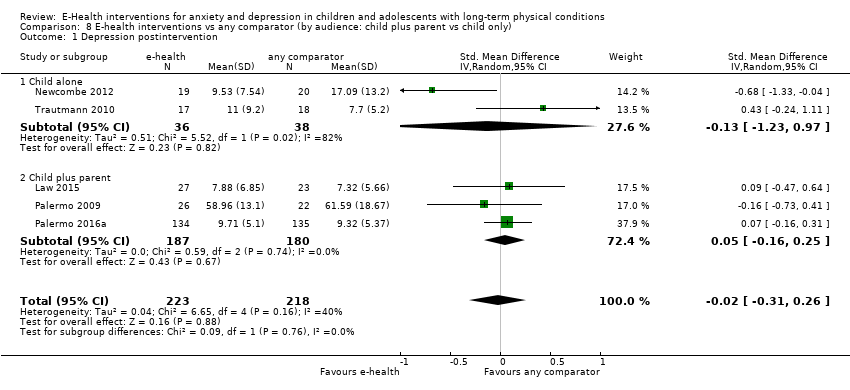
Comparison 8 E‐health interventions vs any comparator (by audience: child plus parent vs child only), Outcome 1 Depression postintervention.
| E‐healthinterventions versus any comparator for anxiety and depression in children and adolescents with long‐term physical conditions | ||||||
| Patient or population: children and adolescents, aged 10 to 18 years, with long‐term physical conditions | ||||||
| Outcomes | Anticipated absolute effects* (95% CI) | Relative effect | № of participants | Quality of the evidence | Comments | |
| Risk with any comparator | Risk with e‐health interventions | |||||
| Depression (postintervention) | The mean self‐reported depression score in the intervention group was 0.06 standard mean deviations lower (0.35 lower to 0.23 higher) | ‐ | 441 | ⊕⊝⊝⊝ | A standard mean deviation of ‐0.06 represents a small difference between groups | |
| Anxiety (postintervention) | The mean self‐reported anxiety score in the intervention group was 0.07 standard mean deviations lower (0.29 lower to 0.14 higher) | ‐ | 324 | ⊕⊝⊝⊝ | A standard mean deviation of ‐0.07 represents a small difference between groups | |
| Treatment acceptability (postintervention) | The mean self‐reported treatment acceptability score in the intervention group was 0.46 standard mean deviations higher (0.23 higher to 0.69 higher) | ‐ | 304 | ⊕⊝⊝⊝ | A standard mean deviation of 0.46 represents a small difference between groups | |
| Quality of life (postintervention) | The mean self‐reported quality of life score in the intervention group was 0.83 standard mean deviations lower | ‐ | 34 | ⊕⊝⊝⊝ | A standard mean deviation of ‐0.83 represents a large difference between groups | |
| Functioning (postintervention) | The mean self‐reported level of functioning in the intervention group was 0.08 standard mean deviations lower | ‐ | 368 | ⊕⊝⊝⊝ | A standard mean deviation of ‐0.08 represents a small difference between groups | |
| Status of long‐term physical condition (postintervention) | The mean self‐reported long‐term physical condition symptom score was 0.06 standard mean deviations higher | ‐ | 463 | ⊕⊕⊝⊝ | A standard mean deviation of 0.06 represents a small difference between groups | |
| *The risk in the intervention group (and its 95% confidence interval) is based on the assumed risk in the comparison group and the relative effect of the intervention (and its 95% CI). | ||||||
| GRADE Working Group grades of evidence | ||||||
| a We downgraded quality due to a lack of clarity about blinding of participants and outcome assessors, incomplete outcome data, and the fact that all studies were conducted by the developers of the e‐health interventions. b We downgraded for inconsistency due to studies having moderate heterogeneity. c We downgraded for indirectness because most or all of the interventions were not designed to treat anxiety or depression as the primary focus. d We downgraded for imprecision as the upper and lower limits of the confidence intervals include both potential for harm and potential for benefit e We downgraded for imprecision as the total sample size was less than 400 as per guidance from the Consumer and Communication Cochrane Review Group (Ryan 2016) | ||||||
| Outcome or subgroup title | No. of studies | No. of participants | Statistical method | Effect size |
| 1 Depression postintervention Show forest plot | 5 | 441 | Std. Mean Difference (IV, Random, 95% CI) | ‐0.06 [‐0.35, 0.23] |
| 2 Depression 3‐ to 6‐month follow‐up Show forest plot | 3 | 339 | Std. Mean Difference (IV, Random, 95% CI) | 0.04 [‐0.18, 0.25] |
| 3 Anxiety postintervention Show forest plot | 2 | 324 | Std. Mean Difference (IV, Random, 95% CI) | ‐0.07 [‐0.29, 0.14] |
| 4 Anxiety 3‐ to 6‐month follow‐up Show forest plot | 2 | 319 | Std. Mean Difference (IV, Random, 95% CI) | 0.02 [‐0.20, 0.24] |
| 5 Treatment acceptability postintervention Show forest plot | 2 | 304 | Std. Mean Difference (IV, Random, 95% CI) | 0.46 [0.23, 0.69] |
| 6 Quality of life postintervention Show forest plot | 1 | 34 | Mean Difference (IV, Random, 95% CI) | ‐0.30 [‐0.54, ‐0.06] |
| 7 Quality of life 3‐ to 6‐month follow‐up Show forest plot | 1 | 22 | Mean Difference (IV, Random, 95% CI) | 0.10 [‐0.19, 0.39] |
| 8 Functioning postintervention Show forest plot | 3 | 368 | Std. Mean Difference (IV, Random, 95% CI) | ‐0.08 [‐0.33, 0.18] |
| 9 Functioning 3‐ to 6‐month follow‐up Show forest plot | 2 | 319 | Std. Mean Difference (IV, Random, 95% CI) | ‐0.13 [‐0.35, 0.09] |
| 10 Status of long‐term physical condition postintervention Show forest plot | 5 | 463 | Std. Mean Difference (IV, Random, 95% CI) | 0.06 [‐0.12, 0.24] |
| 11 Status of long‐term physical condition 3‐ to 6‐month follow‐up Show forest plot | 3 | 340 | Std. Mean Difference (IV, Random, 95% CI) | 0.10 [‐0.11, 0.32] |
| Outcome or subgroup title | No. of studies | No. of participants | Statistical method | Effect size |
| 1 Depression postintervention Show forest plot | 2 | 304 | Std. Mean Difference (IV, Random, 95% CI) | 0.11 [‐0.11, 0.34] |
| 2 Depression 3‐ to 6‐month follow‐up Show forest plot | 2 | 288 | Std. Mean Difference (IV, Random, 95% CI) | 0.02 [‐0.21, 0.25] |
| 3 Anxiety postintervention Show forest plot | 1 | 269 | Mean Difference (IV, Random, 95% CI) | ‐0.29 [‐1.73, 1.15] |
| 4 Anxiety 3‐ to 6‐month follow‐up Show forest plot | 1 | 269 | Mean Difference (IV, Random, 95% CI) | 0.12 [‐1.27, 1.51] |
| 5 Treatment acceptability postintervention Show forest plot | 2 | 304 | Std. Mean Difference (IV, Random, 95% CI) | 0.46 [0.23, 0.69] |
| 6 Quality of life postintervention Show forest plot | 1 | 34 | Mean Difference (IV, Random, 95% CI) | ‐0.30 [‐0.54, ‐0.06] |
| 7 Quality of life 6‐month follow‐up Show forest plot | 1 | 22 | Mean Difference (IV, Random, 95% CI) | 0.10 [‐0.19, 0.39] |
| 8 Functioning postintervention Show forest plot | 1 | 269 | Mean Difference (IV, Random, 95% CI) | 0.03 [‐1.05, 1.11] |
| 9 Functioning 3‐ to 6‐month follow‐up Show forest plot | 1 | 269 | Mean Difference (IV, Random, 95% CI) | ‐0.72 [‐1.84, 0.40] |
| 10 Status of long‐term physical condition postintervention Show forest plot | 2 | 302 | Std. Mean Difference (IV, Random, 95% CI) | 0.03 [‐0.34, 0.40] |
| 11 Status of long‐term physical condition 3‐ to 6‐month follow‐up Show forest plot | 2 | 290 | Std. Mean Difference (IV, Random, 95% CI) | 0.13 [‐0.10, 0.36] |
| Outcome or subgroup title | No. of studies | No. of participants | Statistical method | Effect size |
| 1 Depression postintervention Show forest plot | 1 | 50 | Mean Difference (IV, Random, 95% CI) | ‐1.18 [‐6.60, 4.24] |
| 2 Depression 3‐month follow‐up Show forest plot | 1 | 51 | Mean Difference (IV, Random, 95% CI) | 1.01 [‐3.39, 5.41] |
| 3 Anxiety postintervention Show forest plot | 1 | 55 | Mean Difference (IV, Random, 95% CI) | ‐1.99 [‐7.31, 3.33] |
| 4 Anxiety 3‐month follow‐up Show forest plot | 1 | 50 | Mean Difference (IV, Random, 95% CI) | 0.46 [‐5.34, 6.26] |
| 5 Functioning postintervention Show forest plot | 1 | 57 | Mean Difference (IV, Random, 95% CI) | ‐0.03 [‐2.56, 2.50] |
| 6 Functioning 3‐month follow‐up Show forest plot | 1 | 50 | Mean Difference (IV, Random, 95% CI) | ‐0.08 [‐2.76, 2.60] |
| 7 Status of long‐term physical condition postintervention Show forest plot | 1 | 77 | Mean Difference (IV, Random, 95% CI) | ‐0.07 [‐1.05, 0.91] |
| 8 Status of long‐term physical condition at 3‐ to 6‐month follow‐up Show forest plot | 1 | 50 | Mean Difference (IV, Random, 95% CI) | ‐0.05 [‐1.34, 1.24] |
| Outcome or subgroup title | No. of studies | No. of participants | Statistical method | Effect size |
| 1 Depression postintervention Show forest plot | 2 | 87 | Std. Mean Difference (IV, Random, 95% CI) | ‐0.40 [‐0.91, 0.11] |
| 2 Functioning postintervention Show forest plot | 1 | 48 | Mean Difference (IV, Random, 95% CI) | ‐3.31 [‐6.90, 0.28] |
| 3 Status of long‐term physical condition postintervention Show forest plot | 2 | 84 | Std. Mean Difference (IV, Random, 95% CI) | 0.08 [‐0.55, 0.72] |
| Outcome or subgroup title | No. of studies | No. of participants | Statistical method | Effect size |
| 1 Depression postintervention Show forest plot | 5 | 441 | Std. Mean Difference (IV, Random, 95% CI) | ‐0.06 [‐0.35, 0.23] |
| 1.1 CBT | 4 | 402 | Std. Mean Difference (IV, Random, 95% CI) | 0.05 [‐0.14, 0.25] |
| 1.2 Non‐CBT | 1 | 39 | Std. Mean Difference (IV, Random, 95% CI) | ‐0.68 [‐1.33, ‐0.04] |
| Outcome or subgroup title | No. of studies | No. of participants | Statistical method | Effect size |
| 1 Depression postintervention Show forest plot | 5 | 441 | Std. Mean Difference (IV, Random, 95% CI) | ‐0.06 [‐0.35, 0.23] |
| 1.1 Attention placebo | 2 | 304 | Std. Mean Difference (IV, Random, 95% CI) | 0.11 [‐0.11, 0.34] |
| 1.2 Treatment as usual (TAU) | 1 | 50 | Std. Mean Difference (IV, Random, 95% CI) | ‐0.12 [‐0.68, 0.44] |
| 1.3 Waiting list | 2 | 87 | Std. Mean Difference (IV, Random, 95% CI) | ‐0.40 [‐0.91, 0.11] |
| 2 Depression 3‐ to 6‐month follow‐up Show forest plot | 3 | 339 | Std. Mean Difference (IV, Random, 95% CI) | 0.04 [‐0.18, 0.25] |
| 2.1 Attention placebo | 2 | 288 | Std. Mean Difference (IV, Random, 95% CI) | 0.02 [‐0.21, 0.25] |
| 2.2 TAU | 1 | 51 | Std. Mean Difference (IV, Random, 95% CI) | 0.12 [‐0.43, 0.67] |
| 3 Anxiety postintervention Show forest plot | 2 | 324 | Std. Mean Difference (IV, Random, 95% CI) | ‐0.07 [‐0.29, 0.14] |
| 3.1 Attention placebo | 1 | 269 | Std. Mean Difference (IV, Random, 95% CI) | ‐0.05 [‐0.29, 0.19] |
| 3.2 Treatment as usual (TAU) | 1 | 55 | Std. Mean Difference (IV, Random, 95% CI) | ‐0.20 [‐0.73, 0.33] |
| 4 Anxiety 3‐ to 6‐month follow‐up Show forest plot | 2 | 319 | Std. Mean Difference (IV, Random, 95% CI) | 0.02 [‐0.20, 0.24] |
| 4.1 Attention placebo | 1 | 269 | Std. Mean Difference (IV, Random, 95% CI) | 0.02 [‐0.22, 0.26] |
| 4.2 Treatment as usual (TAU) | 1 | 50 | Std. Mean Difference (IV, Random, 95% CI) | 0.04 [‐0.52, 0.60] |
| 5 Treatment acceptability postintervention Show forest plot | 1 | 35 | Std. Mean Difference (IV, Random, 95% CI) | 0.38 [‐0.29, 1.05] |
| 5.1 Attention placebo | 1 | 35 | Std. Mean Difference (IV, Random, 95% CI) | 0.38 [‐0.29, 1.05] |
| Outcome or subgroup title | No. of studies | No. of participants | Statistical method | Effect size |
| 1 Depression postintervention Show forest plot | 5 | 441 | Std. Mean Difference (IV, Random, 95% CI) | ‐0.06 [‐0.35, 0.23] |
| 1.1 Pain | 4 | 402 | Std. Mean Difference (IV, Random, 95% CI) | 0.05 [‐0.14, 0.25] |
| 1.2 Non‐pain | 1 | 39 | Std. Mean Difference (IV, Random, 95% CI) | ‐0.68 [‐1.33, ‐0.04] |
| Outcome or subgroup title | No. of studies | No. of participants | Statistical method | Effect size |
| 1 Depression postintervention Show forest plot | 5 | 441 | Std. Mean Difference (IV, Random, 95% CI) | ‐0.02 [‐0.31, 0.26] |
| 1.1 Child alone | 2 | 74 | Std. Mean Difference (IV, Random, 95% CI) | ‐0.13 [‐1.23, 0.97] |
| 1.2 Child plus parent | 3 | 367 | Std. Mean Difference (IV, Random, 95% CI) | 0.05 [‐0.16, 0.25] |