L‐ornitina L‐aspartato para la prevención y el tratamiento de la encefalopatía hepática en pacientes con cirrosis
Resumen
Antecedentes
La encefalopatía hepática es una complicación frecuente de la cirrosis y se asocia con una alta morbilidad y mortalidad. El trastorno se clasifica como evidente si es clínicamente visible o mínimo si sólo es visible con el uso de una prueba psicométrica. No se conoce la patogenia exacta de este síndrome aunque se cree que el amoníaco desempeña una función clave. La L‐ornitina L‐aspartato tiene propiedades para disminuir los niveles de amoníaco, por lo que puede ser beneficiosa para los pacientes con cirrosis y encefalopatía hepática.
Objetivos
Evaluar los efectos beneficiosos y perjudiciales de la L‐ornitina L‐aspartato versus placebo, ninguna intervención u otras intervenciones activas en pacientes con cirrosis y encefalopatía hepática.
Métodos de búsqueda
Se hicieron búsquedas electrónicas en el registro de ensayos controlados del Grupo Cochrane Hepatobiliar (Cochrane Hepato‐Biliary Group Controlled Trials Register), CENTRAL, MEDLINE, Embase, LILACS y en Science Citation Index Expanded hasta diciembre 2017 y búsquedas manuales en reuniones y actas de congresos; verificaciones de bibliografías; y correspondencia con investigadores y compañías farmacéuticas.
Criterios de selección
Se incluyeron ensayos clínicos aleatorios, independientemente del estado de la publicación, del idioma o del cegamiento. Se incluyeron los pacientes con cirrosis que presentaban encefalopatía hepática mínima o evidente o que estaban en riesgo de desarrollar encefalopatía hepática. Se comparó: L‐ornitina L‐aspartato versus placebo o ninguna intervención; y L‐ornitina L‐aspartato versus otros agentes activos como disacáridos no absorbibles, antibióticos, probióticos o aminoácidos de cadena ramificada.
Obtención y análisis de los datos
Dos autores de la revisión que trabajaron de manera independiente recuperaron los datos de los informes publicados y de la correspondencia con los investigadores y las compañías farmacéuticas. Los resultados primarios fueron mortalidad, encefalopatía hepática y eventos adversos graves. Se realizaron metanálisis y se presentaron los resultados como cocientes de riesgos (CR) y diferencias de medias (DM) con intervalos de confianza (IC) del 95%. El control del sesgo se evaluó mediante los dominios del Grupo Cochrane Hepatobiliar; el riesgo de sesgo de publicación y de otros efectos de ensayos pequeños se evaluó en análisis de regresión; se realizaron análisis de sensibilidad y de subgrupos; y se realizaron Análisis Secuenciales de Ensayos. La calidad de las pruebas se determinó mediante GRADE.
Resultados principales
Se identificaron 36 ensayos clínicos aleatorios, que incluyeron al menos a 2377 participantes registrados, y que cumplieron con los criterios de inclusión, incluidos diez ensayos clínicos aleatorios no publicados. Sin embargo, sólo fue posible obtener acceso a los datos de resultado de 29 ensayos con 1891 participantes. Cinco de los ensayos incluidos evaluaron la prevención, mientras que 31 ensayos evaluaron el tratamiento. Cinco ensayos tuvieron riesgo bajo de sesgo en la evaluación general de la mortalidad; un ensayo tuvo riesgo bajo de sesgo en la evaluación de los resultados restantes.
La L‐ornitina L‐aspartato tuvo un efecto beneficioso sobre la mortalidad en comparación con placebo o ninguna intervención cuando se incluyeron todos los ensayos (CR 0,42; IC del 95%: 0,24 a 0,72; I2 = 0%, 19 ensayos, 1489 participantes; evidencia de muy baja calidad), pero no fue así cuando el análisis se limitó a los ensayos con riesgo bajo de sesgo (CR 0,47; IC del 95%: 0,06 a 3,58; 4 ensayos, 244 participantes). Tuvo un efecto beneficioso sobre la encefalopatía hepática en comparación con placebo o ninguna intervención cuando se incluyeron todos los ensayos (CR 0,70; IC del 95%: 0,59 a 0,83; 22 ensayos, 1375 participantes; I2 = 62%; evidencia de muy baja calidad), pero no fue así en el único ensayo con riesgo bajo de sesgo (CR 0,96; IC del 95%: 0,85 a 1,07; 63 participantes). El análisis de los eventos adversos graves mostró un beneficio potencial de la L‐ornitina L‐aspartato cuando se incluyeron todos los ensayos clínicos aleatorios (CR 0,63; IC del 95%: 0,45 a 0,90; un ensayo, 1489 participantes; I2 = 0%).evidencia de muy baja calidad), pero no fue así en el único ensayo con riesgo bajo de sesgo para este resultado (CR 0,83; IC del 95%: 0,15 a 4,65; 63 participantes). Los Análisis Secuenciales de Ensayos de la mortalidad, la encefalopatía hepática y los eventos adversos graves no encontraron evidencia suficiente para apoyar o refutar los efectos beneficiosos. Los análisis de subgrupos no mostraron diferencias en los resultados en los ensayos que evaluaron la prevención o el tratamiento de la encefalopatía hepática evidente o mínima ni en los ensayos que evaluaron la administración oral versus intravenosa. No fue posible realizar un metanálisis de los tres ensayos que incluyeron a 288 participantes y que evaluaron la calidad de vida relacionada con la salud. En términos generales, no se encontraron diferencias entre L‐ornitina L‐aspartato y placebo o ninguna intervención en los eventos adversos no graves (CR 1,15; IC del 95%: 0,75 a 1,77; 14 ensayos, 1076 participantes; I2 = 40%). En comparación con lactulosa, la L‐ornitina L‐aspartato no tuvo efectos sobre la mortalidad (CR 0,68; IC del 95%: 0,11 a 4,17; 4ensayos, 175 participantes; I2 = 0%);la encefalopatía hepática (CR 1,13; IC del 95%: 0,81 a 1,57); los eventos adversos graves (CR 0,69; IC del 95%: 0,22 a 2,11; ni los eventos adversos no graves (CR 0,05; IC del 95%: 0,01 a 0,18). En comparación con los probióticos, la L‐ornitina L‐aspartato no tuvo efectos sobre la mortalidad (CR 1,01; IC del 95%: 0,11 a 9,51); los eventos adversos graves (CR 1,07; IC del 95%: 0,23 a 4,88); ni los cambios en las concentraciones de amoníaco en sangre a partir del inicio (CR ‐2,30; IC del 95%: ‐6,08 a 1,48), pero tuvo un posible efecto beneficioso sobre la encefalopatía hepática (CR 0,71; IC del 95%: 0,56 a 0,90). Finalmente, en comparación con rifaximina, la L‐ornitina L‐aspartato no tuvo efectos sobre la mortalidad (CR 0,33; IC del 95%: 0,04 a 3,03; 2 ensayos, 105 participantes; la encefalopatía hepática (CR 1,06; IC del 95%: 0,57 a 1,96); los eventos adversos graves (CR 0,32; IC del 95%: 0,01 a 7,42) ni los eventos adversos no graves (CR 0,32; IC del 95%: 0,01 a 7,42).
Conclusiones de los autores
Los resultados de esta revisión indican un posible efecto beneficioso de la L‐ornitina L‐aspartato sobre la mortalidad, la encefalopatía hepática y los eventos adversos graves en las comparaciones con placebo o ninguna intervención, pero debido a que la calidad de la evidencia es muy baja, existe mucha incertidumbre acerca de estos hallazgos. Hubo evidencia de calidad muy baja de un posible efecto beneficioso de la L‐ornitina L‐aspartato en la encefalopatía hepática, en comparación con los probióticos, pero no se observaron otros efectos beneficiosos en comparación con otros agentes activos. Se necesita acceso adicional a los datos de los ensayos completados pero no publicados y de los nuevos ensayos clínicos aleatorios, doble ciego, controlados con placebo.
PICO
Resumen en términos sencillos
L‐ornitina L‐aspartato para pacientes con enfermedad hepática crónica y encefalopatía hepática (funcionamiento cerebral deficiente)
Antecedentes
La cirrosis es un trastorno crónico del hígado. Los pacientes con esta afección desarrollan por lo general encefalopatía hepática, una complicación que da lugar a un funcionamiento cerebral deficiente. Algunos pacientes con cirrosis desarrollan características clínicas obvias de una alteración en el funcionamiento cerebral, como dificultades con el habla, el equilibrio y el funcionamiento diario; se dice que presentan encefalopatía hepática evidente; los cambios pueden ser transitorios, recurrentes o pueden persistir durante períodos prolongados. Otros pacientes con cirrosis pueden no mostrar cambios obvios, aunque al realizarles pruebas se pueda encontrar que algunos aspectos clínicos de la función cerebral, como la atención y la capacidad para cumplir tareas complejas, presentan un deterioro; se dice que presentan encefalopatía hepática mínima. La razón por la que los pacientes desarrollan encefalopatía hepática es compleja, pero la acumulación en sangre de toxinas de los intestinos, en particular de un compuesto llamado amoníaco, desempeña una función clave. La L‐ornitina L‐aspartato reduce los niveles de amoníaco en sangre y, por lo tanto, puede tener efectos beneficiosos en los pacientes con encefalopatía hepática o ayudar a interrumpir su desarrollo.
Pregunta de la revisión
Se investigó la administración de L‐ornitina L‐aspartato por la boca (oral) o por una vena en forma de goteo (intravenoso) para la prevención y el tratamiento de la encefalopatía hepática a través de la revisión de los ensayos clínicos en los que pacientes con cirrosis se asignaron al azar a tratamiento con L‐ornitina L‐aspartato, a un tratamiento simulado inactivo (llamado placebo), a ningún tratamiento o a otra medicación para este trastorno como lactulosa, probióticos y rifaximina. Se incluyeron los pacientes con cirrosis que presentaban encefalopatía hepática evidente o mínima o que estaban en riesgo de desarrollar dicha complicación.
Fecha de la búsqueda
Diciembre de 2017.
Fuentes de financiación de los estudios
Seis de los 36 ensayos clínicos aleatorios incluidos no recibieron financiamiento ni otro apoyo de las compañías farmacéuticas. Diecisiete ensayos recibieron apoyo económico de compañías farmacéuticas y otros tres recibieron la L‐ornitina L‐aspartato o el placebo inactivo en forma gratuita; no hubo información sobre la financiación en los diez ensayos restantes.
Características de los estudios
Se incluyeron 33 ensayos clínicos aleatorios que compararon L‐ornitina L‐aspartato con placebo inactivo o ninguna intervención y seis ensayos clínicos aleatorios que compararon L‐ornitina L‐aspartato con otros tratamientos contra la encefalopatía; algunos ensayos incluyeron más de una comparación. Cinco de los ensayos incluidos probaron L‐ornitina L‐aspartato para la prevención de la encefalopatía hepática mientras que 30 ensayos probaron su uso como tratamiento para los pacientes con encefalopatía hepática aguda, crónica o mínima. La duración del tratamiento varió de tres a 35 días en los ensayos que probaron la preparación intravenosa (promedio ocho días) y de siete a 180 días en los que probaron la preparación oral (promedio 30 días).
Resultados clave
Los análisis mostraron que la L‐ornitina L‐aspartato podría reducir las muertes, mejorar la encefalopatía hepática y prevenir los efectos secundarios graves en comparación con placebo o ningún tratamiento, pero que no tuvo efectos beneficiosos adicionales en comparación con otra medicación utilizada para prevenir y tratar este trastorno.
Calidad de la evidencia
La evidencia encontrada fue muy débil, por lo que no existe seguridad con respecto a si la L‐ornitina L‐aspartato es útil para prevenir o tratar la encefalopatía hepática en los pacientes con cirrosis. Muchos estudios no se han publicado y, por lo tanto, no se han sometido a una investigación cuidadosa, y muchos de los ensayos publicados recibieron apoyo de la industria farmacéutica lo que introduce un elemento de sesgo. Debido a lo anterior se necesita más información antes de poder determinar el valor de la L‐ornitina L‐aspartato para la prevención y el tratamiento de la encefalopatía hepática.
Conclusiones de los autores
Summary of findings
| L‐ornithine L aspartate compared to placebo or no intervention for people with cirrhosis and hepatic encephalopathy or at risk of developing hepatic encephalopathy | ||||||
| Participants: people with cirrhosis who had minimal or overt hepatic encephalopathy or who were at risk for developing hepatic encephalopathy; regardless of sex, age, aetiology, and severity of the underlying liver disease, or the presence of identified precipitating factors Setting: hospital or outpatient Intervention: L‐ornithine L‐aspartate Comparison: placebo or no intervention Outcomes: all outcomes assessed at maximum duration of follow‐up | ||||||
| Outcomes | Anticipated absolute effects* (95% CI) | Relative effect | № of participants | Quality of the evidence | Comments | |
| Risk with placebo or no intervention | Risk with L‐ornithine L aspartate | |||||
| Mortality | Study population | RR 0.42 (0.24 to 0.72) | 1489 | ⊕⊝⊝⊝ | ‐ | |
| 57 per 1000 | 24 per 1000 | |||||
| Hepatic encephalopathy assessed based on neurocognitive manifestations | Study population | RR 0.70 (0.59 to 0.83) | 1375 (22 RCTs) | ⊕⊝⊝⊝ | ‐ | |
| 470 per 1000 | 329 per 1000 | |||||
| Serious adverse events assessed using ICH‐GCP | Study population | RR 0.63 | 1489 (19 RCTs) | ⊕⊝⊝⊝ | ‐ | |
| 100 per 1000 | 63 per 1000 | |||||
| Quality of life assessed using 3 different questionnaires | 3 RCTs evaluated health‐related quality of life in participants with minimal hepatic encephalopathy. 1 found no difference between interventions based on the Liver Disease Quality of Life Assessment. 2 found a beneficial effect based on the total Sickness Impact Profile score. | (See comment) | ‐ | ⊕⊝⊝⊝ | ‐ | |
| Non‐serious adverse events assessed using ICH‐GCP | Study population | RR 1.15 | 1076 | ⊕⊝⊝⊝ | Reported non‐serious adverse events included gastrointestinal discomfort (e.g. change in bowel habits and bloating), headache, pruritus, and fatigue | |
| 128 per 1000 | 147 per 1000 | |||||
| *The risk in the intervention group (and its 95% confidence interval) is based on the assumed risk in the comparison group and the relative effect of the intervention (and its 95% CI). CHBG: Cochrane Hepato‐Biliary Group; CI: confidence interval; GCP: Good Clinical Practice; ICH: International Conference on Harmonisation; RCT: randomised clinical trial; RR: risk ratio; TSA: Trial Sequential Analysis. | ||||||
| GRADE Working Group grades of evidence | ||||||
| 1Downgraded 3 levels due risk of bias (result not confirmed in analyses of trials with a low risk of bias assessed using CHBG domains); evidence of publication bias (we were unable to gather data from unpublished trials); and imprecision (the TSA ignored the monitoring boundary). 2Downgraded 3 levels due risk of bias (result not confirmed in analyses of trials at low risk of bias assessed using CHBG domains; only 1 trial had a low risk of bias); evidence of publication bias (we were unable to gather data from unpublished trials); and inconsistency (I2 value of 63% and visual inspection of the forest plots suggested a risk of inconsistency). 3Downgraded 3 levels due risk of bias (result not confirmed in analyses of trials at low risk of bias assessed using CHBG domains; only 1 trial had a low risk of bias); evidence of publication bias (we were unable to gather data from unpublished trials); and imprecision (the TSA ignored the monitoring boundary). 4Downgraded 3 levels due to risk of bias (result not confirmed in analyses of trials at low risk of bias assessed using CHBG domains; none of the trials had a low risk of bias); evidence of publication bias (we were unable to gather data from unpublished trials); imprecision (we were only able to evaluate trials individually; trials reporting this outcome were small with wide CIs). 5Downgraded 3 levels due to risk of bias (result not confirmed in analyses of trials at low risk of bias assessed using CHBG domains; only 1 trial had a low risk of bias); evidence of publication bias (we were unable to gather data from unpublished trials); imprecision (trials reporting this outcome were small and the meta‐analysis result had wide CIs). | ||||||
| L‐ornithine L‐aspartate compared to lactulose for people with cirrhosis and hepatic encephalopathy | ||||||
| Patient or population: people with cirrhosis who had minimal or overt hepatic encephalopathy or who were at risk for developing hepatic encephalopathy; regardless of sex, age, aetiology, and severity of the underlying liver disease or the presence of identified precipitating factors Setting: hospital or outpatient Intervention: L‐ornithine L‐aspartate Comparison: lactulose Outcomes: all outcomes assessed at maximum duration of follow‐up | ||||||
| Outcomes | Anticipated absolute effects* (95% CI) | Relative effect | № of participants | Quality of the evidence | Comments | |
| Risk with lactulose | Risk with L‐ornithine L‐aspartate | |||||
| Mortality | Study population | RR 0.68 | 175 | ⊕⊝⊝⊝ | ‐ | |
| 23 per 1000 | 15 per 1000 | |||||
| Hepatic encephalopathy assessed based on neurocognitive manifestations | Study population | RR 1.13 | 175 | ⊕⊝⊝⊝ | ‐ | |
| 364 per 1000 | 411 per 1000 | |||||
| Serious adverse events assessed using ICH‐GCP | Study population | RR 0.69 | 144 | ⊕⊝⊝⊝ | ‐ | |
| 97 per 1000 | 67 per 1000 | |||||
| Quality of life assessed using questionnaires | No evidence was available for this outcome. | |||||
| Non‐serious adverse events assessed using ICH‐GCP | Study population | RR 0.05 | 292 (2 RCTs) | ⊕⊝⊝⊝ | ‐ | |
| 175 per 1000 | 12 per 1000 | |||||
| *The risk in the intervention group (and its 95% confidence interval) is based on the assumed risk in the comparison group and the relative effect of the intervention (and its 95% CI). CHBG: Cochrane Hepato‐Biliary Group; CI: confidence interval; GCP: Good Clinical Practice; ICH: International Conference on Harmonisation; RCT: randomised clinical trial; RR: risk ratio; TSA: Trial Sequential Analysis. | ||||||
| GRADE Working Group grades of evidence | ||||||
| 1Downgraded 3 levels due risk of bias (2 trials had a low risk of bias assessed using CHBG domains) and imprecision (wide CIs; small number of events/participants). We were unable to identify publication bias due to the small number of trials. 2Downgraded 3 levels due risk of bias (none of the included trials had a low risk of bias assessed using CHBG domains) and imprecision (wide CIs; small number of events/participants). We were unable to identify publication bias due to the small number of trials. | ||||||
| L‐ornithine L‐aspartate compared to probiotic for people with cirrhosis and hepatic encephalopathy | ||||||
| Patient or population: people with cirrhosis who had minimal or overt hepatic encephalopathy or who were at risk for developing hepatic encephalopathy; regardless of sex, age, aetiology, and severity of the underlying liver disease, or the presence of identified precipitating factors Setting: hospital or outpatient Intervention: L‐ornithine L‐aspartate Comparison: probiotic | ||||||
| Outcomes | Anticipated absolute effects* (95% CI) | Relative effect | № of participants | Quality of the evidence | Comments | |
| Risk with probiotic | Risk with L‐ornithine L‐aspartate | |||||
| Mortality | Study population | RR 1.01 (0.11 to 9.51) | 143 (2 RCTs) | ⊕⊝⊝⊝ | ‐ | |
| 14 per 1000 | 14 per 1000 | |||||
| Hepatic encephalopathy assessed based on neurocognitive manifestations | Study population | RR 0.71 (0.56 to 0.90) | 143 (2 RCTs) | ⊕⊝⊝⊝ | ‐ | |
| 722 per 1000 | 513 per 1000 | |||||
| Serious adverse events assessed using ICH‐GCP | Study population | RR 1.07 (0.23 to 4.88) | 143 (2 RCTs) | ⊕⊝⊝⊝ | ‐ | |
| 42 per 1000 | 45 per 1000 | |||||
| Quality of life assessed using questionnaires | No evidence available for this outcome. | |||||
| Non‐serious adverse events assessed using ICH‐GCP | No evidence available for this outcome. | |||||
| *The risk in the intervention group (and its 95% confidence interval) is based on the assumed risk in the comparison group and the relative effect of the intervention (and its 95% CI). CHBG: Cochrane Hepato‐Biliary Group; CI: confidence interval; GCP: Good Clinical Practice; ICH: International Conference on Harmonisation; RCT: randomised clinical trial; RR: risk ratio; TSA: Trial Sequential Analysis. | ||||||
| GRADE Working Group grades of evidence | ||||||
| 1Downgraded 3 levels due risk of bias (the analysis only includes 1 trial with a high risk of bias assessed using CHBG domains) and imprecision (wide CIs). We were unable to identify publication bias and did not evaluate heterogeneity because the analysis only includes 1 trial. | ||||||
| L‐ornithine L‐aspartate compared to rifaximin for people with cirrhosis and hepatic encephalopathy | ||||||
| Patient or population: people with cirrhosis who had minimal or overt hepatic encephalopathy or who were at risk for developing hepatic encephalopathy; regardless of sex, age, aetiology, and severity of the underlying liver disease, or the presence of identified precipitating factors Setting: hospital or outpatient Intervention: L‐ornithine L‐aspartate Comparison: rifaximin Outcomes: all outcomes assessed at maximum duration of follow‐up | ||||||
| Outcomes | Anticipated absolute effects* (95% CI) | Relative effect | № of participants | Quality of the evidence | Comments | |
| Risk with rifaximin | Risk with L‐ornithine L‐aspartate | |||||
| Mortality | Study population | RR 0.33 | 105 | ⊕⊝⊝⊝ | ‐ | |
| 38 per 1000 | 13 per 1000 | |||||
| Hepatic encephalopathy assessed based on neurocognitive manifestations | Study population | RR 1.06 | 105 | ⊕⊝⊝⊝ | ‐ | |
| 269 per 1000 | 285 per 1000 | |||||
| Serious adverse events assessed using ICH‐GCP | Study population | RR 0.32 | 43 | ⊕⊝⊝⊝ | ‐ | |
| 48 per 1000 | 15 per 1000 | |||||
| Quality of life assessed using questionnaires | No evidence was available for this outcome. | |||||
| Non‐serious adverse events assessed using ICH‐GCP | Study population | RR 0.32 | 43 | ⊕⊝⊝⊝ | ‐ | |
| 48 per 1000 | 15 per 1000 | |||||
| *The risk in the intervention group (and its 95% confidence interval) is based on the assumed risk in the comparison group and the relative effect of the intervention (and its 95% CI). CHBG: Cochrane Hepato‐Biliary Group; CI: confidence interval; GCP: Good Clinical Practice; ICH: International Conference on Harmonisation; RCT: randomised clinical trial; RR: risk ratio; TSA: Trial Sequential Analysis. | ||||||
| GRADE Working Group grades of evidence | ||||||
| 1Downgraded 3 levels due risk of bias (1 of the included trials had a low risk of bias assessed using CHBG domains) and imprecision (wide CIs; small number of events/participants). We were unable to identify publication bias due to the small number of trials. 2Downgraded 3 levels due risk of bias (the included trial had a high risk of bias assessed using CHBG domains) and imprecision (wide CIs; small number of events/participants). We were unable to identify publication bias due to the small number of trials. | ||||||
Antecedentes
Descripción de la afección
El término encefalopatía hepática se utiliza para describir el espectro de cambio neurosiquiátrico que puede surgir en los pacientes con cirrosis. La guía conjunta de la European Association for the Study of the Liver (EASL) y la American Association for the Study of Liver Diseases (AASLD) define la encefalopatía hepática como: "disfunción cerebral asociada con insuficiencia hepática o derivación porto‐sistémica" (EASL/AASLD 2014a; EASL/AASLD 2014b).
La encefalopatía hepática clínicamente visible o evidente se manifiesta como un síndrome neuropsiquiátrico que abarca un espectro amplio de trastornos mentales y motores (Weissenborn 1998; Ferenci 2002). Se puede desarrollar durante un período de horas o días, aparentemente de forma espontánea, o de lo contrario, en el 50% al 70% de los casos, después de un evento identificable desencadenante como: hemorragia gastrointestinal, infección o transgresión alimentaria. Los episodios pueden reaparecer. Entre los episodios, los pacientes pueden retornar al estado neurosiquiátrico inicial o mantener un grado de deficiencia (Bajaj 2010). Con menor frecuencia, los pacientes presentan anomalías neurosiquiátricas persistentes, que hasta cierto punto siempre están presentes, pero cuya gravedad puede fluctuar. Los cambios en el estado mental varían desde alteraciones sutiles en la personalidad, la capacidad intelectual y la función cognitiva hasta el coma profundo. Los cambios en la función motora pueden incluir rigidez, trastornos en la producción del habla, temblores, movimientos diadococinéticos retardados, hiper o hiporreflexia, movimientos coreoatetoides, signo de Babinsky y síntomas focales transitorios (Victor 1965; Weissenborn 1998; Cadranel 2001). La asterixis, también conocida como un temblor tipo aleteo, es la anomalía motora más conocida. Los pacientes con encefalopatía hepática evidente también muestran otras anomalías como deterioro en el rendimiento psicomotor (Schomerus 1998); la función neurofisiológica (Parsons‐Smith 1957; Chu 1997); y alteraciones en la homeostasis cerebral neuroquímica/de neurotransmisores (Taylor‐Robinson 1994), el flujo sanguíneo y el metabolismo (O’Carroll 1991) y la homeostasis del líquido cerebral (Haussinger 2000). En general, el grado de deterioro en estas variables aumenta con la gravedad de la enfermedad hepática subyacente (Bajaj 2009).
La encefalopatía hepática mínima (en la bibliografía más antigua "subclínica" o "latente") es el término utilizado para describir el estado neurosiquiátrico de los pacientes con cirrosis sin déficits neurocognitivos clínicos evidentes pero que muestran anomalías en el rendimiento neuropsicométrico o neurofisiológico (Ferenci 2002; Guérit 2009; Atluri 2011).
No hay un valor de referencia (gold standard) para el diagnóstico de la encefalopatía hepática; sin embargo, hay varias pruebas diagnósticas que se pueden utilizar solas o en combinación (Montagnese 2004). Se requiere una historia clínica neurosiquiátrica y un examen completos para identificar las anomalías evocadoras de la encefalopatía hepática que incluyen: cambios en la memoria, la concentración, la cognición y la conciencia e, igualmente importante, para confirmar su ausencia (Montagnese 2004). Los West Haven Criteria se utilizan generalmente para evaluar los cambios en el estado mental (Conn 1977), mientras que la Glasgow Coma Score se utiliza para evaluar el estado de conciencia (Teasdale 1974). También es importante considerar y excluir otras causas potenciales de las anomalías neurosiquiátricas incluidos los trastornos neurológicos concomitantes y otras encefalopatías metabólicas como las asociadas con la diabetes, la insuficiencia renal y la enfermedad pulmonar crónica (EASL/AASLD 2014a; EASL/AASLD 2014b).
Los pacientes con encefalopatía hepática muestran deterioros en diversas pruebas psicométricas. Los pacientes con encefalopatía hepática mínima muestran déficits en la atención, las capacidades visuoespaciales, las aptitudes motoras finas o la memoria (Montagnese 2004; Randolph 2009), mientras que los pacientes con encefalopatía hepática evidente muestran cambios adicionales en la velocidad psicomotora, la función ejecutiva y la concentración. Se utilizan varias pruebas psicométricas con papel y lápiz en la evaluación del rendimiento cognitivo. Estas pruebas se usan individualmente o se agrupan en baterías o sistemas de pruebas. De las mismas, las Number Connection Tests A & B son las más conocidas (Ferenci 2002). La Psychometric Hepatic Encephalopathy Score (PHES), que comprende cinco pruebas con papel y lápiz que abarcan los dominios de la atención, la percepción visual, y las capacidades visuoconstructivas, es la batería de pruebas psicométricas utilizada más ampliamente y tiene una alta especificidad diagnóstica (Schomerus 1998; Weissenborn 2001); la calificación de las pruebas se debe ajustar para varias variables de confusión, como la edad y el nivel de educación; muchos países ahora han desarrollado bases de datos normativas apropiadas. En los países en los que los niveles de analfabetismo son altos, las Figure Connection Tests A & B a menudo se usan solas o como parte de la batería PHES (Dhiman 1995).
Los pacientes con encefalopatía hepática también pueden mostrar varias anomalías neurofisiológicas (Guérit 2009). El electroencefalograma, que principalmente refleja la actividad neuronal cortical, puede mostrar una disminución progresiva de la actividad de fondo y la morfología de la onda anormal. Los adelantos recientes en el análisis del electroencefalograma permiten obtener mejores datos cuantificables y más informativos (Jackson 2016; Olesen 2016). Las respuestas cerebrales, o los potenciales evocados, a los estímulos como la luz y los sonidos pueden mostrar patrones de ondas con enlentecimiento o anormales (o ambos) (Chu 1997; Guérit 2009). Otras técnicas de diagnóstico potenciales, como la Critical Flicker Fusion Frequency (Kircheis 2002), y la Inhibitory Control Test, se deben validar de forma adicional (Bajaj 2008). Las concentraciones de amoníaco en sangre no se miden de forma sistemática para diagnosticar la encefalopatía hepática (Lockwood 2004; Blanco Vela 2011a), aunque a menudo son monitorizadas en los ensayos clínicos.
Descripción de la intervención
La L‐ornitina L‐aspartato es una sal estable de los aminoácidos ornitina y ácido aspártico. Se puede administrar por vía oral e intravenosa (Rose 1998; Blanco Vela 2011b).
De qué manera podría funcionar la intervención
No se conoce la patogenia exacta de la encefalopatía hepática, aunque se sabe que el amoníaco desempeña una función clave (Butterworth 2014). Las fuentes principales de amoníaco en el cuerpo son los productos nitrogenados en la dieta, el metabolismo bacteriano de la urea y las proteínas en el colon, así como la desaminación de la glutamina en el intestino delgado. El amoníaco producido en los intestinos se absorbe en la vena portal, y junto con el amoníaco derivado del metabolismo de aminoácidos hepáticos, es incorporado por los hepatocitos periportales y metabolizado a urea a través del ciclo de la urea. Parte del amoníaco es incorporado por los hepatocitos perivenosos donde se convierte a glutamina a través de la glutamina sintetasa. Estos dos sistemas, trabajando al unísono, controlan estrechamente las concentraciones de amoníaco en sangre en las venas hepáticas. El riñón y el músculo también desempeñan una función en la homeostasis del amoníaco (Wright 2011). En el músculo esquelético, el amoníaco se transforma en glutamina mediante la acción de la glutamina sintetasa. En los riñones, el amoníaco se genera a partir de la desaminación de glutamina.
En los pacientes con cirrosis este sistema para desintoxicarse del amoníaco puede fallar, primero: debido al fracaso de la función de los hepatocitos, y segundo: debido a que la presencia de vasos colaterales sistémicos portales permite que la sangre evite el paso por el hígado. Como resultado, el hígado no elimina de forma efectiva de la sangre el amoníaco derivado de los intestinos; lo que provoca que se introduzca en la circulación sistémica e incida en el cerebro donde tiene efectos directos e indirectos sobre la función cerebral.
La L‐ornitina L‐aspartato promueve la eliminación hepática del amoníaco mediante la estimulación de la actividad hepática residual del ciclo de la urea y provoca la síntesis de glutamina, en particular en el músculo esquelético (Rose 1999). La fracción de ornitina estimula la actividad de la carbamoil fosfato sintetasa dentro del hígado, mientras que la fracción de aspartato estimula la actividad de la arginasa mediante la donación de nitrógeno. También mejora las actividades de las transaminasas ornitina y aspartato en los tejidos periféricos para provocar la producción de glutamato, que ocurre predominantemente en el músculo (Gebhardt 1997; Rose 1998; Blanco Vela 2011a). Por lo tanto, la L‐ornitina L‐aspartato tiene actividades de disminución del amoníaco que podrían beneficiar a los pacientes con encefalopatía hepática.
Por qué es importante realizar esta revisión
La encefalopatía hepática es una complicación frecuente y debilitante de la cirrosis. Aproximadamente del 10% al 14% de los pacientes con cirrosis presentan encefalopatía hepática evidente cuando reciben el primer diagnóstico de enfermedad hepática (Saunders 1981). En los pacientes con cirrosis descompensada, la prevalencia de la encefalopatía hepática evidente al momento del diagnóstico está alrededor del 20% (D'Amico 1986; de Jongh 1992; Zipprich 2012). En los pacientes con cirrosis que no presentan evidencia de deterioro neurosiquiátrico, el riesgo de desarrollar un episodio de encefalopatía hepática evidente, en el transcurso de cinco años desde el diagnóstico, varía del 5% al 25% según la presencia o la ausencia de otros factores de riesgo; la incidencia acumulada de la encefalopatía hepática evidente alcanza el 40% (Randolph 2009; Bajaj 2011a). La prevalencia de la encefalopatía hepática mínima puede ser mayor del 50% en los pacientes con encefalopatía hepática evidente anterior (Sharma 2010; Lauridsen 2011).
La presencia de encefalopatía hepática, ya sea mínima o evidente, se asocia con un deterioro significativo en el rendimiento en las tareas complejas, como la conducción (Schomerus 1981; Bajaj 2009; Kircheis 2009) y un efecto perjudicial sobre la calidad de vida (Groeneweg 1998) y la seguridad (Roman 2011). Además, la presencia de encefalopatía hepática evidente pretrasplante tiene un efecto perjudicial sobre la función neurocognitiva postrasplante (Sotil 2009) y en la supervivencia (Bustamante 1999; D'Amico 2006; Stewart 2007; Jepsen 2010). La tasa de supervivencia al año en los pacientes con encefalopatía hepática al momento del diagnóstico es del 36%, con una tasa de supervivencia a los cinco años del 15% (Jepsen 2010), mientras que la probabilidad de supervivencia después de un primer episodio de encefalopatía hepática es del 42% al año pero sólo del 23% a los tres años (Bustamante 1999). La encefalopatía hepática evidente también plantea una carga significativa para los cuidadores de los pacientes afectados (Bajaj 2011b), y una carga económica significativa para los sistemas de asistencia sanitaria (Poodad 2007; Stepanova 2012).
Se necesitan claramente medios para la prevención y el tratamiento de la encefalopatía hepática en los pacientes con cirrosis; la L‐ornitina L‐aspartato, debido a sus propiedades de disminución del amoníaco, es un candidato potencial. La ventaja de la L‐ornitina L‐aspartato, si se probara que es efectiva y segura, es que está disponible como una preparación oral y una infusión intravenosa; como tal, puede beneficiar a los pacientes con encefalopatía hepática aguda (episódica), que es particularmente difícil de tratar. Sin embargo, los ensayos clínicos aleatorios realizados hasta la fecha han establecido diferentes conclusiones, al igual que los cinco metanálisis realizados entre 2000 y 2013 (Delcker 2000a; Jiang 2009; Soarez 2009; Perez Hernandez 2011; Bai 2013). Además, las guías EASL/AASLD señalaron con respecto a la L‐ornitina L‐aspartato que se puede utilizar como un agente alternativo o adicional para tratar a los pacientes que no responden al tratamiento convencional, pero que la administración de suplementos orales de L‐ornitina L‐aspartato no es efectiva (EASL/AASLD 2014a; EASL/AASLD 2014b). Sin embargo, no se proporcionó una base de evidencia para esta declaración de posición.
Por lo tanto, se ha realizado una revisión sistemática con metanálisis de todos los ensayos clínicos aleatorios disponibles de L‐ornitina L‐aspartato para la encefalopatía hepática en los pacientes con cirrosis, que sigue las recomendaciones para una práctica adecuada.
Objetivos
Evaluar los efectos beneficiosos y perjudiciales de la L‐ornitina L‐aspartato versus placebo, ninguna intervención u otras intervenciones activas en los pacientes con cirrosis y encefalopatía hepática.
Métodos
Criterios de inclusión de estudios para esta revisión
Tipos de estudios
En los análisis primarios de esta revisión se incluyeron ensayos clínicos aleatorios independientemente del estado de publicación, el idioma o el cegamiento. Cuando durante la selección de los ensayos se identificaron estudios observacionales (es decir, estudios cuasialeatorios, estudios de cohorte, o informes de pacientes) que informaron eventos adversos causados o asociados con las intervenciones de la revisión, dichos estudios se incluyeron en la revisión de los eventos adversos. No se realizaron búsquedas específicas de estudios observacionales para inclusión en esta revisión, lo que se reconoce como una limitación.
Tipos de participantes
Se incluyeron los pacientes con cirrosis que presentaban encefalopatía hepática mínima o evidente o que estaban en riesgo de desarrollar encefalopatía hepática. Los pacientes se incluyeron en los análisis primarios independientemente del sexo, la edad, la etiología y la gravedad de la enfermedad hepática subyacente, o la presencia de factores desencadenantes identificados. Se excluyeron los datos sobre los pacientes con encefalopatía hepática asociada con insuficiencia hepática aguda o de los pacientes con hipertensión portal no cirrótica.
Tipos de intervenciones
Se comparó: L‐ornitina L‐aspartato versus placebo o ninguna intervención; y L‐ornitina L‐aspartato versus otros agentes activos como disacáridos no absorbibles, antibióticos, probióticos o aminoácidos de cadena ramificada. Los ensayos se incluyeron independientemente de la dosis, la duración del tratamiento o la forma de administración de la L‐ornitina L‐aspartato. Se permitieron las cointervenciones cuando se administraron por igual a todos los grupos de comparación.
No se planificó incluir análisis del fenilbutirato de glicerol, el fenilacetato de ornitina ni los adsorbentes de carbono esférico (AST‐120), debido a que los mismos se evaluarán en otra revisión (Zacharias 2017).
Tipos de medida de resultado
Se evaluaron todos los resultados en la duración máxima del seguimiento (Gluud 2017).
Resultados primarios
-
Mortalidad por todas las causas.
-
Encefalopatía hepática. El resultado se examinó mediante la evaluación general de los investigadores primarios del número de participantes que desarrollaron encefalopatía hepática; y el número de participantes sin una mejoría clínicamente relevante en la encefalopatía hepática.
-
Eventos adversos graves: definido como cualquier evento médico adverso que diera lugar a la muerte; fuera potencialmente mortal; o requiriera hospitalización o prolongación de la hospitalización; o diera lugar a discapacidad persistente o significativa (ICH‐GCP 1997). Los eventos adversos graves se analizaron como un resultado compuesto (Gluud 2017).
Resultados secundarios
-
Eventos adversos no graves (todos los eventos adversos que no cumplieron con los criterios enumerados de eventos adversos graves).
-
Calidad de vida relacionada con la salud.
Resultados exploratorios
-
Concentración de amoníaco en sangre arterial o venosa.
Métodos de búsqueda para la identificación de los estudios
The last search update was undertaken in December 2017.
Búsquedas electrónicas
We searched The Cochrane Hepato‐Biliary Group Controlled Trials Register (December 2017; Gluud 2017), Cochrane Central Register of Controlled Trials (CENTRAL) in the Cochrane Library (2017, Issue 11), MEDLINE Ovid (1946 to December 2017), Embase Ovid (1974 to December 2017), LILACS (1982 to December 2017; Bireme), Science Citation Index Expanded (1900 to December 2017; Web of Science), and Conference Proceedings Citation Index ‐ Science (1990 to December 2017; Web of Science) (Royle 2003), using the strategies and time spans detailed in Appendix 1. We did not have access to Chinese or Japanese databases but plan to search these in future updates should they become available to us via the Cochrane Hepato‐Biliary Group.
Búsqueda de otros recursos
We scanned the reference lists of relevant articles identified in the electronic searches, and proceedings from meetings of the British Society for Gastroenterology (BSG), the British Association for the Study of the Liver (BASL), the EASL, the United European Gastroenterology Week (UEGW), the American Gastroenterological Association (AGA), the AASLD, and the International Society for Hepatic Encephalopathy and Nitrogen Metabolism (ISHEN). We wrote to the principal authors of trials and the pharmaceutical companies involved in the manufacture and marketing of L‐ornithine L‐aspartate for additional information about both completed and ongoing trials.
We also searched online trial registries such as ClinicalTrial.gov (clinicaltrials.gov/); the European Medicines Agency (EMA) (www.ema.europa.eu/ema/); the World Health Organization International Clinical Trial Registry Platform (www.who.int/ictrp); and the Food and Drug Administration (FDA) (www.fda.gov), as well as pharmaceutical company sources for ongoing or unpublished trials and Google Scholar. We used the same or similar search terms to those used for searching the electronic databases (Appendix 1).
Obtención y análisis de los datos
Selección de los estudios
Three review authors (ETG, MYM, and CS), working independently, read the electronic search output, performed additional manual searches, and listed potentially eligible trials. One review author (MYM) liaised with the authors and pharmaceutical sponsor of identified unpublished trials to seek their release. All review authors read the potentially eligible trials and participated in the final selection of trials for inclusion. For trials described in more than one publication, we selected the paper with the longest duration of follow‐up as our primary reference. We listed details of all the included studies in the Characteristics of included studies table, and listed all the excluded trials with the reasons for their exclusion in the Characteristics of excluded studies table. A fourth review author (LLG) acted as ombudsman in case of disagreements on trial suitability for inclusion or exclusion. We resolved contrary opinions through discussion.
Extracción y manejo de los datos
All review authors participated in data extraction and at least two review authors independently evaluated each randomised clinical trial. We asked medical professionals fluent in the language of the publication to translate foreign language papers. We requested missing data and other information from the published trial reports through correspondence with the authors of the included trials. We sought information and data from identified but unpublished trials by correspondence with trial authors and sponsors.
We gathered the following data from the included trials:
-
Trials: design (cross‐over or parallel); settings (number of clinical sites; outpatient or inpatient; inclusion period); country of origin; inclusion period; publication status;
-
participants: mean age, proportion of men, aetiology of cirrhosis, type of hepatic encephalopathy (diagnostic criteria and definitions/terminology), previous history of hepatic encephalopathy;
-
interventions: type, dose, duration of therapy, mode of administration;
-
primary and secondary outcome data, including the definitions used in the assessment of overall improvement of hepatic encephalopathy, and bias control.
Evaluación del riesgo de sesgo de los estudios incluidos
We assessed bias control using the domains described in the Cochrane Hepato‐Biliary Group module (Gluud 2017), and classified the risk of bias for separate domains as high, unclear, or low (Higgins 2011). We also included an overall assessment of bias control for both mortality and non‐mortality outcomes.
Allocation sequence generation
-
Low risk of bias: sequence generation achieved using computer random number generation or a random number table. Drawing lots, tossing a coin, shuffling cards, or throwing dice were adequate only if performed by an independent person.
-
Unclear risk of bias: not described.
-
High risk of bias: sequence generation method was not random.
Allocation concealment
-
Low risk of bias: allocation by a central and independent randomisation unit, administration of coded, identical drug containers/vials or sequentially numbered, opaque, sealed envelopes.
-
Unclear risk of bias: not described.
-
High risk of bias: the allocation sequence was likely to be known to the investigators who assigned the participants.
Blinding of participants and personnel
-
Low risk of bias: blinding of participants and personnel using placebo, double dummy, or similar. We defined lack of blinding as not likely to affect the assessment of mortality.
-
Unclear risk of bias: not described.
-
High risk of bias: no blinding or incomplete blinding, and the assessment of outcomes were likely to be influenced by lack of blinding (non‐mortality outcomes).
Blinding of outcome assessors
-
Low risk of bias: blinding of the outcome assessor using a placebo, double dummy, or similar. We defined lack of blinding as not likely to affect the assessment of mortality.
-
Unclear risk of bias: insufficient information.
-
High risk of bias: no blinding or incomplete blinding, and the assessment of outcomes were likely to be influenced by lack of blinding (non‐mortality outcomes).
Incomplete outcome data
-
Low risk of bias: missing data were unlikely to make treatment effects depart from plausible values. The investigators used sufficient methods, such as intention‐to‐treat analyses with multiple imputations or carry‐forward analyses, to handle missing data.
-
Unclear risk of bias: insufficient information.
-
High risk of bias: results were likely to be biased due to missing data.
Selective outcome reporting
-
Low risk of bias: trial reported clinically relevant outcomes such as mortality, hepatic encephalopathy, and serious adverse events. If we had access to the original trial protocol, the outcomes selected were those described in the protocol. If we obtained information from a trial registry (such as www.clinicaltrials.gov), we only used that information if the investigators registered the trial before inclusion of the first participant.
-
Unclear risk of bias: not all predefined outcomes were reported fully, or it was unclear whether data on these outcomes were recorded or not.
-
High risk of bias: one or more predefined outcomes were not reported.
For‐profit bias
-
Low risk of bias: trial appeared free of industry sponsorship or other type of for‐profit support.
-
Unclear risk of bias: insufficient information about support or sponsorship.
-
High risk of bias: trial received funding or other support from a pharmaceutical company including the provision of trial drugs.
Other bias
-
Low risk of bias: trial appeared free of other biases including: medicinal dosing problems or follow‐up (as defined below).
-
Unclear risk of bias: trial may or may not have been free of other factors that could put it at risk of bias.
-
High risk of bias: there were other factors in the trial that could have put it at risk of bias such as the administration of inappropriate treatments being given to the controls (e.g. an inappropriate dose) or follow‐up (e.g. the trial included different follow‐up schedules for participants in the allocation groups).
Overall bias assessment
-
Low risk of bias: all domains were low risk of bias using the definitions described above.
-
High risk of bias: one or more of the bias domains were of unclear or high risk of bias.
Medidas del efecto del tratamiento
We used risk ratios (RR) for dichotomous outcomes and mean differences (MD) for continuous outcomes, both with 95% confidence intervals (CI). We also used Trial Sequential Analysis‐adjusted CI.
Cuestiones relativas a la unidad de análisis
We included randomised clinical trials using a parallel group design; we only included data from the first treatment period of cross‐over trials (Higgins 2011). We included separate pair‐wise comparisons from multi‐arm trials. Accordingly, if a trial compared L‐ornithine L‐aspartate, rifaximin, and lactulose, we conducted separate analyses for L‐ornithine L‐aspartate versus rifaximin and L‐ornithine L‐aspartate versus lactulose.
Manejo de los datos faltantes
We extracted data on all randomised participants to allow intention‐to‐treat analyses. We planned to undertake analyses, using simple imputation, to evaluate the potential influence of missing outcome data (Higgins 2008), including 'worst‐case' and 'best‐case' scenario analyses in which participants in the intervention arm with missing outcome data would be classified as failures while their counterparts in the control arm would be classified as successes and vice versa (Gluud 2017).
Evaluación de la heterogeneidad
We evaluated heterogeneity based on visual inspection of forest plots and expressed heterogeneity as I2 values using the following thresholds: 0% to 40% (unimportant), 40% to 60% (moderate), 60% to 80% (substantial), and greater than 80% (considerable). We included the information in the 'Summary of findings' tables.
Evaluación de los sesgos de notificación
For meta‐analyses with at least 10 randomised clinical trials, we assessed reporting biases through regression analyses and visual inspection of funnel plots (Harbord 2006).
Síntesis de los datos
We performed the analyses in Review Manager 5 (RevMan 2014), STATA (Stata 14), and Trial Sequential Analysis (TSA 2011).
Meta‐analysis
In our primary analyses, we stratified randomised clinical trials based on the type of control intervention (i.e. placebo or no intervention, non‐absorbable disaccharides, antibiotics, and probiotics). We compared the fixed‐effect and random‐effects estimates of the intervention effect. If the estimates were similar, then we assumed that any small‐study effects had little effect on the intervention effect estimate. If the random‐effects estimate was more beneficial, we re‐evaluated whether it was reasonable to conclude that the intervention was more effective in the smaller studies. If the larger studies tend to be those conducted with greater methodological rigour, or conducted in circumstances more typical of the use of the intervention in practice, then we reported the results of meta‐analyses restricted to the larger, more rigorous studies. Based on the clinical heterogeneity, we expected that several analyses would display statistical between‐trial heterogeneity (I2 greater than 0%). For random‐effects models, precision decreased with increasing heterogeneity and CIs would widen correspondingly. Therefore, we expected that the random‐effects model would give the most conservative (and a more correct) estimate of the intervention effect. Accordingly, we planned to report the results of our analyses based on random‐effects meta‐analyses.
Trial Sequential Analysis
We performed Trial Sequential Analysis to evaluate the risk of type 1 and type 2 errors (TSA 2011; Wetterslev 2017), and to evaluate futility in the analyses of our primary outcomes (Higgins 2008). We defined the required information size (also known as the 'heterogeneity adjusted required information size' (DARIS)) as the number of participants needed to detect or reject an intervention effect based on the relative risk reduction (RRR) and assumed control risk (ACR). We defined firm evidence as established if the Z‐curve crossed the monitoring boundary (also known as the 'trial sequential monitoring boundary') before reaching the required information size. We constructed futility boundaries to evaluate the uncertainty of obtaining a chance neutral finding. We performed the analyses with alpha set to 3%, power to 90%, and model‐based diversity. We planned to conduct the analyses including all randomised clinical trials and limited to trials at low risk of bias. We only undertook analyses including all trials due to the small number of trials at low risk of bias. We planned to estimate the RRR based on the upper CI for outcomes with a potential beneficial effect and the ACR in the pair‐wise meta‐analysis: for mortality, we used an RRR of 18% and an ACR of 5% (diversity 0%); for hepatic encephalopathy, we used an RRR set to 17% and an ACT of 40% (diversity 78%); for serious adverse events, we used an RRR of 10% and an ACR of 10% (diversity 0%). Due to the limited statistical power of our analyses, we also undertook post‐hoc Trial Sequential Analyses using an assumed RRR of 25% for the outcomes mortality and serious adverse events.
Análisis de subgrupos e investigación de la heterogeneidad
We undertook subgroup analyses to investigate heterogeneity based on stratification of trials by risk of bias and the type of hepatic encephalopathy overt (acute (episodic/recurrent) or chronic); minimal, and primary prevention. We also compared randomised clinical trials evaluating intravenous or oral L‐ornithine L‐aspartate and compared randomised clinical trials by publication status. Subgroup differences were analysed based on the variation (interaction) between different populations of participants or trials, using the test for subgroup differences (Chi2 and I2 values).
Análisis de sensibilidad
We performed sensitivity analyses excluding randomised clinical trials that included participants with iatrogenic shunts, and planned to conduct worst‐case and best‐case scenario analyses if we had access to the necessary data (number of participants with missing outcome data in both allocation groups).
'Summary of findings' tables
We used GRADEpro to generate 'Summary of findings' tables with information about all primary and secondary outcomes, risk of bias, and results of the meta‐analyses (Brozek 2008). We used the GRADE system to evaluate the quality of the evidence for outcomes reported in the review (Brozek 2008), considering the within‐trial risk of bias, inconsistency, imprecision, indirectness, and publication bias. We included the information in the interpretation of our results and reported conclusions based on the 'EPICOT' principle (Brown 2006).
Results
Description of studies
We identified 36 randomised clinical trials which potentially fulfilled our inclusion criteria (Characteristics of included studies table; Merz 1987; Merz 1988a; Merz 1988b; Merz 1988c; Merz 1988d; Merz 1989a; Merz 1989b; Merz 1992a; Merz 1994a; Merz 1994b; Feher 1997; Kircheis 1997; Stauch 1998; Fleig 1999; Hong 2003; Chen 2005; Poo 2006; Ahmad 2008; Maldonado 2010; Nimanong 2010; Oruc 2010; Puri 2010; Schmid 2010; Abid 2011; Blanco Vela 2011c; Mittal 2011; Ndraha 2011; Hasan 2012; Zhou 2013; Alvares‐da‐Silva 2014; Bai 2014; Sharma 2014; Higuera‐de la Tijera 2017; Taylor‐Robinson 2017; Varakanahalli 2017; Sidhu 2018).
We excluded 20 studies because they were quasi‐randomised, observational, included participants with acute liver failure, were not controlled, or for other reasons (Characteristics of excluded studies table; Müting 1980; Reikowski 1982; Merz 1988e; Merz 1991; Merz 1992b; Staedt 1993; Rees 2000; Delcker 2002; Acharya 2009; Abdo‐Francis 2010; Lim 2010; Ndhara 2010; Ong 2011; Tenda 2012; McPhail 2013; Aidrus 2015; Badea 2015; Popa 2015; Tiller 2016; Grover 2017).
We identified no ongoing studies.
Results of the search
We identified 4151 potentially relevant references from electronic databases and 47 additional records through manual searches and enquiries (Figure 1). We removed duplicates and references that did not refer to publications relevant to this review (e.g. publications describing animal studies), leaving 68 reports for further assessment. Included within these 68 were reports of 13 trials (Merz 1987; Merz 1988a; Merz 1988b; Merz 1988c; Merz 1988d; Merz 1988e; Merz 1989a; Merz 1989b; Merz 1991; Merz 1992a; Merz 1992b; Merz 1994a; Merz 1994b), from an unpublished report of a meta‐analysis of studies undertaken between 1986 and 1999 by Merz Pharmaceuticals or an oral presentation of a meta‐analysis of published and unpublished trials given at the International Society for Hepatic Encephalopathy and Nitrogen Metabolism (ISHEN) 2017 meeting by a Merz representative (or both Merz Pharmaceuticals and ISHEN). Of these, we excluded three trials that were not randomised or did not appear to include participants with cirrhosis or hepatic encephalopathy (Merz 1988e; Merz 1991; Merz 1992b; Characteristics of excluded studies table). A further 25 reports describing 17 trials were excluded for a variety of reasons. In total, we identified 40 records describing 36 randomised clinical trials, which fulfilled our inclusion criteria (Merz 1987; Merz 1988a; Merz 1988b; Merz 1988c; Merz 1988d; Merz 1989a; Merz 1989b; Merz 1992a; Merz 1994a; Merz 1994b; Feher 1997; Kircheis 1997; Stauch 1998; Fleig 1999; Hong 2003; Chen 2005; Poo 2006; Ahmad 2008; Maldonado 2010; Nimanong 2010; Oruc 2010; Puri 2010; Schmid 2010; Abid 2011; Blanco Vela 2011c; Mittal 2011; Ndraha 2011; Hasan 2012; Zhou 2013; Alvares‐da‐Silva 2014; Bai 2014; Sharma 2014; Higuera‐de la Tijera 2017; Taylor‐Robinson 2017; Varakanahalli 2017; Sidhu 2018).
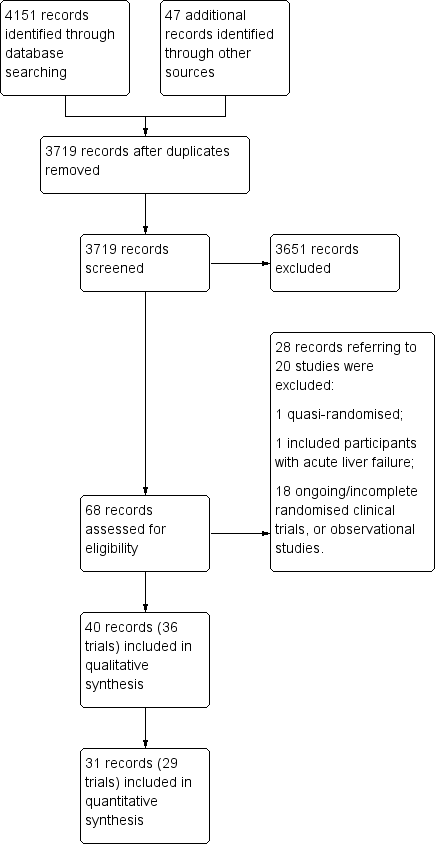
Study flow diagram.
We were unable to gather outcome data from four randomised clinical trials, involving 317 participants, which were only published as abstracts and for which, despite enquiry, no further information was forthcoming (Fleig 1999; Maldonado 2010; Oruc 2010; Hasan 2012). We were also unable to obtain outcome data from three of the remaining ten unpublished trials, involving at least 169 participants (Merz 1988d; Merz 1994a; Merz 1994b). Accordingly, our qualitative analyses included 36 randomised clinical trials while our quantitative analyses included 29 randomised clinical trials (Figure 1).
Included studies
Sixteen randomised clinical trials were published as full paper articles (Feher 1997; Kircheis 1997; Stauch 1998; Hong 2003; Chen 2005; Poo 2006; Ahmad 2008; Schmid 2010; Abid 2011; Mittal 2011; Ndraha 2011; Zhou 2013; Alvares‐da‐Silva 2014; Bai 2014; Sharma 2014; Sidhu 2018), 10 as abstracts (Fleig 1999; Maldonado 2010; Nimanong 2010; Oruc 2010; Puri 2010; Blanco Vela 2011c; Hasan 2012; Higuera‐de la Tijera 2017; Taylor‐Robinson 2017; Varakanahalli 2017), and 10 were unpublished (Merz 1987; Merz 1988a; Merz 1988b; Merz 1988c; Merz 1988d; Merz 1989a; Merz 1989b; Merz 1992a; Merz 1994a; Merz 1994b). We received information from investigators about the methods and outcomes for seven of the included randomised clinical trials (Abid 2011; Blanco Vela 2011c; Mittal 2011; Bai 2014; Higuera‐de la Tijera 2017; Taylor‐Robinson 2017; Sidhu 2018). We also received an unpublished report from Merz Pharmaceuticals and information from a Merz‐sponsored presentation of published and unpublished studies which provided information on 10 additional unpublished randomised clinical trials (Merz 1987; Merz 1988a; Merz 1988b; Merz 1988c; Merz 1988d; Merz 1989a; Merz 1989b; Merz 1992a; Merz 1994a; Merz 1994b).
The countries of origin of the included trials, where known, were China (Hong 2003; Chen 2005; Zhou 2013; Bai 2014), Germany (Merz 1988b; Merz 1988c; Merz 1989a; Feher 1997; Kircheis 1997; Stauch 1998; Fleig 1999), India (Puri 2010; Mittal 2011; Sharma 2014; Varakanahalli 2017; Sidhu 2018), Mexico (Poo 2006; Maldonado 2010; Blanco Vela 2011c; Higuera‐de la Tijera 2017), Indonesia (Ndraha 2011; Hasan 2012), Pakistan (Ahmad 2008; Abid 2011), Austria (Schmid 2010), Brazil (Alvares‐da‐Silva 2014), Thailand (Nimanong 2010), Turkey (Oruc 2010), and the UK (Taylor‐Robinson 2017).
Participants
The total number of registered participants was at least 2377. Seven randomised clinical trials included participants with acute, overt hepatic encephalopathy (Chen 2005; Ahmad 2008; Nimanong 2010; Oruc 2010; Blanco Vela 2011c; Zhou 2013; Sidhu 2018), one evaluated participants with chronic hepatic encephalopathy (Poo 2006), seven evaluated minimal hepatic encephalopathy (Hong 2003; Maldonado 2010; Puri 2010; Mittal 2011; Ndraha 2011; Alvares‐da‐Silva 2014; Sharma 2014), and four evaluated participants with no previous hepatic encephalopathy (Feher 1997; Bai 2014; Higuera‐de la Tijera 2017; Taylor‐Robinson 2017). One trial looked at the prevention of recurrence of hepatic encephalopathy (Varakanahalli 2017). The remaining randomised clinical trials evaluated participants with acute, overt, or minimal hepatic encephalopathy (Abid 2011), participants with chronic, overt, or minimal hepatic encephalopathy (Merz 1987; Merz 1988a; Merz 1988b; Merz 1988c; Merz 1989a; Merz 1989b; Merz 1992a; Merz 1994a; Merz 1994b; Kircheis 1997; Stauch 1998; Fleig 1999; Schmid 2010; Hasan 2012), or participants with minimal or no previous hepatic encephalopathy (Taylor‐Robinson 2017). Information on the type of hepatic encephalopathy could not be obtained for two of the unpublished randomised clinical trials (Merz 1988d; Merz 1994a).
Interventions
Thirty‐six randomised clinical trials compared L‐ornithine L‐aspartate with either placebo (Merz 1987; Merz 1988a; Merz 1988b; Merz 1988c; Merz 1988d; Merz 1989a; Merz 1989b; Merz 1992a; Merz 1994a; Feher 1997; Kircheis 1997; Stauch 1998; Fleig 1999; Ahmad 2008; Maldonado 2010; Nimanong 2010; Oruc 2010; Puri 2010; Schmid 2010; Abid 2011; Hasan 2012; Alvares‐da‐Silva 2014; Bai 2014; Sharma 2014; Higuera‐de la Tijera 2017; Taylor‐Robinson 2017; Varakanahalli 2017; Sidhu 2018), or no intervention (Hong 2003; Chen 2005; Mittal 2011; Ndraha 2011; Zhou 2013). Six randomised clinical trials included control groups allocated to lactulose (Merz 1994b; Poo 2006; Blanco Vela 2011c; Mittal 2011; Higuera‐de la Tijera 2017), probiotics (Mittal 2011; Sharma 2014), or rifaximin (Sharma 2014; Higuera‐de la Tijera 2017).
Eighteen trials evaluated intravenous L‐ornithine L‐aspartate (Merz 1988b; Merz 1988c; Merz 1988d; Merz 1989a; Merz 1992a; Merz 1994b; Feher 1997; Kircheis 1997; Fleig 1999; Chen 2005; Ahmad 2008; Oruc 2010; Schmid 2010; Abid 2011; Blanco Vela 2011c; Zhou 2013; Bai 2014; Sidhu 2018); the daily dose of intravenous L‐ornithine L‐aspartate ranged from 10 g to 40 g (median 20 g), while the duration of treatment ranged from three to 35 days (median eight days). Eighteen trials evaluated oral L‐ornithine L‐aspartate (Merz 1987; Merz 1988a; Merz 1989b; Merz 1994a; Stauch 1998; Hong 2003; Poo 2006; Maldonado 2010; Nimanong 2010; Puri 2010; Mittal 2011; Ndraha 2011; Hasan 2012; Alvares‐da‐Silva 2014; Sharma 2014; Higuera‐de la Tijera 2017; Taylor‐Robinson 2017; Varakanahalli 2017); the daily dose of oral L‐ornithine L‐aspartate ranged from 9 g to 18 g (median 17 g), while the duration of treatment ranged from seven to 180 days (median 30 days).
Eighteen randomised clinical trials evaluating intravenous administration included participants with acute (six trials), chronic/minimal hepatic encephalopathy (nine trials), acute/minimal hepatic encephalopathy (one trial), or no previous hepatic encephalopathy (two trials). We were unable to obtain information on the type of hepatic encephalopathy in one trial evaluating intravenous administration (Merz 1988d). The 18 randomised clinical trials evaluating orally administered L‐ornithine L‐aspartate included participants with acute (one trial), chronic (one trial), minimal (seven trials), chronic/minimal (six trials), minimal/no previous hepatic encephalopathy (one trial), no previous hepatic encephalopathy (one trial), or no current hepatic encephalopathy (one trial).
Outcomes
The total number of participants included in our quantitative analyses was 1891. We did not have access to outcome data for quantitative analyses from seven randomised clinical trials with at least 486 participants, corresponding to at least 20.4% of the total number of registered participants (Merz 1988d; Merz 1994a; Merz 1994b; Fleig 1999; Maldonado 2010; Oruc 2010; Hasan 2012). The duration of follow‐up ranged from three days to one month in randomised clinical trials evaluating intravenous administration and from seven to 180 days in trials evaluating oral administration. The tests used to evaluate hepatic encephalopathy and to define improved manifestations varied (Characteristics of included studies table). Commonly used scales included the West‐Haven criteria (Conn 1977), and the Portal Systemic Encephalopathy Score & Index that combines an evaluation of mental status with the scored severity of asterixis, Number Connection Test‐A results, electroencephalograph mean cycle frequency, and blood ammonia concentration (Conn 1977). Number Connection Test‐A was the most commonly employed single psychometric test.
Excluded studies
We excluded 20 clinical trials (Characteristics of excluded studies table; Müting 1980; Reikowski 1982; Merz 1988e; Merz 1991; Merz 1992b; Staedt 1993; Rees 2000; Delcker 2002; Acharya 2009; Abdo‐Francis 2010; Lim 2010; Ndhara 2010; Ong 2011; Tenda 2012; McPhail 2013; Aidrus 2015; Badea 2015; Popa 2015; Tiller 2016; Grover 2017).
One of the excluded studies was an open quasi‐randomised trial, which compared an intravenous infusion of L‐ornithine L‐aspartate with placebo (saline solution) (Aidrus 2015). The investigators used hospital admission numbers in the allocation of participants to intervention (even numbers) or placebo (uneven numbers). The study included 102 participants with cirrhosis due to viral hepatitis and acute, overt (Grade II to IV) hepatic encephalopathy. None died or experienced adverse events.
One randomised clinical trial included participants with acute liver failure (Acharya 2009). The trial evaluated intravenous L‐ornithine L‐aspartate 30 g/day (102 participants) versus placebo (99 participants). The trial report included per‐protocol analyses. Of the 185 participants analysed, 31 died in the treatment group and 39 died in the placebo group. Overall, there was no beneficial or harmful effects of L‐ornithine L‐aspartate on mortality, cerebral oedema, grade of encephalopathy, degree of prolongation of the prothrombin time, serum aspartate aminotransferase activity, or blood ammonia concentrations.
Three trials were identified in an unpublished report of a meta‐analysis of intravenous L‐ornithine L‐aspartate trials conducted between 1988 and 1999 undertaken by Merz Pharmaceuticals (Delcker 2000b), or in a meta‐analysis of published and unpublished trials presented at an international meeting in 2017 by a Merz representative. One trial was not randomised or blinded (Merz 1988e), and two were not randomised or controlled (Merz 1991; Merz 1992b) (Characteristics of excluded studies table).
One randomised clinical trial, involving 32 participants with minimal hepatic encephalopathy, evaluated oral L‐ornithine L‐aspartate 3.7 g together with branched‐chain amino acids given as a supplement either during the daytime or late evening (Tenda 2012). There were no differences in clinical outcome after one month; there were no serious adverse events.
We excluded a case series involving people with cirrhosis and acute variceal bleeding given lactulose with or without L‐ornithine L‐aspartate (Badea 2015), and nine observational studies involving participants with cirrhosis and overt (Reikowski 1982; Delcker 2002; Abdo‐Francis 2010; Lim 2010; Ong 2011; Popa 2015; Tiller 2016), or minimal hepatic encephalopathy (Ndhara 2010; Grover 2017). Three additional observational studies evaluated the effect of L‐ornithine L‐aspartate on cerebral magnetic imaging and spectroscopy in people with previous minimal hepatic encephalopathy (McPhail 2013), on portal vein blood ammonia levels following a glutamine challenge (Rees 2000), or the effects of a surgically created portal systemic shunt (Müting 1980). Finally, we excluded one dose‐finding study that evaluated the dose‐dependent effects of ornithine aspartate on postprandial hyperammonaemia and plasma amino acids (Staedt 1993). None of the excluded studies reported serious adverse events.
Risk of bias in included studies
We carried out the risk of bias assessment based on the information retrieved from the publications and from investigators (Figure 2).

Risk of bias summary: review authors' judgements about each risk of bias item for each included study.
Allocation
Investigators in 15 of the included randomised clinical trials used a computer or table to generate the allocation sequence and concealed the allocation using central randomisation or administration of serially numbered opaque sealed envelopes or coded drug containers (low risk of bias; Feher 1997; Kircheis 1997; Stauch 1998; Ahmad 2008; Schmid 2010; Abid 2011; Blanco Vela 2011c; Mittal 2011; Alvares‐da‐Silva 2014; Bai 2014; Sharma 2014; Higuera‐de la Tijera 2017; Taylor‐Robinson 2017; Varakanahalli 2017; Sidhu 2018). In the remaining trials, investigators did not report how they generated the allocation sequence or concealed the allocation (unclear risk of bias; Merz 1987; Merz 1988a; Merz 1988b; Merz 1988c; Merz 1988d; Merz 1989a; Merz 1989b; Merz 1992a; Merz 1994a; Merz 1994b; Fleig 1999; Hong 2003; Chen 2005; Poo 2006; Maldonado 2010; Nimanong 2010; Oruc 2010; Puri 2010; Ndraha 2011; Hasan 2012; Zhou 2013).
Blinding
Twenty randomised clinical trials were double blind with adequate blinding of participants, personnel, and outcome assessors by use of a placebo (low risk of bias; Merz 1988b; Merz 1988c; Merz 1988d; Merz 1989a; Feher 1997; Kircheis 1997; Stauch 1998; Fleig 1999; Ahmad 2008; Maldonado 2010; Nimanong 2010; Puri 2010; Schmid 2010; Abid 2011; Hasan 2012; Alvares‐da‐Silva 2014; Higuera‐de la Tijera 2017; Taylor‐Robinson 2017; Varakanahalli 2017; Sidhu 2018). Two trials (Blanco Vela 2011c; Bai 2014) were not blinded to personnel/participants, but the outcome assessment was blinded (high risk of performance but low risk of outcome assessment bias). Fourteen trials were open without blinding (high risk of bias: Hong 2003; Chen 2005; Poo 2006; Oruc 2010; Mittal 2011; Ndraha 2011; Zhou 2013; Sharma 2014) or did not report blinding measures (unclear risk of bias: Merz 1987; Merz 1988a; Merz 1989b; Merz 1992a; Merz 1994a; Merz 1994b). Overall, we classified 20 trials as at low risk, 10 trials as at high risk and 6 trials as at unclear risk of performance and detection bias.
Incomplete outcome data
Sixteen included randomised clinical trials had no missing outcome data and all participants were included in the analyses or else if outcome data were missing, data intention‐to‐treat analyses were undertaken using last observation carried forward (low risk of bias; Feher 1997; Kircheis 1997; Stauch 1998; Hong 2003; Chen 2005; Poo 2006; Ahmad 2008; Abid 2011; Blanco Vela 2011c; Mittal 2011; Alvares‐da‐Silva 2014; Bai 2014; Sharma 2014; Higuera‐de la Tijera 2017; Taylor‐Robinson 2017; Sidhu 2018). Sixteen randomised clinical trials did not describe or reported incomplete outcome data (unclear risk of bias; Merz 1987; Merz 1988a; Merz 1988b; Merz 1988c; Merz 1988d; Merz 1989a; Merz 1989b; Merz 1992a; Merz 1994a; Merz 1994b; Maldonado 2010; Nimanong 2010; Oruc 2010; Ndraha 2011; Hasan 2012; Varakanahalli 2017). The remaining four randomised clinical trials specifically excluded participants from the analyses (high risk of bias; Fleig 1999; Puri 2010; Schmid 2010; Zhou 2013).
Selective reporting
We classed 20 trials as having a low risk of selective reporting bias because they provided data on mortality, hepatic encephalopathy, and serious adverse events or reported clinically relevant outcomes as predefined in protocols (Kircheis 1997; Stauch 1998; Hong 2003; Chen 2005; Poo 2006; Ahmad 2008; Nimanong 2010; Puri 2010; Abid 2011; Blanco Vela 2011c; Mittal 2011; Ndraha 2011; Zhou 2013; Alvares‐da‐Silva 2014; Bai 2014; Sharma 2014; Higuera‐de la Tijera 2017; Taylor‐Robinson 2017; Varakanahalli 2017; Sidhu 2018). The remaining 16 randomised clinical trials did not report or had incomplete data on mortality or hepatic encephalopathy (unclear risk of bias: Merz 1987; Merz 1988a; Merz 1988b; Merz 1988c; Merz 1988d; Merz 1989a; Merz 1989b; Merz 1992a; Merz 1994a; Merz 1994b; high risk of bias: Feher 1997; Fleig 1999; Maldonado 2010; Oruc 2010; Schmid 2010; Hasan 2012).
For‐profit funding
Six randomised clinical trials did not receive funding or any other support from pharmaceutical companies (low risk of bias; Nimanong 2010; Blanco Vela 2011c; Mittal 2011; Alvares‐da‐Silva 2014; Bai 2014; Sharma 2014). Ten randomised clinical trials did not provide information on funding from this source (unclear risk of bias; Hong 2003; Chen 2005; Maldonado 2010; Oruc 2010; Puri 2010; Schmid 2010; Ndraha 2011; Hasan 2012; Zhou 2013; Varakanahalli 2017). Seventeen randomised clinical trials received funding and other support from pharmaceutical companies (high risk of bias; Merz 1987; Merz 1988a; Merz 1988b; Merz 1988c; Merz 1988d; Merz 1989a; Merz 1989b; Merz 1992a; Merz 1994a; Merz 1994b; Feher 1997; Kircheis 1997; Stauch 1998; Fleig 1999; Ahmad 2008; Abid 2011; Taylor‐Robinson 2017); a further three trials received a supply of L‐ornithine L aspartate/ placebo but no other support (high risk of bias; Poo 2006; Higuera‐de la Tijera 2017; Sidhu 2018)
Other potential sources of bias
We classed 10 unpublished randomised clinical trials at high risk of other biases (Merz 1987; Merz 1988a; Merz 1988b; Merz 1988c; Merz 1988d; Merz 1989a; Merz 1989b; Merz 1992a; Merz 1994a; Merz 1994b), and the remaining trials at low risk of bias for this domain (Feher 1997; Kircheis 1997; Stauch 1998; Fleig 1999; Hong 2003; Chen 2005; Poo 2006; Ahmad 2008; Maldonado 2010; Nimanong 2010; Oruc 2010; Puri 2010; Schmid 2010; Abid 2011; Blanco Vela 2011c; Mittal 2011; Ndraha 2011; Hasan 2012; Zhou 2013; Alvares‐da‐Silva 2014; Bai 2014; Sharma 2014; Higuera‐de la Tijera 2017; Taylor‐Robinson 2017; Varakanahalli 2017; Sidhu 2018).
Overall bias assessment
In the assessment of mortality, we classed five randomised clinical trials at low risk of bias (Blanco Vela 2011c; Mittal 2011; Alvares‐da‐Silva 2014; Bai 2014; Sharma 2014), and the remaining trials at high risk of bias (Merz 1987; Merz 1988a; Merz 1988b; Merz 1988c; Merz 1988d; Merz 1989a; Merz 1989b; Merz 1992a; Merz 1994a; Merz 1994b; Feher 1997; Kircheis 1997; Stauch 1998; Fleig 1999; Hong 2003; Chen 2005; Poo 2006; Ahmad 2008; Maldonado 2010; Nimanong 2010; Oruc 2010; Puri 2010; Schmid 2010; Abid 2011; Ndraha 2011; Hasan 2012; Zhou 2013; Higuera‐de la Tijera 2017; Taylor‐Robinson 2017; Varakanahalli 2017; Sidhu 2018).
In the assessment of non‐mortality outcomes, we classified one randomised clinical trials at low risk of bias (Alvares‐da‐Silva 2014); the remaining randomised clinical trials were at high risk of bias (Merz 1987; Merz 1988a; Merz 1988b; Merz 1988c; Merz 1988d; Merz 1989a; Merz 1989b; Merz 1992a; Merz 1994a; Merz 1994b; Feher 1997; Kircheis 1997; Stauch 1998; Fleig 1999; Hong 2003; Chen 2005; Poo 2006; Ahmad 2008; Maldonado 2010; Nimanong 2010; Oruc 2010; Puri 2010; Schmid 2010; Abid 2011; Blanco Vela 2011c; Mittal 2011; Ndraha 2011; Hasan 2012; Zhou 2013; Bai 2014; Sharma 2014; Higuera‐de la Tijera 2017; Taylor‐Robinson 2017; Varakanahalli 2017; Sidhu 2018).
Effects of interventions
See: Summary of findings for the main comparison L‐ornithine L aspartate compared to placebo or no intervention for people with cirrhosis and hepatic encephalopathy; Summary of findings 2 L‐ornithine L‐aspartate compared to lactulose for people with cirrhosis and hepatic encephalopathy; Summary of findings 3 L‐ornithine L‐aspartate compared to probiotic for people with cirrhosis and hepatic encephalopathy; Summary of findings 4 L‐ornithine L‐aspartate compared to rifaximin for people with cirrhosis and hepatic encephalopathy
L‐ornithine L‐aspartate versus placebo or no intervention
Primary outcomes
Mortality
We identified 33 randomised clinical trials with 2026 participants allocated to L‐ornithine L‐aspartate versus placebo or no intervention. We were able to extract mortality data from 19 randomised clinical trials involving 1489 participants (Analysis 1.1). Random‐effects meta‐analysis showed that L‐ornithine L‐aspartate was associated with a lower risk of mortality when including all trials (RR 0.42, 95% CI 0.24 to 0.72; I2 = 0%), but not when the analysis was restricted to the four trials at low risk of bias (RR 0.47, 95% CI 0.06 to 3.58; 244 participants) (Analysis 1.1). Regression analysis (P = 0.28) and an inspection of the funnel plot showed no evidence of small‐study effects (Figure 3). The Trial Sequential Analysis including all trials (relative risk ratio 18% and assumed control risk 5%) ignored the monitoring boundary and found insufficient evidence to support or refute an effect of L‐ornithine L‐aspartate on mortality. Post‐hoc Trial Sequential Analyses with the RRR increased to 25% found no evidence to support or refute an effect of L‐ornithine L‐aspartate on this outcome (TSA‐adjusted RR 0.42; 95% CI 0.04 to 3.86; Figure 4).
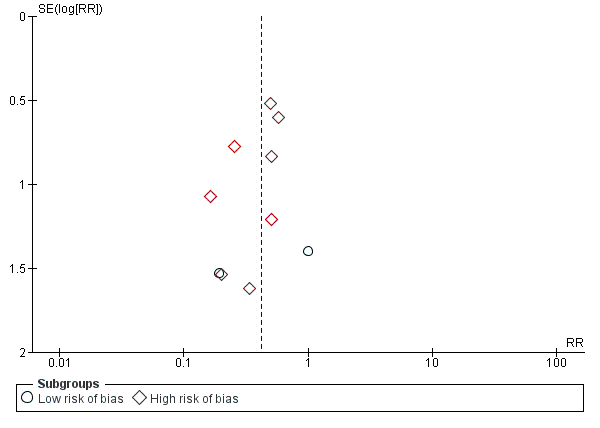
Funnel plot of comparison: 1 L‐ornithine L‐aspartate versus placebo/no intervention, outcome: 1.1 Mortality.
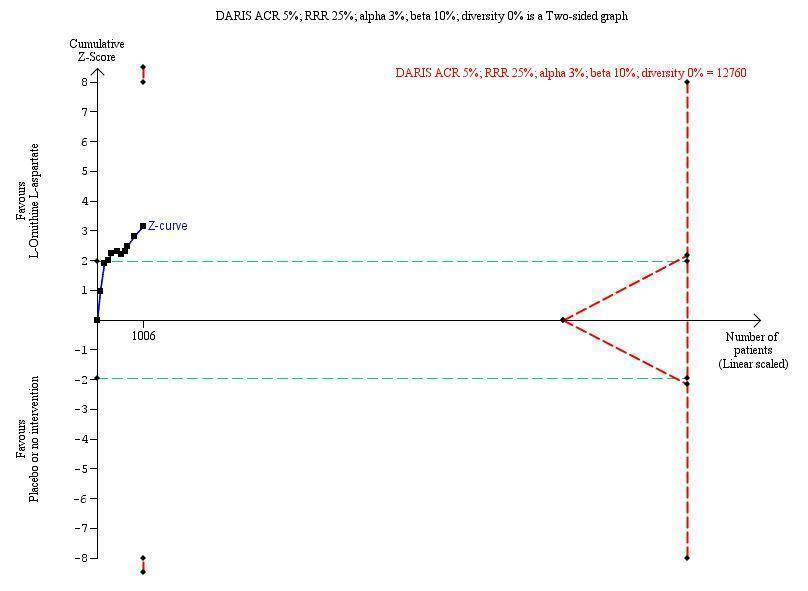
Mortality: Trial Sequential Analysis (relative risk random‐effects model) including randomised clinical trials comparing L‐ornithine L‐aspartate versus placebo or no intervention for people with cirrhosis and hepatic encephalopathy. The pair‐wise meta‐analysis included 19 trials with 1489 participants and found a risk ratio (RR) of 0.42 (95% CI 0.24 to 0.72). The figure shows the Trial Sequential Analysis made with the required information size (also known as the 'heterogeneity adjusted required information size' (DARIS)) defined as the number of participants needed to detect or reject an intervention effect based on the relative risk reduction (RRR) and assumed control risk (ACR). The analysis was made with alpha 3%, power 90%, model‐based diversity (0%), RRR 25%, and ACR 5%.
Subgroup analyses showed no difference in the effect of L‐ornithine L‐aspartate on mortality in trials evaluating acute hepatic encephalopathy, chronic hepatic encephalopathy (no events occurred), minimal hepatic encephalopathy, or the prevention of hepatic encephalopathy (Test for subgroup differences: Chi2 = 0.63, P = 0.73, I2 = 0%; Analysis 1.2). Similarly, there were no differences in the effects of L‐ornithine L‐aspartate when administered intravenously or orally (Test for subgroup differences: Chi2 = 0.433, P = 0.51, I2 = 0%; Analysis 1.3), or between trials published as full articles, or in abstract form (Pooled effect: Chi2 = 0.04, P = 0.85, I2 = 0%; Analysis 1.4).
Hepatic encephalopathy
We extracted data on hepatic encephalopathy from 22 trials involving 1375 participants (Analysis 1.5). The random‐effects meta‐analysis suggested a beneficial effect favouring L‐ornithine L‐aspartate when including all trials, but the between‐trial heterogeneity was substantial (RR 0.70, 95% CI 0.59 to 0.83; I2 = 62%); there was no beneficial effect in the one trial at low risk of bias (RR 0.96, 95% CI 0.85 to 1.07; 63 participants). Regression analysis and visual inspection of a funnel plot showed no evidence of small‐study effects (P = 0.23). The Trial Sequential Analysis (relative risk ratio 17%, assumed control risk 40%, alpha 3% and power 90%; diversity 50%) ignored trials in interim analyses and found that the Z‐curve crossed the monitoring boundary when including all trials regardless of bias control (TSA adjusted RR 0.75; 95% CI 0.35 to 1.42; Figure 5).
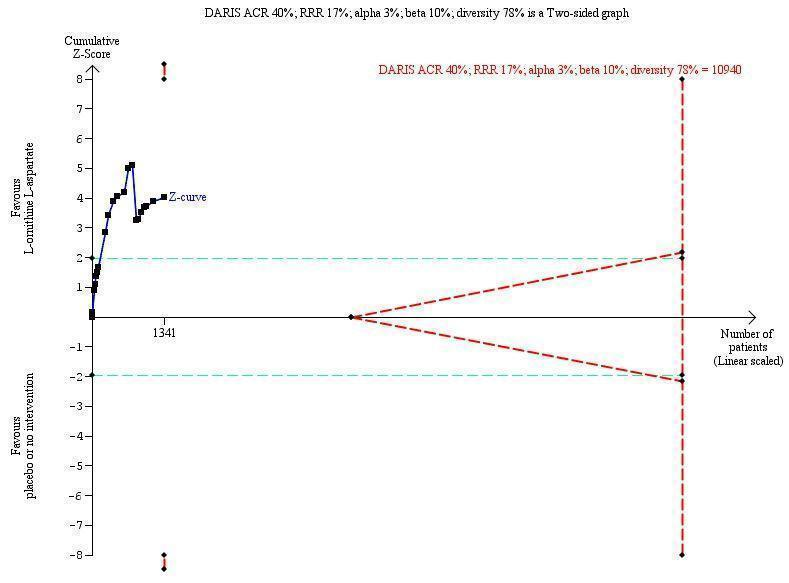
Hepatic encephalopathy: Trial Sequential Analysis of hepatic encephalopathy (relative risk random‐effects model). The analysis included randomised clinical trials comparing L‐ornithine L‐aspartate versus placebo or no intervention for people with cirrhosis and hepatic encephalopathy. The pair‐wise meta‐analysis included 1375 participants and 22 trials and found a risk ratio (RR) of 0.70 (95% CI 0.59 to 0.83). The figure shows the Trial Sequential Analysis made with the required information size (also known as the 'heterogeneity adjusted required information size' (DARIS)) defined as the number of participants needed to detect or reject an intervention effect based on the relative risk reduction (RRR) and assumed control risk (ACR). The analysis was made with alpha 3%, power 90%, model‐based diversity (78%), RRR 17%, and ACR 40%.
Subgroup analyses found no difference in the effect of L‐ornithine L‐aspartate on hepatic encephalopathy in trials evaluating acute hepatic encephalopathy, chronic hepatic encephalopathy, minimal hepatic encephalopathy, or the prevention of hepatic encephalopathy (Test for subgroup differences: Chi2 = 7.15, P = 0.07, I2 = 58%; Analysis 1.6).
There was no subgroup difference in effect on hepatic encephalopathy between trials evaluating L‐ornithine L‐aspartate given intravenously or orally (Test for subgroup differences Chi2 = 0.26, P = 0.61, I2 = 0%; Analysis 1.7). Subgroup analysis based on publication status showed a potential difference between trials published as full articles or abstracts and those that were unpublished (Test for subgroup differences: Chi2 = 6.78, P = 0.03, I2 = 70.5%; Analysis 1.8). Additional subgroup analyses found no difference between trials with complete or incomplete data (Test for subgroup differences: Chi2 = 2.19, P = 0.14, I2 = 54.4%; Analysis 1.9).
Serious adverse events
We were able to extract data on serious adverse events from 19 published randomised clinical trials with 1489 participants (Analysis 1.10). Random‐effects meta‐analysis showed that L‐ornithine L‐aspartate was associated with a lower risk of serious adverse events when including all trials (RR 0.63, 95% CI 0.45 to 0.90; 19 trials; 1489 participants; I2 = 0%); there was no beneficial effect in the one trial at low risk of bias (RR 0.83, 95% CI 0.15 to 4.65; 63 participants). Regression analysis found no small‐study effects (P = 0.989). The Trial Sequential Analysis (relative risk ratio 3% and assumed control risk 10%) ignored the monitoring boundary due to insufficient information and found no evidence to support or refute an effect of L‐ornithine L‐aspartate on serious adverse events. Post‐hoc subgroup analyses with the RRR increased to 25% found no evidence to support or refute an effect of L‐ornithine L‐aspartate (TSA adjusted RR 0.63; 95% CI 0.32 to 1.24; Figure 6). Subgroup analyses found no difference between trials evaluating acute or chronic hepatic encephalopathy, minimal hepatic encephalopathy, or the prevention of hepatic encephalopathy (Test for subgroup differences: Chi2 = 1.13, P = 0.77, I2 = 0%; Analysis 1.11). There was no difference between trials evaluating intravenous or oral administration (Test for subgroup differences: Chi2 = 0.25, P = 0.62, I2 = 0%; Analysis 1.12), or between trials published as full‐paper articles or abstracts, or those that were unpublished (Test for subgroup differences: Chi2 = 1.14, P = 0.23, I2 = 30.7%; Analysis 1.13).
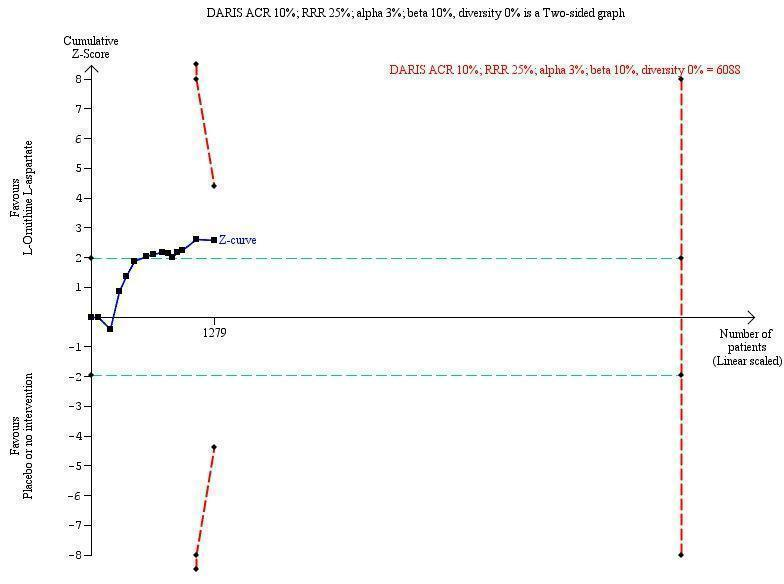
Serious adverse events: Trial Sequential Analysis (relative risk random‐effects model) including randomised clinical trials comparing L‐ornithine L‐aspartate versus placebo or no intervention for people with cirrhosis and hepatic encephalopathy. The pair‐wise meta‐analysis includes 19 trials with 1489 participants and found a RR of 0.63 (95% CI 0.45 to 0.90). The figure shows the Trial Sequential Analysis made with the required information size (also known as the 'heterogeneity adjusted required information size' (DARIS)) defined as the number of participants needed to detect or reject an intervention effect based on the relative risk reduction (RRR) and assumed control risk (ACR). The analysis is made with alpha 3%, power 90%, model‐based diversity (0%), RRR 25%, and ACR 10%.
Secondary outcomes
We were unable to conduct meta‐analyses evaluating health‐related quality of life. Three randomised clinical trials evaluated this outcome. The first evaluated quality of life in people with minimal hepatic encephalopathy using the Liver Disease Quality of Life Assessment (Alvares‐da‐Silva 2014), which includes scores for symptoms of liver disease, effects of liver disease, concentration, memory, quality of social interaction, health distress, sexual problems, sleep, loneliness, hopelessness, and stigma of liver disease. There were no differences in health‐related quality of life in participants allocated to L‐ornithine L‐aspartate at the beginning or end of the six‐month study period. The second trial evaluated quality of life in people with minimal hepatic encephalopathy using the Sickness Impact Profile questionnaire in a four‐way comparison of no treatment, L‐ornithine L‐aspartate, rifaximin, and probiotics (Mittal 2011). At the end of three months, the total Sickness Impact Profile score decreased by 1.05 in the no treatment group, by 7.33 in the L‐ornithine L‐aspartate group (P < 0.001), by 6.98 in the lactulose group (P < 0.001), and by 6.24 in the probiotics group (P < 0.001). The decrease in the Sickness Impact Profile score correlated with improvement in minimal hepatic encephalopathy, but on multivariate analysis, there was no correlation with the type of intervention offered, which were considered to be equally effective. The third trial evaluated the Sickness Impact Profile score in people recovering from an episode of acute overt hepatic encephalopathy randomised to either L‐ornithine L‐aspartate or placebo for six months for secondary prophylaxis (Varakanahalli 2017). There was a greater decrease in the scores in participants treated with L‐ornithine L‐aspartate (‐7.89) compared with participants receiving the placebo preparation (‐0.95) (P = 0.001).
In the analyses of non‐serious adverse events, we found no differences between L‐ornithine L‐aspartate and placebo or no intervention in the overall analysis (RR 1.15, 95% CI 0.75 to 1.77) or when evaluating diarrhoea (RR 1.32, 95% CI 0.07 to 24.18), flatulence (RR 1.60, 95% CI 0.49 to 5.18), headache (RR 7.67, 95% CI 0.39 to 148.82), abdominal pain (RR 0.63, 95% CI 0.23 to 1.69), fever (RR 1.72, 95% CI 0.12 to 23.62), general gastrointestinal effects (RR 0.89, 95% CI 0.55 to 1.45), pruritus (RR 0.60, 95% CI 0.30 to 1.21), or fatigue (RR 0.83, 95% CI 0.58 to 1.18) (Analysis 1.14). L‐ornithine L‐aspartate increased the risk of nausea/vomiting (RR 2.26, 95% CI 1.25 to 4.10; 10 trials; 639 participants; I2 = 0%) (Analysis 1.14).
Exploratory outcomes
L‐ornithine L‐aspartate was associated with a reduction in blood ammonia concentrations in trials reporting the difference between baseline values and values at the end of follow‐up (MD ‐12.94), 95% CI ‐20.04 to ‐5.83; 13 trials; 738 participants; I2 = 74%; Analysis 1.15). Based on the between‐trial heterogeneity (I2 = 98%), we chose to disregard the analysis of trials that only reported blood ammonia concentrations at the end of the treatment period.
L‐ornithine L‐aspartate versus other active agents
Lactulose
Meta‐analyses of four trials with 175 participants showed no difference between L‐ornithine L‐aspartate and lactulose in relation to mortality when including all trials (RR 0.68, 95% CI 0.11 to 4.17) or when the analysis was restricted to trials at low risk of bias (RR 3.00, 95% CI 0.13 to 71.51; 2 trials; 111 participants) (Analysis 2.1). Likewise, there was no difference between L‐ornithine L‐aspartate and lactulose for hepatic encephalopathy (RR 1.13, 95% CI 0.81 to 1.57; I2 = 0%) (Analysis 2.2) and serious adverse events (RR 0.69, 95% CI 0.22 to 2.11; I2 = 0%) (Analysis 2.3).
We were unable to undertake meta‐analyses of non‐serious adverse events (Analysis 2.4). Individual trials found no difference between L‐ornithine L‐aspartate and lactulose in relation to the risk of abdominal pain (RR 0.07, 95% CI 0.00 to 1.13), but lactulose increased the risk of diarrhoea (RR 0.03, 95% CI 0.00 to 0.54), bloating (RR 0.05, 95% CI 0.00 to 0.77), and flatulence (RR 0.05, 95% CI 0.00 to 0.77).
One trial evaluated quality of life based on the 36‐item Short Form (SF‐36) and EuroQoL questionnaires; there were no significant differences between L‐ornithine L‐aspartate and lactulose for the total SF‐36 score or the subscales, but a greater improvement in the EuroQoL total score in the L‐ornithine L‐aspartate group (P < 0.05) (Poo 2006).
Based on the between‐trial heterogeneity (I2 = 94%), we chose to disregard the analysis of blood ammonia concentrations (Analysis 2.5). We did not undertake regression analyses, Trial Sequential Analyses, or evaluate funnel plots due to the small number of trials included.
Probiotics
Two trials involving 143 participants assessed L‐ornithine L‐aspartate versus probiotics and found no beneficial difference in relation to the outcomes mortality (RR 1.01, 95% CI 0.11 to 9.51) (Analysis 3.1), but a possible beneficial effect of L‐ornithine L‐aspartate on hepatic encephalopathy (RR 0.71, 95% CI 0.56 to 0.90) (Analysis 3.2); there were no beneficial differences in serious adverse events (RR 1.07, 95% CI 0.23 to 4.88) (Analysis 3.3), or in changes in blood ammonia concentrations (RR ‐2.30 95% CI ‐6.08, 1.48) (Analysis 3.4). The trials did not evaluate health‐related quality of life.
Rifaximin
Two randomised clinical trials, involving 105 participants, compared L‐ornithine L‐aspartate versus rifaximin and found no difference in mortality (RR 0.33, 95% CI 0.04 to 3.03; I2 = 0%; Analysis 4.1), hepatic encephalopathy (RR 1.06, 95% CI 0.57 to 1.96; I2 = 0%) (Analysis 4.2), or serious adverse events (RR 0.32, 95% CI 0.01 to 7.42; Analysis 4.3).
One trial reported on nausea and vomiting and found no difference between the groups (RR 0.32, 95% CI 0.01 to 7.42; Analysis 4.4). The trials did not evaluate health‐related quality of life or blood ammonia concentrations.
'Summary of findings' tables
In the analyses comparing L‐ornithine L‐aspartate versus placebo/no intervention (summary of findings Table for the main comparison), we downgraded the quality of the evidence to 'very low' for mortality because the subgroup analysis of the four trials at low risk of bias found no evidence for a beneficial effect and the results were not confirmed in the Trial Sequential Analysis. We downgraded the quality of evidence for hepatic encephalopathy to 'very low' because none of the included trials had a low risk of bias; there was substantial between‐study heterogeneity and the Trial Sequential Analysis, which included all trials regardless of bias control, found no evidence to support or refute an intervention effect (summary of findings Table for the main comparison). We downgraded the quality of evidence for serious adverse events to 'very low' because only one trial had a low risk of bias and the results were not confirmed in the Trial Sequential Analysis (summary of findings Table for the main comparison).
We downgraded the evidence for the secondary outcome health‐related quality of life to 'very low' because the two trials that assessed this outcome were at high risk of bias and we were unable to combine the data in an overall analysis. We also downgraded the evidence for non‐serious adverse events to 'very low' because only one included trial had a low risk of bias; the CIs were very wide and we were only able to include data from 14 trials in our meta‐analysis (summary of findings Table for the main comparison).
There were no differences in outcomes in the analyses of the four trials comparing L‐ornithine L‐aspartate versus lactulose for any of the primary outcomes when considering all trials and the two trials at low risk of bias for the outcome mortality (summary of findings Table 2); information on non‐serious events adverse events was only available from one trial. Likewise, there were no differences in outcomes in the analyses comparing L‐ornithine L‐aspartate versus probiotics (summary of findings Table 3), or L‐ornithine L‐aspartate versus rifaximin (summary of findings Table 4).
Discusión
Resumen de los resultados principales
Esta revisión sistemática incluyó información cualitativa de 36 ensayos clínicos aleatorios, con al menos 2377 participantes y datos cuantitativos de 29 ensayos clínicos aleatorios que incluían a 1891 participantes. Los análisis primarios indicaron que la administración de L‐ornitina L‐aspartato se asoció con una reducción de la mortalidad por todas las causas, en comparación con placebo o ninguna intervención, al incluir todos los ensayos, pero no cuando el análisis estuvo limitado a los ensayos con bajo riesgo de sesgo. Además, los resultados no se confirmaron en el Análisis Secuencial de Ensayos. No se encontró una diferencia significativa en el efecto de la L‐ornitina L‐aspartato sobre la mortalidad cuando los ensayos se estratificaron por el tipo de encefalopatía hepática o la vía de la administración del fármaco. La administración de L‐ornitina L‐aspartato se asoció con un efecto beneficioso sobre la encefalopatía hepática cuando se consideraron todos los ensayos aleatorios, pero no fue así en el único ensayo con riesgo bajo de sesgo, y el Análisis Secuencial de Ensayos fue ambiguo. No se encontró una diferencia significativa en los efectos de la L‐ornitina L‐aspartato sobre la encefalopatía hepática entre los ensayos que evaluaron la encefalopatía hepática aguda y crónica, la encefalopatía hepática mínima o la prevención de la encefalopatía hepática, ni con respecto a la vía de administración. La administración de L‐ornitina L‐aspartato se asoció con una reducción del riesgo de eventos adversos graves cuando se consideraron todos los ensayos clínicos aleatorios, aunque no se observaron efectos beneficiosos en el único ensayo con riesgo bajo de sesgo ni en el Análisis Secuencial de Ensayos. No hubo efectos beneficiosos con respecto a los eventos adversos graves relacionados con la vía de administración. La calidad de la evidencia para los tres resultados primarios fue muy baja. Tres ensayos evaluaron la calidad de vida aunque no fue posible combinar los resultados en un metanálisis. No hubo un aumento del riesgo de efectos adversos no graves, excepto en las náuseas, con L‐ornitina L‐aspartato. La calidad de la evidencia para los resultados secundarios fue muy baja. La L‐ornitina L‐aspartato se asoció con una reducción significativa de las concentraciones de amoníaco en sangre en los ensayos que informaron la diferencia entre los valores iniciales y los valores al final del seguimiento. No se identificaron efectos beneficiosos de la L‐ornitina L‐aspartato cuando se comparó con lactulosa o rifaximina, aunque se observó un posible efecto beneficioso sobre la encefalopatía hepática en comparación con los probióticos; sin embargo, la calidad de la evidencia fue muy baja.
Compleción y aplicabilidad general de las pruebas
La dificultad principal al realizar esta revisión fue la alta proporción de estudios informados como resúmenes, a menudo de manera incompleta, y el número de estudios identificados que no se habían publicado y, por lo tanto, no eran de dominio público.
Se identificó un resumen que informaba sobre un ensayo clínico aleatorio multicéntrico alemán/suizo/austríaco que comparó L‐ornitina L‐aspartato oral con placebo (Fleig 1999), y que incluyó a 217 participantes con cirrosis y encefalopatía hepática mínima o evidente de grado bajo. Este ensayo no se ha publicado como un artículo completo aunque algunos datos del ensayo se incluyeron posteriormente en un artículo crítico publicado de la batería de pruebas psicométricas utilizada para evaluar el estado neurosiquiátrico en la población estudiada (Kircheis 2007). Kircheis 2007 tuvo acceso a los datos del ensayo y estaban dispuestos a publicarlos pero Merz Pharmaceuticals, que patrocinó el ensayo, no deseaba que los datos estuviesen disponibles para distribución externa.
También se identificó un resumen que informó sobre un metanálisis (Delcker 2000a), que utilizó datos de pacientes individuales, de ensayos de L‐ornitina L‐aspartato intravenosa versus placebo en pacientes con cirrosis y encefalopatía hepática aguda (evidente). Este metanálisis no se ha publicado como un artículo completo. Posteriormente se obtuvo una versión incompleta de un informe del ensayo clínico no publicado escrito por dos de los autores del resumen publicado, de fecha octubre de 2000, que había sido preparado para Merz Pharmaceuticals (Delcker 2000b). Los autores del informe tuvieron acceso a la base de datos de ensayos de Merz sobre la L‐ornitina L‐aspartato e identificaron 21 estudios piloto, estudios de factibilidad, ensayos clínicos controlados y estudios posteriores a la comercialización, realizados entre 1984 y 1999. De los mismos, se identificaron 11 que podrían ser apropiados para inclusión en un metanálisis estructurado para determinar la eficacia y la seguridad de la L‐ornitina L‐aspartato intravenosa para el tratamiento de la encefalopatía hepática en pacientes con cirrosis. Su último metanálisis incluyó cinco ensayos clínicos aleatorios doble ciego, controlados con placebo, y de diseño paralelo, con 246 pacientes con cirrosis y encefalopatía hepática Grado 0 a II (Conn 1977), tratados durante al menos siete días. Los autores concluyeron que los participantes que recibieron L‐ornitina L‐aspartato tuvieron una probabilidad 3,2 veces mayor (IC del 95%: 1,38 a 7,55) de estar libres de encefalopatía hepática al final del tratamiento que los participantes que recibieron placebo. También informaron que la L‐ornitina L‐aspartato presentó buena tolerabilidad.
Tres de los estudios incluidos en este metanálisis interno todavía no se han publicado (Merz 1988b; Merz 1988c; Merz 1989a), mientras que dos han sido publicados (Feher 1997 (MRZ 90004‐9003); Kircheis 1997 (MRZ 90004‐8908)). Seis de los 11 ensayos identificados originalmente en el informe interno de Merz se excluyeron de los análisis debido a una serie de razones. Dos de los seis no eran aleatorios ni controlados (Merz 1991; Merz 1992b), mientras que un tercio era un estudio de determinación de dosis (Staedt 1993 (MRZ 90004‐8603)); ninguno de estos estudios habrían sido elegibles para inclusión en la revisión. Sin embargo, los tres estudios restantes excluidos del metanálisis fueron elegibles y se incluyeron (Merz 1988d; Merz 1992a; Merz 1994b). No hubo más información disponible sobre los diez estudios adicionales mencionados en este informe. Las negociaciones con Merz Pharmaceuticals para la publicación de los datos adicionales del ensayo fueron infructuosas.
A principios de 2017 un representante de Merz Pharmaceuticals presentó el resultado de un metanálisis de los ensayos publicados y no publicados de L‐ornitina L‐aspartato "para el tratamiento de la encefalopatía hepática en la cirrosis" en una reunión de la International Society for the Study of Hepatic Encephalopathy and Nitrogen Metabolism (ISHEN) en Delhi, India (Butterworth 2017). Esta presentación aportó detalles de cinco ensayos controlados con placebo no publicados de la L‐ornitina L‐aspartato intravenosa, con 152 participantes, que se incluyeron en el informe interno del ensayo clínico Merz (Merz 1988b; Merz 1988c; Merz 1989a; Merz 1992a; Merz 1994b), aunque no necesariamente en el metanálisis (Delcker 2000a). Además, se proporcionó información sobre cuatro ensayos aleatorios controlados con placebo no publicados de la L‐ornitina L‐aspartato oral (Merz 1987; Merz 1988a; Merz 1989b; Merz 1994a), y un ensayo no aleatorio no publicado (Merz 1988e).
Por lo tanto, se identificaron 26 ensayos no publicados y fue posible extraer, a partir de una combinación de las fuentes mencionadas anteriormente, alguna información de 13; diez de dichos ensayos no publicados, con aproximadamente 287 participantes, se incluyeron en los análisis (Merz 1987; Merz 1988a; Merz 1988b; Merz 1988c; Merz 1988d; Merz 1989a; Merz 1989b; Merz 1992a; Merz 1994a; Merz 1994b), mientras que los tres restantes se excluyeron (Merz 1988e; Merz 1991; Merz 1992b). Es posible que se hayan excluido algunos de los ensayos no publicados actualmente considerados apropiados para inclusión si hubiese más información. Igualmente, puede haber ensayos no publicados adicionales que no se hayan identificado.
Aunque existen inquietudes en cuanto al volumen de ensayos no publicados y, hasta cierto punto, no disponibles, aun así fue posible incluir 36 ensayos clínicos aleatorios con al menos 2377 participantes en los análisis cualitativos, y 29 ensayos clínicos aleatorios con 1899 participantes en los análisis cuantitativos, y fue posible realizar metanálisis para los resultados más importantes para los pacientes con cirrosis y encefalopatía hepática, a saber la mortalidad, la morbilidad, los eventos adversos y la calidad de vida (Bajaj 2011b). Se incluyó información sobre todos estos resultados, aunque hubo información muy limitada sobre la calidad de vida.
Los ensayos evaluaron la mejoría en la encefalopatía hepática mediante diversos métodos para examinar los cambios en el estado neurosiquiátrico. Lo anterior refleja en parte el hecho de que los ensayos se realizaron entre 1988 y 2016; un período en el que los criterios diagnósticos cambiaron en más de una ocasión. Los ensayos incluidos a menudo utilizaron sistemas de calificación clínicos o compuestos y un enfoque categórico para definir la mejoría (o la falta de la misma). La clasificación diagnóstica de la encefalopatía hepática también cambió durante este período (EASL/AASLD 2014a; EASL/AASLD 2014b). Por lo tanto, se decidió a priori utilizar la clasificación de los investigadores primarios individuales del tipo de encefalopatía hepática y sus criterios de resultado debido a que es probable que los mismos hayan sido clínicamente más relevantes en ese momento. Se ha proporcionado una comparación de la definición de estado neurosiquiátrico utilizada en el material original y la terminología indicada actual (tabla 1). Los ensayos más antiguos a menudo utilizaron cointervenciones como la restricción de las proteínas alimentarias pero, aunque las cointervenciones no se utilizaron de forma sistemática en todos los ensayos, los participantes asignados al azar a los grupos experimentales o de control dentro de un ensayo determinado habrían tenido igual acceso a las mismas. Este hecho podría dar lugar a heterogeneidad pero no a diferencias sistemáticas entre los grupos.
La encefalopatía hepática varía mucho en cuanto a sus manifestaciones. Los ensayos incluidos en la revisión representan todo el espectro del síndrome encontrado en los pacientes con cirrosis. Por lo tanto, se incluyeron los ensayos que evaluaron la administración de L‐ornitina L‐aspartato en pacientes que presentaban un episodio agudo de encefalopatía hepática, los pacientes con encefalopatía hepática crónica asociada con una enfermedad hepática avanzada o espontánea, o anastomosis portales‐sistémicas creadas quirúrgicamente y los pacientes con encefalopatía hepática mínima que parecen clínicamente normales, aunque presentan anomalías psicométricas y neurofisiológicas, o ambas. Además, un número pequeño de ensayos exploró la administración de L‐ornitina L‐aspartato para la profilaxis primaria y secundaria de la encefalopatía hepática. El hecho de que los ensayos consideraran todos los objetivos de la revisión fortaleció la completitud de la evidencia. Se incluyeron todos los ensayos clínicos aleatorios con datos extraíbles en los análisis primarios. También se realizaron análisis de subgrupos, de sensibilidad y de regresión para determinar los efectos diferenciales de las intervenciones sobre las variantes clínicas.
Los pacientes con hipertensión portal no cirrótica y los pacientes con insuficiencia hepática fulminante también pueden desarrollar encefalopatía hepática aunque se encuentran con mucho menor frecuencia en la práctica clínica y no están representados en los ensayos incluidos. No hay motivos para suponer que los resultados no se pueden extrapolar a los pacientes con encefalopatía hepática asociada con la hipertensión portal no cirrótica (p.ej. bloqueo de la vena portal). Sin embargo, los resultados pueden no ser directamente aplicables a los pacientes con insuficiencia hepática fulminante.
Los episodios de la encefalopatía hepática a menudo se presentan en respuesta a un evento desencadenante como infección, hemorragia gastrointestinal, abuso de alcohol o trastornos de electrólitos. La identificación y el tratamiento de estos factores desencadenantes es fundamental para el tratamiento de los pacientes afectados (EASL/AASLD 2014a; EASL/AASLD 2014b). La posibilidad de evitar los factores desencadenantes probables como el estreñimiento, la transgresión alimentaria y determinados fármacos también puede reducir el riesgo de desarrollar encefalopatía hepática a más largo plazo. No está claro si la L‐ornitina L‐aspartato proporciona un beneficio adicional en las situaciones en las que la encefalopatía hepática es desencadenada por un evento tratable. Los ensayos clínicos aleatorios incluidos en la revisión no proporcionaron información detallada sobre los eventos desencadenantes posibles, sobre los efectos de las intervenciones diseñadas para mejorarlos ni sobre los efectos, si hubiera, del agregado de L‐ornitina L‐aspartato.
La encefalopatía hepática impone una carga significativa en los sistemas de asistencia sanitaria, y la utilización de recursos asociada con el tratamiento de los pacientes con encefalopatía hepática está en aumento (Poodad 2007). Los mayores costos no parecen reflejar la duración de la hospitalización, que ha disminuido, sino una combinación de factores directos e indirectos como los costos del tratamiento y la rehabilitación después de la hospitalización (Neff 2010). Ninguno de los ensayos clínicos aleatorios incluidos en la actual revisión evaluó los costos asociados con la hospitalización.
Calidad de la evidencia
Las razones principales para la disminución de la calidad de la evidencia en esta revisión fueron el sesgo, la imprecisión y el sesgo de publicación potencial.
Sesgo: se incluyeron ensayos clínicos aleatorios publicados como artículos completos o resúmenes y se obtuvo información adicional sobre los aspectos fundamentales del control del sesgo por parte de los autores de estos ensayos. Además, se obtuvo información sobre varios ensayos no publicados y fue posible obtener alguna información sobre los mismos. Según lo recomendado, se combinaron los dominios de sesgo individuales en una evaluación general (Gluud 2017). También se incluyó una evaluación de los dominios individuales, centrándose en los ensayos clínicos aleatorios con riesgo bajo de sesgo de selección (Higgins 2011; Savovic 2012). Se definió la mortalidad, pero no los eventos adversos graves, como un resultado que es resistente al sesgo de realización y de detección (Savovic 2012). Esta decisión se puede cuestionar debido a que no es probable que la falta de cegamiento influya en la evaluación de eventos como la hemorragia de las várices, el síndrome hepatorrenal y la insuficiencia hepática. Cualquier tipo de financiamiento con fines de lucro se incluyó como un dominio de sesgo (Gluud 2017). La decisión de incluir este dominio es debatible (Higgins 2011). El hecho de que se incluyera el suministro gratuito de las intervenciones o de placebo fue la razón principal de que sólo se identificara un escaso número de estudios con riesgo bajo de sesgo en la evaluación general. Sobre la base de la evaluación del control del sesgo combinada con la evaluación de la posibilidad de generalizar la evidencia, la heterogeneidad, la precisión de la estimación del efecto y el riesgo de sesgo de publicación, la calidad de la evidencia se consideró muy baja para la evaluación de los resultados primarios mortalidad, encefalopatía hepática y eventos adversos graves.
Imprecisión: en los metanálisis primarios que incluyeron todos los ensayos independientemente del control del sesgo, se encontraron efectos beneficiosos potenciales. Sin embargo, los Análisis Secuenciales de Ensayos indicaron que no hubo evidencia suficiente para apoyar o refutar cualquier efecto beneficioso o perjudicial de esta intervención. Este hecho indica que los resultados pueden reflejar errores aleatorios o sistemáticos.
Sesgo de publicación: se identificaron varios ensayos no publicados y ensayos publicados en forma de resumen. Desafortunadamente, de la mayoría de estos ensayos no hubo datos o sólo fue posible acceder a grupos incompletos de datos. Los análisis de estos ensayos no mostraron efectos convincentes de la L‐ornitina L‐aspartato y, por lo tanto, existe una gran sospecha de que el sesgo de publicación pueda haber afectado los resultados.
Sesgos potenciales en el proceso de revisión
La revisión se realizó según las recomendaciones actuales para el control del sesgo (Higgins 2011; Gluud 2017). Una revisión metodológica señaló la inclusión y el informe selectivos de los resultados y los análisis en las revisiones sistemáticas (Page 2014). Se intentó reducir al mínimo el sesgo de selección posible al utilizar una estrategia integral de búsqueda que detectó ensayos publicados y no publicados. Las búsquedas en las bases de datos electrónicas se combinaron con búsquedas manuales en las biografías de los estudios identificados. Además, se realizaron búsquedas en las actas de congresos y los libros de resúmenes de las reuniones relevantes de sociedades nacionales e internacionales. Se consideró poco probable la omisión de ensayos publicados. Además, desde una base inicial de dos resúmenes publicados, se identificaron 26 ensayos no publicados, aunque no se puede excluir la posibilidad de que existan más ensayos no publicados. La publicación selectiva de los ensayos clínicos aleatorios con un resultado positivo aumenta el riesgo de sesgo de informe de resultado (Dwan 2008). Los análisis de subgrupos basados en el estado de publicación no encontraron diferencias entre los ensayos publicados o los ensayos con grupos de datos completos y los ensayos no publicados o los ensayos con grupos de datos incompletos para los resultados de mortalidad y eventos adversos graves. Sin embargo, hubo una diferencia potencial con respecto al estado de publicación para el resultado de encefalopatía hepática no explicada por la completitud o no de los datos.
Cuatro de los ensayos clínicos aleatorios incluidos evaluaron la administración de L‐ornitina L‐aspartato para la prevención de la encefalopatía hepática, mientras que los 32 ensayos restantes evaluaron su uso para el tratamiento de la encefalopatía hepática. Los 36 ensayos se incluyeron en los análisis de los resultados primarios y es posible que la combinación de los ensayos de prevención y de tratamiento de esta manera pueda haber introducido sesgo. Sin embargo, los resultados de los análisis de subgrupos indicaron que los resultados de los ensayos de prevención no difirieron de forma marcada de los resultados de los análisis generales.
Acuerdos y desacuerdos con otros estudios o revisiones
Se han realizado varios metanálisis de los ensayos de L‐ornitina L‐aspartato (Delcker 2000a; Jiang 2009; Soarez 2009; Perez Hernandez 2011; Bai 2013; Butterworth 2017). El metanálisis Delcker 2000a, publicado en forma de resumen, incluyó tres estudios no publicados y dos publicados que incluían a 246 participantes (Merz 1988b; Merz 1988c; Merz 1989a; Feher 1997; Kircheis 1997); el metanálisis encontró un efecto beneficioso significativo del tratamiento sobre la resolución de la encefalopatía hepática, y el tiempo que tomó completar la Number Connection Test y las concentraciones posprandiales de amoníaco. El metanálisis de Jiang 2009 incluyó tres ensayos clínicos aleatorios publicados con 212 participantes (Kircheis 1997; Stauch 1998; Poo 2006) y este metanálisis encontró que la L‐ornitina L‐aspartato se asoció con un efecto beneficioso sobre la encefalopatía hepática evidente, pero no mínima, en comparación con placebo o lactulosa. El metanálisis de Soarez 2009 incluyó cuatro ensayos controlados con placebo con 217 participantes (Staedt 1993; Kircheis 1997; Stauch 1998; Rees 2000) y encontró que aunque la L‐ornitina L‐aspartato redujo las concentraciones de amoníaco en sangre, no tuvo efectos sobre la encefalopatía hepática per se. Un metanálisis posterior, Perez Hernandez 2011, incluyó cinco ensayos clínicos aleatorios con 422 participantes con cirrosis (Staedt 1993; Kircheis 1997; Kircheis 2002; Ahmad 2008; Abdo‐Francis 2010) y un ensayo clínico aleatorio incluyó a 201 participantes con insuficiencia hepática fulminante (Acharya 2009). Los resultados mostraron que la L‐ornitina L‐aspartato mejoró el rendimiento neurosiquiátrico y disminuyó las concentraciones de amoníaco en sangre venosa. El metanálisis de Bai 2013 evaluó ocho ensayos con 646 participantes y encontró que la L‐ornitina L‐aspartato tuvo un efecto beneficioso en los pacientes con encefalopatía hepática evidente y mínima y en las concentraciones de amoníaco en ayunas en comparación con placebo, ninguna intervención, o lactulosa (Kircheis 1997; Stauch 1998; Poo 2006; Ahmad 2008; Schmid 2010; Abid 2011; Mittal 2011; Ndraha 2011). Los metanálisis realizados en 2011 y 2013 no ajustaron el resultado cuantitativo de acuerdo a la calidad de la evidencia. Un metanálisis, Butterworth 2017, publicado en forma de resumen, incluyó 16 ensayos publicados y diez no publicados con un total de 1618 participantes (Merz 1987; Merz 1988a; Merz 1988b; Merz 1988c; Merz 1988e; Merz 1989a; Merz 1989b; Merz 1992a; Staedt 1993; Merz 1994a; Merz 1994b; Feher 1997; Kircheis 1997; Stauch 1998; Fleig 1999; Rees 2000; Chen 2005; Poo 2006; Ahmad 2008; Schmid 2010; Abid 2011; Mittal 2011; Ndraha 2011; Alvares‐da‐Silva 2014; Bai 2014; Sharma 2014); este metanálisis encontró un efecto beneficioso de la L‐ornitina L‐aspartato en las concentraciones de amoníaco en sangre y en el estado mental. Finalmente, un metanálisis (Butterworth 2018), también publicado en forma de resumen, incluyó seis ensayos clínicos aleatorios con 292 pacientes con cirrosis y encefalopatía hepática mínima (Kircheis 1997; Stauch 1998; Abid 2011; Mittal 2011; Alvares‐da‐Silva 2014; Sharma 2014); este metanálisis encontró un efecto beneficioso de la L‐ornitina L‐aspartato en las concentraciones de amoníaco en sangre y también en el rendimiento psicométrico, pero sólo cuando se administró por vía oral y no por vía intravenosa. Los dos metanálisis más recientes (Butterworth 2017; Butterworth 2018) fueron encargados por Merz Pharmaceuticals y hay problemas considerables con la adscripción del sesgo en los ensayos individuales y en los metanálisis en general.
En esta revisión, se incluyeron 36 ensayos con al menos 2377 participantes en los análisis cualitativos y 29 ensayos clínicos aleatorios con 1891 participantes en los análisis cuantitativos, lo que hace que esta revisión sistemática con metanálisis sea la más grande y más integral realizada hasta la fecha. Se incluyeron ensayos publicados y no publicados y se encontró que la L‐ornitina L‐aspartato puede tener un efecto beneficioso sobre la mortalidad, la encefalopatía hepática y los eventos adversos graves en comparación con placebo o ninguna intervención, pero que la evidencia fue de muy baja calidad; no se encontraron efectos beneficiosos de la L‐ornitina L‐aspartato en comparación con lactulosa o rifaximina, aunque se encontró un posible efecto beneficioso sobre la encefalopatía hepática en comparación con los probióticos, aunque la calidad de la evidencia fue muy baja.
Las EASL/AASLD Practice Guidelines señalan, con respecto a la L‐ornitina L‐aspartato, que: "Un ECA [ensayo clínico aleatorio] en pacientes con EH [encefalopatía hepática] persistente demostró mejorías con LOLA [L‐ornitina L‐aspartato] IV [intravenosa] en la prueba psicométrica, y en los niveles posprandiales de amoníaco venoso (Kircheis 1997). La administración de suplementos orales con LOLA no es efectiva". Recomienda que "la LOLA IV se puede utilizar como un agente alternativo o adicional para el tratamiento de los pacientes que no responden al tratamiento convencional (evidencia GRADE I, B,2)" (EASL/AASLD 2014a; EASL/AASLD 2014b). No hay una base de evidencia para estas afirmaciones.

Study flow diagram.
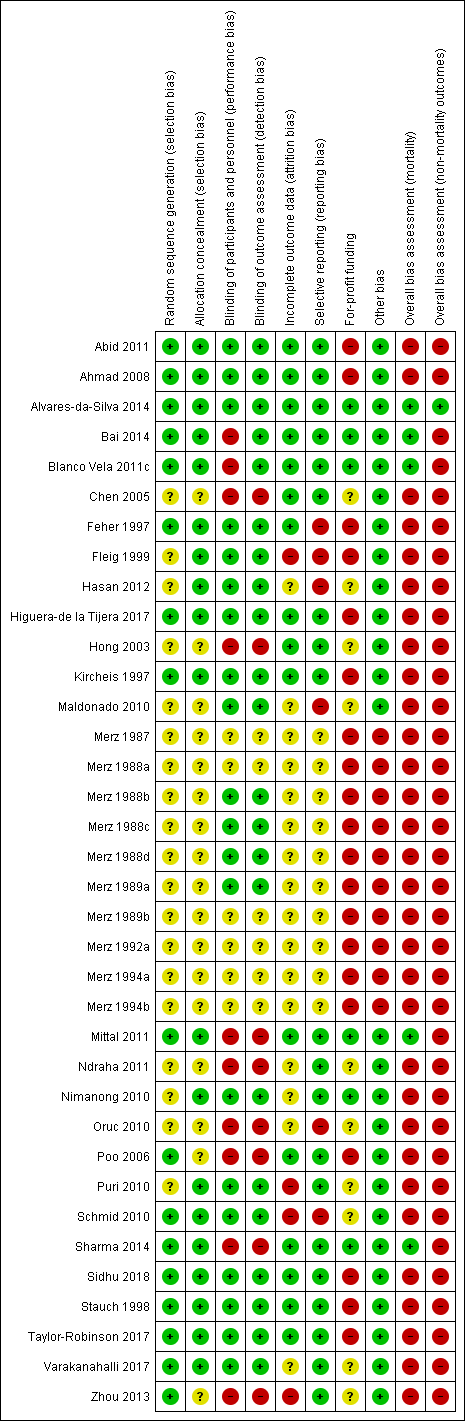
Risk of bias summary: review authors' judgements about each risk of bias item for each included study.

Funnel plot of comparison: 1 L‐ornithine L‐aspartate versus placebo/no intervention, outcome: 1.1 Mortality.

Mortality: Trial Sequential Analysis (relative risk random‐effects model) including randomised clinical trials comparing L‐ornithine L‐aspartate versus placebo or no intervention for people with cirrhosis and hepatic encephalopathy. The pair‐wise meta‐analysis included 19 trials with 1489 participants and found a risk ratio (RR) of 0.42 (95% CI 0.24 to 0.72). The figure shows the Trial Sequential Analysis made with the required information size (also known as the 'heterogeneity adjusted required information size' (DARIS)) defined as the number of participants needed to detect or reject an intervention effect based on the relative risk reduction (RRR) and assumed control risk (ACR). The analysis was made with alpha 3%, power 90%, model‐based diversity (0%), RRR 25%, and ACR 5%.

Hepatic encephalopathy: Trial Sequential Analysis of hepatic encephalopathy (relative risk random‐effects model). The analysis included randomised clinical trials comparing L‐ornithine L‐aspartate versus placebo or no intervention for people with cirrhosis and hepatic encephalopathy. The pair‐wise meta‐analysis included 1375 participants and 22 trials and found a risk ratio (RR) of 0.70 (95% CI 0.59 to 0.83). The figure shows the Trial Sequential Analysis made with the required information size (also known as the 'heterogeneity adjusted required information size' (DARIS)) defined as the number of participants needed to detect or reject an intervention effect based on the relative risk reduction (RRR) and assumed control risk (ACR). The analysis was made with alpha 3%, power 90%, model‐based diversity (78%), RRR 17%, and ACR 40%.

Serious adverse events: Trial Sequential Analysis (relative risk random‐effects model) including randomised clinical trials comparing L‐ornithine L‐aspartate versus placebo or no intervention for people with cirrhosis and hepatic encephalopathy. The pair‐wise meta‐analysis includes 19 trials with 1489 participants and found a RR of 0.63 (95% CI 0.45 to 0.90). The figure shows the Trial Sequential Analysis made with the required information size (also known as the 'heterogeneity adjusted required information size' (DARIS)) defined as the number of participants needed to detect or reject an intervention effect based on the relative risk reduction (RRR) and assumed control risk (ACR). The analysis is made with alpha 3%, power 90%, model‐based diversity (0%), RRR 25%, and ACR 10%.

Comparison 1 L‐ornithine L‐aspartate versus placebo/no intervention, Outcome 1 Mortality.

Comparison 1 L‐ornithine L‐aspartate versus placebo/no intervention, Outcome 2 Mortality, by type of hepatic encephalopathy.

Comparison 1 L‐ornithine L‐aspartate versus placebo/no intervention, Outcome 3 Mortality, by administration method.

Comparison 1 L‐ornithine L‐aspartate versus placebo/no intervention, Outcome 4 Mortality, by publication status.

Comparison 1 L‐ornithine L‐aspartate versus placebo/no intervention, Outcome 5 Hepatic encephalopathy.

Comparison 1 L‐ornithine L‐aspartate versus placebo/no intervention, Outcome 6 Hepatic encephalopathy, by type of hepatic encephalopathy.

Comparison 1 L‐ornithine L‐aspartate versus placebo/no intervention, Outcome 7 Hepatic encephalopathy, by administration method.
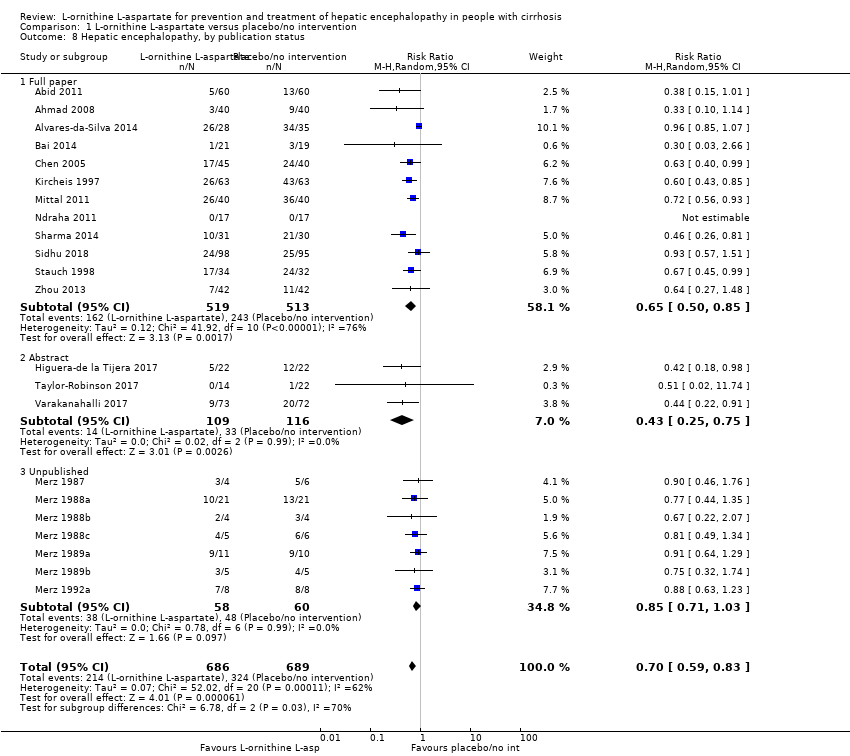
Comparison 1 L‐ornithine L‐aspartate versus placebo/no intervention, Outcome 8 Hepatic encephalopathy, by publication status.

Comparison 1 L‐ornithine L‐aspartate versus placebo/no intervention, Outcome 9 Hepatic encephalopathy, completeness status.

Comparison 1 L‐ornithine L‐aspartate versus placebo/no intervention, Outcome 10 Serious adverse events.

Comparison 1 L‐ornithine L‐aspartate versus placebo/no intervention, Outcome 11 Serious adverse events, by type of hepatic encephalopathy.

Comparison 1 L‐ornithine L‐aspartate versus placebo/no intervention, Outcome 12 Serious adverse events, by administration method.

Comparison 1 L‐ornithine L‐aspartate versus placebo/no intervention, Outcome 13 Serious adverse events, by publication status.

Comparison 1 L‐ornithine L‐aspartate versus placebo/no intervention, Outcome 14 Non‐serious adverse events.

Comparison 1 L‐ornithine L‐aspartate versus placebo/no intervention, Outcome 15 Blood ammonia concentrations.

Comparison 2 L‐ornithine L‐aspartate versus lactulose, Outcome 1 Mortality.

Comparison 2 L‐ornithine L‐aspartate versus lactulose, Outcome 2 Hepatic encephalopathy.
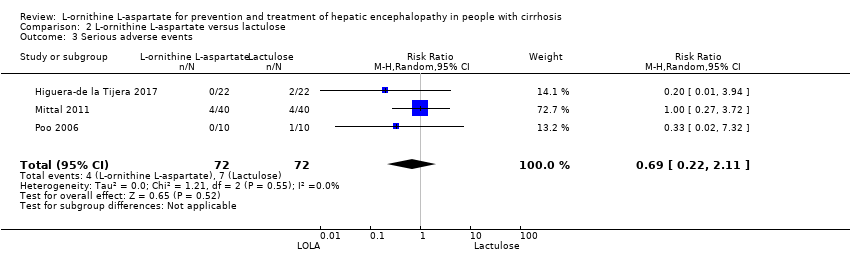
Comparison 2 L‐ornithine L‐aspartate versus lactulose, Outcome 3 Serious adverse events.

Comparison 2 L‐ornithine L‐aspartate versus lactulose, Outcome 4 Non‐serious adverse events.

Comparison 2 L‐ornithine L‐aspartate versus lactulose, Outcome 5 Blood ammonia end of treatment.

Comparison 3 L‐ornithine L‐aspartate versus probiotic, Outcome 1 Mortality.

Comparison 3 L‐ornithine L‐aspartate versus probiotic, Outcome 2 Hepatic encephalopathy.

Comparison 3 L‐ornithine L‐aspartate versus probiotic, Outcome 3 Serious adverse events.

Comparison 3 L‐ornithine L‐aspartate versus probiotic, Outcome 4 Ammonia (change from baseline).

Comparison 4 L‐ornithine L‐aspartate versus rifaximin, Outcome 1 Mortality.
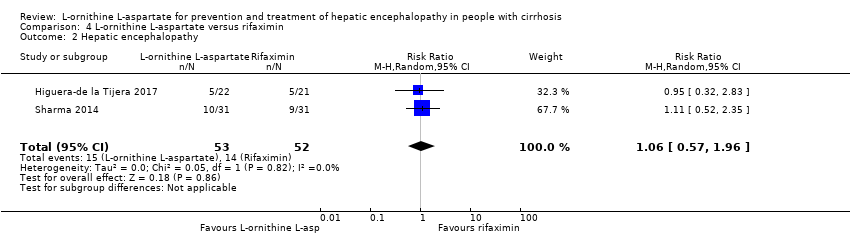
Comparison 4 L‐ornithine L‐aspartate versus rifaximin, Outcome 2 Hepatic encephalopathy.

Comparison 4 L‐ornithine L‐aspartate versus rifaximin, Outcome 3 Serious adverse events.
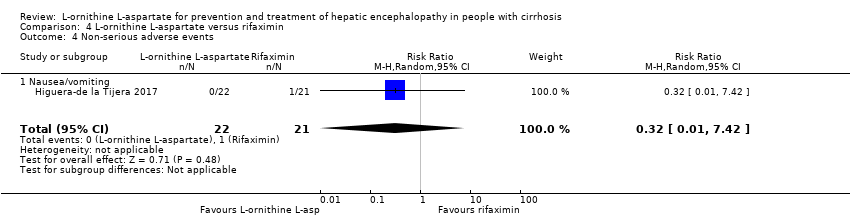
Comparison 4 L‐ornithine L‐aspartate versus rifaximin, Outcome 4 Non‐serious adverse events.
| L‐ornithine L aspartate compared to placebo or no intervention for people with cirrhosis and hepatic encephalopathy or at risk of developing hepatic encephalopathy | ||||||
| Participants: people with cirrhosis who had minimal or overt hepatic encephalopathy or who were at risk for developing hepatic encephalopathy; regardless of sex, age, aetiology, and severity of the underlying liver disease, or the presence of identified precipitating factors Setting: hospital or outpatient Intervention: L‐ornithine L‐aspartate Comparison: placebo or no intervention Outcomes: all outcomes assessed at maximum duration of follow‐up | ||||||
| Outcomes | Anticipated absolute effects* (95% CI) | Relative effect | № of participants | Quality of the evidence | Comments | |
| Risk with placebo or no intervention | Risk with L‐ornithine L aspartate | |||||
| Mortality | Study population | RR 0.42 (0.24 to 0.72) | 1489 | ⊕⊝⊝⊝ | ‐ | |
| 57 per 1000 | 24 per 1000 | |||||
| Hepatic encephalopathy assessed based on neurocognitive manifestations | Study population | RR 0.70 (0.59 to 0.83) | 1375 (22 RCTs) | ⊕⊝⊝⊝ | ‐ | |
| 470 per 1000 | 329 per 1000 | |||||
| Serious adverse events assessed using ICH‐GCP | Study population | RR 0.63 | 1489 (19 RCTs) | ⊕⊝⊝⊝ | ‐ | |
| 100 per 1000 | 63 per 1000 | |||||
| Quality of life assessed using 3 different questionnaires | 3 RCTs evaluated health‐related quality of life in participants with minimal hepatic encephalopathy. 1 found no difference between interventions based on the Liver Disease Quality of Life Assessment. 2 found a beneficial effect based on the total Sickness Impact Profile score. | (See comment) | ‐ | ⊕⊝⊝⊝ | ‐ | |
| Non‐serious adverse events assessed using ICH‐GCP | Study population | RR 1.15 | 1076 | ⊕⊝⊝⊝ | Reported non‐serious adverse events included gastrointestinal discomfort (e.g. change in bowel habits and bloating), headache, pruritus, and fatigue | |
| 128 per 1000 | 147 per 1000 | |||||
| *The risk in the intervention group (and its 95% confidence interval) is based on the assumed risk in the comparison group and the relative effect of the intervention (and its 95% CI). CHBG: Cochrane Hepato‐Biliary Group; CI: confidence interval; GCP: Good Clinical Practice; ICH: International Conference on Harmonisation; RCT: randomised clinical trial; RR: risk ratio; TSA: Trial Sequential Analysis. | ||||||
| GRADE Working Group grades of evidence | ||||||
| 1Downgraded 3 levels due risk of bias (result not confirmed in analyses of trials with a low risk of bias assessed using CHBG domains); evidence of publication bias (we were unable to gather data from unpublished trials); and imprecision (the TSA ignored the monitoring boundary). 2Downgraded 3 levels due risk of bias (result not confirmed in analyses of trials at low risk of bias assessed using CHBG domains; only 1 trial had a low risk of bias); evidence of publication bias (we were unable to gather data from unpublished trials); and inconsistency (I2 value of 63% and visual inspection of the forest plots suggested a risk of inconsistency). 3Downgraded 3 levels due risk of bias (result not confirmed in analyses of trials at low risk of bias assessed using CHBG domains; only 1 trial had a low risk of bias); evidence of publication bias (we were unable to gather data from unpublished trials); and imprecision (the TSA ignored the monitoring boundary). 4Downgraded 3 levels due to risk of bias (result not confirmed in analyses of trials at low risk of bias assessed using CHBG domains; none of the trials had a low risk of bias); evidence of publication bias (we were unable to gather data from unpublished trials); imprecision (we were only able to evaluate trials individually; trials reporting this outcome were small with wide CIs). 5Downgraded 3 levels due to risk of bias (result not confirmed in analyses of trials at low risk of bias assessed using CHBG domains; only 1 trial had a low risk of bias); evidence of publication bias (we were unable to gather data from unpublished trials); imprecision (trials reporting this outcome were small and the meta‐analysis result had wide CIs). | ||||||
| L‐ornithine L‐aspartate compared to lactulose for people with cirrhosis and hepatic encephalopathy | ||||||
| Patient or population: people with cirrhosis who had minimal or overt hepatic encephalopathy or who were at risk for developing hepatic encephalopathy; regardless of sex, age, aetiology, and severity of the underlying liver disease or the presence of identified precipitating factors Setting: hospital or outpatient Intervention: L‐ornithine L‐aspartate Comparison: lactulose Outcomes: all outcomes assessed at maximum duration of follow‐up | ||||||
| Outcomes | Anticipated absolute effects* (95% CI) | Relative effect | № of participants | Quality of the evidence | Comments | |
| Risk with lactulose | Risk with L‐ornithine L‐aspartate | |||||
| Mortality | Study population | RR 0.68 | 175 | ⊕⊝⊝⊝ | ‐ | |
| 23 per 1000 | 15 per 1000 | |||||
| Hepatic encephalopathy assessed based on neurocognitive manifestations | Study population | RR 1.13 | 175 | ⊕⊝⊝⊝ | ‐ | |
| 364 per 1000 | 411 per 1000 | |||||
| Serious adverse events assessed using ICH‐GCP | Study population | RR 0.69 | 144 | ⊕⊝⊝⊝ | ‐ | |
| 97 per 1000 | 67 per 1000 | |||||
| Quality of life assessed using questionnaires | No evidence was available for this outcome. | |||||
| Non‐serious adverse events assessed using ICH‐GCP | Study population | RR 0.05 | 292 (2 RCTs) | ⊕⊝⊝⊝ | ‐ | |
| 175 per 1000 | 12 per 1000 | |||||
| *The risk in the intervention group (and its 95% confidence interval) is based on the assumed risk in the comparison group and the relative effect of the intervention (and its 95% CI). CHBG: Cochrane Hepato‐Biliary Group; CI: confidence interval; GCP: Good Clinical Practice; ICH: International Conference on Harmonisation; RCT: randomised clinical trial; RR: risk ratio; TSA: Trial Sequential Analysis. | ||||||
| GRADE Working Group grades of evidence | ||||||
| 1Downgraded 3 levels due risk of bias (2 trials had a low risk of bias assessed using CHBG domains) and imprecision (wide CIs; small number of events/participants). We were unable to identify publication bias due to the small number of trials. 2Downgraded 3 levels due risk of bias (none of the included trials had a low risk of bias assessed using CHBG domains) and imprecision (wide CIs; small number of events/participants). We were unable to identify publication bias due to the small number of trials. | ||||||
| L‐ornithine L‐aspartate compared to probiotic for people with cirrhosis and hepatic encephalopathy | ||||||
| Patient or population: people with cirrhosis who had minimal or overt hepatic encephalopathy or who were at risk for developing hepatic encephalopathy; regardless of sex, age, aetiology, and severity of the underlying liver disease, or the presence of identified precipitating factors Setting: hospital or outpatient Intervention: L‐ornithine L‐aspartate Comparison: probiotic | ||||||
| Outcomes | Anticipated absolute effects* (95% CI) | Relative effect | № of participants | Quality of the evidence | Comments | |
| Risk with probiotic | Risk with L‐ornithine L‐aspartate | |||||
| Mortality | Study population | RR 1.01 (0.11 to 9.51) | 143 (2 RCTs) | ⊕⊝⊝⊝ | ‐ | |
| 14 per 1000 | 14 per 1000 | |||||
| Hepatic encephalopathy assessed based on neurocognitive manifestations | Study population | RR 0.71 (0.56 to 0.90) | 143 (2 RCTs) | ⊕⊝⊝⊝ | ‐ | |
| 722 per 1000 | 513 per 1000 | |||||
| Serious adverse events assessed using ICH‐GCP | Study population | RR 1.07 (0.23 to 4.88) | 143 (2 RCTs) | ⊕⊝⊝⊝ | ‐ | |
| 42 per 1000 | 45 per 1000 | |||||
| Quality of life assessed using questionnaires | No evidence available for this outcome. | |||||
| Non‐serious adverse events assessed using ICH‐GCP | No evidence available for this outcome. | |||||
| *The risk in the intervention group (and its 95% confidence interval) is based on the assumed risk in the comparison group and the relative effect of the intervention (and its 95% CI). CHBG: Cochrane Hepato‐Biliary Group; CI: confidence interval; GCP: Good Clinical Practice; ICH: International Conference on Harmonisation; RCT: randomised clinical trial; RR: risk ratio; TSA: Trial Sequential Analysis. | ||||||
| GRADE Working Group grades of evidence | ||||||
| 1Downgraded 3 levels due risk of bias (the analysis only includes 1 trial with a high risk of bias assessed using CHBG domains) and imprecision (wide CIs). We were unable to identify publication bias and did not evaluate heterogeneity because the analysis only includes 1 trial. | ||||||
| L‐ornithine L‐aspartate compared to rifaximin for people with cirrhosis and hepatic encephalopathy | ||||||
| Patient or population: people with cirrhosis who had minimal or overt hepatic encephalopathy or who were at risk for developing hepatic encephalopathy; regardless of sex, age, aetiology, and severity of the underlying liver disease, or the presence of identified precipitating factors Setting: hospital or outpatient Intervention: L‐ornithine L‐aspartate Comparison: rifaximin Outcomes: all outcomes assessed at maximum duration of follow‐up | ||||||
| Outcomes | Anticipated absolute effects* (95% CI) | Relative effect | № of participants | Quality of the evidence | Comments | |
| Risk with rifaximin | Risk with L‐ornithine L‐aspartate | |||||
| Mortality | Study population | RR 0.33 | 105 | ⊕⊝⊝⊝ | ‐ | |
| 38 per 1000 | 13 per 1000 | |||||
| Hepatic encephalopathy assessed based on neurocognitive manifestations | Study population | RR 1.06 | 105 | ⊕⊝⊝⊝ | ‐ | |
| 269 per 1000 | 285 per 1000 | |||||
| Serious adverse events assessed using ICH‐GCP | Study population | RR 0.32 | 43 | ⊕⊝⊝⊝ | ‐ | |
| 48 per 1000 | 15 per 1000 | |||||
| Quality of life assessed using questionnaires | No evidence was available for this outcome. | |||||
| Non‐serious adverse events assessed using ICH‐GCP | Study population | RR 0.32 | 43 | ⊕⊝⊝⊝ | ‐ | |
| 48 per 1000 | 15 per 1000 | |||||
| *The risk in the intervention group (and its 95% confidence interval) is based on the assumed risk in the comparison group and the relative effect of the intervention (and its 95% CI). CHBG: Cochrane Hepato‐Biliary Group; CI: confidence interval; GCP: Good Clinical Practice; ICH: International Conference on Harmonisation; RCT: randomised clinical trial; RR: risk ratio; TSA: Trial Sequential Analysis. | ||||||
| GRADE Working Group grades of evidence | ||||||
| 1Downgraded 3 levels due risk of bias (1 of the included trials had a low risk of bias assessed using CHBG domains) and imprecision (wide CIs; small number of events/participants). We were unable to identify publication bias due to the small number of trials. 2Downgraded 3 levels due risk of bias (the included trial had a high risk of bias assessed using CHBG domains) and imprecision (wide CIs; small number of events/participants). We were unable to identify publication bias due to the small number of trials. | ||||||
| Study and date | Definition of hepatic encephalopathy | Assessment of neuropsychiatric status | |
| Study material (publication) | EASL/AASLD guideline | ||
| Minimal | Minimal |
| |
| Acute: Grade I to IV | Episodic | ||
| Acute: Grade I to III | Episodic |
| |
| Minimal | Minimal |
| |
| Unimpaired | Unimpaired |
| |
| Acute: Grade III or IV | Overt |
| |
| Acute: Grade I to IV | Episodic |
| |
| Feher 19971,2 | Unimpaired | Unimpaired |
|
| Minimal | Minimal |
| |
| Chronic Grade I or II | Persistent | ||
| Minimal | Minimal |
| |
| Chronic: Grade I or II | Persistent | ||
| Unimpaired | Unimpaired |
| |
| Minimal | Minimal |
| |
| Minimal | Minimal |
| |
| Chronic: Grade I or II | Persistent | ||
| Minimal | Minimal |
| |
| Minimal | Minimal |
| |
| Overt | Unclear | ||
| Minimal | Minimal |
| |
| Overt | Unclear | ||
| Minimal | Minimal |
| |
| Acute | Episodic | ||
| Minimal | Minimal |
| |
| Overt | Unclear | ||
| Unknown | Unknown |
| |
| Minimal | Minimal |
| |
| Overt | Unclear | ||
| Minimal | Minimal |
| |
| Overt | Unclear | ||
| Minimal | Minimal |
| |
| Overt | Unclear | ||
| Minimal | Minimal |
| |
| Overt | Unclear | ||
| Minimal | Minimal |
| |
| Overt | Unclear | ||
| Minimal | Minimal |
| |
| Minimal | Minimal |
| |
| Acute: Grade II or III | Episodic |
| |
| Acute | Episodic |
| |
| Chronic persistent: Grade I or II | Persistent |
| |
| Minimal | Minimal |
| |
| Minimal Chronic: Grade I or II | Minimal |
| |
| Chronic: Grade I or II | Persistent | ||
| Minimal | Minimal |
| |
| Acute: Grade II to IV | Episodic |
| |
| Minimal | Minimal |
| |
| Chronic: Grade I or II | Persistent | ||
| Unimpaired | Unimpaired |
| |
| Minimal | Minimal | ||
| Unimpaired | Unimpaired |
| |
| Acute | Episodic |
| |
| AASLD: American Association for the Study of Liver Diseases; EASL: European Association for the Study of the Liver. 1Trials of L‐ornithine L‐aspartate used for primary prevention. 2Not included in the analysis of hepatic encephalopathy versus placebo or non‐intervention. 3Portal‐systemic encephalopathy (PSE) sum and index (Conn 1977), which is calculated using 5 variables: mental status, presence and severity of asterixis; Number Connection Test‐A time, blood ammonia concentration, and the electroencephalogram mean dominant frequency. Each variable is assigned a score of 0 (no abnormality) to 4 (severe abnormality); mental status is weighted by a factor of three; PSE index calculated as the ratio of the points scored and the maximum possible score of 28. 4Trial of L‐ornithine L‐aspartate used for secondary prevention. | |||
| Outcome or subgroup title | No. of studies | No. of participants | Statistical method | Effect size |
| 1 Mortality Show forest plot | 19 | 1489 | Risk Ratio (M‐H, Random, 95% CI) | 0.42 [0.24, 0.72] |
| 1.1 Low risk of bias | 4 | 244 | Risk Ratio (M‐H, Random, 95% CI) | 0.47 [0.06, 3.58] |
| 1.2 High risk of bias | 15 | 1245 | Risk Ratio (M‐H, Random, 95% CI) | 0.41 [0.23, 0.72] |
| 2 Mortality, by type of hepatic encephalopathy Show forest plot | 19 | 1489 | Risk Ratio (M‐H, Random, 95% CI) | 0.59 [0.39, 0.88] |
| 2.1 Acute | 6 | 597 | Risk Ratio (M‐H, Random, 95% CI) | 0.64 [0.40, 1.01] |
| 2.2 Chronic | 2 | 116 | Risk Ratio (M‐H, Random, 95% CI) | 0.0 [0.0, 0.0] |
| 2.3 Minimal | 9 | 438 | Risk Ratio (M‐H, Random, 95% CI) | 0.36 [0.07, 1.94] |
| 2.4 Prevention | 5 | 338 | Risk Ratio (M‐H, Random, 95% CI) | 0.48 [0.18, 1.26] |
| 3 Mortality, by administration method Show forest plot | 19 | 1489 | Risk Ratio (M‐H, Random, 95% CI) | 0.59 [0.39, 0.88] |
| 3.1 Intravenous infusion | 8 | 808 | Risk Ratio (M‐H, Random, 95% CI) | 0.63 [0.40, 0.99] |
| 3.2 Oral | 11 | 681 | Risk Ratio (M‐H, Random, 95% CI) | 0.45 [0.19, 1.09] |
| 4 Mortality, by publication status Show forest plot | 19 | 1489 | Risk Ratio (M‐H, Random, 95% CI) | 0.42 [0.24, 0.72] |
| 4.1 Full paper | 14 | 1151 | Risk Ratio (M‐H, Random, 95% CI) | 0.40 [0.21, 0.78] |
| 4.2 Abstract | 5 | 338 | Risk Ratio (M‐H, Random, 95% CI) | 0.45 [0.17, 1.18] |
| 5 Hepatic encephalopathy Show forest plot | 22 | 1375 | Risk Ratio (M‐H, Random, 95% CI) | 0.70 [0.59, 0.83] |
| 5.1 Low risk of bias | 1 | 63 | Risk Ratio (M‐H, Random, 95% CI) | 0.96 [0.85, 1.07] |
| 5.2 High risk of bias | 21 | 1312 | Risk Ratio (M‐H, Random, 95% CI) | 0.71 [0.63, 0.79] |
| 6 Hepatic encephalopathy, by type of hepatic encephalopathy Show forest plot | 15 | 1255 | Risk Ratio (M‐H, Random, 95% CI) | 0.63 [0.50, 0.81] |
| 6.1 Acute | 5 | 550 | Risk Ratio (M‐H, Random, 95% CI) | 0.69 [0.51, 0.91] |
| 6.2 Chronic | 2 | 116 | Risk Ratio (M‐H, Random, 95% CI) | 0.44 [0.28, 0.71] |
| 6.3 Minimal | 7 | 299 | Risk Ratio (M‐H, Random, 95% CI) | 0.78 [0.60, 1.02] |
| 6.4 Prevention | 5 | 290 | Risk Ratio (M‐H, Random, 95% CI) | 0.42 [0.25, 0.72] |
| 7 Hepatic encephalopathy, by administration method Show forest plot | 22 | 1375 | Risk Ratio (M‐H, Random, 95% CI) | 0.70 [0.59, 0.83] |
| 7.1 Intravenous infusion | 11 | 784 | Risk Ratio (M‐H, Random, 95% CI) | 0.74 [0.62, 0.88] |
| 7.2 Oral | 11 | 591 | Risk Ratio (M‐H, Random, 95% CI) | 0.68 [0.50, 0.91] |
| 8 Hepatic encephalopathy, by publication status Show forest plot | 22 | 1375 | Risk Ratio (M‐H, Random, 95% CI) | 0.70 [0.59, 0.83] |
| 8.1 Full paper | 12 | 1032 | Risk Ratio (M‐H, Random, 95% CI) | 0.65 [0.50, 0.85] |
| 8.2 Abstract | 3 | 225 | Risk Ratio (M‐H, Random, 95% CI) | 0.43 [0.25, 0.75] |
| 8.3 Unpublished | 7 | 118 | Risk Ratio (M‐H, Random, 95% CI) | 0.85 [0.71, 1.03] |
| 9 Hepatic encephalopathy, completeness status Show forest plot | 22 | 1375 | Risk Ratio (M‐H, Random, 95% CI) | 0.70 [0.59, 0.83] |
| 9.1 Complete data | 12 | 994 | Risk Ratio (M‐H, Random, 95% CI) | 0.63 [0.48, 0.83] |
| 9.2 Incomplete data | 10 | 381 | Risk Ratio (M‐H, Random, 95% CI) | 0.81 [0.68, 0.97] |
| 10 Serious adverse events Show forest plot | 19 | 1489 | Risk Ratio (M‐H, Random, 95% CI) | 0.63 [0.45, 0.90] |
| 10.1 Low risk of bias | 1 | 63 | Risk Ratio (M‐H, Random, 95% CI) | 0.83 [0.15, 4.65] |
| 10.2 High risk of bias | 18 | 1426 | Risk Ratio (M‐H, Random, 95% CI) | 0.63 [0.44, 0.89] |
| 11 Serious adverse events, by type of hepatic encephalopathy Show forest plot | 17 | 1283 | Risk Ratio (M‐H, Random, 95% CI) | 0.67 [0.46, 0.97] |
| 11.1 Acute overt | 6 | 597 | Risk Ratio (M‐H, Random, 95% CI) | 0.65 [0.43, 1.00] |
| 11.2 Chronic | 2 | 192 | Risk Ratio (M‐H, Random, 95% CI) | 2.0 [0.19, 21.50] |
| 11.3 Minimal | 5 | 296 | Risk Ratio (M‐H, Random, 95% CI) | 0.57 [0.24, 1.38] |
| 11.4 Prevention | 4 | 198 | Risk Ratio (M‐H, Random, 95% CI) | 0.97 [0.17, 5.47] |
| 12 Serious adverse events, by administration method Show forest plot | 17 | 1283 | Risk Ratio (M‐H, Random, 95% CI) | 0.67 [0.46, 0.97] |
| 12.1 Intravenous infusion | 8 | 808 | Risk Ratio (M‐H, Random, 95% CI) | 0.70 [0.46, 1.05] |
| 12.2 Oral | 9 | 475 | Risk Ratio (M‐H, Random, 95% CI) | 0.55 [0.23, 1.29] |
| 13 Serious adverse events, by publication status Show forest plot | 17 | 1283 | Risk Ratio (M‐H, Random, 95% CI) | 0.67 [0.46, 0.97] |
| 13.1 Full paper | 13 | 1090 | Risk Ratio (M‐H, Random, 95% CI) | 0.70 [0.48, 1.02] |
| 13.2 Abstract | 4 | 193 | Risk Ratio (M‐H, Random, 95% CI) | 0.23 [0.04, 1.34] |
| 14 Non‐serious adverse events Show forest plot | 20 | 3158 | Risk Ratio (M‐H, Random, 95% CI) | 1.17 [0.91, 1.51] |
| 14.1 Overall | 14 | 1076 | Risk Ratio (M‐H, Random, 95% CI) | 1.15 [0.75, 1.77] |
| 14.2 Diarrhoea | 4 | 379 | Risk Ratio (M‐H, Random, 95% CI) | 1.32 [0.07, 24.18] |
| 14.3 Flatulence | 2 | 229 | Risk Ratio (M‐H, Random, 95% CI) | 1.60 [0.49, 5.18] |
| 14.4 Nausea/vomiting | 10 | 639 | Risk Ratio (M‐H, Random, 95% CI) | 2.26 [1.25, 4.10] |
| 14.5 Headaches | 1 | 36 | Risk Ratio (M‐H, Random, 95% CI) | 7.67 [0.39, 148.82] |
| 14.6 Abdominal pain | 3 | 318 | Risk Ratio (M‐H, Random, 95% CI) | 0.63 [0.23, 1.69] |
| 14.7 Fever | 2 | 233 | Risk Ratio (M‐H, Random, 95% CI) | 1.72 [0.12, 23.62] |
| 14.8 Gastrointestinal | 1 | 80 | Risk Ratio (M‐H, Random, 95% CI) | 0.89 [0.55, 1.45] |
| 14.9 Pruritus | 1 | 80 | Risk Ratio (M‐H, Random, 95% CI) | 0.6 [0.30, 1.21] |
| 14.10 Fatigue | 2 | 88 | Risk Ratio (M‐H, Random, 95% CI) | 0.83 [0.58, 1.18] |
| 15 Blood ammonia concentrations Show forest plot | 21 | Mean Difference (IV, Random, 95% CI) | Subtotals only | |
| 15.1 End of treatment | 13 | 868 | Mean Difference (IV, Random, 95% CI) | ‐18.52 [‐33.63, ‐3.41] |
| 15.2 Change from baseline | 13 | 738 | Mean Difference (IV, Random, 95% CI) | ‐12.94 [‐20.04, ‐5.83] |
| Outcome or subgroup title | No. of studies | No. of participants | Statistical method | Effect size |
| 1 Mortality Show forest plot | 4 | 175 | Risk Ratio (M‐H, Random, 95% CI) | 0.68 [0.11, 4.17] |
| 1.1 Low risk of bias | 2 | 111 | Risk Ratio (M‐H, Random, 95% CI) | 3.0 [0.13, 71.51] |
| 1.2 High risk of bias | 2 | 64 | Risk Ratio (M‐H, Random, 95% CI) | 0.33 [0.04, 3.02] |
| 2 Hepatic encephalopathy Show forest plot | 4 | 175 | Risk Ratio (M‐H, Random, 95% CI) | 1.13 [0.81, 1.57] |
| 3 Serious adverse events Show forest plot | 3 | 144 | Risk Ratio (M‐H, Random, 95% CI) | 0.69 [0.22, 2.11] |
| 4 Non‐serious adverse events Show forest plot | 2 | 292 | Risk Ratio (M‐H, Random, 95% CI) | 0.05 [0.01, 0.18] |
| 4.1 Overall | 1 | 80 | Risk Ratio (M‐H, Random, 95% CI) | 0.07 [0.00, 1.13] |
| 4.2 Diarrhoea | 1 | 44 | Risk Ratio (M‐H, Random, 95% CI) | 0.03 [0.00, 0.54] |
| 4.3 Bloating | 1 | 44 | Risk Ratio (M‐H, Random, 95% CI) | 0.05 [0.00, 0.77] |
| 4.4 Flatulence | 1 | 44 | Risk Ratio (M‐H, Random, 95% CI) | 0.05 [0.00, 0.77] |
| 4.5 Abdominal pain/discomfort | 1 | 80 | Risk Ratio (M‐H, Random, 95% CI) | 0.07 [0.00, 1.13] |
| 5 Blood ammonia end of treatment Show forest plot | 3 | Mean Difference (IV, Fixed, 95% CI) | Subtotals only | |
| 5.1 End of treatment | 2 | 51 | Mean Difference (IV, Fixed, 95% CI) | ‐3.26 [‐10.60, 4.09] |
| 5.2 Change from baseline | 1 | 80 | Mean Difference (IV, Fixed, 95% CI) | ‐1.14 [‐4.54, 2.26] |
| Outcome or subgroup title | No. of studies | No. of participants | Statistical method | Effect size |
| 1 Mortality Show forest plot | 2 | 143 | Risk Ratio (M‐H, Random, 95% CI) | 1.01 [0.11, 9.51] |
| 2 Hepatic encephalopathy Show forest plot | 2 | 143 | Risk Ratio (M‐H, Random, 95% CI) | 0.71 [0.56, 0.90] |
| 3 Serious adverse events Show forest plot | 2 | 143 | Risk Ratio (M‐H, Random, 95% CI) | 1.07 [0.23, 4.88] |
| 4 Ammonia (change from baseline) Show forest plot | 1 | Mean Difference (IV, Random, 95% CI) | Subtotals only | |
| Outcome or subgroup title | No. of studies | No. of participants | Statistical method | Effect size |
| 1 Mortality Show forest plot | 2 | 105 | Risk Ratio (M‐H, Random, 95% CI) | 0.33 [0.04, 3.03] |
| 2 Hepatic encephalopathy Show forest plot | 2 | 105 | Risk Ratio (M‐H, Random, 95% CI) | 1.06 [0.57, 1.96] |
| 3 Serious adverse events Show forest plot | 1 | 43 | Risk Ratio (M‐H, Random, 95% CI) | 0.32 [0.01, 7.42] |
| 4 Non‐serious adverse events Show forest plot | 1 | 43 | Risk Ratio (M‐H, Random, 95% CI) | 0.32 [0.01, 7.42] |
| 4.1 Nausea/vomiting | 1 | 43 | Risk Ratio (M‐H, Random, 95% CI) | 0.32 [0.01, 7.42] |