L‐орнитин‐L‐аспартат для профилактики и лечения печеночной энцефалопатии у людей с циррозом печени
Abstract
Background
Hepatic encephalopathy is a common complication of cirrhosis and has high associated morbidity and mortality. The condition is classified as overt if it is clinically apparent or minimal if only evident though psychometric testing. The exact pathogenesis of this syndrome is unknown although ammonia is thought to play a key role. L‐ornithine L‐aspartate has ammonia‐lowering properties and may, therefore, benefit people with cirrhosis and hepatic encephalopathy.
Objectives
To evaluate the beneficial and harmful effects of L‐ornithine L‐aspartate versus placebo, no intervention, or other active interventions in people with cirrhosis and hepatic encephalopathy.
Search methods
We undertook electronic searches of The Cochrane Hepato‐Biliary Group Controlled Trials Register, CENTRAL, MEDLINE, Embase, LILACS and Science Citation Index Expanded to December 2017 and manual searches of meetings and conference proceedings; checks of bibliographies; and corresponded with investigators and pharmaceutical companies.
Selection criteria
We included randomised clinical trials, irrespective of publication status, language, or blinding. We included participants with cirrhosis who had minimal or overt hepatic encephalopathy or who were at risk for developing hepatic encephalopathy. We compared: L‐ornithine L‐aspartate versus placebo or no intervention; and L‐ornithine L‐aspartate versus other active agents such as non‐absorbable disaccharides, antibiotics, probiotics, or branched‐chain amino acids.
Data collection and analysis
Two review authors, working independently, retrieved data from published reports and correspondence with investigators and pharmaceutical companies. The primary outcomes were mortality, hepatic encephalopathy, and serious adverse events. We undertook meta‐analyses and presented the results as risk ratios (RR) and mean differences (MD) with 95% confidence intervals (CI). We assessed bias control using the Cochrane Hepato‐Biliary Group domains; we evaluated the risk of publication bias and other small trial effects in regression analyses; conducted subgroup and sensitivity analyses; and performed Trial Sequential Analyses. We determined the quality of the evidence using GRADE.
Main results
We identified 36 randomised clinical trials, involving at least 2377 registered participants, which fulfilled our inclusion criteria including 10 unpublished randomised clinical trials. However, we were only able to access outcome data from 29 trials involving 1891 participants. Five of the included trials assessed prevention, while 31 trials assessed treatment. Five trials were at low risk of bias in the overall assessment of mortality; one trial was at low risk of bias in the assessment of the remaining outcomes.
L‐ornithine L‐aspartate had a beneficial effect on mortality compared with placebo or no intervention when including all trials (RR 0.42, 95% CI 0.24 to 0.72; I2 = 0%; 19 trials; 1489 participants; very low quality evidence), but not when the analysis was restricted to the trials at low risk of bias (RR 0.47, 95% CI 0.06 to 3.58; 4 trials; 244 participants). It had a beneficial effect on hepatic encephalopathy compared with placebo or no intervention when including all trials (RR 0.70, 95% CI 0.59 to 0.83; 22 trials; 1375 participants; I2 = 62%; very low quality evidence), but not in the one trial at low risk of bias (RR 0.96, 95% CI 0.85 to 1.07; 63 participants). The analysis of serious adverse events showed a potential benefit of L‐ornithine L‐aspartate when including all randomised clinical trials (RR 0.63, 95% CI 0.45 to 0.90; 1 trial; 1489 participants; I2 = 0%; very low quality evidence), but not in the one trial at low risk of bias for this outcome (RR 0.83, 95% CI 0.15 to 4.65; 63 participants). The Trial Sequential Analyses of mortality, hepatic encephalopathy, and serious adverse events found insufficient evidence to support or refute beneficial effects. Subgroup analyses showed no difference in outcomes in the trials evaluating evaluating the prevention or treatment of either overt or minimal hepatic encephalopathy or trials evaluating oral versus intravenous administration We were unable to undertake a meta‐analysis of the three trials involving 288 participants evaluating health‐related quality of life. Overall, we found no difference between L‐ornithine L‐aspartate and placebo or no intervention in non‐serious adverse events (RR 1.15, 95% CI 0.75 to 1.77; 14 trials; 1076 participants; I2 = 40%). In comparison with lactulose, L‐ornithine L‐aspartate had no effect on mortality (RR 0.68, 95% CI 0.11 to 4.17; 4 trials; 175 participants; I2 = 0%); hepatic encephalopathy (RR 1.13, 95% CI 0.81 to 1.57); serious adverse events (RR 0.69, 95% CI 0.22 to 2.11); or non‐serious adverse events (RR 0.05, 95% CI 0.01 to 0.18). In comparison with probiotics, L‐ornithine L‐aspartate had no effect on mortality (RR 1.01, 95% CI 0.11 to 9.51); serious adverse events (RR 1.07, 95% CI 0.23 to 4.88); or changes in blood ammonia concentrations from baseline (RR ‐2.30 95% CI ‐6.08 to 1.48), but it had a possible beneficial effect on hepatic encephalopathy (RR 0.71, 95% CI 0.56 to 0.90). Finally, in comparison with rifaximin, L‐ornithine L‐aspartate had no effect on mortality (RR 0.33, 95% CI 0.04 to 3.03; 2 trials; 105 participants); hepatic encephalopathy (RR 1.06, 95% CI 0.57 to 1.96); serious adverse events (RR 0.32, 95% CI 0.01 to 7.42), or non‐serious adverse events (RR 0.32, 95% CI 0.01 to 7.42).
Authors' conclusions
The results of this review suggest a possible beneficial effect of L‐ornithine L‐aspartate on mortality, hepatic encephalopathy, and serious adverse events in comparisons with placebo or no‐intervention, but, because the quality of the evidence is very low, we are very uncertain about these findings. There was very low quality evidence of a possible beneficial effect of L‐ornithine L‐aspartate on hepatic encephalopathy, when compared with probiotics, but no other benefits were demonstrated in comparison with other active agents. Additional access to data from completed, but unpublished trials, and new randomised placebo‐controlled, double‐blind clinical trials are needed.
PICO
Резюме на простом языке
L‐орнитин‐L‐аспартат для людей с хронической болезнью печени и печеночной энцефалопатией (плохое функционирование головного мозга)
Актуальность
Цирроз является хроническим заболеванием печени. У людей с этим заболеванием часто развивается печеночная энцефалопатия, осложнение, которое приводит к плохому функционированию головного мозга. У некоторых людей с циррозом развиваются очевидные клинические признаки нарушения функционирования мозга, например, проблемы с речью, балансом и повседневными функциями; в таких случаях говорят об очевидной печеночной энцефалопатии; изменения могут быть недолгими, могут повторяться или могут сохраняться в течение длительного времени. У других людей с циррозом может не быть очевидных клинических изменений, но имеются нарушения некоторых аспектов функции головного мозга, такие как внимание и способность выполнять сложные задачи; в таких случаях говорят о минимальной печеночной энцефалопатии. Причины развития печеночной энцефалопатии у людей сложны, но накопление в крови токсинов из кишечника, в частности, аммониевых соединений, играет ключевую роль. L‐орнитин‐L‐аспартат понижает уровень аммония в крови и поэтому может иметь полезные эффекты у людей с печеночной энцефалопатией или помочь остановить её развитие.
Вопрос обзора
Мы изучили использование L‐орнитин‐L‐аспартата, применяемого через рот (перорально) или вводимого в виде жидкости капельно в вену (внутривенно) для профилактики и лечения печеночной энцефалопатии, проведя обзор клинических испытаний, в которых люди с циррозом были в случайном порядке определены в группы для получения L‐орнитин‐L‐аспартата, неактивного препарата‐пустышки (называемого плацебо), отсутствия лечения, или применения другого лекарства для этого состояния, например, лактулозы, пробиотиков и рифаксимина. Мы включили участников с циррозом, с явной или минимальной печеночной энцефалопатией, или с риском развития этого осложнения.
Дата поиска
Декабрь 2017 года.
Источники финансирования исследований
Шесть из 36 рандомизированных клинических испытаний, которые мы включили, не получали финансирования или какой‐либо другой поддержки от фармацевтических компаний. Семнадцать испытаний получили финансовую поддержку от фармацевтических компаний и еще три получили L‐орнитин‐L‐аспартат или неактивное плацебо бесплатно; в отношении остальных 10 испытаний не было информации о финансировании.
Характеристика исследований
Мы включили 33 рандомизированных клинических испытания, в которых L‐орнитин‐L‐аспартат сравнивали с неактивным плацебо или с отсутствием вмешательства, и шесть рандомизированных клинических испытаний, в которых L‐орнитин‐L‐аспартат сравнивали с другими видами лечения энцефалопатии; в некоторых испытаниях было более одного сравнения. В пяти из включенных испытаний исследовали L‐орнитин‐L‐аспартат для профилактики печеночной энцефалопатии, а в 30 испытаниях изучали его использование в качестве лечения у людей с острой, хронической или минимальной печеночной энцефалопатией. Продолжительность лечения в испытаниях, в которых изучали внутривенные препараты, варьировала от 3 до 35 дней (в среднем, восемь дней) и от 7 до 180 дней в испытаниях, в которых изучали пероральные препараты (в среднем, 30 дней).
Основные результаты
Наши анализы показали, что L‐орнитин‐L‐аспартат может уменьшить смертность, улучшить течение печеночной энцефалопатии и предотвратить серьезные побочные эффекты, в сравнении с плацебо или отсутствием лечения, но он не имеет никаких дополнительных полезных эффектов в сравнении с другими лекарствами, используемыми для профилактики и лечения этого состояния.
Качество доказательств
Доказательства, которые мы нашли, был очень слабыми, и поэтому мы не уверены, что L‐орнитин‐L‐аспартат следует использовать для профилактики или лечения печеночной энцефалопатии у людей с циррозом. Многие исследования не были опубликованы и поэтому не были тщательно проверены, а многие из опубликованных испытаний получили поддержку от фармацевтической промышленности, что вносит элемент смещения. Соответственно, необходимо больше информации, прежде чем будет определено значение L‐орнитин‐L‐аспартата в профилактике и лечении печеночной энцефалопатии.
Authors' conclusions
Summary of findings
| L‐ornithine L aspartate compared to placebo or no intervention for people with cirrhosis and hepatic encephalopathy or at risk of developing hepatic encephalopathy | ||||||
| Participants: people with cirrhosis who had minimal or overt hepatic encephalopathy or who were at risk for developing hepatic encephalopathy; regardless of sex, age, aetiology, and severity of the underlying liver disease, or the presence of identified precipitating factors Setting: hospital or outpatient Intervention: L‐ornithine L‐aspartate Comparison: placebo or no intervention Outcomes: all outcomes assessed at maximum duration of follow‐up | ||||||
| Outcomes | Anticipated absolute effects* (95% CI) | Relative effect | № of participants | Quality of the evidence | Comments | |
| Risk with placebo or no intervention | Risk with L‐ornithine L aspartate | |||||
| Mortality | Study population | RR 0.42 (0.24 to 0.72) | 1489 | ⊕⊝⊝⊝ | ‐ | |
| 57 per 1000 | 24 per 1000 | |||||
| Hepatic encephalopathy assessed based on neurocognitive manifestations | Study population | RR 0.70 (0.59 to 0.83) | 1375 (22 RCTs) | ⊕⊝⊝⊝ | ‐ | |
| 470 per 1000 | 329 per 1000 | |||||
| Serious adverse events assessed using ICH‐GCP | Study population | RR 0.63 | 1489 (19 RCTs) | ⊕⊝⊝⊝ | ‐ | |
| 100 per 1000 | 63 per 1000 | |||||
| Quality of life assessed using 3 different questionnaires | 3 RCTs evaluated health‐related quality of life in participants with minimal hepatic encephalopathy. 1 found no difference between interventions based on the Liver Disease Quality of Life Assessment. 2 found a beneficial effect based on the total Sickness Impact Profile score. | (See comment) | ‐ | ⊕⊝⊝⊝ | ‐ | |
| Non‐serious adverse events assessed using ICH‐GCP | Study population | RR 1.15 | 1076 | ⊕⊝⊝⊝ | Reported non‐serious adverse events included gastrointestinal discomfort (e.g. change in bowel habits and bloating), headache, pruritus, and fatigue | |
| 128 per 1000 | 147 per 1000 | |||||
| *The risk in the intervention group (and its 95% confidence interval) is based on the assumed risk in the comparison group and the relative effect of the intervention (and its 95% CI). CHBG: Cochrane Hepato‐Biliary Group; CI: confidence interval; GCP: Good Clinical Practice; ICH: International Conference on Harmonisation; RCT: randomised clinical trial; RR: risk ratio; TSA: Trial Sequential Analysis. | ||||||
| GRADE Working Group grades of evidence | ||||||
| 1Downgraded 3 levels due risk of bias (result not confirmed in analyses of trials with a low risk of bias assessed using CHBG domains); evidence of publication bias (we were unable to gather data from unpublished trials); and imprecision (the TSA ignored the monitoring boundary). 2Downgraded 3 levels due risk of bias (result not confirmed in analyses of trials at low risk of bias assessed using CHBG domains; only 1 trial had a low risk of bias); evidence of publication bias (we were unable to gather data from unpublished trials); and inconsistency (I2 value of 63% and visual inspection of the forest plots suggested a risk of inconsistency). 3Downgraded 3 levels due risk of bias (result not confirmed in analyses of trials at low risk of bias assessed using CHBG domains; only 1 trial had a low risk of bias); evidence of publication bias (we were unable to gather data from unpublished trials); and imprecision (the TSA ignored the monitoring boundary). 4Downgraded 3 levels due to risk of bias (result not confirmed in analyses of trials at low risk of bias assessed using CHBG domains; none of the trials had a low risk of bias); evidence of publication bias (we were unable to gather data from unpublished trials); imprecision (we were only able to evaluate trials individually; trials reporting this outcome were small with wide CIs). 5Downgraded 3 levels due to risk of bias (result not confirmed in analyses of trials at low risk of bias assessed using CHBG domains; only 1 trial had a low risk of bias); evidence of publication bias (we were unable to gather data from unpublished trials); imprecision (trials reporting this outcome were small and the meta‐analysis result had wide CIs). | ||||||
| L‐ornithine L‐aspartate compared to lactulose for people with cirrhosis and hepatic encephalopathy | ||||||
| Patient or population: people with cirrhosis who had minimal or overt hepatic encephalopathy or who were at risk for developing hepatic encephalopathy; regardless of sex, age, aetiology, and severity of the underlying liver disease or the presence of identified precipitating factors Setting: hospital or outpatient Intervention: L‐ornithine L‐aspartate Comparison: lactulose Outcomes: all outcomes assessed at maximum duration of follow‐up | ||||||
| Outcomes | Anticipated absolute effects* (95% CI) | Relative effect | № of participants | Quality of the evidence | Comments | |
| Risk with lactulose | Risk with L‐ornithine L‐aspartate | |||||
| Mortality | Study population | RR 0.68 | 175 | ⊕⊝⊝⊝ | ‐ | |
| 23 per 1000 | 15 per 1000 | |||||
| Hepatic encephalopathy assessed based on neurocognitive manifestations | Study population | RR 1.13 | 175 | ⊕⊝⊝⊝ | ‐ | |
| 364 per 1000 | 411 per 1000 | |||||
| Serious adverse events assessed using ICH‐GCP | Study population | RR 0.69 | 144 | ⊕⊝⊝⊝ | ‐ | |
| 97 per 1000 | 67 per 1000 | |||||
| Quality of life assessed using questionnaires | No evidence was available for this outcome. | |||||
| Non‐serious adverse events assessed using ICH‐GCP | Study population | RR 0.05 | 292 (2 RCTs) | ⊕⊝⊝⊝ | ‐ | |
| 175 per 1000 | 12 per 1000 | |||||
| *The risk in the intervention group (and its 95% confidence interval) is based on the assumed risk in the comparison group and the relative effect of the intervention (and its 95% CI). CHBG: Cochrane Hepato‐Biliary Group; CI: confidence interval; GCP: Good Clinical Practice; ICH: International Conference on Harmonisation; RCT: randomised clinical trial; RR: risk ratio; TSA: Trial Sequential Analysis. | ||||||
| GRADE Working Group grades of evidence | ||||||
| 1Downgraded 3 levels due risk of bias (2 trials had a low risk of bias assessed using CHBG domains) and imprecision (wide CIs; small number of events/participants). We were unable to identify publication bias due to the small number of trials. 2Downgraded 3 levels due risk of bias (none of the included trials had a low risk of bias assessed using CHBG domains) and imprecision (wide CIs; small number of events/participants). We were unable to identify publication bias due to the small number of trials. | ||||||
| L‐ornithine L‐aspartate compared to probiotic for people with cirrhosis and hepatic encephalopathy | ||||||
| Patient or population: people with cirrhosis who had minimal or overt hepatic encephalopathy or who were at risk for developing hepatic encephalopathy; regardless of sex, age, aetiology, and severity of the underlying liver disease, or the presence of identified precipitating factors Setting: hospital or outpatient Intervention: L‐ornithine L‐aspartate Comparison: probiotic | ||||||
| Outcomes | Anticipated absolute effects* (95% CI) | Relative effect | № of participants | Quality of the evidence | Comments | |
| Risk with probiotic | Risk with L‐ornithine L‐aspartate | |||||
| Mortality | Study population | RR 1.01 (0.11 to 9.51) | 143 (2 RCTs) | ⊕⊝⊝⊝ | ‐ | |
| 14 per 1000 | 14 per 1000 | |||||
| Hepatic encephalopathy assessed based on neurocognitive manifestations | Study population | RR 0.71 (0.56 to 0.90) | 143 (2 RCTs) | ⊕⊝⊝⊝ | ‐ | |
| 722 per 1000 | 513 per 1000 | |||||
| Serious adverse events assessed using ICH‐GCP | Study population | RR 1.07 (0.23 to 4.88) | 143 (2 RCTs) | ⊕⊝⊝⊝ | ‐ | |
| 42 per 1000 | 45 per 1000 | |||||
| Quality of life assessed using questionnaires | No evidence available for this outcome. | |||||
| Non‐serious adverse events assessed using ICH‐GCP | No evidence available for this outcome. | |||||
| *The risk in the intervention group (and its 95% confidence interval) is based on the assumed risk in the comparison group and the relative effect of the intervention (and its 95% CI). CHBG: Cochrane Hepato‐Biliary Group; CI: confidence interval; GCP: Good Clinical Practice; ICH: International Conference on Harmonisation; RCT: randomised clinical trial; RR: risk ratio; TSA: Trial Sequential Analysis. | ||||||
| GRADE Working Group grades of evidence | ||||||
| 1Downgraded 3 levels due risk of bias (the analysis only includes 1 trial with a high risk of bias assessed using CHBG domains) and imprecision (wide CIs). We were unable to identify publication bias and did not evaluate heterogeneity because the analysis only includes 1 trial. | ||||||
| L‐ornithine L‐aspartate compared to rifaximin for people with cirrhosis and hepatic encephalopathy | ||||||
| Patient or population: people with cirrhosis who had minimal or overt hepatic encephalopathy or who were at risk for developing hepatic encephalopathy; regardless of sex, age, aetiology, and severity of the underlying liver disease, or the presence of identified precipitating factors Setting: hospital or outpatient Intervention: L‐ornithine L‐aspartate Comparison: rifaximin Outcomes: all outcomes assessed at maximum duration of follow‐up | ||||||
| Outcomes | Anticipated absolute effects* (95% CI) | Relative effect | № of participants | Quality of the evidence | Comments | |
| Risk with rifaximin | Risk with L‐ornithine L‐aspartate | |||||
| Mortality | Study population | RR 0.33 | 105 | ⊕⊝⊝⊝ | ‐ | |
| 38 per 1000 | 13 per 1000 | |||||
| Hepatic encephalopathy assessed based on neurocognitive manifestations | Study population | RR 1.06 | 105 | ⊕⊝⊝⊝ | ‐ | |
| 269 per 1000 | 285 per 1000 | |||||
| Serious adverse events assessed using ICH‐GCP | Study population | RR 0.32 | 43 | ⊕⊝⊝⊝ | ‐ | |
| 48 per 1000 | 15 per 1000 | |||||
| Quality of life assessed using questionnaires | No evidence was available for this outcome. | |||||
| Non‐serious adverse events assessed using ICH‐GCP | Study population | RR 0.32 | 43 | ⊕⊝⊝⊝ | ‐ | |
| 48 per 1000 | 15 per 1000 | |||||
| *The risk in the intervention group (and its 95% confidence interval) is based on the assumed risk in the comparison group and the relative effect of the intervention (and its 95% CI). CHBG: Cochrane Hepato‐Biliary Group; CI: confidence interval; GCP: Good Clinical Practice; ICH: International Conference on Harmonisation; RCT: randomised clinical trial; RR: risk ratio; TSA: Trial Sequential Analysis. | ||||||
| GRADE Working Group grades of evidence | ||||||
| 1Downgraded 3 levels due risk of bias (1 of the included trials had a low risk of bias assessed using CHBG domains) and imprecision (wide CIs; small number of events/participants). We were unable to identify publication bias due to the small number of trials. 2Downgraded 3 levels due risk of bias (the included trial had a high risk of bias assessed using CHBG domains) and imprecision (wide CIs; small number of events/participants). We were unable to identify publication bias due to the small number of trials. | ||||||
Background
Description of the condition
The term hepatic encephalopathy is used to describe the spectrum of neuropsychiatric change that can arise in people with cirrhosis. The joint guideline from the European Association for the Study of the Liver (EASL) and the American Association for the Study of Liver Diseases (AASLD) defines hepatic encephalopathy as: "brain dysfunction associated with liver insufficiency or portal systemic shunting" (EASL/AASLD 2014a; EASL/AASLD 2014b).
Clinically apparent or overt hepatic encephalopathy manifests as a neuropsychiatric syndrome encompassing a wide spectrum of mental and motor disorders (Weissenborn 1998; Ferenci 2002). It may develop over a period of hours or days, apparently spontaneously, or else, in 50% to 70% of instances, follow an identifiable precipitating event such as: gastrointestinal bleeding, infection, or dietary indiscretion. Episodes may recur. Between episodes, people may return to their baseline neuropsychiatric status or retain a degree of impairment (Bajaj 2010). Less frequently, people present with persistent neuropsychiatric abnormalities, which are always present to some degree, but which may fluctuate in severity. The changes in mental state range from subtle alterations in personality, intellectual capacity, and cognitive function to deep coma. The changes in motor function may include rigidity, disorders of speech production, tremor, delayed diadochocinetic movements, hyper‐ or hyporeflexia, choreoathetoid movements, Babinsky's sign, and transient focal symptoms (Victor 1965; Weissenborn 1998; Cadranel 2001). Asterixis, also known asa flapping tremor, is the best‐known motor abnormality. People with overt hepatic encephalopathy also show other abnormalities such as impaired psychomotor performance (Schomerus 1998); neurophysiological function (Parsons‐Smith 1957; Chu 1997); and alterations in cerebral neurochemical/neurotransmitter homeostasis (Taylor‐Robinson 1994), blood flow and metabolism (O'Carroll 1991), and cerebral fluid homeostasis (Haussinger 2000). In general, the degree of impairment in these variables increases with the severity of the underlying liver disease (Bajaj 2009).
Minimal hepatic encephalopathy (in the older literature 'subclinical' or 'latent') is the term used to describe the neuropsychiatric status of people with cirrhosis without apparent clinical neurocognitive deficits but who show abnormalities in neuropsychometric or neurophysiological performance (Ferenci 2002; Guérit 2009; Atluri 2011).
There is no gold standard for the diagnosis of hepatic encephalopathy; however, there are several diagnostic tests that can be used alone or in combination (Montagnese 2004). A full neuropsychiatric history and examination is necessary to identify abnormalities suggestive of hepatic encephalopathy such as: changes in memory, concentration, cognition, and consciousness and, equally importantly, to confirm their absence (Montagnese 2004). The West Haven Criteria are commonly used to assess changes in mental status (Conn 1977), while the Glasgow Coma Score is used to assess the level of consciousness (Teasdale 1974). It is also important to consider and exclude other potential causes of neuropsychiatric abnormalities including concomitant neurological disorders and other metabolic encephalopathies such as those associated with diabetes, renal failure, and chronic pulmonary disease (EASL/AASLD 2014a; EASL/AASLD 2014b).
People with hepatic encephalopathy show impairment on a range of psychometric tests. People with minimal hepatic encephalopathy show deficits in attention, visuospatial abilities, fine motor skills, or memory (Montagnese 2004; Randolph 2009), while people with overt hepatic encephalopathy show additional changes in psychomotor speed, executive function, and concentration. Several paper and pencil psychometric tests are used in the evaluation of cognitive performance. These tests are either used individually or are grouped together into test batteries or systems. Of these, the Number Connection Tests A & B are the best known (Ferenci 2002). The Psychometric Hepatic Encephalopathy Score (PHES), which comprises of five paper and pencil tests covering the domains of attention, visual perception, and visuoconstructive abilities, is the most widely used psychometric test battery and has high diagnostic specificity (Schomerus 1998; Weissenborn 2001); the test scoring needs adjustment for several confounding variables, such as age and level of education; many countries have now developed appropriate normative databases. In countries where levels of illiteracy are high, the Figure Connection Tests A & B are often used either alone or as part of the PHES battery (Dhiman 1995).
People with hepatic encephalopathy may also show several neurophysiological abnormalities (Guérit 2009). The electroencephalogram, which primarily reflects cortical neuronal activity, may show progressive slowing of background activity and abnormal wave morphology. Recent advances in electroencephalogram analysis allow provision of better quantifiable and more informative data (Jackson 2016; Olesen 2016). The brain responses, or evoked potentials, to stimuli such as light and sounds may show abnormal slowing or wave forms (or both) (Chu 1997; Guérit 2009). Other potential diagnostic techniques, such as the Critical Flicker Fusion Frequency (Kircheis 2002), and the Inhibitory Control Test, still need further validation (Bajaj 2008). Blood ammonia concentrations are not routinely measured to diagnose hepatic encephalopathy (Lockwood 2004; Blanco Vela 2011a), but are often monitored in clinical trials.
Description of the intervention
L‐ornithine L‐aspartate is a stable salt of the amino acids ornithine and aspartic acid. It can be administered both orally and intravenously (Rose 1998; Blanco Vela 2011b).
How the intervention might work
The exact pathogenesis of hepatic encephalopathy is unknown, but ammonia is known to play a key role (Butterworth 2014). The main sources of ammonia in the body are nitrogenous products in the diet, bacterial metabolism of urea and proteins in the colon, and the deamination of glutamine in the small intestine. The ammonia produced in the gut is absorbed into the portal vein, and together with the ammonia derived from hepatic amino acid metabolism, it is taken up by periportal hepatocytes and metabolised to urea via the urea cycle. Some ammonia is taken up by perivenous hepatocytes where it is converted to glutamine via glutamine synthetase. These two systems, working in concert, tightly control blood ammonia concentrations in the hepatic veins. The kidney and muscle also play a role in ammonia homeostasis (Wright 2011). In skeletal muscle, ammonia is transformed into glutamine through the action of glutamine synthetase. In the kidneys, ammonia is generated from the deamination of glutamine.
In people with cirrhosis this system for detoxifying ammonia can fail, first: because of failure of hepatocyte function, and second: because the presence of portal systemic collateral vessels allows blood to bypass the liver. As a result, gut‐derived ammonia is not effectively cleared from the blood by the liver; it consequently enters the systemic circulation and impinges on the brain where it has both direct and indirect effects on cerebral function.
L‐ornithine L‐aspartate promotes hepatic removal of ammonia by stimulating residual hepatic urea cycle activity and promoting glutamine synthesis, particularly in skeletal muscle (Rose 1999). The ornithine moiety stimulates the activity of carbamoyl phosphate synthetase within the liver, while the aspartate moiety stimulates the activity of arginase through nitrogen donation. It also enhances the activities of ornithine and aspartate transaminases in peripheral tissues to promote the production of glutamate, which predominantly occurs in muscle (Gebhardt 1997; Rose 1998; Blanco Vela 2011a). Thus, L‐ornithine L‐aspartate has ammonia‐lowering activities that might benefit people with hepatic encephalopathy.
Why it is important to do this review
Hepatic encephalopathy is a common and debilitating complication of cirrhosis. Approximately 10% to 14% of people with cirrhosis have overt hepatic encephalopathy when they are first diagnosed with liver disease (Saunders 1981). In people with decompensated cirrhosis, the prevalence of overt hepatic encephalopathy at presentation is about 20% (D'Amico 1986; de Jongh 1992; Zipprich 2012). In people with cirrhosis who have no evidence of neuropsychiatric impairment the risk of developing an episode of overt hepatic encephalopathy, within five years of presentation, varies from 5% to 25% depending on the presence or absence of other risk factors; the cumulated incidence of overt hepatic encephalopathy is as high as 40% (Randolph 2009; Bajaj 2011a). The prevalence of minimal hepatic encephalopathy may be more than 50% in people with previous overt hepatic encephalopathy (Sharma 2010; Lauridsen 2011).
The presence of hepatic encephalopathy, whether minimal or overt, is associated with significant impairment in the performance of complex tasks, such as driving (Schomerus 1981; Bajaj 2009; Kircheis 2009), and a detrimental effect on quality of life (Groeneweg 1998), and safety (Roman 2011). In addition, the presence of overt hepatic encephalopathy pre‐transplantation has a detrimental effect on neurocognitive function post‐transplantation (Sotil 2009), and on survival (Bustamante 1999; D'Amico 2006; Stewart 2007; Jepsen 2010). The one‐year survival rate in people who have hepatic encephalopathy at presentation is 36%, with a five‐year survival rate of 15% (Jepsen 2010), while the survival probability after a first episode of hepatic encephalopathy is 42% at one year but only 23% at three years (Bustamante 1999). Overt hepatic encephalopathy also poses a substantial burden for the carers of affected people (Bajaj 2011b), and a significant financial burden on healthcare systems (Poodad 2007; Stepanova 2012).
Means to prevent and treat hepatic encephalopathy in people with cirrhosis are clearly needed; L‐ornithine L‐aspartate, given its ammonia‐lowering properties, is a potential candidate. The advantage of L‐ornithine L‐aspartate should it prove efficacious and safe, is that it is available as an oral preparation and an intravenous infusion; as such it may benefit people with acute (episodic) hepatic encephalopathy, which is particularly difficult to treat. However, the randomised clinical trials undertaken to date have reached different conclusions as did the five meta‐analyses undertaken between 2000 and 2013 (Delcker 2000a; Jiang 2009; Soarez 2009; Perez Hernandez 2011; Bai 2013). Further, the EASL/AASLD guidelines stated, in relation to L‐ornithine L‐aspartate that intravenous L‐ornithine L‐aspartate can be used as an alternative or additional agent to treat people non‐responsive to conventional therapy but that oral supplementation with L‐ornithine L‐aspartate is ineffective (EASL/AASLD 2014a; EASL/AASLD 2014b). However, no evidence base was provided for this position statement.
Therefore, we have conducted a systematic review with meta‐analyses of all available randomised clinical trials of L‐ornithine L‐aspartate for hepatic encephalopathy in people with cirrhosis, following recommendations for best practice.
Objectives
To assess the beneficial and harmful effects of L‐ornithine L‐aspartate versus placebo, no intervention, or other active interventions for people with cirrhosis and hepatic encephalopathy.
Methods
Criteria for considering studies for this review
Types of studies
We included randomised clinical trials regardless of their publication status, language, or blinding in our primary analyses. If, during the selection of trials, we identified observational studies (i.e. quasi‐randomised studies, cohort studies, or patient reports) that reported adverse events caused by or associated with the interventions in our review, we included these studies in the review of adverse events. We did not specifically search for observational studies for inclusion in this review, which is recognised as a limitation.
Types of participants
We included participants with cirrhosis who had minimal or overt hepatic encephalopathy or who were at risk for developing hepatic encephalopathy. We included participants in our primary analyses regardless of sex, age, aetiology and severity of the underlying liver disease, or presence of identified precipitating factors. We excluded data on people with hepatic encephalopathy associated with acute liver failure or people with non‐cirrhotic portal hypertension.
Types of interventions
We compared: L‐ornithine L‐aspartate versus placebo or no intervention; and L‐ornithine L‐aspartate versus other active agents such as non‐absorbable disaccharides, antibiotics, probiotics, or branched‐chain amino acids. We included trials irrespective of the dose, treatment duration, or mode of administration of the L‐ornithine L‐aspartate. We allowed co interventions if they were administered equally to all comparison groups.
We did not plan to include analyses of glycerol phenylbutyrate, ornithine phenylacetate, or spherical carbon adsorbents (AST‐120), as these will be evaluated in a separate review (Zacharias 2017).
Types of outcome measures
We assessed all outcomes at the maximum duration of follow‐up (Gluud 2017).
Primary outcomes
-
All‐cause mortality.
-
Hepatic encephalopathy. We assessed the outcome using the primary investigators' overall assessment of the number of participants who developed hepatic encephalopathy; and the number of participants without a clinically relevant improvement in hepatic encephalopathy.
-
Serious adverse events: defined as any untoward medical occurrence that led to death; was life threatening; required hospitalisation or prolongation of hospitalisation; or resulted in persistent or significant disability (ICH‐GCP 1997). We analysed serious adverse events as a composite outcome (Gluud 2017).
Secondary outcomes
-
Non‐serious adverse events (all adverse events that did not fulfil the criteria listed under serious adverse events).
-
Health‐related quality of life.
Exploratory outcomes
-
Arterial or venous blood ammonia concentration.
Search methods for identification of studies
The last search update was undertaken in December 2017.
Electronic searches
We searched The Cochrane Hepato‐Biliary Group Controlled Trials Register (December 2017; Gluud 2017), Cochrane Central Register of Controlled Trials (CENTRAL) in the Cochrane Library (2017, Issue 11), MEDLINE Ovid (1946 to December 2017), Embase Ovid (1974 to December 2017), LILACS (1982 to December 2017; Bireme), Science Citation Index Expanded (1900 to December 2017; Web of Science), and Conference Proceedings Citation Index ‐ Science (1990 to December 2017; Web of Science) (Royle 2003), using the strategies and time spans detailed in Appendix 1. We did not have access to Chinese or Japanese databases but plan to search these in future updates should they become available to us via the Cochrane Hepato‐Biliary Group.
Searching other resources
We scanned the reference lists of relevant articles identified in the electronic searches, and proceedings from meetings of the British Society for Gastroenterology (BSG), the British Association for the Study of the Liver (BASL), the EASL, the United European Gastroenterology Week (UEGW), the American Gastroenterological Association (AGA), the AASLD, and the International Society for Hepatic Encephalopathy and Nitrogen Metabolism (ISHEN). We wrote to the principal authors of trials and the pharmaceutical companies involved in the manufacture and marketing of L‐ornithine L‐aspartate for additional information about both completed and ongoing trials.
We also searched online trial registries such as ClinicalTrial.gov (clinicaltrials.gov/); the European Medicines Agency (EMA) (www.ema.europa.eu/ema/); the World Health Organization International Clinical Trial Registry Platform (www.who.int/ictrp); and the Food and Drug Administration (FDA) (www.fda.gov), as well as pharmaceutical company sources for ongoing or unpublished trials and Google Scholar. We used the same or similar search terms to those used for searching the electronic databases (Appendix 1).
Data collection and analysis
Selection of studies
Three review authors (ETG, MYM, and CS), working independently, read the electronic search output, performed additional manual searches, and listed potentially eligible trials. One review author (MYM) liaised with the authors and pharmaceutical sponsor of identified unpublished trials to seek their release. All review authors read the potentially eligible trials and participated in the final selection of trials for inclusion. For trials described in more than one publication, we selected the paper with the longest duration of follow‐up as our primary reference. We listed details of all the included studies in the Characteristics of included studies table, and listed all the excluded trials with the reasons for their exclusion in the Characteristics of excluded studies table. A fourth review author (LLG) acted as ombudsman in case of disagreements on trial suitability for inclusion or exclusion. We resolved contrary opinions through discussion.
Data extraction and management
All review authors participated in data extraction and at least two review authors independently evaluated each randomised clinical trial. We asked medical professionals fluent in the language of the publication to translate foreign language papers. We requested missing data and other information from the published trial reports through correspondence with the authors of the included trials. We sought information and data from identified but unpublished trials by correspondence with trial authors and sponsors.
We gathered the following data from the included trials:
-
Trials: design (cross‐over or parallel); settings (number of clinical sites; outpatient or inpatient; inclusion period); country of origin; inclusion period; publication status;
-
participants: mean age, proportion of men, aetiology of cirrhosis, type of hepatic encephalopathy (diagnostic criteria and definitions/terminology), previous history of hepatic encephalopathy;
-
interventions: type, dose, duration of therapy, mode of administration;
-
primary and secondary outcome data, including the definitions used in the assessment of overall improvement of hepatic encephalopathy, and bias control.
Assessment of risk of bias in included studies
We assessed bias control using the domains described in the Cochrane Hepato‐Biliary Group module (Gluud 2017), and classified the risk of bias for separate domains as high, unclear, or low (Higgins 2011). We also included an overall assessment of bias control for both mortality and non‐mortality outcomes.
Allocation sequence generation
-
Low risk of bias: sequence generation achieved using computer random number generation or a random number table. Drawing lots, tossing a coin, shuffling cards, or throwing dice were adequate only if performed by an independent person.
-
Unclear risk of bias: not described.
-
High risk of bias: sequence generation method was not random.
Allocation concealment
-
Low risk of bias: allocation by a central and independent randomisation unit, administration of coded, identical drug containers/vials or sequentially numbered, opaque, sealed envelopes.
-
Unclear risk of bias: not described.
-
High risk of bias: the allocation sequence was likely to be known to the investigators who assigned the participants.
Blinding of participants and personnel
-
Low risk of bias: blinding of participants and personnel using placebo, double dummy, or similar. We defined lack of blinding as not likely to affect the assessment of mortality.
-
Unclear risk of bias: not described.
-
High risk of bias: no blinding or incomplete blinding, and the assessment of outcomes were likely to be influenced by lack of blinding (non‐mortality outcomes).
Blinding of outcome assessors
-
Low risk of bias: blinding of the outcome assessor using a placebo, double dummy, or similar. We defined lack of blinding as not likely to affect the assessment of mortality.
-
Unclear risk of bias: insufficient information.
-
High risk of bias: no blinding or incomplete blinding, and the assessment of outcomes were likely to be influenced by lack of blinding (non‐mortality outcomes).
Incomplete outcome data
-
Low risk of bias: missing data were unlikely to make treatment effects depart from plausible values. The investigators used sufficient methods, such as intention‐to‐treat analyses with multiple imputations or carry‐forward analyses, to handle missing data.
-
Unclear risk of bias: insufficient information.
-
High risk of bias: results were likely to be biased due to missing data.
Selective outcome reporting
-
Low risk of bias: trial reported clinically relevant outcomes such as mortality, hepatic encephalopathy, and serious adverse events. If we had access to the original trial protocol, the outcomes selected were those described in the protocol. If we obtained information from a trial registry (such as www.clinicaltrials.gov), we only used that information if the investigators registered the trial before inclusion of the first participant.
-
Unclear risk of bias: not all predefined outcomes were reported fully, or it was unclear whether data on these outcomes were recorded or not.
-
High risk of bias: one or more predefined outcomes were not reported.
For‐profit bias
-
Low risk of bias: trial appeared free of industry sponsorship or other type of for‐profit support.
-
Unclear risk of bias: insufficient information about support or sponsorship.
-
High risk of bias: trial received funding or other support from a pharmaceutical company including the provision of trial drugs.
Other bias
-
Low risk of bias: trial appeared free of other biases including: medicinal dosing problems or follow‐up (as defined below).
-
Unclear risk of bias: trial may or may not have been free of other factors that could put it at risk of bias.
-
High risk of bias: there were other factors in the trial that could have put it at risk of bias such as the administration of inappropriate treatments being given to the controls (e.g. an inappropriate dose) or follow‐up (e.g. the trial included different follow‐up schedules for participants in the allocation groups).
Overall bias assessment
-
Low risk of bias: all domains were low risk of bias using the definitions described above.
-
High risk of bias: one or more of the bias domains were of unclear or high risk of bias.
Measures of treatment effect
We used risk ratios (RR) for dichotomous outcomes and mean differences (MD) for continuous outcomes, both with 95% confidence intervals (CI). We also used Trial Sequential Analysis‐adjusted CI.
Unit of analysis issues
We included randomised clinical trials using a parallel group design; we only included data from the first treatment period of cross‐over trials (Higgins 2011). We included separate pair‐wise comparisons from multi‐arm trials. Accordingly, if a trial compared L‐ornithine L‐aspartate, rifaximin, and lactulose, we conducted separate analyses for L‐ornithine L‐aspartate versus rifaximin and L‐ornithine L‐aspartate versus lactulose.
Dealing with missing data
We extracted data on all randomised participants to allow intention‐to‐treat analyses. We planned to undertake analyses, using simple imputation, to evaluate the potential influence of missing outcome data (Higgins 2008), including 'worst‐case' and 'best‐case' scenario analyses in which participants in the intervention arm with missing outcome data would be classified as failures while their counterparts in the control arm would be classified as successes and vice versa (Gluud 2017).
Assessment of heterogeneity
We evaluated heterogeneity based on visual inspection of forest plots and expressed heterogeneity as I2 values using the following thresholds: 0% to 40% (unimportant), 40% to 60% (moderate), 60% to 80% (substantial), and greater than 80% (considerable). We included the information in the 'Summary of findings' tables.
Assessment of reporting biases
For meta‐analyses with at least 10 randomised clinical trials, we assessed reporting biases through regression analyses and visual inspection of funnel plots (Harbord 2006).
Data synthesis
We performed the analyses in Review Manager 5 (RevMan 2014), STATA (Stata 14), and Trial Sequential Analysis (TSA 2011).
Meta‐analysis
In our primary analyses, we stratified randomised clinical trials based on the type of control intervention (i.e. placebo or no intervention, non‐absorbable disaccharides, antibiotics, and probiotics). We compared the fixed‐effect and random‐effects estimates of the intervention effect. If the estimates were similar, then we assumed that any small‐study effects had little effect on the intervention effect estimate. If the random‐effects estimate was more beneficial, we re‐evaluated whether it was reasonable to conclude that the intervention was more effective in the smaller studies. If the larger studies tend to be those conducted with greater methodological rigour, or conducted in circumstances more typical of the use of the intervention in practice, then we reported the results of meta‐analyses restricted to the larger, more rigorous studies. Based on the clinical heterogeneity, we expected that several analyses would display statistical between‐trial heterogeneity (I2 greater than 0%). For random‐effects models, precision decreased with increasing heterogeneity and CIs would widen correspondingly. Therefore, we expected that the random‐effects model would give the most conservative (and a more correct) estimate of the intervention effect. Accordingly, we planned to report the results of our analyses based on random‐effects meta‐analyses.
Trial Sequential Analysis
We performed Trial Sequential Analysis to evaluate the risk of type 1 and type 2 errors (TSA 2011; Wetterslev 2017), and to evaluate futility in the analyses of our primary outcomes (Higgins 2008). We defined the required information size (also known as the 'heterogeneity adjusted required information size' (DARIS)) as the number of participants needed to detect or reject an intervention effect based on the relative risk reduction (RRR) and assumed control risk (ACR). We defined firm evidence as established if the Z‐curve crossed the monitoring boundary (also known as the 'trial sequential monitoring boundary') before reaching the required information size. We constructed futility boundaries to evaluate the uncertainty of obtaining a chance neutral finding. We performed the analyses with alpha set to 3%, power to 90%, and model‐based diversity. We planned to conduct the analyses including all randomised clinical trials and limited to trials at low risk of bias. We only undertook analyses including all trials due to the small number of trials at low risk of bias. We planned to estimate the RRR based on the upper CI for outcomes with a potential beneficial effect and the ACR in the pair‐wise meta‐analysis: for mortality, we used an RRR of 18% and an ACR of 5% (diversity 0%); for hepatic encephalopathy, we used an RRR set to 17% and an ACT of 40% (diversity 78%); for serious adverse events, we used an RRR of 10% and an ACR of 10% (diversity 0%). Due to the limited statistical power of our analyses, we also undertook post‐hoc Trial Sequential Analyses using an assumed RRR of 25% for the outcomes mortality and serious adverse events.
Subgroup analysis and investigation of heterogeneity
We undertook subgroup analyses to investigate heterogeneity based on stratification of trials by risk of bias and the type of hepatic encephalopathy overt (acute (episodic/recurrent) or chronic); minimal, and primary prevention. We also compared randomised clinical trials evaluating intravenous or oral L‐ornithine L‐aspartate and compared randomised clinical trials by publication status. Subgroup differences were analysed based on the variation (interaction) between different populations of participants or trials, using the test for subgroup differences (Chi2 and I2 values).
Sensitivity analysis
We performed sensitivity analyses excluding randomised clinical trials that included participants with iatrogenic shunts, and planned to conduct worst‐case and best‐case scenario analyses if we had access to the necessary data (number of participants with missing outcome data in both allocation groups).
'Summary of findings' tables
We used GRADEpro to generate 'Summary of findings' tables with information about all primary and secondary outcomes, risk of bias, and results of the meta‐analyses (Brozek 2008). We used the GRADE system to evaluate the quality of the evidence for outcomes reported in the review (Brozek 2008), considering the within‐trial risk of bias, inconsistency, imprecision, indirectness, and publication bias. We included the information in the interpretation of our results and reported conclusions based on the 'EPICOT' principle (Brown 2006).
Results
Description of studies
We identified 36 randomised clinical trials which potentially fulfilled our inclusion criteria (Characteristics of included studies table; Merz 1987; Merz 1988a; Merz 1988b; Merz 1988c; Merz 1988d; Merz 1989a; Merz 1989b; Merz 1992a; Merz 1994a; Merz 1994b; Feher 1997; Kircheis 1997; Stauch 1998; Fleig 1999; Hong 2003; Chen 2005; Poo 2006; Ahmad 2008; Maldonado 2010; Nimanong 2010; Oruc 2010; Puri 2010; Schmid 2010; Abid 2011; Blanco Vela 2011c; Mittal 2011; Ndraha 2011; Hasan 2012; Zhou 2013; Alvares‐da‐Silva 2014; Bai 2014; Sharma 2014; Higuera‐de la Tijera 2017; Taylor‐Robinson 2017; Varakanahalli 2017; Sidhu 2018).
We excluded 20 studies because they were quasi‐randomised, observational, included participants with acute liver failure, were not controlled, or for other reasons (Characteristics of excluded studies table; Müting 1980; Reikowski 1982; Merz 1988e; Merz 1991; Merz 1992b; Staedt 1993; Rees 2000; Delcker 2002; Acharya 2009; Abdo‐Francis 2010; Lim 2010; Ndhara 2010; Ong 2011; Tenda 2012; McPhail 2013; Aidrus 2015; Badea 2015; Popa 2015; Tiller 2016; Grover 2017).
We identified no ongoing studies.
Results of the search
We identified 4151 potentially relevant references from electronic databases and 47 additional records through manual searches and enquiries (Figure 1). We removed duplicates and references that did not refer to publications relevant to this review (e.g. publications describing animal studies), leaving 68 reports for further assessment. Included within these 68 were reports of 13 trials (Merz 1987; Merz 1988a; Merz 1988b; Merz 1988c; Merz 1988d; Merz 1988e; Merz 1989a; Merz 1989b; Merz 1991; Merz 1992a; Merz 1992b; Merz 1994a; Merz 1994b), from an unpublished report of a meta‐analysis of studies undertaken between 1986 and 1999 by Merz Pharmaceuticals or an oral presentation of a meta‐analysis of published and unpublished trials given at the International Society for Hepatic Encephalopathy and Nitrogen Metabolism (ISHEN) 2017 meeting by a Merz representative (or both Merz Pharmaceuticals and ISHEN). Of these, we excluded three trials that were not randomised or did not appear to include participants with cirrhosis or hepatic encephalopathy (Merz 1988e; Merz 1991; Merz 1992b; Characteristics of excluded studies table). A further 25 reports describing 17 trials were excluded for a variety of reasons. In total, we identified 40 records describing 36 randomised clinical trials, which fulfilled our inclusion criteria (Merz 1987; Merz 1988a; Merz 1988b; Merz 1988c; Merz 1988d; Merz 1989a; Merz 1989b; Merz 1992a; Merz 1994a; Merz 1994b; Feher 1997; Kircheis 1997; Stauch 1998; Fleig 1999; Hong 2003; Chen 2005; Poo 2006; Ahmad 2008; Maldonado 2010; Nimanong 2010; Oruc 2010; Puri 2010; Schmid 2010; Abid 2011; Blanco Vela 2011c; Mittal 2011; Ndraha 2011; Hasan 2012; Zhou 2013; Alvares‐da‐Silva 2014; Bai 2014; Sharma 2014; Higuera‐de la Tijera 2017; Taylor‐Robinson 2017; Varakanahalli 2017; Sidhu 2018).
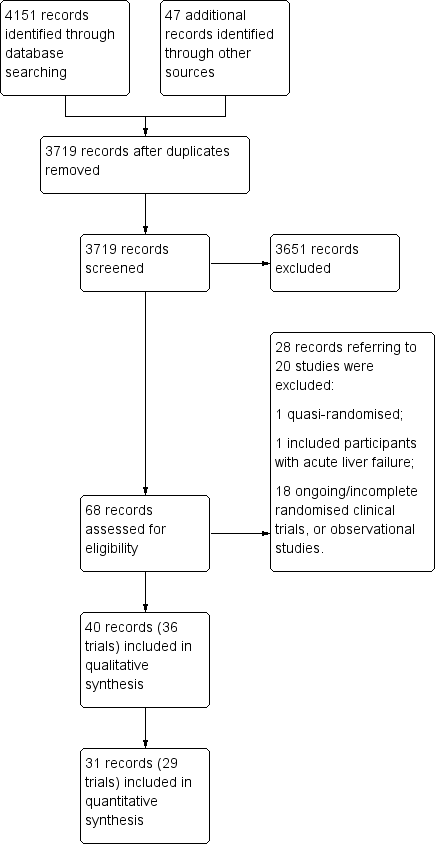
Study flow diagram.
We were unable to gather outcome data from four randomised clinical trials, involving 317 participants, which were only published as abstracts and for which, despite enquiry, no further information was forthcoming (Fleig 1999; Maldonado 2010; Oruc 2010; Hasan 2012). We were also unable to obtain outcome data from three of the remaining ten unpublished trials, involving at least 169 participants (Merz 1988d; Merz 1994a; Merz 1994b). Accordingly, our qualitative analyses included 36 randomised clinical trials while our quantitative analyses included 29 randomised clinical trials (Figure 1).
Included studies
Sixteen randomised clinical trials were published as full paper articles (Feher 1997; Kircheis 1997; Stauch 1998; Hong 2003; Chen 2005; Poo 2006; Ahmad 2008; Schmid 2010; Abid 2011; Mittal 2011; Ndraha 2011; Zhou 2013; Alvares‐da‐Silva 2014; Bai 2014; Sharma 2014; Sidhu 2018), 10 as abstracts (Fleig 1999; Maldonado 2010; Nimanong 2010; Oruc 2010; Puri 2010; Blanco Vela 2011c; Hasan 2012; Higuera‐de la Tijera 2017; Taylor‐Robinson 2017; Varakanahalli 2017), and 10 were unpublished (Merz 1987; Merz 1988a; Merz 1988b; Merz 1988c; Merz 1988d; Merz 1989a; Merz 1989b; Merz 1992a; Merz 1994a; Merz 1994b). We received information from investigators about the methods and outcomes for seven of the included randomised clinical trials (Abid 2011; Blanco Vela 2011c; Mittal 2011; Bai 2014; Higuera‐de la Tijera 2017; Taylor‐Robinson 2017; Sidhu 2018). We also received an unpublished report from Merz Pharmaceuticals and information from a Merz‐sponsored presentation of published and unpublished studies which provided information on 10 additional unpublished randomised clinical trials (Merz 1987; Merz 1988a; Merz 1988b; Merz 1988c; Merz 1988d; Merz 1989a; Merz 1989b; Merz 1992a; Merz 1994a; Merz 1994b).
The countries of origin of the included trials, where known, were China (Hong 2003; Chen 2005; Zhou 2013; Bai 2014), Germany (Merz 1988b; Merz 1988c; Merz 1989a; Feher 1997; Kircheis 1997; Stauch 1998; Fleig 1999), India (Puri 2010; Mittal 2011; Sharma 2014; Varakanahalli 2017; Sidhu 2018), Mexico (Poo 2006; Maldonado 2010; Blanco Vela 2011c; Higuera‐de la Tijera 2017), Indonesia (Ndraha 2011; Hasan 2012), Pakistan (Ahmad 2008; Abid 2011), Austria (Schmid 2010), Brazil (Alvares‐da‐Silva 2014), Thailand (Nimanong 2010), Turkey (Oruc 2010), and the UK (Taylor‐Robinson 2017).
Participants
The total number of registered participants was at least 2377. Seven randomised clinical trials included participants with acute, overt hepatic encephalopathy (Chen 2005; Ahmad 2008; Nimanong 2010; Oruc 2010; Blanco Vela 2011c; Zhou 2013; Sidhu 2018), one evaluated participants with chronic hepatic encephalopathy (Poo 2006), seven evaluated minimal hepatic encephalopathy (Hong 2003; Maldonado 2010; Puri 2010; Mittal 2011; Ndraha 2011; Alvares‐da‐Silva 2014; Sharma 2014), and four evaluated participants with no previous hepatic encephalopathy (Feher 1997; Bai 2014; Higuera‐de la Tijera 2017; Taylor‐Robinson 2017). One trial looked at the prevention of recurrence of hepatic encephalopathy (Varakanahalli 2017). The remaining randomised clinical trials evaluated participants with acute, overt, or minimal hepatic encephalopathy (Abid 2011), participants with chronic, overt, or minimal hepatic encephalopathy (Merz 1987; Merz 1988a; Merz 1988b; Merz 1988c; Merz 1989a; Merz 1989b; Merz 1992a; Merz 1994a; Merz 1994b; Kircheis 1997; Stauch 1998; Fleig 1999; Schmid 2010; Hasan 2012), or participants with minimal or no previous hepatic encephalopathy (Taylor‐Robinson 2017). Information on the type of hepatic encephalopathy could not be obtained for two of the unpublished randomised clinical trials (Merz 1988d; Merz 1994a).
Interventions
Thirty‐six randomised clinical trials compared L‐ornithine L‐aspartate with either placebo (Merz 1987; Merz 1988a; Merz 1988b; Merz 1988c; Merz 1988d; Merz 1989a; Merz 1989b; Merz 1992a; Merz 1994a; Feher 1997; Kircheis 1997; Stauch 1998; Fleig 1999; Ahmad 2008; Maldonado 2010; Nimanong 2010; Oruc 2010; Puri 2010; Schmid 2010; Abid 2011; Hasan 2012; Alvares‐da‐Silva 2014; Bai 2014; Sharma 2014; Higuera‐de la Tijera 2017; Taylor‐Robinson 2017; Varakanahalli 2017; Sidhu 2018), or no intervention (Hong 2003; Chen 2005; Mittal 2011; Ndraha 2011; Zhou 2013). Six randomised clinical trials included control groups allocated to lactulose (Merz 1994b; Poo 2006; Blanco Vela 2011c; Mittal 2011; Higuera‐de la Tijera 2017), probiotics (Mittal 2011; Sharma 2014), or rifaximin (Sharma 2014; Higuera‐de la Tijera 2017).
Eighteen trials evaluated intravenous L‐ornithine L‐aspartate (Merz 1988b; Merz 1988c; Merz 1988d; Merz 1989a; Merz 1992a; Merz 1994b; Feher 1997; Kircheis 1997; Fleig 1999; Chen 2005; Ahmad 2008; Oruc 2010; Schmid 2010; Abid 2011; Blanco Vela 2011c; Zhou 2013; Bai 2014; Sidhu 2018); the daily dose of intravenous L‐ornithine L‐aspartate ranged from 10 g to 40 g (median 20 g), while the duration of treatment ranged from three to 35 days (median eight days). Eighteen trials evaluated oral L‐ornithine L‐aspartate (Merz 1987; Merz 1988a; Merz 1989b; Merz 1994a; Stauch 1998; Hong 2003; Poo 2006; Maldonado 2010; Nimanong 2010; Puri 2010; Mittal 2011; Ndraha 2011; Hasan 2012; Alvares‐da‐Silva 2014; Sharma 2014; Higuera‐de la Tijera 2017; Taylor‐Robinson 2017; Varakanahalli 2017); the daily dose of oral L‐ornithine L‐aspartate ranged from 9 g to 18 g (median 17 g), while the duration of treatment ranged from seven to 180 days (median 30 days).
Eighteen randomised clinical trials evaluating intravenous administration included participants with acute (six trials), chronic/minimal hepatic encephalopathy (nine trials), acute/minimal hepatic encephalopathy (one trial), or no previous hepatic encephalopathy (two trials). We were unable to obtain information on the type of hepatic encephalopathy in one trial evaluating intravenous administration (Merz 1988d). The 18 randomised clinical trials evaluating orally administered L‐ornithine L‐aspartate included participants with acute (one trial), chronic (one trial), minimal (seven trials), chronic/minimal (six trials), minimal/no previous hepatic encephalopathy (one trial), no previous hepatic encephalopathy (one trial), or no current hepatic encephalopathy (one trial).
Outcomes
The total number of participants included in our quantitative analyses was 1891. We did not have access to outcome data for quantitative analyses from seven randomised clinical trials with at least 486 participants, corresponding to at least 20.4% of the total number of registered participants (Merz 1988d; Merz 1994a; Merz 1994b; Fleig 1999; Maldonado 2010; Oruc 2010; Hasan 2012). The duration of follow‐up ranged from three days to one month in randomised clinical trials evaluating intravenous administration and from seven to 180 days in trials evaluating oral administration. The tests used to evaluate hepatic encephalopathy and to define improved manifestations varied (Characteristics of included studies table). Commonly used scales included the West‐Haven criteria (Conn 1977), and the Portal Systemic Encephalopathy Score & Index that combines an evaluation of mental status with the scored severity of asterixis, Number Connection Test‐A results, electroencephalograph mean cycle frequency, and blood ammonia concentration (Conn 1977). Number Connection Test‐A was the most commonly employed single psychometric test.
Excluded studies
We excluded 20 clinical trials (Characteristics of excluded studies table; Müting 1980; Reikowski 1982; Merz 1988e; Merz 1991; Merz 1992b; Staedt 1993; Rees 2000; Delcker 2002; Acharya 2009; Abdo‐Francis 2010; Lim 2010; Ndhara 2010; Ong 2011; Tenda 2012; McPhail 2013; Aidrus 2015; Badea 2015; Popa 2015; Tiller 2016; Grover 2017).
One of the excluded studies was an open quasi‐randomised trial, which compared an intravenous infusion of L‐ornithine L‐aspartate with placebo (saline solution) (Aidrus 2015). The investigators used hospital admission numbers in the allocation of participants to intervention (even numbers) or placebo (uneven numbers). The study included 102 participants with cirrhosis due to viral hepatitis and acute, overt (Grade II to IV) hepatic encephalopathy. None died or experienced adverse events.
One randomised clinical trial included participants with acute liver failure (Acharya 2009). The trial evaluated intravenous L‐ornithine L‐aspartate 30 g/day (102 participants) versus placebo (99 participants). The trial report included per‐protocol analyses. Of the 185 participants analysed, 31 died in the treatment group and 39 died in the placebo group. Overall, there was no beneficial or harmful effects of L‐ornithine L‐aspartate on mortality, cerebral oedema, grade of encephalopathy, degree of prolongation of the prothrombin time, serum aspartate aminotransferase activity, or blood ammonia concentrations.
Three trials were identified in an unpublished report of a meta‐analysis of intravenous L‐ornithine L‐aspartate trials conducted between 1988 and 1999 undertaken by Merz Pharmaceuticals (Delcker 2000b), or in a meta‐analysis of published and unpublished trials presented at an international meeting in 2017 by a Merz representative. One trial was not randomised or blinded (Merz 1988e), and two were not randomised or controlled (Merz 1991; Merz 1992b) (Characteristics of excluded studies table).
One randomised clinical trial, involving 32 participants with minimal hepatic encephalopathy, evaluated oral L‐ornithine L‐aspartate 3.7 g together with branched‐chain amino acids given as a supplement either during the daytime or late evening (Tenda 2012). There were no differences in clinical outcome after one month; there were no serious adverse events.
We excluded a case series involving people with cirrhosis and acute variceal bleeding given lactulose with or without L‐ornithine L‐aspartate (Badea 2015), and nine observational studies involving participants with cirrhosis and overt (Reikowski 1982; Delcker 2002; Abdo‐Francis 2010; Lim 2010; Ong 2011; Popa 2015; Tiller 2016), or minimal hepatic encephalopathy (Ndhara 2010; Grover 2017). Three additional observational studies evaluated the effect of L‐ornithine L‐aspartate on cerebral magnetic imaging and spectroscopy in people with previous minimal hepatic encephalopathy (McPhail 2013), on portal vein blood ammonia levels following a glutamine challenge (Rees 2000), or the effects of a surgically created portal systemic shunt (Müting 1980). Finally, we excluded one dose‐finding study that evaluated the dose‐dependent effects of ornithine aspartate on postprandial hyperammonaemia and plasma amino acids (Staedt 1993). None of the excluded studies reported serious adverse events.
Risk of bias in included studies
We carried out the risk of bias assessment based on the information retrieved from the publications and from investigators (Figure 2).

Risk of bias summary: review authors' judgements about each risk of bias item for each included study.
Allocation
Investigators in 15 of the included randomised clinical trials used a computer or table to generate the allocation sequence and concealed the allocation using central randomisation or administration of serially numbered opaque sealed envelopes or coded drug containers (low risk of bias; Feher 1997; Kircheis 1997; Stauch 1998; Ahmad 2008; Schmid 2010; Abid 2011; Blanco Vela 2011c; Mittal 2011; Alvares‐da‐Silva 2014; Bai 2014; Sharma 2014; Higuera‐de la Tijera 2017; Taylor‐Robinson 2017; Varakanahalli 2017; Sidhu 2018). In the remaining trials, investigators did not report how they generated the allocation sequence or concealed the allocation (unclear risk of bias; Merz 1987; Merz 1988a; Merz 1988b; Merz 1988c; Merz 1988d; Merz 1989a; Merz 1989b; Merz 1992a; Merz 1994a; Merz 1994b; Fleig 1999; Hong 2003; Chen 2005; Poo 2006; Maldonado 2010; Nimanong 2010; Oruc 2010; Puri 2010; Ndraha 2011; Hasan 2012; Zhou 2013).
Blinding
Twenty randomised clinical trials were double blind with adequate blinding of participants, personnel, and outcome assessors by use of a placebo (low risk of bias; Merz 1988b; Merz 1988c; Merz 1988d; Merz 1989a; Feher 1997; Kircheis 1997; Stauch 1998; Fleig 1999; Ahmad 2008; Maldonado 2010; Nimanong 2010; Puri 2010; Schmid 2010; Abid 2011; Hasan 2012; Alvares‐da‐Silva 2014; Higuera‐de la Tijera 2017; Taylor‐Robinson 2017; Varakanahalli 2017; Sidhu 2018). Two trials (Blanco Vela 2011c; Bai 2014) were not blinded to personnel/participants, but the outcome assessment was blinded (high risk of performance but low risk of outcome assessment bias). Fourteen trials were open without blinding (high risk of bias: Hong 2003; Chen 2005; Poo 2006; Oruc 2010; Mittal 2011; Ndraha 2011; Zhou 2013; Sharma 2014) or did not report blinding measures (unclear risk of bias: Merz 1987; Merz 1988a; Merz 1989b; Merz 1992a; Merz 1994a; Merz 1994b). Overall, we classified 20 trials as at low risk, 10 trials as at high risk and 6 trials as at unclear risk of performance and detection bias.
Incomplete outcome data
Sixteen included randomised clinical trials had no missing outcome data and all participants were included in the analyses or else if outcome data were missing, data intention‐to‐treat analyses were undertaken using last observation carried forward (low risk of bias; Feher 1997; Kircheis 1997; Stauch 1998; Hong 2003; Chen 2005; Poo 2006; Ahmad 2008; Abid 2011; Blanco Vela 2011c; Mittal 2011; Alvares‐da‐Silva 2014; Bai 2014; Sharma 2014; Higuera‐de la Tijera 2017; Taylor‐Robinson 2017; Sidhu 2018). Sixteen randomised clinical trials did not describe or reported incomplete outcome data (unclear risk of bias; Merz 1987; Merz 1988a; Merz 1988b; Merz 1988c; Merz 1988d; Merz 1989a; Merz 1989b; Merz 1992a; Merz 1994a; Merz 1994b; Maldonado 2010; Nimanong 2010; Oruc 2010; Ndraha 2011; Hasan 2012; Varakanahalli 2017). The remaining four randomised clinical trials specifically excluded participants from the analyses (high risk of bias; Fleig 1999; Puri 2010; Schmid 2010; Zhou 2013).
Selective reporting
We classed 20 trials as having a low risk of selective reporting bias because they provided data on mortality, hepatic encephalopathy, and serious adverse events or reported clinically relevant outcomes as predefined in protocols (Kircheis 1997; Stauch 1998; Hong 2003; Chen 2005; Poo 2006; Ahmad 2008; Nimanong 2010; Puri 2010; Abid 2011; Blanco Vela 2011c; Mittal 2011; Ndraha 2011; Zhou 2013; Alvares‐da‐Silva 2014; Bai 2014; Sharma 2014; Higuera‐de la Tijera 2017; Taylor‐Robinson 2017; Varakanahalli 2017; Sidhu 2018). The remaining 16 randomised clinical trials did not report or had incomplete data on mortality or hepatic encephalopathy (unclear risk of bias: Merz 1987; Merz 1988a; Merz 1988b; Merz 1988c; Merz 1988d; Merz 1989a; Merz 1989b; Merz 1992a; Merz 1994a; Merz 1994b; high risk of bias: Feher 1997; Fleig 1999; Maldonado 2010; Oruc 2010; Schmid 2010; Hasan 2012).
For‐profit funding
Six randomised clinical trials did not receive funding or any other support from pharmaceutical companies (low risk of bias; Nimanong 2010; Blanco Vela 2011c; Mittal 2011; Alvares‐da‐Silva 2014; Bai 2014; Sharma 2014). Ten randomised clinical trials did not provide information on funding from this source (unclear risk of bias; Hong 2003; Chen 2005; Maldonado 2010; Oruc 2010; Puri 2010; Schmid 2010; Ndraha 2011; Hasan 2012; Zhou 2013; Varakanahalli 2017). Seventeen randomised clinical trials received funding and other support from pharmaceutical companies (high risk of bias; Merz 1987; Merz 1988a; Merz 1988b; Merz 1988c; Merz 1988d; Merz 1989a; Merz 1989b; Merz 1992a; Merz 1994a; Merz 1994b; Feher 1997; Kircheis 1997; Stauch 1998; Fleig 1999; Ahmad 2008; Abid 2011; Taylor‐Robinson 2017); a further three trials received a supply of L‐ornithine L aspartate/ placebo but no other support (high risk of bias; Poo 2006; Higuera‐de la Tijera 2017; Sidhu 2018)
Other potential sources of bias
We classed 10 unpublished randomised clinical trials at high risk of other biases (Merz 1987; Merz 1988a; Merz 1988b; Merz 1988c; Merz 1988d; Merz 1989a; Merz 1989b; Merz 1992a; Merz 1994a; Merz 1994b), and the remaining trials at low risk of bias for this domain (Feher 1997; Kircheis 1997; Stauch 1998; Fleig 1999; Hong 2003; Chen 2005; Poo 2006; Ahmad 2008; Maldonado 2010; Nimanong 2010; Oruc 2010; Puri 2010; Schmid 2010; Abid 2011; Blanco Vela 2011c; Mittal 2011; Ndraha 2011; Hasan 2012; Zhou 2013; Alvares‐da‐Silva 2014; Bai 2014; Sharma 2014; Higuera‐de la Tijera 2017; Taylor‐Robinson 2017; Varakanahalli 2017; Sidhu 2018).
Overall bias assessment
In the assessment of mortality, we classed five randomised clinical trials at low risk of bias (Blanco Vela 2011c; Mittal 2011; Alvares‐da‐Silva 2014; Bai 2014; Sharma 2014), and the remaining trials at high risk of bias (Merz 1987; Merz 1988a; Merz 1988b; Merz 1988c; Merz 1988d; Merz 1989a; Merz 1989b; Merz 1992a; Merz 1994a; Merz 1994b; Feher 1997; Kircheis 1997; Stauch 1998; Fleig 1999; Hong 2003; Chen 2005; Poo 2006; Ahmad 2008; Maldonado 2010; Nimanong 2010; Oruc 2010; Puri 2010; Schmid 2010; Abid 2011; Ndraha 2011; Hasan 2012; Zhou 2013; Higuera‐de la Tijera 2017; Taylor‐Robinson 2017; Varakanahalli 2017; Sidhu 2018).
In the assessment of non‐mortality outcomes, we classified one randomised clinical trials at low risk of bias (Alvares‐da‐Silva 2014); the remaining randomised clinical trials were at high risk of bias (Merz 1987; Merz 1988a; Merz 1988b; Merz 1988c; Merz 1988d; Merz 1989a; Merz 1989b; Merz 1992a; Merz 1994a; Merz 1994b; Feher 1997; Kircheis 1997; Stauch 1998; Fleig 1999; Hong 2003; Chen 2005; Poo 2006; Ahmad 2008; Maldonado 2010; Nimanong 2010; Oruc 2010; Puri 2010; Schmid 2010; Abid 2011; Blanco Vela 2011c; Mittal 2011; Ndraha 2011; Hasan 2012; Zhou 2013; Bai 2014; Sharma 2014; Higuera‐de la Tijera 2017; Taylor‐Robinson 2017; Varakanahalli 2017; Sidhu 2018).
Effects of interventions
See: Summary of findings for the main comparison L‐ornithine L aspartate compared to placebo or no intervention for people with cirrhosis and hepatic encephalopathy; Summary of findings 2 L‐ornithine L‐aspartate compared to lactulose for people with cirrhosis and hepatic encephalopathy; Summary of findings 3 L‐ornithine L‐aspartate compared to probiotic for people with cirrhosis and hepatic encephalopathy; Summary of findings 4 L‐ornithine L‐aspartate compared to rifaximin for people with cirrhosis and hepatic encephalopathy
L‐ornithine L‐aspartate versus placebo or no intervention
Primary outcomes
Mortality
We identified 33 randomised clinical trials with 2026 participants allocated to L‐ornithine L‐aspartate versus placebo or no intervention. We were able to extract mortality data from 19 randomised clinical trials involving 1489 participants (Analysis 1.1). Random‐effects meta‐analysis showed that L‐ornithine L‐aspartate was associated with a lower risk of mortality when including all trials (RR 0.42, 95% CI 0.24 to 0.72; I2 = 0%), but not when the analysis was restricted to the four trials at low risk of bias (RR 0.47, 95% CI 0.06 to 3.58; 244 participants) (Analysis 1.1). Regression analysis (P = 0.28) and an inspection of the funnel plot showed no evidence of small‐study effects (Figure 3). The Trial Sequential Analysis including all trials (relative risk ratio 18% and assumed control risk 5%) ignored the monitoring boundary and found insufficient evidence to support or refute an effect of L‐ornithine L‐aspartate on mortality. Post‐hoc Trial Sequential Analyses with the RRR increased to 25% found no evidence to support or refute an effect of L‐ornithine L‐aspartate on this outcome (TSA‐adjusted RR 0.42; 95% CI 0.04 to 3.86; Figure 4).
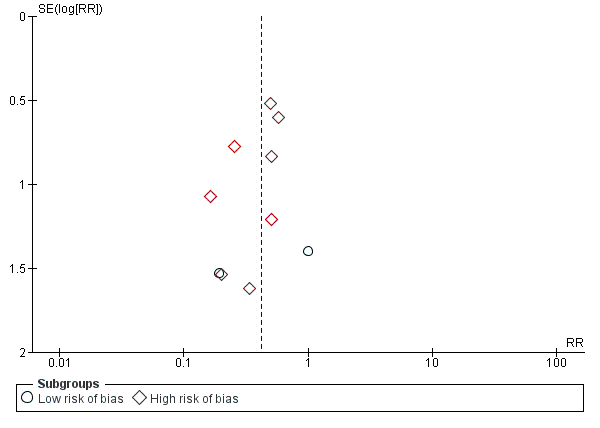
Funnel plot of comparison: 1 L‐ornithine L‐aspartate versus placebo/no intervention, outcome: 1.1 Mortality.
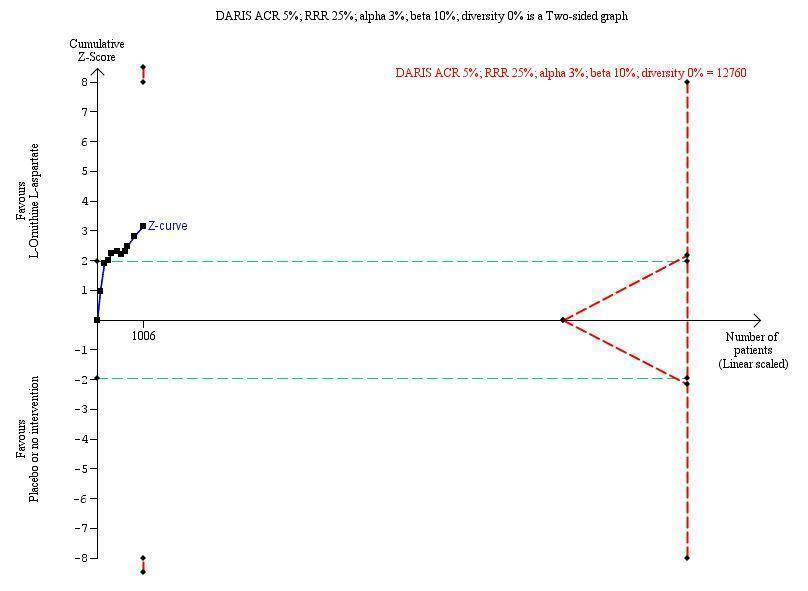
Mortality: Trial Sequential Analysis (relative risk random‐effects model) including randomised clinical trials comparing L‐ornithine L‐aspartate versus placebo or no intervention for people with cirrhosis and hepatic encephalopathy. The pair‐wise meta‐analysis included 19 trials with 1489 participants and found a risk ratio (RR) of 0.42 (95% CI 0.24 to 0.72). The figure shows the Trial Sequential Analysis made with the required information size (also known as the 'heterogeneity adjusted required information size' (DARIS)) defined as the number of participants needed to detect or reject an intervention effect based on the relative risk reduction (RRR) and assumed control risk (ACR). The analysis was made with alpha 3%, power 90%, model‐based diversity (0%), RRR 25%, and ACR 5%.
Subgroup analyses showed no difference in the effect of L‐ornithine L‐aspartate on mortality in trials evaluating acute hepatic encephalopathy, chronic hepatic encephalopathy (no events occurred), minimal hepatic encephalopathy, or the prevention of hepatic encephalopathy (Test for subgroup differences: Chi2 = 0.63, P = 0.73, I2 = 0%; Analysis 1.2). Similarly, there were no differences in the effects of L‐ornithine L‐aspartate when administered intravenously or orally (Test for subgroup differences: Chi2 = 0.433, P = 0.51, I2 = 0%; Analysis 1.3), or between trials published as full articles, or in abstract form (Pooled effect: Chi2 = 0.04, P = 0.85, I2 = 0%; Analysis 1.4).
Hepatic encephalopathy
We extracted data on hepatic encephalopathy from 22 trials involving 1375 participants (Analysis 1.5). The random‐effects meta‐analysis suggested a beneficial effect favouring L‐ornithine L‐aspartate when including all trials, but the between‐trial heterogeneity was substantial (RR 0.70, 95% CI 0.59 to 0.83; I2 = 62%); there was no beneficial effect in the one trial at low risk of bias (RR 0.96, 95% CI 0.85 to 1.07; 63 participants). Regression analysis and visual inspection of a funnel plot showed no evidence of small‐study effects (P = 0.23). The Trial Sequential Analysis (relative risk ratio 17%, assumed control risk 40%, alpha 3% and power 90%; diversity 50%) ignored trials in interim analyses and found that the Z‐curve crossed the monitoring boundary when including all trials regardless of bias control (TSA adjusted RR 0.75; 95% CI 0.35 to 1.42; Figure 5).
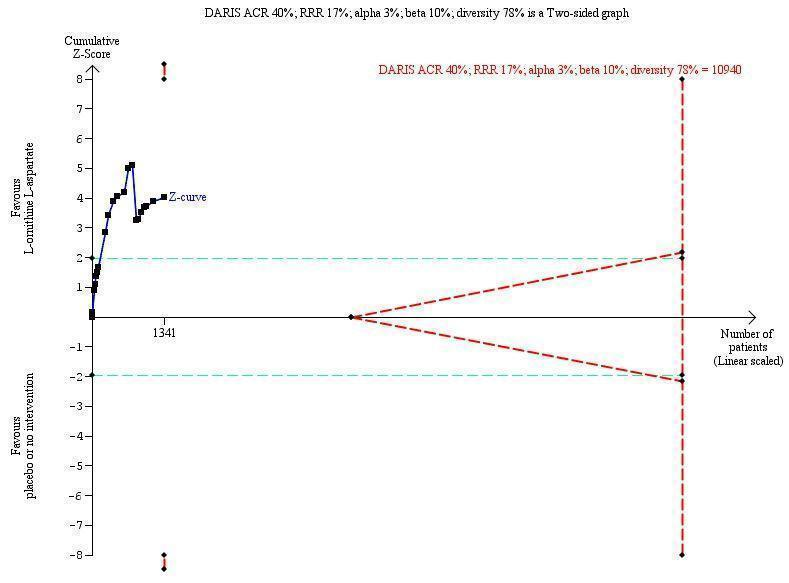
Hepatic encephalopathy: Trial Sequential Analysis of hepatic encephalopathy (relative risk random‐effects model). The analysis included randomised clinical trials comparing L‐ornithine L‐aspartate versus placebo or no intervention for people with cirrhosis and hepatic encephalopathy. The pair‐wise meta‐analysis included 1375 participants and 22 trials and found a risk ratio (RR) of 0.70 (95% CI 0.59 to 0.83). The figure shows the Trial Sequential Analysis made with the required information size (also known as the 'heterogeneity adjusted required information size' (DARIS)) defined as the number of participants needed to detect or reject an intervention effect based on the relative risk reduction (RRR) and assumed control risk (ACR). The analysis was made with alpha 3%, power 90%, model‐based diversity (78%), RRR 17%, and ACR 40%.
Subgroup analyses found no difference in the effect of L‐ornithine L‐aspartate on hepatic encephalopathy in trials evaluating acute hepatic encephalopathy, chronic hepatic encephalopathy, minimal hepatic encephalopathy, or the prevention of hepatic encephalopathy (Test for subgroup differences: Chi2 = 7.15, P = 0.07, I2 = 58%; Analysis 1.6).
There was no subgroup difference in effect on hepatic encephalopathy between trials evaluating L‐ornithine L‐aspartate given intravenously or orally (Test for subgroup differences Chi2 = 0.26, P = 0.61, I2 = 0%; Analysis 1.7). Subgroup analysis based on publication status showed a potential difference between trials published as full articles or abstracts and those that were unpublished (Test for subgroup differences: Chi2 = 6.78, P = 0.03, I2 = 70.5%; Analysis 1.8). Additional subgroup analyses found no difference between trials with complete or incomplete data (Test for subgroup differences: Chi2 = 2.19, P = 0.14, I2 = 54.4%; Analysis 1.9).
Serious adverse events
We were able to extract data on serious adverse events from 19 published randomised clinical trials with 1489 participants (Analysis 1.10). Random‐effects meta‐analysis showed that L‐ornithine L‐aspartate was associated with a lower risk of serious adverse events when including all trials (RR 0.63, 95% CI 0.45 to 0.90; 19 trials; 1489 participants; I2 = 0%); there was no beneficial effect in the one trial at low risk of bias (RR 0.83, 95% CI 0.15 to 4.65; 63 participants). Regression analysis found no small‐study effects (P = 0.989). The Trial Sequential Analysis (relative risk ratio 3% and assumed control risk 10%) ignored the monitoring boundary due to insufficient information and found no evidence to support or refute an effect of L‐ornithine L‐aspartate on serious adverse events. Post‐hoc subgroup analyses with the RRR increased to 25% found no evidence to support or refute an effect of L‐ornithine L‐aspartate (TSA adjusted RR 0.63; 95% CI 0.32 to 1.24; Figure 6). Subgroup analyses found no difference between trials evaluating acute or chronic hepatic encephalopathy, minimal hepatic encephalopathy, or the prevention of hepatic encephalopathy (Test for subgroup differences: Chi2 = 1.13, P = 0.77, I2 = 0%; Analysis 1.11). There was no difference between trials evaluating intravenous or oral administration (Test for subgroup differences: Chi2 = 0.25, P = 0.62, I2 = 0%; Analysis 1.12), or between trials published as full‐paper articles or abstracts, or those that were unpublished (Test for subgroup differences: Chi2 = 1.14, P = 0.23, I2 = 30.7%; Analysis 1.13).
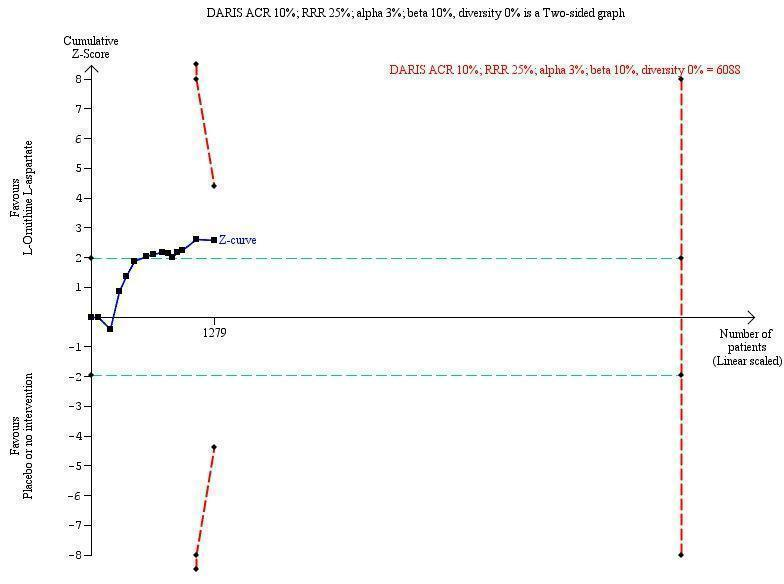
Serious adverse events: Trial Sequential Analysis (relative risk random‐effects model) including randomised clinical trials comparing L‐ornithine L‐aspartate versus placebo or no intervention for people with cirrhosis and hepatic encephalopathy. The pair‐wise meta‐analysis includes 19 trials with 1489 participants and found a RR of 0.63 (95% CI 0.45 to 0.90). The figure shows the Trial Sequential Analysis made with the required information size (also known as the 'heterogeneity adjusted required information size' (DARIS)) defined as the number of participants needed to detect or reject an intervention effect based on the relative risk reduction (RRR) and assumed control risk (ACR). The analysis is made with alpha 3%, power 90%, model‐based diversity (0%), RRR 25%, and ACR 10%.
Secondary outcomes
We were unable to conduct meta‐analyses evaluating health‐related quality of life. Three randomised clinical trials evaluated this outcome. The first evaluated quality of life in people with minimal hepatic encephalopathy using the Liver Disease Quality of Life Assessment (Alvares‐da‐Silva 2014), which includes scores for symptoms of liver disease, effects of liver disease, concentration, memory, quality of social interaction, health distress, sexual problems, sleep, loneliness, hopelessness, and stigma of liver disease. There were no differences in health‐related quality of life in participants allocated to L‐ornithine L‐aspartate at the beginning or end of the six‐month study period. The second trial evaluated quality of life in people with minimal hepatic encephalopathy using the Sickness Impact Profile questionnaire in a four‐way comparison of no treatment, L‐ornithine L‐aspartate, rifaximin, and probiotics (Mittal 2011). At the end of three months, the total Sickness Impact Profile score decreased by 1.05 in the no treatment group, by 7.33 in the L‐ornithine L‐aspartate group (P < 0.001), by 6.98 in the lactulose group (P < 0.001), and by 6.24 in the probiotics group (P < 0.001). The decrease in the Sickness Impact Profile score correlated with improvement in minimal hepatic encephalopathy, but on multivariate analysis, there was no correlation with the type of intervention offered, which were considered to be equally effective. The third trial evaluated the Sickness Impact Profile score in people recovering from an episode of acute overt hepatic encephalopathy randomised to either L‐ornithine L‐aspartate or placebo for six months for secondary prophylaxis (Varakanahalli 2017). There was a greater decrease in the scores in participants treated with L‐ornithine L‐aspartate (‐7.89) compared with participants receiving the placebo preparation (‐0.95) (P = 0.001).
In the analyses of non‐serious adverse events, we found no differences between L‐ornithine L‐aspartate and placebo or no intervention in the overall analysis (RR 1.15, 95% CI 0.75 to 1.77) or when evaluating diarrhoea (RR 1.32, 95% CI 0.07 to 24.18), flatulence (RR 1.60, 95% CI 0.49 to 5.18), headache (RR 7.67, 95% CI 0.39 to 148.82), abdominal pain (RR 0.63, 95% CI 0.23 to 1.69), fever (RR 1.72, 95% CI 0.12 to 23.62), general gastrointestinal effects (RR 0.89, 95% CI 0.55 to 1.45), pruritus (RR 0.60, 95% CI 0.30 to 1.21), or fatigue (RR 0.83, 95% CI 0.58 to 1.18) (Analysis 1.14). L‐ornithine L‐aspartate increased the risk of nausea/vomiting (RR 2.26, 95% CI 1.25 to 4.10; 10 trials; 639 participants; I2 = 0%) (Analysis 1.14).
Exploratory outcomes
L‐ornithine L‐aspartate was associated with a reduction in blood ammonia concentrations in trials reporting the difference between baseline values and values at the end of follow‐up (MD ‐12.94), 95% CI ‐20.04 to ‐5.83; 13 trials; 738 participants; I2 = 74%; Analysis 1.15). Based on the between‐trial heterogeneity (I2 = 98%), we chose to disregard the analysis of trials that only reported blood ammonia concentrations at the end of the treatment period.
L‐ornithine L‐aspartate versus other active agents
Lactulose
Meta‐analyses of four trials with 175 participants showed no difference between L‐ornithine L‐aspartate and lactulose in relation to mortality when including all trials (RR 0.68, 95% CI 0.11 to 4.17) or when the analysis was restricted to trials at low risk of bias (RR 3.00, 95% CI 0.13 to 71.51; 2 trials; 111 participants) (Analysis 2.1). Likewise, there was no difference between L‐ornithine L‐aspartate and lactulose for hepatic encephalopathy (RR 1.13, 95% CI 0.81 to 1.57; I2 = 0%) (Analysis 2.2) and serious adverse events (RR 0.69, 95% CI 0.22 to 2.11; I2 = 0%) (Analysis 2.3).
We were unable to undertake meta‐analyses of non‐serious adverse events (Analysis 2.4). Individual trials found no difference between L‐ornithine L‐aspartate and lactulose in relation to the risk of abdominal pain (RR 0.07, 95% CI 0.00 to 1.13), but lactulose increased the risk of diarrhoea (RR 0.03, 95% CI 0.00 to 0.54), bloating (RR 0.05, 95% CI 0.00 to 0.77), and flatulence (RR 0.05, 95% CI 0.00 to 0.77).
One trial evaluated quality of life based on the 36‐item Short Form (SF‐36) and EuroQoL questionnaires; there were no significant differences between L‐ornithine L‐aspartate and lactulose for the total SF‐36 score or the subscales, but a greater improvement in the EuroQoL total score in the L‐ornithine L‐aspartate group (P < 0.05) (Poo 2006).
Based on the between‐trial heterogeneity (I2 = 94%), we chose to disregard the analysis of blood ammonia concentrations (Analysis 2.5). We did not undertake regression analyses, Trial Sequential Analyses, or evaluate funnel plots due to the small number of trials included.
Probiotics
Two trials involving 143 participants assessed L‐ornithine L‐aspartate versus probiotics and found no beneficial difference in relation to the outcomes mortality (RR 1.01, 95% CI 0.11 to 9.51) (Analysis 3.1), but a possible beneficial effect of L‐ornithine L‐aspartate on hepatic encephalopathy (RR 0.71, 95% CI 0.56 to 0.90) (Analysis 3.2); there were no beneficial differences in serious adverse events (RR 1.07, 95% CI 0.23 to 4.88) (Analysis 3.3), or in changes in blood ammonia concentrations (RR ‐2.30 95% CI ‐6.08, 1.48) (Analysis 3.4). The trials did not evaluate health‐related quality of life.
Rifaximin
Two randomised clinical trials, involving 105 participants, compared L‐ornithine L‐aspartate versus rifaximin and found no difference in mortality (RR 0.33, 95% CI 0.04 to 3.03; I2 = 0%; Analysis 4.1), hepatic encephalopathy (RR 1.06, 95% CI 0.57 to 1.96; I2 = 0%) (Analysis 4.2), or serious adverse events (RR 0.32, 95% CI 0.01 to 7.42; Analysis 4.3).
One trial reported on nausea and vomiting and found no difference between the groups (RR 0.32, 95% CI 0.01 to 7.42; Analysis 4.4). The trials did not evaluate health‐related quality of life or blood ammonia concentrations.
'Summary of findings' tables
In the analyses comparing L‐ornithine L‐aspartate versus placebo/no intervention (summary of findings Table for the main comparison), we downgraded the quality of the evidence to 'very low' for mortality because the subgroup analysis of the four trials at low risk of bias found no evidence for a beneficial effect and the results were not confirmed in the Trial Sequential Analysis. We downgraded the quality of evidence for hepatic encephalopathy to 'very low' because none of the included trials had a low risk of bias; there was substantial between‐study heterogeneity and the Trial Sequential Analysis, which included all trials regardless of bias control, found no evidence to support or refute an intervention effect (summary of findings Table for the main comparison). We downgraded the quality of evidence for serious adverse events to 'very low' because only one trial had a low risk of bias and the results were not confirmed in the Trial Sequential Analysis (summary of findings Table for the main comparison).
We downgraded the evidence for the secondary outcome health‐related quality of life to 'very low' because the two trials that assessed this outcome were at high risk of bias and we were unable to combine the data in an overall analysis. We also downgraded the evidence for non‐serious adverse events to 'very low' because only one included trial had a low risk of bias; the CIs were very wide and we were only able to include data from 14 trials in our meta‐analysis (summary of findings Table for the main comparison).
There were no differences in outcomes in the analyses of the four trials comparing L‐ornithine L‐aspartate versus lactulose for any of the primary outcomes when considering all trials and the two trials at low risk of bias for the outcome mortality (summary of findings Table 2); information on non‐serious events adverse events was only available from one trial. Likewise, there were no differences in outcomes in the analyses comparing L‐ornithine L‐aspartate versus probiotics (summary of findings Table 3), or L‐ornithine L‐aspartate versus rifaximin (summary of findings Table 4).
Discussion
Summary of main results
This systematic review included qualitative information from 36 randomised clinical trials, involving at least 2377 participants and quantitative data from 29 randomised clinical trials involving 1891 participants. The primary analyses suggested that use of L‐ornithine L‐aspartate was associated with a reduction in all‐cause mortality, compared with placebo or no intervention, when including all trials, but not when the analysis was restricted to the trials at low risk of bias. In addition, the results were not confirmed in the Trial Sequential Analysis. We found no significant difference in the effect of L‐ornithine L‐aspatate on mortality when trials were stratified by the type of hepatic encephalopathy or the route of drug administration. Use of L‐ornithine L‐aspartate was associated with a beneficial effect on hepatic encephalopathy when all randomised trials were considered but not in the one trial at low risk of bias, and the Trial Sequential Analysis was equivocal. We found no significant difference in the effects of L‐ornithine L‐aspartate on hepatic encephalopathy between trials evaluating acute and chronic hepatic encephalopathy, minimal hepatic encephalopathy, or the prevention of hepatic encephalopathy or in relation to the route of administration. Use of L‐ornithine L‐aspartate was associated with a reduction in the risk of serious adverse events when all randomised clinical trials were considered, but benefit was not seen in the one trial at low risk of bias or in the Trial Sequential Analysis. There was no benefit with regards to serious adverse events in relation to the route of administration. The quality of the evidence for all three primary outcomes was very low. Three trials assessed quality of life but we were unable to combine the results in a meta‐analysis. There was no increased risk of non‐serious adverse effects, except for nausea, with L‐ornithine L‐aspartate. The quality of the evidence for the secondary outcomes was very low. L‐ornithine L‐aspartate was associated with a significant reduction in blood ammonia concentrations in trials reporting the difference between baseline values and values at the end of follow‐up. No beneficial effects of L‐ornithine L‐aspartate where identified when compared with lactulose or rifaximin, but a possible beneficial effect on hepatic encephalopathy was observed when compared with probiotics, albeit the quality of the evidence was very low.
Overall completeness and applicability of evidence
The main difficulty in undertaking this review was the high proportion of studies reported, often incompletely, as abstracts and the number of identified studies that had not been published and hence were not in the public domain.
We identified an abstract reporting a multicentre German/Swiss/Austrian randomised clinical trial comparing oral L‐ornithine L‐aspartate with placebo (Fleig 1999), involving 217 participants with cirrhosis and either minimal or low‐grade overt hepatic encephalopathy. This trial has not been published as a full paper but some trial data were subsequently included in a published paper critical of the psychometric test battery used to assess neuropsychiatric status in the study population (Kircheis 2007). Kircheis 2007 had access to the trial data and were willing to release them but Merz Pharmaceuticals, who sponsored the trial, did not wish the data to be made available for external distribution.
We also identified an abstract reporting a meta‐analysis (Delcker 2000a), using individual patient data, of trials of intravenous L‐ornithine L‐aspartate against placebo in people with cirrhosis and acute (overt) hepatic encephalopathy. This meta‐analysis has not been published as a full paper. We subsequently obtained an incomplete version of an unpublished clinical trial report written by two of the authors of the published abstract, dated October 2000, which had been prepared for Merz Pharmaceuticals (Delcker 2000b). The authors of the report had access to the Merz trials database for L‐ornithine L‐aspartate and identified 21 pilot studies, feasibility studies, controlled clinical trials, and postmarketing studies, undertaken between 1984 and 1999. Of these, they identified 11 which they thought might be suitable for inclusion in a structured meta‐analysis to determine the efficacy and safety of intravenous L‐ornithine L‐aspartate for the treatment of hepatic encephalopathy in people with cirrhosis. Their ultimate meta‐analysis included five randomised, double‐blind, placebo‐controlled, parallel design clinical trials, involving 246 people with cirrhosis and Grade 0 to II hepatic encephalopathy (Conn 1977), treated for at least seven days. They concluded that participants receiving L‐ornithine L‐aspartate had a 3.2‐fold greater chance (95% CI 1.38 to 7.55) of being free of hepatic encephalopathy at the end of treatment than participants receiving placebo. They also reported that L‐ornithine L‐aspartate was well tolerated.
Three of the studies included in this internal meta‐analysis remain unpublished (Merz 1988b; Merz 1988c; Merz 1989a), while two have been published (Feher 1997 (MRZ 90004‐9003); Kircheis 1997 (MRZ 90004‐8908)). Six of the 11 trials originally identified in the Merz internal report were excluded from the analyses for a variety of reasons. Two of the six were neither randomised nor controlled (Merz 1991; Merz 1992b), while a third was a dose‐finding study (Staedt 1993 (MRZ 90004‐8603)); none of these studies would have been eligible for inclusion in our review. However, the remaining three studies excluded from the meta‐analysis were eligible and were included (Merz 1988d; Merz 1992a; Merz 1994b). No further information was available on the additional 10 studies mentioned in this report. Negotiations with Merz Pharmaceuticals for release of the additional trial data were unsuccessful.
In early 2017, a representative for Merz Pharmaceuticals presented the result of a meta‐analysis of published and unpublished trials of L‐ornithine L‐aspartate 'for the treatment of hepatic encephalopathy in cirrhosis' at a meeting of the International Society for the Study of Hepatic Encephalopathy and Nitrogen Metabolism (ISHEN) in Delhi, India (Butterworth 2017). This presentation provided details of five unpublished placebo‐controlled trials of intravenous L‐ornithine L‐aspartate, involving 152 participants, which were included in the internal Merz clinical trial report (Merz 1988b; Merz 1988c; Merz 1989a; Merz 1992a; Merz 1994b), although not necessarily in the meta‐analysis (Delcker 2000a). In addition, information was provided on four unpublished randomised placebo‐controlled trials of oral L‐ornithine L‐aspartate (Merz 1987; Merz 1988a; Merz 1989b; Merz 1994a), and one unpublished non‐randomised trial (Merz 1988e).
Thus, we identified 26 unpublished trials and were able, from a combination of the sources mentioned above, to extract some information from 13; 10 of these unpublished trials, involving approximately 287 participants, were included in our analyses (Merz 1987; Merz 1988a; Merz 1988b; Merz 1988c; Merz 1988d; Merz 1989a; Merz 1989b; Merz 1992a; Merz 1994a; Merz 1994b), while the remaining three were excluded (Merz 1988e; Merz 1991; Merz 1992b). It is possible that we might have excluded some of the unpublished trials currently considered suitable for inclusion had we had more information. Equally, there may be further unpublished trials that we failed to identify.
Although there were concerns about the volume of unpublished and, to some extent, unavailable trial material, we were still able to include 36 randomised clinical trials involving at least 2377 participants in our qualitative analyses, and 29 randomised clinical trials involving 1899 participants in our quantitative analyses, and we were able to perform meta‐analyses for the most important outcomes for people with cirrhosis and hepatic encephalopathy, namely mortality, morbidity, adverse events, and quality of life (Bajaj 2011b). We included information on all of these outcomes, although there was very limited information on quality of life.
The trials evaluated improvement in hepatic encephalopathy using a variety of methods to assess changes in neuropsychiatric status. This partly reflects that the fact that the trials were conducted between 1988 and 2016 during which time diagnostic criteria have changed on more than one occasion. The included trials often used clinical or composite scoring systems and a categorical approach to define improvement (or lack thereof). The diagnostic classification of hepatic encephalopathy also changed during the time period (EASL/AASLD 2014a; EASL/AASLD 2014b). Thus, we decided a priori to utilise the individual primary investigators' classification of the type of hepatic encephalopathy and their outcome criteria as these were likely to have been most clinically relevant at the time. We have provided a comparison of the definition of neuropsychiatric status used in the source material and the current suggested terminology (Table 1). The older trials often used cointerventions such as dietary protein restriction but, although cointerventions were not used consistently in all the trials, participants randomised to experimental or control groups within a given trial would have had equal access to them. This might result in heterogeneity but not in systematic differences between groups.
| Study and date | Definition of hepatic encephalopathy | Assessment of neuropsychiatric status | |
| Study material (publication) | EASL/AASLD guideline | ||
| Minimal | Minimal |
| |
| Acute: Grade I to IV | Episodic | ||
| Acute: Grade I to III | Episodic |
| |
| Minimal | Minimal |
| |
| Unimpaired | Unimpaired |
| |
| Acute: Grade III or IV | Overt |
| |
| Acute: Grade I to IV | Episodic |
| |
| Feher 19971,2 | Unimpaired | Unimpaired |
|
| Minimal | Minimal |
| |
| Chronic Grade I or II | Persistent | ||
| Minimal | Minimal |
| |
| Chronic: Grade I or II | Persistent | ||
| Unimpaired | Unimpaired |
| |
| Minimal | Minimal |
| |
| Minimal | Minimal |
| |
| Chronic: Grade I or II | Persistent | ||
| Minimal | Minimal |
| |
| Minimal | Minimal |
| |
| Overt | Unclear | ||
| Minimal | Minimal |
| |
| Overt | Unclear | ||
| Minimal | Minimal |
| |
| Acute | Episodic | ||
| Minimal | Minimal |
| |
| Overt | Unclear | ||
| Unknown | Unknown |
| |
| Minimal | Minimal |
| |
| Overt | Unclear | ||
| Minimal | Minimal |
| |
| Overt | Unclear | ||
| Minimal | Minimal |
| |
| Overt | Unclear | ||
| Minimal | Minimal |
| |
| Overt | Unclear | ||
| Minimal | Minimal |
| |
| Overt | Unclear | ||
| Minimal | Minimal |
| |
| Minimal | Minimal |
| |
| Acute: Grade II or III | Episodic |
| |
| Acute | Episodic |
| |
| Chronic persistent: Grade I or II | Persistent |
| |
| Minimal | Minimal |
| |
| Minimal Chronic: Grade I or II | Minimal |
| |
| Chronic: Grade I or II | Persistent | ||
| Minimal | Minimal |
| |
| Acute: Grade II to IV | Episodic |
| |
| Minimal | Minimal |
| |
| Chronic: Grade I or II | Persistent | ||
| Unimpaired | Unimpaired |
| |
| Minimal | Minimal | ||
| Unimpaired | Unimpaired |
| |
| Acute | Episodic |
| |
AASLD: American Association for the Study of Liver Diseases; EASL: European Association for the Study of the Liver.
1Trials of L‐ornithine L‐aspartate used for primary prevention.
2Not included in the analysis of hepatic encephalopathy versus placebo or non‐intervention.
3Portal‐systemic encephalopathy (PSE) sum and index (Conn 1977), which is calculated using 5 variables: mental status, presence and severity of asterixis; Number Connection Test‐A time, blood ammonia concentration, and the electroencephalogram mean dominant frequency. Each variable is assigned a score of 0 (no abnormality) to 4 (severe abnormality); mental status is weighted by a factor of three; PSE index calculated as the ratio of the points scored and the maximum possible score of 28.
4Trial of L‐ornithine L‐aspartate used for secondary prevention.
Hepatic encephalopathy varies widely in its manifestations. The trials included in our review represent the entire spectrum of the syndrome encountered in people with cirrhosis. Thus, we included trials evaluating the use of L‐ornithine L‐aspartate in people experiencing an acute episode of hepatic encephalopathy, people with chronic hepatic encephalopathy associated with advanced liver disease and/or spontaneous, or surgically created portal‐systemic shunts, and people with minimal hepatic encephalopathy who appear clinically normal, but exhibit psychometric and neurophysiological abnormalities or both. In addition, a small number of the trials explored the use of L‐ornithine L‐aspartate for primary and secondary prophylaxis of hepatic encephalopathy. The fact that the trials addressed all the objectives of the review strengthened the completeness of the evidence. We included all randomised clinical trials with extractable data in our primary analyses. We also conducted subgroup, sensitivity, and regression analyses to determine the differential effects of interventions on the clinical variants.
People with non‐cirrhotic portal hypertension and people with fulminant hepatic failure may also develop hepatic encephalopathy but are encountered much less frequently in clinical practice, and are not represented in the included trials. There is no reason to suppose that our results could not be extrapolated to people with hepatic encephalopathy associated with non‐cirrhotic portal hypertension (e.g. portal vein block). However, the results may not be directly applicable in people with fulminant hepatic failure.
Episodes of hepatic encephalopathy often develop in response to a precipitating event such as infection, gastrointestinal bleeding, alcohol misuse, or electrolyte disturbances. Identification and treatment of these precipitating factors is key to the management of affected people (EASL/AASLD 2014a; EASL/AASLD 2014b). Avoiding likely precipitants such as constipation, dietary indiscretion, and certain medications can also reduce the risk of developing hepatic encephalopathy in the longer term. It is unclear whether L‐ornithine L‐aspartate provides additional benefit in situations where hepatic encephalopathy is precipitated by a treatable event. The randomised clinical trials included in our review did not provide detailed information on possible precipitating events, on the effects of interventions designed to ameliorate them, or on the effects, if any, of the addition of L‐ornithine L‐aspartate.
Hepatic encephalopathy imposes a significant burden on healthcare systems and the resource utilisation associated with the management of people with hepatic encephalopathy is increasing (Poodad 2007). The increased costs do not seem to reflect the duration of hospitalisation, which has decreased, but a combination of direct and indirect factors such as the costs of treatment and rehabilitation after hospitalisation (Neff 2010). None of the randomised clinical trials included in the present review assessed the costs associated with hospitalisation.
Quality of the evidence
The main reasons for downgrading the evidence in this review were bias, imprecision, and potential publication bias.
Bias: we included randomised clinical trials published as full papers or abstracts and obtained additional information on essential aspects of bias control from the authors of these works. In addition, we obtained information on several unpublished trials and were able to obtain some information on these. As recommended, we combined the individual bias domains in an overall assessment (Gluud 2017). We also included an assessment of individual domains, focusing on randomised clinical trials at low risk of selection bias (Higgins 2011; Savovic 2012). We defined mortality, but not serious adverse events, as an outcome that is robust to performance and detection bias (Savovic 2012). This decision can be questioned as lack of blinding is not likely to influence the assessment of events such as variceal bleeding, hepatorenal syndrome, and liver failure. We included any type of for‐profit funding as a bias domain (Gluud 2017). The decision to include this domain is debatable (Higgins 2011). The fact that we included gratuitous supply of interventions or placebo was the main reason that we only identified a small number of studies with a low risk of bias in the overall assessment. Based on the assessment of bias control combined with the assessment of the directness of evidence, heterogeneity, precision of effect estimate, and risk of publication bias, we classified the quality of the evidence as very low for the assessment of our primary outcomes mortality, hepatic encephalopathy, and serious adverse events.
Imprecision: where the primary meta‐analyses including all trials regardless of bias control, we found potential beneficial effects. However, our Trial Sequential Analyses suggested that we have insufficient evidence to support or refute any beneficial or harmful effects of this intervention. This suggests that our results may reflect random or systematic errors.
Publication bias: we identified several unpublished trials and trials published in abstract form. Unfortunately, for most of these trials, we either had no data or could only access incomplete data sets. Our analyses of these trials did not show convincing effects of L‐ornithine L‐aspartate and we, therefore, strongly suspect that publication bias may have affected our findings.
Potential biases in the review process
We undertook the review based on current recommendations for bias control (Higgins 2011; Gluud 2017). One methodological review drew attention to selective inclusion and reporting of outcomes and analyses in systematic reviews (Page 2014). We attempted to minimise possible selection bias by using a comprehensive search strategy that uncovered both published and unpublished trials. Searches in electronic databases were combined with handsearches of the biographies of identified studies. In addition, we searched conference proceedings and abstract books from relevant national and International society meetings. We consider it unlikely that we have missed published trials. In addition, from a starting base of two published abstracts, we identified 26 unpublished trials but could not exclude the possibility that more unpublished trials exist. The selective publication of randomised clinical trials with a positive result increases the risk of outcome reporting bias (Dwan 2008). Our subgroup analysis based on publication status found no differences between published trials or trials with complete data sets and unpublished trials or trials with incomplete data sets for the outcomes mortality and serious adverse events. However, there was a potential difference in relation to publication status for the outcome hepatic encephalopathy not explained by the completeness or otherwise of the data.
Four of the included randomised clinical trials assessed the use of L‐ornithine L‐aspartate for prevention of hepatic encephalopathy while the remaining 32 trials assessed its use for the treatment of hepatic encephalopathy. All 36 trials were included in the analyses of the primary outcomes and it is possible that combining the prevention and treatment trials in this way may have introduced bias. However, the results of the subgroup analyses showed that the outcomes in the prevention trials were not noticeably different from those in the overall analyses.
Agreements and disagreements with other studies or reviews
Several meta‐analyses of the L‐ornithine L‐aspartate trials have been undertaken (Delcker 2000a; Jiang 2009; Soarez 2009; Perez Hernandez 2011; Bai 2013; Butterworth 2017). The meta‐analysis by Delcker 2000a, published in abstract form, included three unpublished and two published studies involving 246 participants (Merz 1988b; Merz 1988c; Merz 1989a; Feher 1997; Kircheis 1997); the meta‐analysis found a significant beneficial effect of treatment on the resolution of hepatic encephalopathy, and of the time taken to complete the Number Connection Test and postprandial ammonia concentrations. The meta‐analysis by Jiang 2009 included three published randomised clinical trials with 212 participants (Kircheis 1997; Stauch 1998; Poo 2006), and this meta‐analysis found that L‐ornithine L‐aspartate was associated with a beneficial effect on overt, but not minimal, hepatic encephalopathy when compared with placebo or lactulose. The meta‐analysis by Soarez 2009 included four placebo‐controlled trials with 217 participants (Staedt 1993; Kircheis 1997; Stauch 1998; Rees 2000), and it found that although L‐ornithine L‐aspartate reduced blood ammonia concentrations, it had no effect on hepatic encephalopathy per se. A subsequent meta‐analysis undertaken by Perez Hernandez 2011 included five randomised clinical trials involving 422 participants with cirrhosis (Staedt 1993; Kircheis 1997; Kircheis 2002; Ahmad 2008; Abdo‐Francis 2010), and one randomised clinical trial including 201 participants with fulminant liver failure (Acharya 2009). The results showed that L‐ornithine L‐aspartate improved neuropsychiatric performance and decreased venous blood ammonia concentrations. The meta‐analysis by Bai 2013 evaluated eight trials with 646 participants and found that L‐ornithine L‐aspartate had a beneficial effect in people with overt and minimal hepatic encephalopathy and on fasting ammonia concentrations compared with placebo, no intervention, or lactulose (Kircheis 1997; Stauch 1998; Poo 2006; Ahmad 2008; Schmid 2010; Abid 2011; Mittal 2011; Ndraha 2011). The meta‐analyses undertaken in 2011 and 2013 did not adjust the quantitative result by the quality of the evidence. A meta‐analysis by Butterworth 2017, published in abstract form, included 16 published and 10 unpublished trials, involving 1618 participants (Merz 1987; Merz 1988a; Merz 1988b; Merz 1988c; Merz 1988e; Merz 1989a; Merz 1989b; Merz 1992a; Staedt 1993; Merz 1994a; Merz 1994b; Feher 1997; Kircheis 1997; Stauch 1998; Fleig 1999; Rees 2000; Chen 2005; Poo 2006; Ahmad 2008; Schmid 2010; Abid 2011; Mittal 2011; Ndraha 2011; Alvares‐da‐Silva 2014; Bai 2014; Sharma 2014); this meta‐analysis found a beneficial effect of L‐ornithine L‐aspartate on blood ammonia concentrations and mental status . Finally, a meta‐analysis (Butterworth 2018), also published in abstract form, included six randomised clinical trials involving 292 people with cirrhosis and minimal hepatic encephalopathy (Kircheis 1997; Stauch 1998; Abid 2011; Mittal 2011; Alvares‐da‐Silva 2014; Sharma 2014); this meta‐analysis found a beneficial effect of L‐ornithine L‐aspartate on blood ammonia concentrations and also on psychometric performance but only when given orally and not intravenously. The two most recent meta‐analyses (Butterworth 2017; Butterworth 2018) were commissioned by Merz Pharmaceuticals, and there are considerable problems with the ascription of bias in the individual trials and in the meta‐analyses overall.
In this review, we included 36 trials with at least 2377 participants in our qualitative analyses and 29 randomised clinical trials with 1891 participants in our quantitative analyses, making it the largest and most comprehensive systematic review with meta‐analyses undertaken to date. We included both published and unpublished trials and found that L‐ornithine L‐aspartate may have a beneficial effect on mortality, hepatic encephalopathy, and serious adverse events when compared with placebo or no intervention but that the evidence was of very low quality; we found no beneficial effects of L‐ornithine L‐aspartate when compared with lactulose or rifaximin, but we found a possible beneficial effect on hepatic encephalopathy when compared with probiotics, albeit the quality of the evidence was very low.
The EASL/AASLD Practice Guidelines state, in relation to L‐ornithine L‐aspartate, that: "An RCT [randomised clinical trial] on patients with persistent HE [hepatic encephalopathy] demonstrated improvement by IV [intravenous] LOLA [L‐ornithine L‐aspartate] in psychometric testing and postprandial venous ammonia levels (Kircheis 1997). Oral supplementation with LOLA is ineffective". It recommends that "IV LOLA can be used as an alternative or additional agent to treat patients nonresponsive to conventional therapy (Evidence GRADE I, B, 2)" (EASL/AASLD 2014a; EASL/AASLD 2014b). There is no evidence base for these statements.

Study flow diagram.
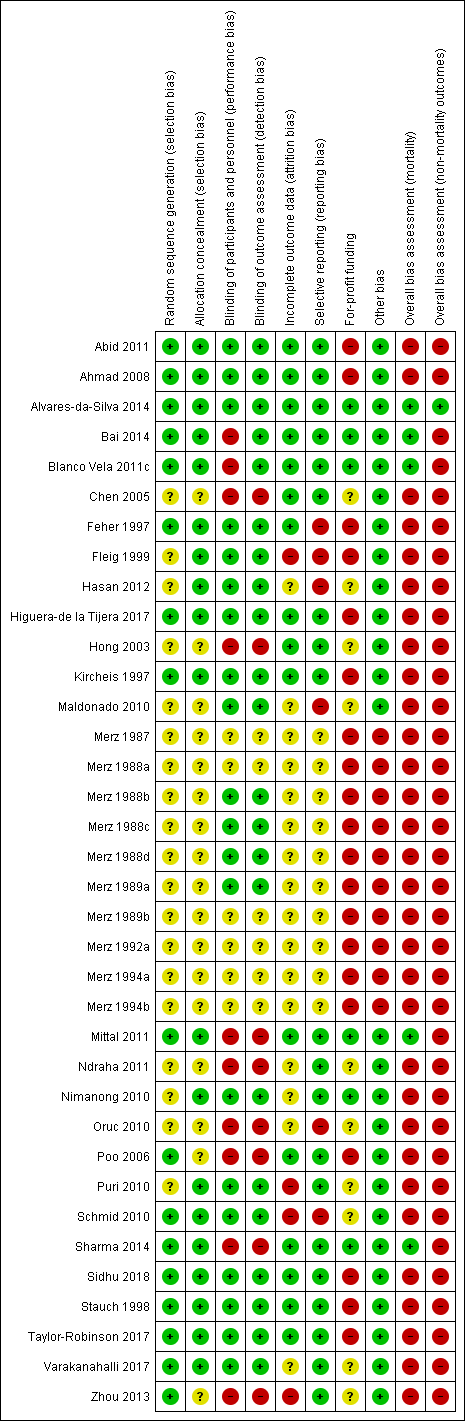
Risk of bias summary: review authors' judgements about each risk of bias item for each included study.

Funnel plot of comparison: 1 L‐ornithine L‐aspartate versus placebo/no intervention, outcome: 1.1 Mortality.

Mortality: Trial Sequential Analysis (relative risk random‐effects model) including randomised clinical trials comparing L‐ornithine L‐aspartate versus placebo or no intervention for people with cirrhosis and hepatic encephalopathy. The pair‐wise meta‐analysis included 19 trials with 1489 participants and found a risk ratio (RR) of 0.42 (95% CI 0.24 to 0.72). The figure shows the Trial Sequential Analysis made with the required information size (also known as the 'heterogeneity adjusted required information size' (DARIS)) defined as the number of participants needed to detect or reject an intervention effect based on the relative risk reduction (RRR) and assumed control risk (ACR). The analysis was made with alpha 3%, power 90%, model‐based diversity (0%), RRR 25%, and ACR 5%.

Hepatic encephalopathy: Trial Sequential Analysis of hepatic encephalopathy (relative risk random‐effects model). The analysis included randomised clinical trials comparing L‐ornithine L‐aspartate versus placebo or no intervention for people with cirrhosis and hepatic encephalopathy. The pair‐wise meta‐analysis included 1375 participants and 22 trials and found a risk ratio (RR) of 0.70 (95% CI 0.59 to 0.83). The figure shows the Trial Sequential Analysis made with the required information size (also known as the 'heterogeneity adjusted required information size' (DARIS)) defined as the number of participants needed to detect or reject an intervention effect based on the relative risk reduction (RRR) and assumed control risk (ACR). The analysis was made with alpha 3%, power 90%, model‐based diversity (78%), RRR 17%, and ACR 40%.

Serious adverse events: Trial Sequential Analysis (relative risk random‐effects model) including randomised clinical trials comparing L‐ornithine L‐aspartate versus placebo or no intervention for people with cirrhosis and hepatic encephalopathy. The pair‐wise meta‐analysis includes 19 trials with 1489 participants and found a RR of 0.63 (95% CI 0.45 to 0.90). The figure shows the Trial Sequential Analysis made with the required information size (also known as the 'heterogeneity adjusted required information size' (DARIS)) defined as the number of participants needed to detect or reject an intervention effect based on the relative risk reduction (RRR) and assumed control risk (ACR). The analysis is made with alpha 3%, power 90%, model‐based diversity (0%), RRR 25%, and ACR 10%.

Comparison 1 L‐ornithine L‐aspartate versus placebo/no intervention, Outcome 1 Mortality.

Comparison 1 L‐ornithine L‐aspartate versus placebo/no intervention, Outcome 2 Mortality, by type of hepatic encephalopathy.

Comparison 1 L‐ornithine L‐aspartate versus placebo/no intervention, Outcome 3 Mortality, by administration method.

Comparison 1 L‐ornithine L‐aspartate versus placebo/no intervention, Outcome 4 Mortality, by publication status.

Comparison 1 L‐ornithine L‐aspartate versus placebo/no intervention, Outcome 5 Hepatic encephalopathy.

Comparison 1 L‐ornithine L‐aspartate versus placebo/no intervention, Outcome 6 Hepatic encephalopathy, by type of hepatic encephalopathy.

Comparison 1 L‐ornithine L‐aspartate versus placebo/no intervention, Outcome 7 Hepatic encephalopathy, by administration method.
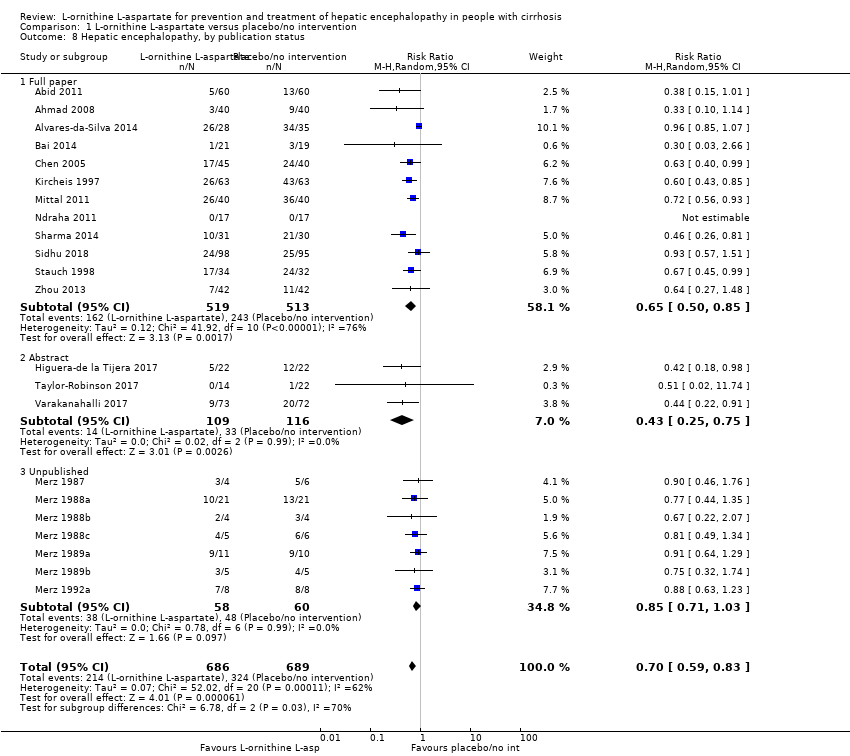
Comparison 1 L‐ornithine L‐aspartate versus placebo/no intervention, Outcome 8 Hepatic encephalopathy, by publication status.

Comparison 1 L‐ornithine L‐aspartate versus placebo/no intervention, Outcome 9 Hepatic encephalopathy, completeness status.

Comparison 1 L‐ornithine L‐aspartate versus placebo/no intervention, Outcome 10 Serious adverse events.

Comparison 1 L‐ornithine L‐aspartate versus placebo/no intervention, Outcome 11 Serious adverse events, by type of hepatic encephalopathy.

Comparison 1 L‐ornithine L‐aspartate versus placebo/no intervention, Outcome 12 Serious adverse events, by administration method.

Comparison 1 L‐ornithine L‐aspartate versus placebo/no intervention, Outcome 13 Serious adverse events, by publication status.

Comparison 1 L‐ornithine L‐aspartate versus placebo/no intervention, Outcome 14 Non‐serious adverse events.

Comparison 1 L‐ornithine L‐aspartate versus placebo/no intervention, Outcome 15 Blood ammonia concentrations.

Comparison 2 L‐ornithine L‐aspartate versus lactulose, Outcome 1 Mortality.

Comparison 2 L‐ornithine L‐aspartate versus lactulose, Outcome 2 Hepatic encephalopathy.
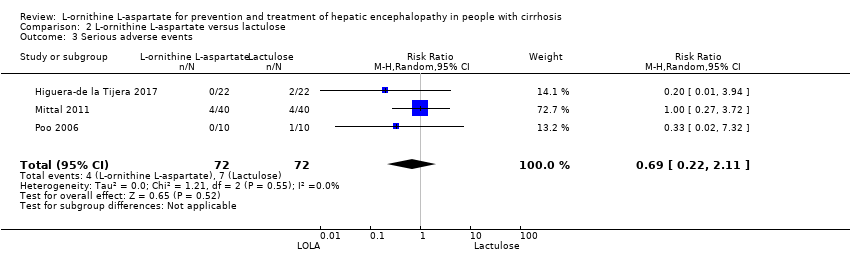
Comparison 2 L‐ornithine L‐aspartate versus lactulose, Outcome 3 Serious adverse events.

Comparison 2 L‐ornithine L‐aspartate versus lactulose, Outcome 4 Non‐serious adverse events.

Comparison 2 L‐ornithine L‐aspartate versus lactulose, Outcome 5 Blood ammonia end of treatment.

Comparison 3 L‐ornithine L‐aspartate versus probiotic, Outcome 1 Mortality.

Comparison 3 L‐ornithine L‐aspartate versus probiotic, Outcome 2 Hepatic encephalopathy.

Comparison 3 L‐ornithine L‐aspartate versus probiotic, Outcome 3 Serious adverse events.

Comparison 3 L‐ornithine L‐aspartate versus probiotic, Outcome 4 Ammonia (change from baseline).

Comparison 4 L‐ornithine L‐aspartate versus rifaximin, Outcome 1 Mortality.
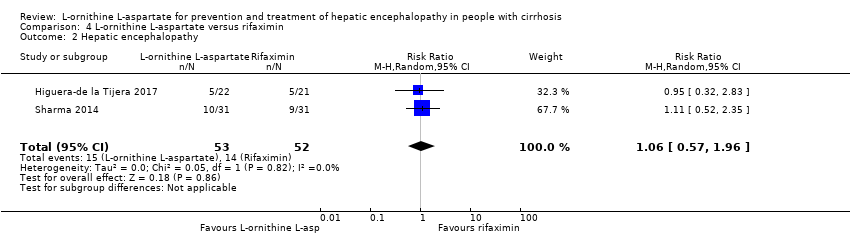
Comparison 4 L‐ornithine L‐aspartate versus rifaximin, Outcome 2 Hepatic encephalopathy.

Comparison 4 L‐ornithine L‐aspartate versus rifaximin, Outcome 3 Serious adverse events.
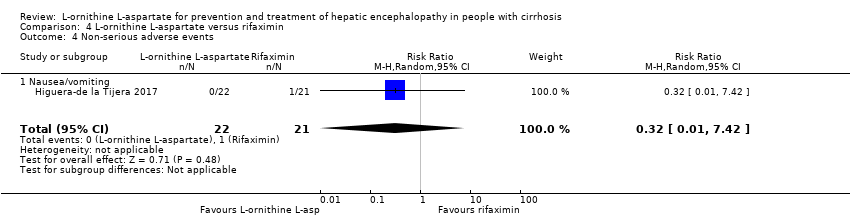
Comparison 4 L‐ornithine L‐aspartate versus rifaximin, Outcome 4 Non‐serious adverse events.
| L‐ornithine L aspartate compared to placebo or no intervention for people with cirrhosis and hepatic encephalopathy or at risk of developing hepatic encephalopathy | ||||||
| Participants: people with cirrhosis who had minimal or overt hepatic encephalopathy or who were at risk for developing hepatic encephalopathy; regardless of sex, age, aetiology, and severity of the underlying liver disease, or the presence of identified precipitating factors Setting: hospital or outpatient Intervention: L‐ornithine L‐aspartate Comparison: placebo or no intervention Outcomes: all outcomes assessed at maximum duration of follow‐up | ||||||
| Outcomes | Anticipated absolute effects* (95% CI) | Relative effect | № of participants | Quality of the evidence | Comments | |
| Risk with placebo or no intervention | Risk with L‐ornithine L aspartate | |||||
| Mortality | Study population | RR 0.42 (0.24 to 0.72) | 1489 | ⊕⊝⊝⊝ | ‐ | |
| 57 per 1000 | 24 per 1000 | |||||
| Hepatic encephalopathy assessed based on neurocognitive manifestations | Study population | RR 0.70 (0.59 to 0.83) | 1375 (22 RCTs) | ⊕⊝⊝⊝ | ‐ | |
| 470 per 1000 | 329 per 1000 | |||||
| Serious adverse events assessed using ICH‐GCP | Study population | RR 0.63 | 1489 (19 RCTs) | ⊕⊝⊝⊝ | ‐ | |
| 100 per 1000 | 63 per 1000 | |||||
| Quality of life assessed using 3 different questionnaires | 3 RCTs evaluated health‐related quality of life in participants with minimal hepatic encephalopathy. 1 found no difference between interventions based on the Liver Disease Quality of Life Assessment. 2 found a beneficial effect based on the total Sickness Impact Profile score. | (See comment) | ‐ | ⊕⊝⊝⊝ | ‐ | |
| Non‐serious adverse events assessed using ICH‐GCP | Study population | RR 1.15 | 1076 | ⊕⊝⊝⊝ | Reported non‐serious adverse events included gastrointestinal discomfort (e.g. change in bowel habits and bloating), headache, pruritus, and fatigue | |
| 128 per 1000 | 147 per 1000 | |||||
| *The risk in the intervention group (and its 95% confidence interval) is based on the assumed risk in the comparison group and the relative effect of the intervention (and its 95% CI). CHBG: Cochrane Hepato‐Biliary Group; CI: confidence interval; GCP: Good Clinical Practice; ICH: International Conference on Harmonisation; RCT: randomised clinical trial; RR: risk ratio; TSA: Trial Sequential Analysis. | ||||||
| GRADE Working Group grades of evidence | ||||||
| 1Downgraded 3 levels due risk of bias (result not confirmed in analyses of trials with a low risk of bias assessed using CHBG domains); evidence of publication bias (we were unable to gather data from unpublished trials); and imprecision (the TSA ignored the monitoring boundary). 2Downgraded 3 levels due risk of bias (result not confirmed in analyses of trials at low risk of bias assessed using CHBG domains; only 1 trial had a low risk of bias); evidence of publication bias (we were unable to gather data from unpublished trials); and inconsistency (I2 value of 63% and visual inspection of the forest plots suggested a risk of inconsistency). 3Downgraded 3 levels due risk of bias (result not confirmed in analyses of trials at low risk of bias assessed using CHBG domains; only 1 trial had a low risk of bias); evidence of publication bias (we were unable to gather data from unpublished trials); and imprecision (the TSA ignored the monitoring boundary). 4Downgraded 3 levels due to risk of bias (result not confirmed in analyses of trials at low risk of bias assessed using CHBG domains; none of the trials had a low risk of bias); evidence of publication bias (we were unable to gather data from unpublished trials); imprecision (we were only able to evaluate trials individually; trials reporting this outcome were small with wide CIs). 5Downgraded 3 levels due to risk of bias (result not confirmed in analyses of trials at low risk of bias assessed using CHBG domains; only 1 trial had a low risk of bias); evidence of publication bias (we were unable to gather data from unpublished trials); imprecision (trials reporting this outcome were small and the meta‐analysis result had wide CIs). | ||||||
| L‐ornithine L‐aspartate compared to lactulose for people with cirrhosis and hepatic encephalopathy | ||||||
| Patient or population: people with cirrhosis who had minimal or overt hepatic encephalopathy or who were at risk for developing hepatic encephalopathy; regardless of sex, age, aetiology, and severity of the underlying liver disease or the presence of identified precipitating factors Setting: hospital or outpatient Intervention: L‐ornithine L‐aspartate Comparison: lactulose Outcomes: all outcomes assessed at maximum duration of follow‐up | ||||||
| Outcomes | Anticipated absolute effects* (95% CI) | Relative effect | № of participants | Quality of the evidence | Comments | |
| Risk with lactulose | Risk with L‐ornithine L‐aspartate | |||||
| Mortality | Study population | RR 0.68 | 175 | ⊕⊝⊝⊝ | ‐ | |
| 23 per 1000 | 15 per 1000 | |||||
| Hepatic encephalopathy assessed based on neurocognitive manifestations | Study population | RR 1.13 | 175 | ⊕⊝⊝⊝ | ‐ | |
| 364 per 1000 | 411 per 1000 | |||||
| Serious adverse events assessed using ICH‐GCP | Study population | RR 0.69 | 144 | ⊕⊝⊝⊝ | ‐ | |
| 97 per 1000 | 67 per 1000 | |||||
| Quality of life assessed using questionnaires | No evidence was available for this outcome. | |||||
| Non‐serious adverse events assessed using ICH‐GCP | Study population | RR 0.05 | 292 (2 RCTs) | ⊕⊝⊝⊝ | ‐ | |
| 175 per 1000 | 12 per 1000 | |||||
| *The risk in the intervention group (and its 95% confidence interval) is based on the assumed risk in the comparison group and the relative effect of the intervention (and its 95% CI). CHBG: Cochrane Hepato‐Biliary Group; CI: confidence interval; GCP: Good Clinical Practice; ICH: International Conference on Harmonisation; RCT: randomised clinical trial; RR: risk ratio; TSA: Trial Sequential Analysis. | ||||||
| GRADE Working Group grades of evidence | ||||||
| 1Downgraded 3 levels due risk of bias (2 trials had a low risk of bias assessed using CHBG domains) and imprecision (wide CIs; small number of events/participants). We were unable to identify publication bias due to the small number of trials. 2Downgraded 3 levels due risk of bias (none of the included trials had a low risk of bias assessed using CHBG domains) and imprecision (wide CIs; small number of events/participants). We were unable to identify publication bias due to the small number of trials. | ||||||
| L‐ornithine L‐aspartate compared to probiotic for people with cirrhosis and hepatic encephalopathy | ||||||
| Patient or population: people with cirrhosis who had minimal or overt hepatic encephalopathy or who were at risk for developing hepatic encephalopathy; regardless of sex, age, aetiology, and severity of the underlying liver disease, or the presence of identified precipitating factors Setting: hospital or outpatient Intervention: L‐ornithine L‐aspartate Comparison: probiotic | ||||||
| Outcomes | Anticipated absolute effects* (95% CI) | Relative effect | № of participants | Quality of the evidence | Comments | |
| Risk with probiotic | Risk with L‐ornithine L‐aspartate | |||||
| Mortality | Study population | RR 1.01 (0.11 to 9.51) | 143 (2 RCTs) | ⊕⊝⊝⊝ | ‐ | |
| 14 per 1000 | 14 per 1000 | |||||
| Hepatic encephalopathy assessed based on neurocognitive manifestations | Study population | RR 0.71 (0.56 to 0.90) | 143 (2 RCTs) | ⊕⊝⊝⊝ | ‐ | |
| 722 per 1000 | 513 per 1000 | |||||
| Serious adverse events assessed using ICH‐GCP | Study population | RR 1.07 (0.23 to 4.88) | 143 (2 RCTs) | ⊕⊝⊝⊝ | ‐ | |
| 42 per 1000 | 45 per 1000 | |||||
| Quality of life assessed using questionnaires | No evidence available for this outcome. | |||||
| Non‐serious adverse events assessed using ICH‐GCP | No evidence available for this outcome. | |||||
| *The risk in the intervention group (and its 95% confidence interval) is based on the assumed risk in the comparison group and the relative effect of the intervention (and its 95% CI). CHBG: Cochrane Hepato‐Biliary Group; CI: confidence interval; GCP: Good Clinical Practice; ICH: International Conference on Harmonisation; RCT: randomised clinical trial; RR: risk ratio; TSA: Trial Sequential Analysis. | ||||||
| GRADE Working Group grades of evidence | ||||||
| 1Downgraded 3 levels due risk of bias (the analysis only includes 1 trial with a high risk of bias assessed using CHBG domains) and imprecision (wide CIs). We were unable to identify publication bias and did not evaluate heterogeneity because the analysis only includes 1 trial. | ||||||
| L‐ornithine L‐aspartate compared to rifaximin for people with cirrhosis and hepatic encephalopathy | ||||||
| Patient or population: people with cirrhosis who had minimal or overt hepatic encephalopathy or who were at risk for developing hepatic encephalopathy; regardless of sex, age, aetiology, and severity of the underlying liver disease, or the presence of identified precipitating factors Setting: hospital or outpatient Intervention: L‐ornithine L‐aspartate Comparison: rifaximin Outcomes: all outcomes assessed at maximum duration of follow‐up | ||||||
| Outcomes | Anticipated absolute effects* (95% CI) | Relative effect | № of participants | Quality of the evidence | Comments | |
| Risk with rifaximin | Risk with L‐ornithine L‐aspartate | |||||
| Mortality | Study population | RR 0.33 | 105 | ⊕⊝⊝⊝ | ‐ | |
| 38 per 1000 | 13 per 1000 | |||||
| Hepatic encephalopathy assessed based on neurocognitive manifestations | Study population | RR 1.06 | 105 | ⊕⊝⊝⊝ | ‐ | |
| 269 per 1000 | 285 per 1000 | |||||
| Serious adverse events assessed using ICH‐GCP | Study population | RR 0.32 | 43 | ⊕⊝⊝⊝ | ‐ | |
| 48 per 1000 | 15 per 1000 | |||||
| Quality of life assessed using questionnaires | No evidence was available for this outcome. | |||||
| Non‐serious adverse events assessed using ICH‐GCP | Study population | RR 0.32 | 43 | ⊕⊝⊝⊝ | ‐ | |
| 48 per 1000 | 15 per 1000 | |||||
| *The risk in the intervention group (and its 95% confidence interval) is based on the assumed risk in the comparison group and the relative effect of the intervention (and its 95% CI). CHBG: Cochrane Hepato‐Biliary Group; CI: confidence interval; GCP: Good Clinical Practice; ICH: International Conference on Harmonisation; RCT: randomised clinical trial; RR: risk ratio; TSA: Trial Sequential Analysis. | ||||||
| GRADE Working Group grades of evidence | ||||||
| 1Downgraded 3 levels due risk of bias (1 of the included trials had a low risk of bias assessed using CHBG domains) and imprecision (wide CIs; small number of events/participants). We were unable to identify publication bias due to the small number of trials. 2Downgraded 3 levels due risk of bias (the included trial had a high risk of bias assessed using CHBG domains) and imprecision (wide CIs; small number of events/participants). We were unable to identify publication bias due to the small number of trials. | ||||||
| Study and date | Definition of hepatic encephalopathy | Assessment of neuropsychiatric status | |
| Study material (publication) | EASL/AASLD guideline | ||
| Minimal | Minimal |
| |
| Acute: Grade I to IV | Episodic | ||
| Acute: Grade I to III | Episodic |
| |
| Minimal | Minimal |
| |
| Unimpaired | Unimpaired |
| |
| Acute: Grade III or IV | Overt |
| |
| Acute: Grade I to IV | Episodic |
| |
| Feher 19971,2 | Unimpaired | Unimpaired |
|
| Minimal | Minimal |
| |
| Chronic Grade I or II | Persistent | ||
| Minimal | Minimal |
| |
| Chronic: Grade I or II | Persistent | ||
| Unimpaired | Unimpaired |
| |
| Minimal | Minimal |
| |
| Minimal | Minimal |
| |
| Chronic: Grade I or II | Persistent | ||
| Minimal | Minimal |
| |
| Minimal | Minimal |
| |
| Overt | Unclear | ||
| Minimal | Minimal |
| |
| Overt | Unclear | ||
| Minimal | Minimal |
| |
| Acute | Episodic | ||
| Minimal | Minimal |
| |
| Overt | Unclear | ||
| Unknown | Unknown |
| |
| Minimal | Minimal |
| |
| Overt | Unclear | ||
| Minimal | Minimal |
| |
| Overt | Unclear | ||
| Minimal | Minimal |
| |
| Overt | Unclear | ||
| Minimal | Minimal |
| |
| Overt | Unclear | ||
| Minimal | Minimal |
| |
| Overt | Unclear | ||
| Minimal | Minimal |
| |
| Minimal | Minimal |
| |
| Acute: Grade II or III | Episodic |
| |
| Acute | Episodic |
| |
| Chronic persistent: Grade I or II | Persistent |
| |
| Minimal | Minimal |
| |
| Minimal Chronic: Grade I or II | Minimal |
| |
| Chronic: Grade I or II | Persistent | ||
| Minimal | Minimal |
| |
| Acute: Grade II to IV | Episodic |
| |
| Minimal | Minimal |
| |
| Chronic: Grade I or II | Persistent | ||
| Unimpaired | Unimpaired |
| |
| Minimal | Minimal | ||
| Unimpaired | Unimpaired |
| |
| Acute | Episodic |
| |
| AASLD: American Association for the Study of Liver Diseases; EASL: European Association for the Study of the Liver. 1Trials of L‐ornithine L‐aspartate used for primary prevention. 2Not included in the analysis of hepatic encephalopathy versus placebo or non‐intervention. 3Portal‐systemic encephalopathy (PSE) sum and index (Conn 1977), which is calculated using 5 variables: mental status, presence and severity of asterixis; Number Connection Test‐A time, blood ammonia concentration, and the electroencephalogram mean dominant frequency. Each variable is assigned a score of 0 (no abnormality) to 4 (severe abnormality); mental status is weighted by a factor of three; PSE index calculated as the ratio of the points scored and the maximum possible score of 28. 4Trial of L‐ornithine L‐aspartate used for secondary prevention. | |||
| Outcome or subgroup title | No. of studies | No. of participants | Statistical method | Effect size |
| 1 Mortality Show forest plot | 19 | 1489 | Risk Ratio (M‐H, Random, 95% CI) | 0.42 [0.24, 0.72] |
| 1.1 Low risk of bias | 4 | 244 | Risk Ratio (M‐H, Random, 95% CI) | 0.47 [0.06, 3.58] |
| 1.2 High risk of bias | 15 | 1245 | Risk Ratio (M‐H, Random, 95% CI) | 0.41 [0.23, 0.72] |
| 2 Mortality, by type of hepatic encephalopathy Show forest plot | 19 | 1489 | Risk Ratio (M‐H, Random, 95% CI) | 0.59 [0.39, 0.88] |
| 2.1 Acute | 6 | 597 | Risk Ratio (M‐H, Random, 95% CI) | 0.64 [0.40, 1.01] |
| 2.2 Chronic | 2 | 116 | Risk Ratio (M‐H, Random, 95% CI) | 0.0 [0.0, 0.0] |
| 2.3 Minimal | 9 | 438 | Risk Ratio (M‐H, Random, 95% CI) | 0.36 [0.07, 1.94] |
| 2.4 Prevention | 5 | 338 | Risk Ratio (M‐H, Random, 95% CI) | 0.48 [0.18, 1.26] |
| 3 Mortality, by administration method Show forest plot | 19 | 1489 | Risk Ratio (M‐H, Random, 95% CI) | 0.59 [0.39, 0.88] |
| 3.1 Intravenous infusion | 8 | 808 | Risk Ratio (M‐H, Random, 95% CI) | 0.63 [0.40, 0.99] |
| 3.2 Oral | 11 | 681 | Risk Ratio (M‐H, Random, 95% CI) | 0.45 [0.19, 1.09] |
| 4 Mortality, by publication status Show forest plot | 19 | 1489 | Risk Ratio (M‐H, Random, 95% CI) | 0.42 [0.24, 0.72] |
| 4.1 Full paper | 14 | 1151 | Risk Ratio (M‐H, Random, 95% CI) | 0.40 [0.21, 0.78] |
| 4.2 Abstract | 5 | 338 | Risk Ratio (M‐H, Random, 95% CI) | 0.45 [0.17, 1.18] |
| 5 Hepatic encephalopathy Show forest plot | 22 | 1375 | Risk Ratio (M‐H, Random, 95% CI) | 0.70 [0.59, 0.83] |
| 5.1 Low risk of bias | 1 | 63 | Risk Ratio (M‐H, Random, 95% CI) | 0.96 [0.85, 1.07] |
| 5.2 High risk of bias | 21 | 1312 | Risk Ratio (M‐H, Random, 95% CI) | 0.71 [0.63, 0.79] |
| 6 Hepatic encephalopathy, by type of hepatic encephalopathy Show forest plot | 15 | 1255 | Risk Ratio (M‐H, Random, 95% CI) | 0.63 [0.50, 0.81] |
| 6.1 Acute | 5 | 550 | Risk Ratio (M‐H, Random, 95% CI) | 0.69 [0.51, 0.91] |
| 6.2 Chronic | 2 | 116 | Risk Ratio (M‐H, Random, 95% CI) | 0.44 [0.28, 0.71] |
| 6.3 Minimal | 7 | 299 | Risk Ratio (M‐H, Random, 95% CI) | 0.78 [0.60, 1.02] |
| 6.4 Prevention | 5 | 290 | Risk Ratio (M‐H, Random, 95% CI) | 0.42 [0.25, 0.72] |
| 7 Hepatic encephalopathy, by administration method Show forest plot | 22 | 1375 | Risk Ratio (M‐H, Random, 95% CI) | 0.70 [0.59, 0.83] |
| 7.1 Intravenous infusion | 11 | 784 | Risk Ratio (M‐H, Random, 95% CI) | 0.74 [0.62, 0.88] |
| 7.2 Oral | 11 | 591 | Risk Ratio (M‐H, Random, 95% CI) | 0.68 [0.50, 0.91] |
| 8 Hepatic encephalopathy, by publication status Show forest plot | 22 | 1375 | Risk Ratio (M‐H, Random, 95% CI) | 0.70 [0.59, 0.83] |
| 8.1 Full paper | 12 | 1032 | Risk Ratio (M‐H, Random, 95% CI) | 0.65 [0.50, 0.85] |
| 8.2 Abstract | 3 | 225 | Risk Ratio (M‐H, Random, 95% CI) | 0.43 [0.25, 0.75] |
| 8.3 Unpublished | 7 | 118 | Risk Ratio (M‐H, Random, 95% CI) | 0.85 [0.71, 1.03] |
| 9 Hepatic encephalopathy, completeness status Show forest plot | 22 | 1375 | Risk Ratio (M‐H, Random, 95% CI) | 0.70 [0.59, 0.83] |
| 9.1 Complete data | 12 | 994 | Risk Ratio (M‐H, Random, 95% CI) | 0.63 [0.48, 0.83] |
| 9.2 Incomplete data | 10 | 381 | Risk Ratio (M‐H, Random, 95% CI) | 0.81 [0.68, 0.97] |
| 10 Serious adverse events Show forest plot | 19 | 1489 | Risk Ratio (M‐H, Random, 95% CI) | 0.63 [0.45, 0.90] |
| 10.1 Low risk of bias | 1 | 63 | Risk Ratio (M‐H, Random, 95% CI) | 0.83 [0.15, 4.65] |
| 10.2 High risk of bias | 18 | 1426 | Risk Ratio (M‐H, Random, 95% CI) | 0.63 [0.44, 0.89] |
| 11 Serious adverse events, by type of hepatic encephalopathy Show forest plot | 17 | 1283 | Risk Ratio (M‐H, Random, 95% CI) | 0.67 [0.46, 0.97] |
| 11.1 Acute overt | 6 | 597 | Risk Ratio (M‐H, Random, 95% CI) | 0.65 [0.43, 1.00] |
| 11.2 Chronic | 2 | 192 | Risk Ratio (M‐H, Random, 95% CI) | 2.0 [0.19, 21.50] |
| 11.3 Minimal | 5 | 296 | Risk Ratio (M‐H, Random, 95% CI) | 0.57 [0.24, 1.38] |
| 11.4 Prevention | 4 | 198 | Risk Ratio (M‐H, Random, 95% CI) | 0.97 [0.17, 5.47] |
| 12 Serious adverse events, by administration method Show forest plot | 17 | 1283 | Risk Ratio (M‐H, Random, 95% CI) | 0.67 [0.46, 0.97] |
| 12.1 Intravenous infusion | 8 | 808 | Risk Ratio (M‐H, Random, 95% CI) | 0.70 [0.46, 1.05] |
| 12.2 Oral | 9 | 475 | Risk Ratio (M‐H, Random, 95% CI) | 0.55 [0.23, 1.29] |
| 13 Serious adverse events, by publication status Show forest plot | 17 | 1283 | Risk Ratio (M‐H, Random, 95% CI) | 0.67 [0.46, 0.97] |
| 13.1 Full paper | 13 | 1090 | Risk Ratio (M‐H, Random, 95% CI) | 0.70 [0.48, 1.02] |
| 13.2 Abstract | 4 | 193 | Risk Ratio (M‐H, Random, 95% CI) | 0.23 [0.04, 1.34] |
| 14 Non‐serious adverse events Show forest plot | 20 | 3158 | Risk Ratio (M‐H, Random, 95% CI) | 1.17 [0.91, 1.51] |
| 14.1 Overall | 14 | 1076 | Risk Ratio (M‐H, Random, 95% CI) | 1.15 [0.75, 1.77] |
| 14.2 Diarrhoea | 4 | 379 | Risk Ratio (M‐H, Random, 95% CI) | 1.32 [0.07, 24.18] |
| 14.3 Flatulence | 2 | 229 | Risk Ratio (M‐H, Random, 95% CI) | 1.60 [0.49, 5.18] |
| 14.4 Nausea/vomiting | 10 | 639 | Risk Ratio (M‐H, Random, 95% CI) | 2.26 [1.25, 4.10] |
| 14.5 Headaches | 1 | 36 | Risk Ratio (M‐H, Random, 95% CI) | 7.67 [0.39, 148.82] |
| 14.6 Abdominal pain | 3 | 318 | Risk Ratio (M‐H, Random, 95% CI) | 0.63 [0.23, 1.69] |
| 14.7 Fever | 2 | 233 | Risk Ratio (M‐H, Random, 95% CI) | 1.72 [0.12, 23.62] |
| 14.8 Gastrointestinal | 1 | 80 | Risk Ratio (M‐H, Random, 95% CI) | 0.89 [0.55, 1.45] |
| 14.9 Pruritus | 1 | 80 | Risk Ratio (M‐H, Random, 95% CI) | 0.6 [0.30, 1.21] |
| 14.10 Fatigue | 2 | 88 | Risk Ratio (M‐H, Random, 95% CI) | 0.83 [0.58, 1.18] |
| 15 Blood ammonia concentrations Show forest plot | 21 | Mean Difference (IV, Random, 95% CI) | Subtotals only | |
| 15.1 End of treatment | 13 | 868 | Mean Difference (IV, Random, 95% CI) | ‐18.52 [‐33.63, ‐3.41] |
| 15.2 Change from baseline | 13 | 738 | Mean Difference (IV, Random, 95% CI) | ‐12.94 [‐20.04, ‐5.83] |
| Outcome or subgroup title | No. of studies | No. of participants | Statistical method | Effect size |
| 1 Mortality Show forest plot | 4 | 175 | Risk Ratio (M‐H, Random, 95% CI) | 0.68 [0.11, 4.17] |
| 1.1 Low risk of bias | 2 | 111 | Risk Ratio (M‐H, Random, 95% CI) | 3.0 [0.13, 71.51] |
| 1.2 High risk of bias | 2 | 64 | Risk Ratio (M‐H, Random, 95% CI) | 0.33 [0.04, 3.02] |
| 2 Hepatic encephalopathy Show forest plot | 4 | 175 | Risk Ratio (M‐H, Random, 95% CI) | 1.13 [0.81, 1.57] |
| 3 Serious adverse events Show forest plot | 3 | 144 | Risk Ratio (M‐H, Random, 95% CI) | 0.69 [0.22, 2.11] |
| 4 Non‐serious adverse events Show forest plot | 2 | 292 | Risk Ratio (M‐H, Random, 95% CI) | 0.05 [0.01, 0.18] |
| 4.1 Overall | 1 | 80 | Risk Ratio (M‐H, Random, 95% CI) | 0.07 [0.00, 1.13] |
| 4.2 Diarrhoea | 1 | 44 | Risk Ratio (M‐H, Random, 95% CI) | 0.03 [0.00, 0.54] |
| 4.3 Bloating | 1 | 44 | Risk Ratio (M‐H, Random, 95% CI) | 0.05 [0.00, 0.77] |
| 4.4 Flatulence | 1 | 44 | Risk Ratio (M‐H, Random, 95% CI) | 0.05 [0.00, 0.77] |
| 4.5 Abdominal pain/discomfort | 1 | 80 | Risk Ratio (M‐H, Random, 95% CI) | 0.07 [0.00, 1.13] |
| 5 Blood ammonia end of treatment Show forest plot | 3 | Mean Difference (IV, Fixed, 95% CI) | Subtotals only | |
| 5.1 End of treatment | 2 | 51 | Mean Difference (IV, Fixed, 95% CI) | ‐3.26 [‐10.60, 4.09] |
| 5.2 Change from baseline | 1 | 80 | Mean Difference (IV, Fixed, 95% CI) | ‐1.14 [‐4.54, 2.26] |
| Outcome or subgroup title | No. of studies | No. of participants | Statistical method | Effect size |
| 1 Mortality Show forest plot | 2 | 143 | Risk Ratio (M‐H, Random, 95% CI) | 1.01 [0.11, 9.51] |
| 2 Hepatic encephalopathy Show forest plot | 2 | 143 | Risk Ratio (M‐H, Random, 95% CI) | 0.71 [0.56, 0.90] |
| 3 Serious adverse events Show forest plot | 2 | 143 | Risk Ratio (M‐H, Random, 95% CI) | 1.07 [0.23, 4.88] |
| 4 Ammonia (change from baseline) Show forest plot | 1 | Mean Difference (IV, Random, 95% CI) | Subtotals only | |
| Outcome or subgroup title | No. of studies | No. of participants | Statistical method | Effect size |
| 1 Mortality Show forest plot | 2 | 105 | Risk Ratio (M‐H, Random, 95% CI) | 0.33 [0.04, 3.03] |
| 2 Hepatic encephalopathy Show forest plot | 2 | 105 | Risk Ratio (M‐H, Random, 95% CI) | 1.06 [0.57, 1.96] |
| 3 Serious adverse events Show forest plot | 1 | 43 | Risk Ratio (M‐H, Random, 95% CI) | 0.32 [0.01, 7.42] |
| 4 Non‐serious adverse events Show forest plot | 1 | 43 | Risk Ratio (M‐H, Random, 95% CI) | 0.32 [0.01, 7.42] |
| 4.1 Nausea/vomiting | 1 | 43 | Risk Ratio (M‐H, Random, 95% CI) | 0.32 [0.01, 7.42] |