Scolaris Content Display Scolaris Content Display

Study flow diagram.
Figuras y tablas -
Figure 1

Study flow diagram.

Risk of bias summary: review authors' judgements about each risk of bias item for each included study.
Figuras y tablas -
Figure 2

Risk of bias summary: review authors' judgements about each risk of bias item for each included study.

Funnel plot of comparison: 1 L‐ornithine L‐aspartate versus placebo/no intervention, outcome: 1.1 Mortality.
Figuras y tablas -
Figure 3

Funnel plot of comparison: 1 L‐ornithine L‐aspartate versus placebo/no intervention, outcome: 1.1 Mortality.

Mortality: Trial Sequential Analysis (relative risk random‐effects model) including randomised clinical trials comparing L‐ornithine L‐aspartate versus placebo or no intervention for people with cirrhosis and hepatic encephalopathy. The pair‐wise meta‐analysis included 19 trials with 1489 participants and found a risk ratio (RR) of 0.42 (95% CI 0.24 to 0.72). The figure shows the Trial Sequential Analysis made with the required information size (also known as the 'heterogeneity adjusted required information size' (DARIS)) defined as the number of participants needed to detect or reject an intervention effect based on the relative risk reduction (RRR) and assumed control risk (ACR). The analysis was made with alpha 3%, power 90%, model‐based diversity (0%), RRR 25%, and ACR 5%.
Figuras y tablas -
Figure 4

Mortality: Trial Sequential Analysis (relative risk random‐effects model) including randomised clinical trials comparing L‐ornithine L‐aspartate versus placebo or no intervention for people with cirrhosis and hepatic encephalopathy. The pair‐wise meta‐analysis included 19 trials with 1489 participants and found a risk ratio (RR) of 0.42 (95% CI 0.24 to 0.72). The figure shows the Trial Sequential Analysis made with the required information size (also known as the 'heterogeneity adjusted required information size' (DARIS)) defined as the number of participants needed to detect or reject an intervention effect based on the relative risk reduction (RRR) and assumed control risk (ACR). The analysis was made with alpha 3%, power 90%, model‐based diversity (0%), RRR 25%, and ACR 5%.

Hepatic encephalopathy: Trial Sequential Analysis of hepatic encephalopathy (relative risk random‐effects model). The analysis included randomised clinical trials comparing L‐ornithine L‐aspartate versus placebo or no intervention for people with cirrhosis and hepatic encephalopathy. The pair‐wise meta‐analysis included 1375 participants and 22 trials and found a risk ratio (RR) of 0.70 (95% CI 0.59 to 0.83). The figure shows the Trial Sequential Analysis made with the required information size (also known as the 'heterogeneity adjusted required information size' (DARIS)) defined as the number of participants needed to detect or reject an intervention effect based on the relative risk reduction (RRR) and assumed control risk (ACR). The analysis was made with alpha 3%, power 90%, model‐based diversity (78%), RRR 17%, and ACR 40%.
Figuras y tablas -
Figure 5

Hepatic encephalopathy: Trial Sequential Analysis of hepatic encephalopathy (relative risk random‐effects model). The analysis included randomised clinical trials comparing L‐ornithine L‐aspartate versus placebo or no intervention for people with cirrhosis and hepatic encephalopathy. The pair‐wise meta‐analysis included 1375 participants and 22 trials and found a risk ratio (RR) of 0.70 (95% CI 0.59 to 0.83). The figure shows the Trial Sequential Analysis made with the required information size (also known as the 'heterogeneity adjusted required information size' (DARIS)) defined as the number of participants needed to detect or reject an intervention effect based on the relative risk reduction (RRR) and assumed control risk (ACR). The analysis was made with alpha 3%, power 90%, model‐based diversity (78%), RRR 17%, and ACR 40%.

Serious adverse events: Trial Sequential Analysis (relative risk random‐effects model) including randomised clinical trials comparing L‐ornithine L‐aspartate versus placebo or no intervention for people with cirrhosis and hepatic encephalopathy. The pair‐wise meta‐analysis includes 19 trials with 1489 participants and found a RR of 0.63 (95% CI 0.45 to 0.90). The figure shows the Trial Sequential Analysis made with the required information size (also known as the 'heterogeneity adjusted required information size' (DARIS)) defined as the number of participants needed to detect or reject an intervention effect based on the relative risk reduction (RRR) and assumed control risk (ACR). The analysis is made with alpha 3%, power 90%, model‐based diversity (0%), RRR 25%, and ACR 10%.
Figuras y tablas -
Figure 6

Serious adverse events: Trial Sequential Analysis (relative risk random‐effects model) including randomised clinical trials comparing L‐ornithine L‐aspartate versus placebo or no intervention for people with cirrhosis and hepatic encephalopathy. The pair‐wise meta‐analysis includes 19 trials with 1489 participants and found a RR of 0.63 (95% CI 0.45 to 0.90). The figure shows the Trial Sequential Analysis made with the required information size (also known as the 'heterogeneity adjusted required information size' (DARIS)) defined as the number of participants needed to detect or reject an intervention effect based on the relative risk reduction (RRR) and assumed control risk (ACR). The analysis is made with alpha 3%, power 90%, model‐based diversity (0%), RRR 25%, and ACR 10%.

Comparison 1 L‐ornithine L‐aspartate versus placebo/no intervention, Outcome 1 Mortality.
Figuras y tablas -
Analysis 1.1

Comparison 1 L‐ornithine L‐aspartate versus placebo/no intervention, Outcome 1 Mortality.

Comparison 1 L‐ornithine L‐aspartate versus placebo/no intervention, Outcome 2 Mortality, by type of hepatic encephalopathy.
Figuras y tablas -
Analysis 1.2

Comparison 1 L‐ornithine L‐aspartate versus placebo/no intervention, Outcome 2 Mortality, by type of hepatic encephalopathy.

Comparison 1 L‐ornithine L‐aspartate versus placebo/no intervention, Outcome 3 Mortality, by administration method.
Figuras y tablas -
Analysis 1.3

Comparison 1 L‐ornithine L‐aspartate versus placebo/no intervention, Outcome 3 Mortality, by administration method.

Comparison 1 L‐ornithine L‐aspartate versus placebo/no intervention, Outcome 4 Mortality, by publication status.
Figuras y tablas -
Analysis 1.4

Comparison 1 L‐ornithine L‐aspartate versus placebo/no intervention, Outcome 4 Mortality, by publication status.

Comparison 1 L‐ornithine L‐aspartate versus placebo/no intervention, Outcome 5 Hepatic encephalopathy.
Figuras y tablas -
Analysis 1.5

Comparison 1 L‐ornithine L‐aspartate versus placebo/no intervention, Outcome 5 Hepatic encephalopathy.

Comparison 1 L‐ornithine L‐aspartate versus placebo/no intervention, Outcome 6 Hepatic encephalopathy, by type of hepatic encephalopathy.
Figuras y tablas -
Analysis 1.6

Comparison 1 L‐ornithine L‐aspartate versus placebo/no intervention, Outcome 6 Hepatic encephalopathy, by type of hepatic encephalopathy.

Comparison 1 L‐ornithine L‐aspartate versus placebo/no intervention, Outcome 7 Hepatic encephalopathy, by administration method.
Figuras y tablas -
Analysis 1.7

Comparison 1 L‐ornithine L‐aspartate versus placebo/no intervention, Outcome 7 Hepatic encephalopathy, by administration method.

Comparison 1 L‐ornithine L‐aspartate versus placebo/no intervention, Outcome 8 Hepatic encephalopathy, by publication status.
Figuras y tablas -
Analysis 1.8

Comparison 1 L‐ornithine L‐aspartate versus placebo/no intervention, Outcome 8 Hepatic encephalopathy, by publication status.

Comparison 1 L‐ornithine L‐aspartate versus placebo/no intervention, Outcome 9 Hepatic encephalopathy, completeness status.
Figuras y tablas -
Analysis 1.9

Comparison 1 L‐ornithine L‐aspartate versus placebo/no intervention, Outcome 9 Hepatic encephalopathy, completeness status.

Comparison 1 L‐ornithine L‐aspartate versus placebo/no intervention, Outcome 10 Serious adverse events.
Figuras y tablas -
Analysis 1.10

Comparison 1 L‐ornithine L‐aspartate versus placebo/no intervention, Outcome 10 Serious adverse events.

Comparison 1 L‐ornithine L‐aspartate versus placebo/no intervention, Outcome 11 Serious adverse events, by type of hepatic encephalopathy.
Figuras y tablas -
Analysis 1.11

Comparison 1 L‐ornithine L‐aspartate versus placebo/no intervention, Outcome 11 Serious adverse events, by type of hepatic encephalopathy.

Comparison 1 L‐ornithine L‐aspartate versus placebo/no intervention, Outcome 12 Serious adverse events, by administration method.
Figuras y tablas -
Analysis 1.12

Comparison 1 L‐ornithine L‐aspartate versus placebo/no intervention, Outcome 12 Serious adverse events, by administration method.

Comparison 1 L‐ornithine L‐aspartate versus placebo/no intervention, Outcome 13 Serious adverse events, by publication status.
Figuras y tablas -
Analysis 1.13

Comparison 1 L‐ornithine L‐aspartate versus placebo/no intervention, Outcome 13 Serious adverse events, by publication status.

Comparison 1 L‐ornithine L‐aspartate versus placebo/no intervention, Outcome 14 Non‐serious adverse events.
Figuras y tablas -
Analysis 1.14

Comparison 1 L‐ornithine L‐aspartate versus placebo/no intervention, Outcome 14 Non‐serious adverse events.

Comparison 1 L‐ornithine L‐aspartate versus placebo/no intervention, Outcome 15 Blood ammonia concentrations.
Figuras y tablas -
Analysis 1.15

Comparison 1 L‐ornithine L‐aspartate versus placebo/no intervention, Outcome 15 Blood ammonia concentrations.

Comparison 2 L‐ornithine L‐aspartate versus lactulose, Outcome 1 Mortality.
Figuras y tablas -
Analysis 2.1

Comparison 2 L‐ornithine L‐aspartate versus lactulose, Outcome 1 Mortality.

Comparison 2 L‐ornithine L‐aspartate versus lactulose, Outcome 2 Hepatic encephalopathy.
Figuras y tablas -
Analysis 2.2

Comparison 2 L‐ornithine L‐aspartate versus lactulose, Outcome 2 Hepatic encephalopathy.

Comparison 2 L‐ornithine L‐aspartate versus lactulose, Outcome 3 Serious adverse events.
Figuras y tablas -
Analysis 2.3

Comparison 2 L‐ornithine L‐aspartate versus lactulose, Outcome 3 Serious adverse events.

Comparison 2 L‐ornithine L‐aspartate versus lactulose, Outcome 4 Non‐serious adverse events.
Figuras y tablas -
Analysis 2.4

Comparison 2 L‐ornithine L‐aspartate versus lactulose, Outcome 4 Non‐serious adverse events.

Comparison 2 L‐ornithine L‐aspartate versus lactulose, Outcome 5 Blood ammonia end of treatment.
Figuras y tablas -
Analysis 2.5

Comparison 2 L‐ornithine L‐aspartate versus lactulose, Outcome 5 Blood ammonia end of treatment.

Comparison 3 L‐ornithine L‐aspartate versus probiotic, Outcome 1 Mortality.
Figuras y tablas -
Analysis 3.1

Comparison 3 L‐ornithine L‐aspartate versus probiotic, Outcome 1 Mortality.

Comparison 3 L‐ornithine L‐aspartate versus probiotic, Outcome 2 Hepatic encephalopathy.
Figuras y tablas -
Analysis 3.2

Comparison 3 L‐ornithine L‐aspartate versus probiotic, Outcome 2 Hepatic encephalopathy.

Comparison 3 L‐ornithine L‐aspartate versus probiotic, Outcome 3 Serious adverse events.
Figuras y tablas -
Analysis 3.3

Comparison 3 L‐ornithine L‐aspartate versus probiotic, Outcome 3 Serious adverse events.

Comparison 3 L‐ornithine L‐aspartate versus probiotic, Outcome 4 Ammonia (change from baseline).
Figuras y tablas -
Analysis 3.4

Comparison 3 L‐ornithine L‐aspartate versus probiotic, Outcome 4 Ammonia (change from baseline).

Comparison 4 L‐ornithine L‐aspartate versus rifaximin, Outcome 1 Mortality.
Figuras y tablas -
Analysis 4.1

Comparison 4 L‐ornithine L‐aspartate versus rifaximin, Outcome 1 Mortality.

Comparison 4 L‐ornithine L‐aspartate versus rifaximin, Outcome 2 Hepatic encephalopathy.
Figuras y tablas -
Analysis 4.2

Comparison 4 L‐ornithine L‐aspartate versus rifaximin, Outcome 2 Hepatic encephalopathy.

Comparison 4 L‐ornithine L‐aspartate versus rifaximin, Outcome 3 Serious adverse events.
Figuras y tablas -
Analysis 4.3

Comparison 4 L‐ornithine L‐aspartate versus rifaximin, Outcome 3 Serious adverse events.

Comparison 4 L‐ornithine L‐aspartate versus rifaximin, Outcome 4 Non‐serious adverse events.
Figuras y tablas -
Analysis 4.4

Comparison 4 L‐ornithine L‐aspartate versus rifaximin, Outcome 4 Non‐serious adverse events.

Summary of findings for the main comparison. L‐ornithine L aspartate compared to placebo or no intervention for people with cirrhosis and hepatic encephalopathy

L‐ornithine L aspartate compared to placebo or no intervention for people with cirrhosis and hepatic encephalopathy or at risk of developing hepatic encephalopathy

Participants: people with cirrhosis who had minimal or overt hepatic encephalopathy or who were at risk for developing hepatic encephalopathy; regardless of sex, age, aetiology, and severity of the underlying liver disease, or the presence of identified precipitating factors

Setting: hospital or outpatient

Intervention: L‐ornithine L‐aspartate

Comparison: placebo or no intervention

Outcomes: all outcomes assessed at maximum duration of follow‐up

Outcomes

Anticipated absolute effects* (95% CI)

Relative effect
(95% CI)

№ of participants
(studies)

Quality of the evidence
(GRADE)

Comments

Risk with placebo or no intervention

Risk with L‐ornithine L aspartate

Mortality

Study population

RR 0.42 (0.24 to 0.72)

1489
(19 RCTs)

⊕⊝⊝⊝
Very low1

57 per 1000

24 per 1000
(14 to 41)

Hepatic encephalopathy

assessed based on neurocognitive manifestations

Study population

RR 0.70 (0.59 to 0.83)

1375

(22 RCTs)

⊕⊝⊝⊝
Very low2

470 per 1000

329 per 1000
(277 to 390)

Serious adverse events

assessed using ICH‐GCP

Study population

RR 0.63
(0.45 to 0.90)

1489

(19 RCTs)

⊕⊝⊝⊝
Very low3

100 per 1000

63 per 1000
(45 to 90)

Quality of life

assessed using 3 different questionnaires

3 RCTs evaluated health‐related quality of life in participants with minimal hepatic encephalopathy. 1 found no difference between interventions based on the Liver Disease Quality of Life Assessment. 2 found a beneficial effect based on the total Sickness Impact Profile score.

(See comment)

⊕⊝⊝⊝
Very low4

Non‐serious adverse events

assessed using ICH‐GCP

Study population

RR 1.15
(0.75 to 1.77)

1076
(14 RCTs)

⊕⊝⊝⊝
Very low5

Reported non‐serious adverse events included gastrointestinal discomfort (e.g. change in bowel habits and bloating), headache, pruritus, and fatigue

128 per 1000

147 per 1000
(96 to 226)

*The risk in the intervention group (and its 95% confidence interval) is based on the assumed risk in the comparison group and the relative effect of the intervention (and its 95% CI).

CHBG: Cochrane Hepato‐Biliary Group; CI: confidence interval; GCP: Good Clinical Practice; ICH: International Conference on Harmonisation; RCT: randomised clinical trial; RR: risk ratio; TSA: Trial Sequential Analysis.

GRADE Working Group grades of evidence
High quality: We are very confident that the true effect lies close to that of the estimate of the effect
Moderate quality: We are moderately confident in the effect estimate: The true effect is likely to be close to the estimate of the effect, but there is a possibility that it is substantially different
Low quality: Our confidence in the effect estimate is limited: The true effect may be substantially different from the estimate of the effect
Very low quality: We have very little confidence in the effect estimate: The true effect is likely to be substantially different from the estimate of effect

1Downgraded 3 levels due risk of bias (result not confirmed in analyses of trials with a low risk of bias assessed using CHBG domains); evidence of publication bias (we were unable to gather data from unpublished trials); and imprecision (the TSA ignored the monitoring boundary).

2Downgraded 3 levels due risk of bias (result not confirmed in analyses of trials at low risk of bias assessed using CHBG domains; only 1 trial had a low risk of bias); evidence of publication bias (we were unable to gather data from unpublished trials); and inconsistency (I2 value of 63% and visual inspection of the forest plots suggested a risk of inconsistency).

3Downgraded 3 levels due risk of bias (result not confirmed in analyses of trials at low risk of bias assessed using CHBG domains; only 1 trial had a low risk of bias); evidence of publication bias (we were unable to gather data from unpublished trials); and imprecision (the TSA ignored the monitoring boundary).

4Downgraded 3 levels due to risk of bias (result not confirmed in analyses of trials at low risk of bias assessed using CHBG domains; none of the trials had a low risk of bias); evidence of publication bias (we were unable to gather data from unpublished trials); imprecision (we were only able to evaluate trials individually; trials reporting this outcome were small with wide CIs).

5Downgraded 3 levels due to risk of bias (result not confirmed in analyses of trials at low risk of bias assessed using CHBG domains; only 1 trial had a low risk of bias); evidence of publication bias (we were unable to gather data from unpublished trials); imprecision (trials reporting this outcome were small and the meta‐analysis result had wide CIs).

Figuras y tablas -
Summary of findings for the main comparison. L‐ornithine L aspartate compared to placebo or no intervention for people with cirrhosis and hepatic encephalopathy
Summary of findings 2. L‐ornithine L‐aspartate compared to lactulose for people with cirrhosis and hepatic encephalopathy

L‐ornithine L‐aspartate compared to lactulose for people with cirrhosis and hepatic encephalopathy

Patient or population: people with cirrhosis who had minimal or overt hepatic encephalopathy or who were at risk for developing hepatic encephalopathy; regardless of sex, age, aetiology, and severity of the underlying liver disease or the presence of identified precipitating factors

Setting: hospital or outpatient

Intervention: L‐ornithine L‐aspartate

Comparison: lactulose

Outcomes: all outcomes assessed at maximum duration of follow‐up

Outcomes

Anticipated absolute effects* (95% CI)

Relative effect
(95% CI)

№ of participants
(studies)

Quality of the evidence
(GRADE)

Comments

Risk with lactulose

Risk with L‐ornithine L‐aspartate

Mortality

Study population

RR 0.68
(0.11 to 4.17)

175
(4 RCTs)

⊕⊝⊝⊝
Very low1

23 per 1000

15 per 1000
(3 to 95)

Hepatic encephalopathy

assessed based on neurocognitive manifestations

Study population

RR 1.13
(0.81 to 1.57)

175
(4 RCTs)

⊕⊝⊝⊝
Very low2

364 per 1000

411 per 1000
(295 to 571)

Serious adverse events

assessed using ICH‐GCP

Study population

RR 0.69
(0.22 to 2.11)

144
(3 RCTs)

⊕⊝⊝⊝
Very low2

97 per 1000

67 per 1000
(21 to 205)

Quality of life

assessed using questionnaires

No evidence was available for this outcome.

Non‐serious adverse events

assessed using ICH‐GCP

Study population

RR 0.05
(0.01 to 0.18)

292

(2 RCTs)

⊕⊝⊝⊝
Very low2

175 per 1000

12 per 1000
(0 to 198)

*The risk in the intervention group (and its 95% confidence interval) is based on the assumed risk in the comparison group and the relative effect of the intervention (and its 95% CI).

CHBG: Cochrane Hepato‐Biliary Group; CI: confidence interval; GCP: Good Clinical Practice; ICH: International Conference on Harmonisation; RCT: randomised clinical trial; RR: risk ratio; TSA: Trial Sequential Analysis.

GRADE Working Group grades of evidence
High quality: We are very confident that the true effect lies close to that of the estimate of the effect
Moderate quality: We are moderately confident in the effect estimate: The true effect is likely to be close to the estimate of the effect, but there is a possibility that it is substantially different
Low quality: Our confidence in the effect estimate is limited: The true effect may be substantially different from the estimate of the effect
Very low quality: We have very little confidence in the effect estimate: The true effect is likely to be substantially different from the estimate of effect

1Downgraded 3 levels due risk of bias (2 trials had a low risk of bias assessed using CHBG domains) and imprecision (wide CIs; small number of events/participants). We were unable to identify publication bias due to the small number of trials.

2Downgraded 3 levels due risk of bias (none of the included trials had a low risk of bias assessed using CHBG domains) and imprecision (wide CIs; small number of events/participants). We were unable to identify publication bias due to the small number of trials.

Figuras y tablas -
Summary of findings 2. L‐ornithine L‐aspartate compared to lactulose for people with cirrhosis and hepatic encephalopathy
Summary of findings 3. L‐ornithine L‐aspartate compared to probiotic for people with cirrhosis and hepatic encephalopathy

L‐ornithine L‐aspartate compared to probiotic for people with cirrhosis and hepatic encephalopathy

Patient or population: people with cirrhosis who had minimal or overt hepatic encephalopathy or who were at risk for developing hepatic encephalopathy; regardless of sex, age, aetiology, and severity of the underlying liver disease, or the presence of identified precipitating factors

Setting: hospital or outpatient

Intervention: L‐ornithine L‐aspartate

Comparison: probiotic

Outcomes

Anticipated absolute effects* (95% CI)

Relative effect
(95% CI)

№ of participants
(studies)

Quality of the evidence
(GRADE)

Comments

Risk with probiotic

Risk with L‐ornithine L‐aspartate

Mortality

Study population

RR 1.01 (0.11 to 9.51)

143

(2 RCTs)

⊕⊝⊝⊝
Very low1

14 per 1000

14 per 1000
(2 to 132)

Hepatic encephalopathy

assessed based on neurocognitive manifestations

Study population

RR 0.71 (0.56 to 0.90)

143

(2 RCTs)

⊕⊝⊝⊝
Very low1

722 per 1000

513 per 1000
(404 to 650)

Serious adverse events

assessed using ICH‐GCP

Study population

RR 1.07 (0.23 to 4.88)

143

(2 RCTs)

⊕⊝⊝⊝
Very low1

42 per 1000

45 per 1000
(10 to 203)

Quality of life

assessed using questionnaires

No evidence available for this outcome.

Non‐serious adverse events

assessed using ICH‐GCP

No evidence available for this outcome.

*The risk in the intervention group (and its 95% confidence interval) is based on the assumed risk in the comparison group and the relative effect of the intervention (and its 95% CI).

CHBG: Cochrane Hepato‐Biliary Group; CI: confidence interval; GCP: Good Clinical Practice; ICH: International Conference on Harmonisation; RCT: randomised clinical trial; RR: risk ratio; TSA: Trial Sequential Analysis.

GRADE Working Group grades of evidence
High quality: We are very confident that the true effect lies close to that of the estimate of the effect
Moderate quality: We are moderately confident in the effect estimate: The true effect is likely to be close to the estimate of the effect, but there is a possibility that it is substantially different
Low quality: Our confidence in the effect estimate is limited: The true effect may be substantially different from the estimate of the effect
Very low quality: We have very little confidence in the effect estimate: The true effect is likely to be substantially different from the estimate of effect

1Downgraded 3 levels due risk of bias (the analysis only includes 1 trial with a high risk of bias assessed using CHBG domains) and imprecision (wide CIs). We were unable to identify publication bias and did not evaluate heterogeneity because the analysis only includes 1 trial.

Figuras y tablas -
Summary of findings 3. L‐ornithine L‐aspartate compared to probiotic for people with cirrhosis and hepatic encephalopathy
Summary of findings 4. L‐ornithine L‐aspartate compared to rifaximin for people with cirrhosis and hepatic encephalopathy

L‐ornithine L‐aspartate compared to rifaximin for people with cirrhosis and hepatic encephalopathy

Patient or population: people with cirrhosis who had minimal or overt hepatic encephalopathy or who were at risk for developing hepatic encephalopathy; regardless of sex, age, aetiology, and severity of the underlying liver disease, or the presence of identified precipitating factors

Setting: hospital or outpatient

Intervention: L‐ornithine L‐aspartate

Comparison: rifaximin

Outcomes: all outcomes assessed at maximum duration of follow‐up

Outcomes

Anticipated absolute effects* (95% CI)

Relative effect
(95% CI)

№ of participants
(studies)

Quality of the evidence
(GRADE)

Comments

Risk with rifaximin

Risk with L‐ornithine L‐aspartate

Mortality

Study population

RR 0.33
(0.04 to 3.03)

105
(2 RCTs)

⊕⊝⊝⊝
Very low1

38 per 1000

13 per 1000
(2 to 117)

Hepatic encephalopathy

assessed based on neurocognitive manifestations

Study population

RR 1.06
(0.57 to 1.96)

105
(2 RCTs)

⊕⊝⊝⊝
Very low2

269 per 1000

285 per 1000
(153 to 528)

Serious adverse events

assessed using ICH‐GCP

Study population

RR 0.32
(0.01 to 7.42)

43
(1 RCT)

⊕⊝⊝⊝
Very low2

48 per 1000

15 per 1000
(0 to 353)

Quality of life

assessed using questionnaires

No evidence was available for this outcome.

Non‐serious adverse events

assessed using ICH‐GCP

Study population

RR 0.32
(0.01 to 7.42)

43
(1 RCT)

⊕⊝⊝⊝
Very low2

48 per 1000

15 per 1000
(0 to 353)

*The risk in the intervention group (and its 95% confidence interval) is based on the assumed risk in the comparison group and the relative effect of the intervention (and its 95% CI).

CHBG: Cochrane Hepato‐Biliary Group; CI: confidence interval; GCP: Good Clinical Practice; ICH: International Conference on Harmonisation; RCT: randomised clinical trial; RR: risk ratio; TSA: Trial Sequential Analysis.

GRADE Working Group grades of evidence
High quality: We are very confident that the true effect lies close to that of the estimate of the effect
Moderate quality: We are moderately confident in the effect estimate: The true effect is likely to be close to the estimate of the effect, but there is a possibility that it is substantially different
Low quality: Our confidence in the effect estimate is limited: The true effect may be substantially different from the estimate of the effect
Very low quality: We have very little confidence in the effect estimate: The true effect is likely to be substantially different from the estimate of effect

1Downgraded 3 levels due risk of bias (1 of the included trials had a low risk of bias assessed using CHBG domains) and imprecision (wide CIs; small number of events/participants). We were unable to identify publication bias due to the small number of trials.

2Downgraded 3 levels due risk of bias (the included trial had a high risk of bias assessed using CHBG domains) and imprecision (wide CIs; small number of events/participants). We were unable to identify publication bias due to the small number of trials.

Figuras y tablas -
Summary of findings 4. L‐ornithine L‐aspartate compared to rifaximin for people with cirrhosis and hepatic encephalopathy
Table 1. Definitions and assessment of neuropsychiatric status in the include studies with corresponding recommended definitions in the EASL/AASLD guidelines

Study and date

Definition of hepatic encephalopathy

Assessment of neuropsychiatric status

Study material (publication)

EASL/AASLD guideline

Abid 2011

Minimal

Minimal

  • Mental status (West Haven Criteria)

  • Number Connection Test‐A

  • Venous blood ammonia

Acute: Grade I to IV

Episodic

Ahmad 2008

Acute: Grade I to III

Episodic

  • Mental status (West Haven Criteria)

  • Postprandial venous blood ammonia

Alvares‐da‐Silva 2014

Minimal

Minimal

  • Number Connection Tests‐A and ‐B

  • Digital Symbol Test

  • Mini Mental Score Examination

  • Critical Flicker Frequency

  • Electroencephalogram (every third participant only)

  • Arterial blood ammonia

Bai 20141

Unimpaired

Unimpaired

  • Mental status (West Haven Criteria)

  • Number Connection Test‐A

  • Serial Dotting Test

  • Line Tracing Test

  • Fasting and postprandial venous blood ammonia

Blanco Vela 2011c2

Acute: Grade III or IV

Overt

  • Mental status (West Haven Criteria)

  • Glasgow Coma Scale

  • Clinical hepatic encephalopathy staging scale (CHESS)

  • Asterixis

  • Number Connection Test‐A

  • Plasma ammonia

  • Portal systemic encephalopathy score and index3

Chen 2005

Acute: Grade I to IV

Episodic

  • Mental status (West Haven Criteria)

  • Blood ammonia

Feher 19971,2

Unimpaired

Unimpaired

  • Mental status (clinical examination)

  • Number Connection Test‐A

  • Fasting and postprandial venous blood ammonia

Fleig 19992

Minimal

Minimal

  • Mental status (West Haven Criteria)

  • Number Connection Tests ‐A and ‐B

  • Digit Symbol Test

  • Line Tracing Test

  • Serial Dotting Test

  • Psychometric hepatic encephalopathy score (PHES)

Chronic Grade I or II

Persistent

Hasan 20122

Minimal

Minimal

  • Mental status

  • Critical Flicker Frequency

  • Blood ammonia

Chronic: Grade I or II

Persistent

Higuera‐de la Tijera 20171

Unimpaired

Unimpaired

  • Mental status (West Haven Criteria)

  • Psychometric hepatic encephalopathy score (PHES)

  • Critical Flicker Fusion Frequency

Hong 20032

Minimal

Minimal

  • Number Connection Test

  • Critical Flicker Frequency

  • Blood ammonia

Kircheis 1997

Minimal

Minimal

  • Mental status (West Haven Criteria)

  • Asterixis

  • Number Connection Test‐A

  • Fasting and postprandial venous blood ammonia

  • Portal Systemic Encephalopathy Sum & Index3

Chronic: Grade I or II

Persistent

Maldonado 20102

Minimal

Minimal

  • Blood ammonia at baseline and 60 minutes after a 10g post‐glutamine load

Merz 1987

Minimal

Minimal

  • Hepatic encephalopathy grade

  • Number Connection Test

  • Blood ammonia

Overt

Unclear

Merz 1988a

Minimal

Minimal

  • Hepatic encephalopathy grade

  • Number Connection Test

  • Blood ammonia

Overt

Unclear

Merz 1988b

Minimal

Minimal

  • Mental status (Holms grade)

  • Number Connection Test‐A

  • Fasting and postprandial venous blood ammonia and postprandial arterial blood ammonia

Acute

Episodic

Merz 1988c

Minimal

Minimal

  • Mental status (West Haven Criteria)

  • Number Connection Test‐A

  • Postprandial venous blood ammonia

Overt

Unclear

Merz 1988d2

Unknown

Unknown

  • Unknown

Merz 1989a

Minimal

Minimal

  • Mental status (Holms grade)

  • Number Connection Test‐A

  • Fasting and postprandial venous blood ammonia

Overt

Unclear

Merz 1989b

Minimal

Minimal

  • Hepatic encephalopathy grade

  • Number Connection Test

  • Blood ammonia

Overt

Unclear

Merz 1992a

Minimal

Minimal

  • Mental status

  • Fasting blood ammonia

Overt

Unclear

Merz 1994a2

Minimal

Minimal

  • Mental status (West Haven Criteria)

  • Number Connection Test‐A

  • Venous blood ammonia

Overt

Unclear

Merz 1994b2

Minimal

Minimal

  • Unknown

Overt

Unclear

Mittal 2011

Minimal

Minimal

  • Mental status (West Haven criteria)

  • Number Connection Tests‐A and ‐B

  • Figure Connection Tests‐A and ‐B

  • Arterial blood ammonia

Ndraha 2011

Minimal

Minimal

  • Mental status (West Haven Criteria)

  • Plasma ammonia

  • Critical Flicker Frequency

Nimanong 20102

Acute: Grade II or III

Episodic

  • Mental status (West Haven Criteria)

  • Asterixis

  • Number Connection Test

  • Electroencephalogram

  • Plasma ammonia

  • Portal Systemic Encephalopathy Sum & Index3

Oruc 20102

Acute

Episodic

  • Mental status (West Haven criteria)

  • Fasting plasma ammonia

  • Critical flicker frequency

Poo 2006

Chronic persistent: Grade I or II

Persistent

  • Mental status (West Haven Criteria)

  • Number Connection Test‐A

  • Asterixis

  • Venous blood ammonia

  • Portal Systemic Encephalopathy Sum & Index3

Puri 20102

Minimal

Minimal

  • Number Connection Test

  • Digit Symbol Test

  • Block Design Test

  • Blood ammonia

  • Cognitive Evoked Potential‐P300

  • Critical Flicker Frequency.

Schmid 20102

Minimal Chronic: Grade I or II

Minimal

  • Mental status (West Haven Criteria)

  • Number Connection Tests‐A and ‐B

  • Digit Symbol Test

  • Line Tracing Test

  • Serial Dotting Test

  • Arterial blood ammonia

  • Portal Systemic Encephalopathy Sum & Index3

  • Critical Flicker Frequency

Chronic: Grade I or II

Persistent

Sharma 2014

Minimal

Minimal

  • Clinical Hepatic Encephalopathy Staging Scale (CHESS)

  • Number Connection Test‐A

  • Figure Connection Test‐A

  • Digital Symbol Test

  • Critical Flicker Frequency

Sidhu 2018

Acute: Grade II to IV

Episodic

  • Mental status (modified West Haven Criteria)

  • Venous blood ammonia

Stauch 1998

Minimal

Minimal

  • Mental status ( West Haven Criteria)

  • Number Connection Test‐A

  • Fasting and postprandial venous blood ammonia

  • Portal Systemic Encephalopathy Sum & Index3

Chronic: Grade I or II

Persistent

Taylor‐Robinson 20171

Unimpaired

Unimpaired

  • Number Connection Test‐A

  • Serial Dotting Test

  • Line Tracing Test

  • Digit Symbol Test

  • Cogstate test battery

  • Stroop test

  • Wechsler test of adult reading

Minimal

Minimal

Varakanahalli 20174

Unimpaired

Unimpaired

  • Mental status

  • Number Connection Test

  • Figure Connection Test

  • Digit Symbol Test

  • Serial Dotting Test

  • Line Tracing Tes

  • Arterial ammonia

  • Critical Flicker Frequency

Zhou 2013

Acute

Episodic

  • Hasegawa's dementia scale

  • Mini Mental State Examination (MMSE)

  • Portal Systemic Encephalopathy Sum & Index3

  • Cerebral magnetic resonance Imaging

AASLD: American Association for the Study of Liver Diseases; EASL: European Association for the Study of the Liver.

1Trials of L‐ornithine L‐aspartate used for primary prevention.

2Not included in the analysis of hepatic encephalopathy versus placebo or non‐intervention.

3Portal‐systemic encephalopathy (PSE) sum and index (Conn 1977), which is calculated using 5 variables: mental status, presence and severity of asterixis; Number Connection Test‐A time, blood ammonia concentration, and the electroencephalogram mean dominant frequency. Each variable is assigned a score of 0 (no abnormality) to 4 (severe abnormality); mental status is weighted by a factor of three; PSE index calculated as the ratio of the points scored and the maximum possible score of 28.

4Trial of L‐ornithine L‐aspartate used for secondary prevention.

Figuras y tablas -
Table 1. Definitions and assessment of neuropsychiatric status in the include studies with corresponding recommended definitions in the EASL/AASLD guidelines
Comparison 1. L‐ornithine L‐aspartate versus placebo/no intervention

Outcome or subgroup title

No. of studies

No. of participants

Statistical method

Effect size

1 Mortality Show forest plot

19

1489

Risk Ratio (M‐H, Random, 95% CI)

0.42 [0.24, 0.72]

1.1 Low risk of bias

4

244

Risk Ratio (M‐H, Random, 95% CI)

0.47 [0.06, 3.58]

1.2 High risk of bias

15

1245

Risk Ratio (M‐H, Random, 95% CI)

0.41 [0.23, 0.72]

2 Mortality, by type of hepatic encephalopathy Show forest plot

19

1489

Risk Ratio (M‐H, Random, 95% CI)

0.59 [0.39, 0.88]

2.1 Acute

6

597

Risk Ratio (M‐H, Random, 95% CI)

0.64 [0.40, 1.01]

2.2 Chronic

2

116

Risk Ratio (M‐H, Random, 95% CI)

0.0 [0.0, 0.0]

2.3 Minimal

9

438

Risk Ratio (M‐H, Random, 95% CI)

0.36 [0.07, 1.94]

2.4 Prevention

5

338

Risk Ratio (M‐H, Random, 95% CI)

0.48 [0.18, 1.26]

3 Mortality, by administration method Show forest plot

19

1489

Risk Ratio (M‐H, Random, 95% CI)

0.59 [0.39, 0.88]

3.1 Intravenous infusion

8

808

Risk Ratio (M‐H, Random, 95% CI)

0.63 [0.40, 0.99]

3.2 Oral

11

681

Risk Ratio (M‐H, Random, 95% CI)

0.45 [0.19, 1.09]

4 Mortality, by publication status Show forest plot

19

1489

Risk Ratio (M‐H, Random, 95% CI)

0.42 [0.24, 0.72]

4.1 Full paper

14

1151

Risk Ratio (M‐H, Random, 95% CI)

0.40 [0.21, 0.78]

4.2 Abstract

5

338

Risk Ratio (M‐H, Random, 95% CI)

0.45 [0.17, 1.18]

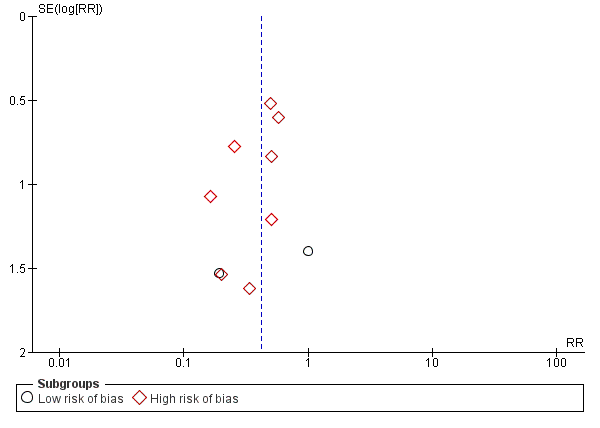
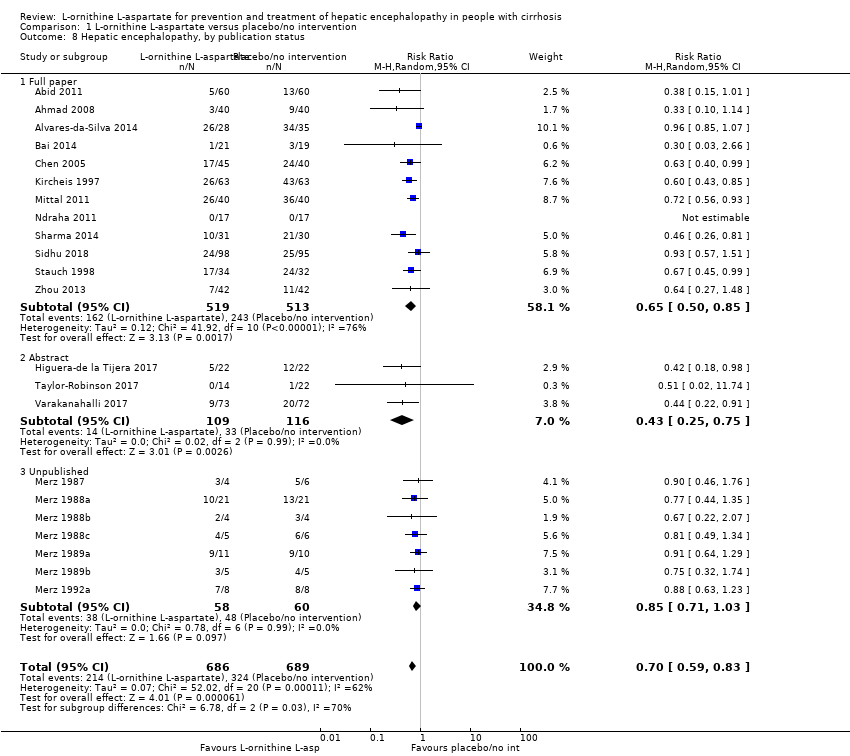
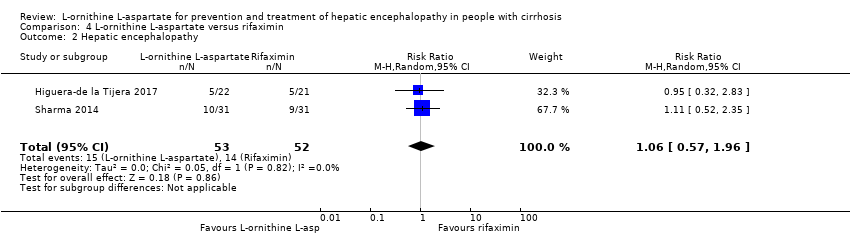
5 Hepatic encephalopathy Show forest plot

22

1375

Risk Ratio (M‐H, Random, 95% CI)

0.70 [0.59, 0.83]

5.1 Low risk of bias

1

63

Risk Ratio (M‐H, Random, 95% CI)

0.96 [0.85, 1.07]

5.2 High risk of bias

21

1312

Risk Ratio (M‐H, Random, 95% CI)

0.71 [0.63, 0.79]

6 Hepatic encephalopathy, by type of hepatic encephalopathy Show forest plot

15

1255

Risk Ratio (M‐H, Random, 95% CI)

0.63 [0.50, 0.81]

6.1 Acute

5

550

Risk Ratio (M‐H, Random, 95% CI)

0.69 [0.51, 0.91]

6.2 Chronic

2

116

Risk Ratio (M‐H, Random, 95% CI)

0.44 [0.28, 0.71]

6.3 Minimal

7

299

Risk Ratio (M‐H, Random, 95% CI)

0.78 [0.60, 1.02]

6.4 Prevention

5

290

Risk Ratio (M‐H, Random, 95% CI)

0.42 [0.25, 0.72]

7 Hepatic encephalopathy, by administration method Show forest plot

22

1375

Risk Ratio (M‐H, Random, 95% CI)

0.70 [0.59, 0.83]

7.1 Intravenous infusion

11

784

Risk Ratio (M‐H, Random, 95% CI)

0.74 [0.62, 0.88]

7.2 Oral

11

591

Risk Ratio (M‐H, Random, 95% CI)

0.68 [0.50, 0.91]

8 Hepatic encephalopathy, by publication status Show forest plot

22

1375

Risk Ratio (M‐H, Random, 95% CI)

0.70 [0.59, 0.83]

8.1 Full paper

12

1032

Risk Ratio (M‐H, Random, 95% CI)

0.65 [0.50, 0.85]

8.2 Abstract

3

225

Risk Ratio (M‐H, Random, 95% CI)

0.43 [0.25, 0.75]

8.3 Unpublished

7

118

Risk Ratio (M‐H, Random, 95% CI)

0.85 [0.71, 1.03]

9 Hepatic encephalopathy, completeness status Show forest plot

22

1375

Risk Ratio (M‐H, Random, 95% CI)

0.70 [0.59, 0.83]

9.1 Complete data

12

994

Risk Ratio (M‐H, Random, 95% CI)

0.63 [0.48, 0.83]

9.2 Incomplete data

10

381

Risk Ratio (M‐H, Random, 95% CI)

0.81 [0.68, 0.97]

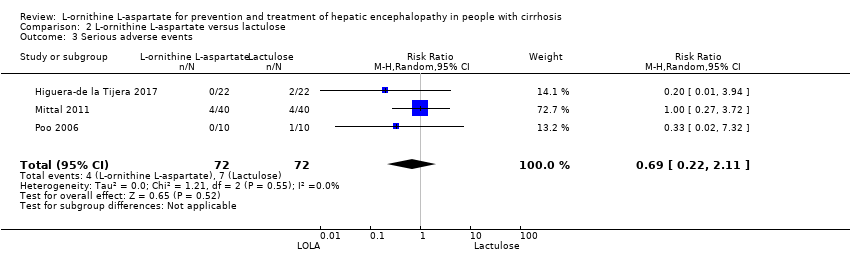
10 Serious adverse events Show forest plot

19

1489

Risk Ratio (M‐H, Random, 95% CI)

0.63 [0.45, 0.90]

10.1 Low risk of bias

1

63

Risk Ratio (M‐H, Random, 95% CI)

0.83 [0.15, 4.65]

10.2 High risk of bias

18

1426

Risk Ratio (M‐H, Random, 95% CI)

0.63 [0.44, 0.89]

11 Serious adverse events, by type of hepatic encephalopathy Show forest plot

17

1283

Risk Ratio (M‐H, Random, 95% CI)

0.67 [0.46, 0.97]

11.1 Acute overt

6

597

Risk Ratio (M‐H, Random, 95% CI)

0.65 [0.43, 1.00]

11.2 Chronic

2

192

Risk Ratio (M‐H, Random, 95% CI)

2.0 [0.19, 21.50]

11.3 Minimal

5

296

Risk Ratio (M‐H, Random, 95% CI)

0.57 [0.24, 1.38]

11.4 Prevention

4

198

Risk Ratio (M‐H, Random, 95% CI)

0.97 [0.17, 5.47]

12 Serious adverse events, by administration method Show forest plot

17

1283

Risk Ratio (M‐H, Random, 95% CI)

0.67 [0.46, 0.97]

12.1 Intravenous infusion

8

808

Risk Ratio (M‐H, Random, 95% CI)

0.70 [0.46, 1.05]

12.2 Oral

9

475

Risk Ratio (M‐H, Random, 95% CI)

0.55 [0.23, 1.29]

13 Serious adverse events, by publication status Show forest plot

17

1283

Risk Ratio (M‐H, Random, 95% CI)

0.67 [0.46, 0.97]

13.1 Full paper

13

1090

Risk Ratio (M‐H, Random, 95% CI)

0.70 [0.48, 1.02]

13.2 Abstract

4

193

Risk Ratio (M‐H, Random, 95% CI)

0.23 [0.04, 1.34]

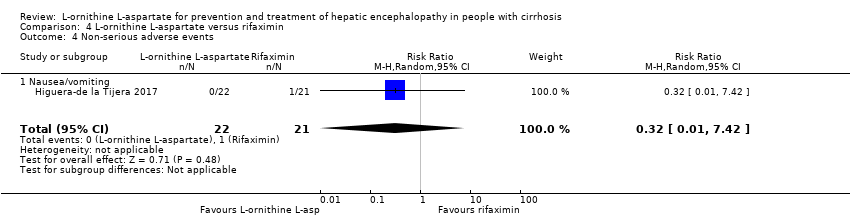
14 Non‐serious adverse events Show forest plot

20

3158

Risk Ratio (M‐H, Random, 95% CI)

1.17 [0.91, 1.51]

14.1 Overall

14

1076

Risk Ratio (M‐H, Random, 95% CI)

1.15 [0.75, 1.77]

14.2 Diarrhoea

4

379

Risk Ratio (M‐H, Random, 95% CI)

1.32 [0.07, 24.18]

14.3 Flatulence

2

229

Risk Ratio (M‐H, Random, 95% CI)

1.60 [0.49, 5.18]

14.4 Nausea/vomiting

10

639

Risk Ratio (M‐H, Random, 95% CI)

2.26 [1.25, 4.10]

14.5 Headaches

1

36

Risk Ratio (M‐H, Random, 95% CI)

7.67 [0.39, 148.82]

14.6 Abdominal pain

3

318

Risk Ratio (M‐H, Random, 95% CI)

0.63 [0.23, 1.69]

14.7 Fever

2

233

Risk Ratio (M‐H, Random, 95% CI)

1.72 [0.12, 23.62]

14.8 Gastrointestinal

1

80

Risk Ratio (M‐H, Random, 95% CI)

0.89 [0.55, 1.45]

14.9 Pruritus

1

80

Risk Ratio (M‐H, Random, 95% CI)

0.6 [0.30, 1.21]

14.10 Fatigue

2

88

Risk Ratio (M‐H, Random, 95% CI)

0.83 [0.58, 1.18]

15 Blood ammonia concentrations Show forest plot

21

Mean Difference (IV, Random, 95% CI)

Subtotals only

15.1 End of treatment

13

868

Mean Difference (IV, Random, 95% CI)

‐18.52 [‐33.63, ‐3.41]

15.2 Change from baseline

13

738

Mean Difference (IV, Random, 95% CI)

‐12.94 [‐20.04, ‐5.83]

Figuras y tablas -
Comparison 1. L‐ornithine L‐aspartate versus placebo/no intervention
Comparison 2. L‐ornithine L‐aspartate versus lactulose

Outcome or subgroup title

No. of studies

No. of participants

Statistical method

Effect size

1 Mortality Show forest plot

4

175

Risk Ratio (M‐H, Random, 95% CI)

0.68 [0.11, 4.17]

1.1 Low risk of bias

2

111

Risk Ratio (M‐H, Random, 95% CI)

3.0 [0.13, 71.51]

1.2 High risk of bias

2

64

Risk Ratio (M‐H, Random, 95% CI)

0.33 [0.04, 3.02]

2 Hepatic encephalopathy Show forest plot

4

175

Risk Ratio (M‐H, Random, 95% CI)

1.13 [0.81, 1.57]

3 Serious adverse events Show forest plot

3

144

Risk Ratio (M‐H, Random, 95% CI)

0.69 [0.22, 2.11]

4 Non‐serious adverse events Show forest plot

2

292

Risk Ratio (M‐H, Random, 95% CI)

0.05 [0.01, 0.18]

4.1 Overall

1

80

Risk Ratio (M‐H, Random, 95% CI)

0.07 [0.00, 1.13]

4.2 Diarrhoea

1

44

Risk Ratio (M‐H, Random, 95% CI)

0.03 [0.00, 0.54]

4.3 Bloating

1

44

Risk Ratio (M‐H, Random, 95% CI)

0.05 [0.00, 0.77]

4.4 Flatulence

1

44

Risk Ratio (M‐H, Random, 95% CI)

0.05 [0.00, 0.77]

4.5 Abdominal pain/discomfort

1

80

Risk Ratio (M‐H, Random, 95% CI)

0.07 [0.00, 1.13]

5 Blood ammonia end of treatment Show forest plot

3

Mean Difference (IV, Fixed, 95% CI)

Subtotals only

5.1 End of treatment

2

51

Mean Difference (IV, Fixed, 95% CI)

‐3.26 [‐10.60, 4.09]

5.2 Change from baseline

1

80

Mean Difference (IV, Fixed, 95% CI)

‐1.14 [‐4.54, 2.26]

Figuras y tablas -
Comparison 2. L‐ornithine L‐aspartate versus lactulose
Comparison 3. L‐ornithine L‐aspartate versus probiotic

Outcome or subgroup title

No. of studies

No. of participants

Statistical method

Effect size

1 Mortality Show forest plot

2

143

Risk Ratio (M‐H, Random, 95% CI)

1.01 [0.11, 9.51]

2 Hepatic encephalopathy Show forest plot

2

143

Risk Ratio (M‐H, Random, 95% CI)

0.71 [0.56, 0.90]

3 Serious adverse events Show forest plot

2

143

Risk Ratio (M‐H, Random, 95% CI)

1.07 [0.23, 4.88]

4 Ammonia (change from baseline) Show forest plot

1

Mean Difference (IV, Random, 95% CI)

Subtotals only

Figuras y tablas -
Comparison 3. L‐ornithine L‐aspartate versus probiotic
Comparison 4. L‐ornithine L‐aspartate versus rifaximin

Outcome or subgroup title

No. of studies

No. of participants

Statistical method

Effect size

1 Mortality Show forest plot

2

105

Risk Ratio (M‐H, Random, 95% CI)

0.33 [0.04, 3.03]

2 Hepatic encephalopathy Show forest plot

2

105

Risk Ratio (M‐H, Random, 95% CI)

1.06 [0.57, 1.96]

3 Serious adverse events Show forest plot

1

43

Risk Ratio (M‐H, Random, 95% CI)

0.32 [0.01, 7.42]

4 Non‐serious adverse events Show forest plot

1

43

Risk Ratio (M‐H, Random, 95% CI)

0.32 [0.01, 7.42]

4.1 Nausea/vomiting

1

43

Risk Ratio (M‐H, Random, 95% CI)

0.32 [0.01, 7.42]

Figuras y tablas -
Comparison 4. L‐ornithine L‐aspartate versus rifaximin