Terapias psicológicas para niños y adolescentes expuestos a traumas
Referencias
Referencias de los estudios incluidos en esta revisión
Referencias de los estudios excluidos de esta revisión
Referencias de los estudios en espera de evaluación
Referencias de los estudios en curso
Referencias adicionales
Referencias de otras versiones publicadas de esta revisión
Characteristics of studies
Characteristics of included studies [ordered by study ID]
| Methods | Randomised trial of individual vs group therapy | |
| Participants | Included (n = 39) Adolescent females 13 to 17 years of age who had suffered contact sexual abuse validated by child protective services. Ethnicity: white 31, black 8. The girls were in the process of court proceedings or investigative procedures; 9 completed the court process during treatment Excluded Not reported Setting Counselling centre in a rural county in Delaware, USA | |
| Interventions | Both therapies Therapists were instructed to use Rogerian techniques in both individual and group therapies. Therapists were given a list of topics to be introduced for discussion, including associated emotions and life changes, assertiveness and coping, family roles, support systems and resources, communication, court preparation and social concerns Individual therapy (n = 15) Individual therapy sessions of 1 hour were conducted for 10 weeks Group therapy (n = 24) Group therapy allowed sharing of experiences and information and provided feedback from other victims. Group sessions of 1 ½ hours were run with a maximum of 8 participants over 6 weeks Therapists All held master's level degrees in counselling disciplines, had received training in treatment of sexual abuse and were skilled in Rogerian techniques. Therapists were also provided with examples of Rogerian techniques (restatement, reflection of meaning, reflection of feeling, congruence, acceptance and reinforcement of positive feelings). Each of the 3 therapists led 1 group and saw 5 girls individually | |
| Outcomes | Depression Scale: Institute for Personality and Ability Testing Depression Scale Rater: adolescent Anxiety Scale: Institute for Personality and Ability Testing Anxiety Scale Rater: adolescent When Post therapy | |
| Notes | Depression and anxiety were in the normal range at pretest for both groups | |
| Risk of bias | ||
| Bias | Authors' judgement | Support for judgement |
| Random sequence generation (selection bias) | Low risk | Random assignment was achieved by having participants draw 1 slip of paper at a time from a box until all were assigned |
| Allocation concealment (selection bias) | Unclear risk | Not reported |
| Blinding of participants (performance bias | Unclear risk | Participants could not be blinded, but both groups received a psychological therapy |
| Blinding of outcome assessment (detection bias) | Unclear risk | Outcome assessment could not be blinded, as all measures were self report |
| Incomplete outcome data (attrition bias) | Unclear risk | Loss to follow‐up was not reported |
| Selective reporting (reporting bias) | Low risk | All outcomes appear to have been reported |
| Other bias | Low risk | No other apparent bias |
| Methods | Cluster‐randomised trial of teaching recovery technique vs wait list | |
| Participants | Included (n = 140) The 10 students with the highest CRIES‐13 scores in each class of 11‐ to 14‐year‐olds. Female: 60. Mean age: 11.08 (range 11 to 14) years. Ethnicity: all Palestinian Excluded Students with incomplete pretest data Setting Nablus, Palestine; selected because of high levels of ongoing violence | |
| Interventions | Teaching recovery technique (n = 90) This cognitive‐behavioural programme includes 5 sessions that focus on normalising trauma and strategies for intrusive memories, hyperarousal and avoidance symptoms of PTSD. The fifth session focuses on children’s response to loss. Sessions were delivered over 5 consecutive weeks. Each session lasted 1 hour and 30 minutes. Two counsellors were present during programme delivery ‐ one to present and the other to observe Wait list (n = 50) The wait list received the usual school health education curriculum (health and social issues) Therapists Counsellors received 3 days of training in programme delivery provided by 2 expert trainers from the Children and War Foundation, covering programme values, content and processes Programme fidelity was assessed by 18 observers who completed a fidelity questionnaire Observers reported that 60% of objectives were achieved and 74% of guidelines were followed | |
| Outcomes | Diagnosis Scale: score ≥ 17 on the Children’s Revised Impact of Events Scale (CRIES‐13) Rater: child/adolescent Trauma symptoms Scale: CRIES‐13 Rater: child/adolescent Depression Scale: Depression Self‐Rating Scale for Children Rater: child/adolescent Behaviour Scale: Strength and Difficulties Questionnaire Rater: child/adolescent When Two weeks after intervention | |
| Notes | ||
| Risk of bias | ||
| Bias | Authors' judgement | Support for judgement |
| Random sequence generation (selection bias) | High risk | Counsellors trained in the intervention were randomly allocated to groups by the principal researcher, who 'blindly selected' their names from a container; however, counsellors then ‘identified’ classes |
| Allocation concealment (selection bias) | High risk | See above |
| Blinding of participants (performance bias | High risk | Participants were probably aware of whether they were in the active or wait list group |
| Blinding of outcome assessment (detection bias) | High risk | 'Questionnaires were translated to Arabic and then blind back‐translated to English from Arabic', but all measures were self reported |
| Incomplete outcome data (attrition bias) | Low risk | Loss to follow‐up 5% |
| Selective reporting (reporting bias) | Unclear risk | All outcomes appear to have been reported |
| Other bias | Low risk | No other apparent bias |
| Methods | Cluster‐randomised trial of ERASE Stress Sri Lanka group therapy vs wait list | |
| Participants | Included (n = 166) Children 9 to 14 years of age exposed to the 2004 tsunami Female: 73. Trauma exposure: physically hurt during the tsunami 139, knew someone close who had died during the tsunami 100, exposed to another major traumatic incident 148 Excluded Not reported Setting School in a small town that suffered a direct hit from the tsunami in Welligama Sri Lanka, 2006 | |
| Interventions | Group therapy (n = 84) Twelve weekly 90‐minute sessions of 12 to 16 participants (grouped by age and gender for the older 2 groups). Key components: CBT, psychoeducation, meditation, bioenergetic exercises, coping skills, narrative techniques including art therapy, planning for the future Wait list control (n = 82) Children in this group attended a religious class Therapists Teacher training was given to all 12 homeroom teachers over 3 days. Each teacher was responsible for 1 class only | |
| Outcomes | Diagnosis Scale: score ≥ 3 on 1 item of the UCLA PTSD Index (17‐item) Rater: child Trauma symptoms Scale: UCLA PTSD Index Rater: child Depression Scale: Beck Depression Inventory (7‐item) Rater: child Functional problems Scale: Child Diagnostic Interview Schedule (7‐item) Rater: clinician When At 3‐month follow‐up | |
| Notes | So they could be added to the meta‐analysis of function, functional impairment scores were converted to negative values | |
| Risk of bias | ||
| Bias | Authors' judgement | Support for judgement |
| Random sequence generation (selection bias) | Low risk | One class in each of the 6 age groups were randomised by coin toss to group therapy or wait list control |
| Allocation concealment (selection bias) | Unclear risk | Not reported |
| Blinding of participants (performance bias | High risk | Participants probably were aware of whether they were in the active or wait list group |
| Blinding of outcome assessment (detection bias) | High risk | Although 'volunteers blinded to the experimental condition administered questionnaires', all measures were self reported |
| Incomplete outcome data (attrition bias) | Low risk | No loss to follow‐up: "we had no dropouts among those who completed the questionnaires. There were no missing data" |
| Selective reporting (reporting bias) | High risk | Only diagnosis was reported |
| Other bias | Low risk | No other bias was apparent |
| Methods | Cluster‐randomised trial of ERASE‐Stress vs wait list | |
| Participants | Included (n = 154) 7th and 8th grade students from the largest Jewish governmental religious school in Sderot whose parents had participated in a psychoeducation session and had given informed consent. Females: 83 (53.9%). Age: mean 12.8 (range 11 to 13) years. 96% had been exposed to missile attacks Excluded Setting The largest Jewish governmental religious school with approximately 1200 students in Sderot, a town in Southern Israel exposed to ongoing and intense war‐related threat from daily rocket attacks and mortar shelling, 2007 to 2008 | |
| Interventions | ERASE‐Stress (n = 107) Covered cognitive‐behavioural techniques; psychoeducation on types and impact of stress, normative and non‐normative reactions; connections between sensations, thoughts and feelings; identification of personal resources and enhancement of coping strategies, affect modulation, emotional awareness, positive self talk and self affirmation techniques; and modalities to express feelings. The intervention consisted of 16 weekly 90‐minute classroom sessions. All sessions included homework review, warm‐up introduction, experiential exercises, psychoeducational material, learned skills and a closure exercise, followed by a new homework assignment Two major adaptations were made to the original ERASE Stress programme, extending the programme from 12 to 16 sessions. These included religious and spiritual practices, affect modulation strategies, self affirmations, a practice session on combating fears and additional social skills Wait list (n = 47) Homeroom teachers of wait list classes were instructed to delay the intervention for the following year Therapists Sessions were given in weekly social study classes traditionally taught by homeroom teachers All 6 seventh and eighth grade homeroom teachers participated in eight 3‐hour training sessions Fidelity assessments were done to ensure that the manual was followed. Teachers were aware that trainers would come and observe interventions but did not know when | |
| Outcomes | Diagnosis Scale: UCLA PTSD‐I (17‐item) Rater: child/adolescent Trauma symptoms Scale: UCLA PTSD‐I (17‐item) Rater: child/adolescent Anxiety Scale: Screen for Child Anxiety‐Related Emotional Disorders (7‐item) Rater: child/adolescent Functional impairment Scale: Child Diagnostic Interview Schedule (4‐item) Rater: child/adolescent When At 1 month after training | |
| Notes | ||
| Risk of bias | ||
| Bias | Authors' judgement | Support for judgement |
| Random sequence generation (selection bias) | Low risk | ‘we randomly (by picking paper slips out of a bag) assigned four of the six seventh and eighth grade classes (two in each grade level) to the experimental EES and two classes (one class for each grade level) to the waiting list (WL) condition’ |
| Allocation concealment (selection bias) | Unclear risk | Not stated |
| Blinding of participants (performance bias | High risk | Participants probably were aware of whether they were in the active or wait list group |
| Blinding of outcome assessment (detection bias) | High risk | ‘Clinicians blinded to the experimental condition assisted students when necessary’, but all measures were self reported |
| Incomplete outcome data (attrition bias) | Low risk | All participants were followed up |
| Selective reporting (reporting bias) | Low risk | All outcomes appear to have been reported |
| Other bias | Low risk | No other bias was apparent |
| Methods | Block‐randomised trial of child and family traumatic stress intervention vs supportive therapy | |
| Participants | Included (n = 106) Youth 7 to 17 years of age attending a paediatric emergency department and reporting ≥ 1 new distressing post‐traumatic stress symptom. Mean age: 12 years. Female: 52% Caucasian 32%, African American 37%, Hispanic 22%, multi‐ethnic 7%, other ethnicities 2%. Trauma exposure: motor vehicle accident 24%, sexual abuse 18%, witnessing violence 19%, physical assaults 21%, injuries 8%, threats of violence 5% Excluded Receiving counselling or mental health treatment, developmental delay, psychotic or bipolar disorder, caregiver or participant did not speak English Setting Trauma Section of the Yale Child Study Center, USA, 2006 to 2009 | |
| Interventions | Child and family traumatic stress intervention (n = 53) Four sessions involving child and caregiver used cognitive, behavioural and psychoeducational techniques. Identification of trauma responses, behavioural skills and communication between caregiver and child included Control (n = 53) Four sessions over 4 weeks involving child and caregiver included psychoeducation, relaxation training, coping strategies and supportive therapy Therapists Master's and doctoral level clinicians. Fidelity checked and weekly supervision provided | |
| Outcomes | Trauma symptoms Scale: Trauma Symptom Checklist for Children (54‐item) Rater: child/adolescent Anxiety Scale: Trauma Symptom Checklist for Children Rater: child/adolescent When Post therapy and at 3‐month follow‐up | |
| Notes | Standard deviations calculated from standard errors | |
| Risk of bias | ||
| Bias | Authors' judgement | Support for judgement |
| Random sequence generation (selection bias) | Low risk | Block‐randomised (block size of 10) using number containers |
| Allocation concealment (selection bias) | Unclear risk | Not reported |
| Blinding of participants (performance bias | Unclear risk | Participants could not be blinded, but both groups received psychological therapy |
| Blinding of outcome assessment (detection bias) | Unclear risk | Outcome assessment could not be blinded, as all measures were self report |
| Incomplete outcome data (attrition bias) | Unclear risk | Analysis appears to be based on 'last observation carried forward', but loss to follow‐up was relatively high: post therapy 25%, 3 months 27% |
| Selective reporting (reporting bias) | Low risk | All outcomes appear to have been reported |
| Other bias | Low risk | No other bias was apparent |
| Methods | Cluster‐randomised trial of stress inoculation training, gradual exposure and standard group therapy vs standard group therapy only | |
| Participants | Included (n = 154) Child:ren 4 to 13 years of age reporting sexual abuse that child protection services or law enforcement professionals had substantiated or did not consider unfounded. Female 90%. Caucasian 73%. The index assault was rape in 49%; 75% were serially assaulted. The chart diagnosis was PTSD in 81% Excluded Those who did not complete a minimum 8 of 10 sessions Setting Two sexual assault clinics in a major metropolitan area, USA | |
| Interventions | Stress inoculation training/Gradual exposure/Standard group therapy (n = 48) Experimental interventions were stress inoculation training and gradual exposure, in addition to standard group therapy Standard group therapy only (n = 32) The 10 sessions over 10 weeks covered feelings, family and friends, disclosure impact, self esteem and sexual abuse, body awareness and sexuality and prevention and termination Therapists Both treatment protocols were manualised. Therapists were trained in both protocols. Therapists completed a checklist describing the components covered in each session. Sessions were audiotaped and reviewed by the project co‐ordinator. As a result of these procedures, treatment integrity was excellent and was consistent with the written manuals | |
| Outcomes | Behaviour Scale: Child Behavior Checklist (134‐item) Rater: parent Anxiety Scale: Revised Children’s Manifest Anxiety Scale (37‐item) Rater: child Depression Scale: Children’s Depression Inventory (27‐item) Rater: child When Post therapy and at 1‐ and 2‐year follow‐up | |
| Notes | ||
| Risk of bias | ||
| Bias | Authors' judgement | Support for judgement |
| Random sequence generation (selection bias) | Low risk | Groups (stratified for age and gender) were randomly assigned to the treatment or comparison condition by a random number table |
| Allocation concealment (selection bias) | Low risk | Therapists and other staff were blind to the random assignment schedule and were not informed of the condition of the group they would be running until all children were referred |
| Blinding of participants (performance bias | Unclear risk | Participants could not be blinded, but both groups received a psychological therapy |
| Blinding of outcome assessment (detection bias) | Unclear risk | Outcome assessment could not be blinded, as all measures were self reported or parent reported |
| Incomplete outcome data (attrition bias) | High risk | Loss to follow‐up was high (48%), and only results for those completing were reported |
| Selective reporting (reporting bias) | Low risk | All outcomes appear to have been reported |
| Other bias | Low risk | No other bias was apparent |
| Methods | Randomised trial of a group psychosocial Intervention vs wait list control for war‐affected youth | |
| Participants | Included (n = 436) Multi‐symptomatic war‐affected youth 15 to 24 years of age recruited through outreach centres and by referral from workers at youth‐serving agencies, religious leaders and community elders; wanted to continue education; psychological distress and impairment in daily functioning. Mean age 18 years. Female: 199. Type of trauma: separated from caregiver as the result of war 237: 54%; friend/family member died because of war: 219 (50%); exposure to armed conflict: 73 (17%); member of armed forces: 23 (5%). Mean UCLA PTSD‐RI: treatment 0.68; control 0.77 Excluded Active suicidality or psychosis Setting Six community‐based sites, Sierra Leone, 2012 to 2013 | |
| Interventions | Youth Readiness Intervention (n = 222) Based on stabilisation and skills‐focused, including elements from CBT and interpersonal therapy, to address symptoms and impairments related to emotion dysregulation, risky behaviour and functional impairments, including interpersonal deficits. Core components included psychoeducation, self regulation and relaxation, cognitive restructuring, behavioural activation, communication and interpersonal skills and sequential problem solving. Ten group sessions (mean, 6.3) with an average of 9 participants per group Wait list control (n = 214) Length of wait list unclear; it appears that both groups were randomised to EducAid intervention at 3 months Therapists Four male and 4 female counsellors who had a bachelor’s degree or diploma in social work completed intensive 2‐week training and achieved a high level of competency in the YRI after training. A senior local mental health worker provided weekly supervision, and clinical psychologists provided weekly phone supervision | |
| Outcomes | PTSD symptoms Scale: UCLA PTSD‐RI Rater: child/adolescent Behaviour Scale: internalising and externalising items from the Oxford Measure of Psychosocial Adjustment (28‐item) Rater: child/adolescent Functional impairment Scale: functional impairment ‐ WHO Disability Adjustment Scale Rater: child/adolescent When Post treatment and at 6‐month follow‐up | |
| Notes | After post‐treatment follow‐up, both groups were randomised to receive or not receive an educational intervention | |
| Risk of bias | ||
| Bias | Authors' judgement | Support for judgement |
| Random sequence generation (selection bias) | Low risk | Stratified by gender and age; sequence generated in STATA |
| Allocation concealment (selection bias) | Unclear risk | Not described |
| Blinding of participants (performance bias | High risk | Wait list control |
| Blinding of outcome assessment (detection bias) | High risk | ‘assessors were blinded', but outcomes were child/adolescent‐reported |
| Incomplete outcome data (attrition bias) | Low risk | Imputation data were used; loss to follow‐up at end of treatment was 9.6%; at 6 months, 14.9% |
| Selective reporting (reporting bias) | Unclear risk | All data were reported |
| Other bias | High risk | PTSD scores were 10% higher in control group at baseline |
| Methods | Randomised trial of a psychodrama group vs wait list | |
| Participants | Included (n = 28) Girls who were referred to a large school‐based mental health programme at the beginning of sixth grade by their teachers or parents for trauma‐related problems. Girls were screened for at least 7 of 10 listed traumatic experiences. Ages: 11 to 13 years; Latinas 14/26 who completed the intervention, African American 11, Haitian 1 Excluded Not reported Setting Middle school in an urban neighbourhood identified as having a high rate of community violence, poverty and social problems, USA | |
| Interventions | Psychodrama group (n = 14) Psychodrama groups met for 20 weeks with the principal investigator. Groups covered 3 phases. The warm‐up phase introduced acting out feelings and learning to identify and share emotions. During the action phase, each child was helped to show or tell what had happened to him or her, and in the sharing phase, participants talked about their feelings during the action phase Wait list control (n = 14) The wait list control group could participate in an arts and crafts group over 20 weeks Therapists The therapist was a social worker 'well trained in psychodrama techniques and had extensive experience in group work and school‐based services' | |
| Outcomes | Behaviour Scale: Youth Self‐Report (112‐item): withdrawn, aggressive subscales Rater: child When Post therapy | |
| Notes | ||
| Risk of bias | ||
| Bias | Authors' judgement | Support for judgement |
| Random sequence generation (selection bias) | Unclear risk | Not reported |
| Allocation concealment (selection bias) | Unclear risk | Not reported |
| Blinding of participants (performance bias | High risk | Participants probably were aware of whether they were in the active or wait list group |
| Blinding of outcome assessment (detection bias) | High risk | Outcome assessment could not be blinded, as the only measure was self reported |
| Incomplete outcome data (attrition bias) | High risk | Data reported for completing participants; 18% loss to follow‐up |
| Selective reporting (reporting bias) | Low risk | All outcomes appear to have been reported |
| Other bias | Low risk | No other bias was apparent |
| Methods | Randomised trial of Stanford cue‐centred treatment vs wait list in children chronically exposed to violence | |
| Participants | Included (n = 65) Individuals 8 to 17 years of age with a history of exposure to violence but no current exposure to perpetrators of violence and with a non‐abusing caretaker willing to participate. Mean age: 11.56 years. Female: 40%. Ethnicity: African American 50.7%, Hispanic/Latino 40.0%, Pacific Islander 1.5%, mixed ethnicity 7.7%. Type of trauma: All participants reported exposure to ≥ 2 traumatic events. The most common traumas were separation/loss (75.0%), witnessing violence (61.5%), homicide (51.9%), physical abuse (25.0%) and bullying (25.0%). Mean PTSD‐RI scores were 22.70 in the treatment group and 25.80 in the wait list group Excluded Significant medical illness, diagnosis of autism or schizophrenia, history of mental retardation or IQ < 70, substance dependency, lack of proficiency in English Setting 13 urban low‐income schools, USA, 2009 to 11 | |
| Interventions | Stanford cue‐centred treatment (n = 38) The primary goal is to empower the child through knowledge of trauma exposure and current affective, cognitive, behavioural or physiological responses. Children and parents learn about how adaptive responses become maladaptive, how to cope with rather than avoid ongoing stress and the importance of verbalising their life experiences. Also included skills training in how to reduce physical symptoms of anxiety, modify cognitive distortions and facilitate emotional expression. The manual also contained pictorial representations to assist the youth with understanding concepts. Therapy was delivered in 15 weekly individual sessions of approximately 50 minutes Two licensed therapists (PhD and MFT) with experience in the treatment of childhood trauma were trained in the cue‐centred treatment protocol over 3 months. Therapists received weekly supervision on the manual, phone consultation and case conferences. Fidelity to the treatment protocol in 25% of randomly selected audiotapes of sessions was assessed by 2 independent research assistants, who rated it as 91.2% Wait list (n = 27) Received cue‐centred treatment 3 months after randomisation | |
| Outcomes | PTSD symptoms Scale: UCLA PTSD‐RI for DSM‐IV (48‐item) Rater: child/adolescent Scale: UCLA PTSD‐RI for DSM‐IV (48‐item) Rater: parent Depression Scale: CDI (27‐item) Rater: child/adolescent Anxiety Scale: RCMAS (37‐item) Rater: child/adolescent When Post treatment | |
| Notes | Because loss to follow‐up was greater than 55% overall, only loss to follow‐up data are used in this review | |
| Risk of bias | ||
| Bias | Authors' judgement | Support for judgement |
| Random sequence generation (selection bias) | Unclear risk | Not described |
| Allocation concealment (selection bias) | Unclear risk | Not described |
| Blinding of participants (performance bias | High risk | Wait list control |
| Blinding of outcome assessment (detection bias) | High risk | Self report measures used |
| Incomplete outcome data (attrition bias) | High risk | 55.4% lost to follow‐up (63% treatment and 44.4% wait list) |
| Selective reporting (reporting bias) | Low risk | Protocol was not identified, but major measures were reported |
| Other bias | Low risk | No other biases were identified |
| Methods | Randomised trial of Recovering from Abuse Program vs supportive therapy | |
| Participants | Included (n = 47) Girls 8 to 13 years of age who had experienced sexual abuse within the previous 3 years and had received no previous treatment and their non‐offending female caretaker. Mean age: 10.5 years; African American 75%, Caucasian 22%, Hispanic 3%. Abuse was substantiated by child protection authorities and had been disclosed within 1 to 26 months Excluded Children and/or female caretakers with mental retardation, psychosis or drug addiction Setting Outpatient Child Psychiatry clinic, USA | |
| Interventions | Recovering From Abuse Program (RAP) (n = 25) A structured programme over 8 weekly 1‐hour sessions that used developmentally appropriate cognitive‐behavioural and metaphoric techniques. Issues covered were blame and stigmatisation, feelings of betrayal, traumatic sexualisation, feelings of powerlessness and anxiety and assertiveness skills. Two or 3 sessions were joint sessions with child and caretaker; remaining sessions were split individually between child and caretaker Supportive therapy (n = 22) Eight weekly 1‐hour sessions, primarily covering support education and discussion of child's symptoms, feelings and thoughts. Topics most frequently discussed with children in TAU were abuse‐related symptoms/feelings, other family issues, school issues, mother‐child communication, peer relationships and self esteem issues. Two or 3 sessions were joint sessions with child and caretaker; remaining sessions were split individually between child and caretaker Therapists Therapists for both interventions were 18 female psychiatrists, psychologists, social workers, nurses and trainees in psychiatry and psychology with prior education and experience in psychotherapy with children. RAP therapists participated in a 3‐hour training session and received weekly supervision in the manualised programme. Trainees providing TAU received 7 weekly supervision sessions highlighting clinical issues relevant to child sexual abuse. Professional clinicians participated in monthly group supervision sessions | |
| Outcomes | PTSD symptoms Scale: Revised Children's Impact of Traumatic Events Scale (CITES‐R; 77‐item): symptom subscale Rater: child Behaviour Scale: Child Behavior Checklist (CBCL): internalising, externalising Rater: parent Function Scale: Children's Global Assessment Scale (C‐GAS) Rater: psychiatrist When Post therapy | |
| Notes | CBCL PTSD subscale scores were also reported, but because these data were skewed, CITES‐R data were used Loss to follow‐up was greater than 40% in the therapy group post therapy for the outcome of function | |
| Risk of bias | ||
| Bias | Authors' judgement | Support for judgement |
| Random sequence generation (selection bias) | Unclear risk | Not reported |
| Allocation concealment (selection bias) | Unclear risk | Not reported |
| Blinding of participants (performance bias | Unclear risk | Participants could not be blinded, but both groups received a psychological therapy |
| Blinding of outcome assessment (detection bias) | Unclear risk | Assessment of the C‐GAS was blinded, but the other 2 measures were self reported |
| Incomplete outcome data (attrition bias) | High risk | Completer analysis reported. Loss to follow‐up: 32% |
| Selective reporting (reporting bias) | Low risk | All outcomes appear to have been reported |
| Other bias | Low risk | No other bias was apparent |
| Methods | Randomised trial of Chapman art therapy vs standard hospital care | |
| Participants | Included (n = 58) Children 7 to 17 years of age admitted for ≥ 24 hours to a level 1 trauma centre and scoring ≥ 12 on the PTSD‐I Scale. Mean age: 10.7 years. Female: 29%, Ethnicity: white 35%, black 29%, Asian 24%, Hispanic 12% Excluded Children with burns, head injuries or injuries resulting from child abuse; non‐English‐speaking children or caregivers Setting: level 1 trauma centre at a large urban hospital, USA | |
| Interventions | Chapman art therapy (n = 31) A brief, trauma resolution method of approximately 1 hour designed to provide an opportunity for the child to sequentially relate and cognitively comprehend his or her medical trauma in a 1‐to‐1 session at the child's bedside Standard hospital care (n = 27) Therapists One of 2 art therapists | |
| Outcomes | PTSD symptoms Scale: UCLA PTSD Index Rater: child/adolescent and parent When At 1 week after injury and at 1 month and 6 months after discharge | |
| Notes | No means or variance values were reported. The only data were shown graphically; it appears that only scores for avoidance were reported | |
| Risk of bias | ||
| Bias | Authors' judgement | Support for judgement |
| Random sequence generation (selection bias) | Unclear risk | Not reported |
| Allocation concealment (selection bias) | Unclear risk | Not reported |
| Blinding of participants (performance bias | High risk | Participants probably were aware of whether they were in the active or standard hospital care group |
| Blinding of outcome assessment (detection bias) | High risk | Outcome assessment could not be blinded, as the only measure was self reported or parent reported |
| Incomplete outcome data (attrition bias) | Unclear risk | Loss to follow‐up not reported |
| Selective reporting (reporting bias) | High risk | Only the subscore for PTSD avoidance was available. Six‐month follow‐up data were not reported |
| Other bias | Low risk | No other bias was apparent |
| Methods | Randomised trial of individual therapy vs group therapy or wait list | |
| Participants | Included (n = 248) Children in grades 2 to 6 who met criteria for disaster exposure measured by a score at or above the 94th percentile for trauma symptom severity on the Kauai Recovery Index. Age: 6 to 12 years (mean, 8.2 years). Female: 61.4%. Hawaiian or part‐Hawaiian 30.1%; white 24.9%; Filipino 19.7%; Japanese 9.2%. 88% met DSM‐IV criteria for self reported PTSD Excluded Not reported Setting Ten elementary public schools on a Hawaiian island 2 years after a major hurricane, 1995 to 1996 | |
| Interventions | Individual therapy Therapists were provided a standard box of art and play materials, and therapy was guided by treatment manuals. The 4 weekly sessions covered safety and helplessness, loss, mobilising competence, issues of anger and ending and going forward. Themes were explored through a combination of play, expressive art and talk Group therapy As for individual therapy, except that co‐operative play and discussion were used in group sessions of 4 to 8 children Therapists Therapists were 3 school counsellors and 1 social worker experienced at working with children in schools who received 4 ½ days of training and 3 hours of supervision each week | |
| Outcomes | PTSD symptoms Scale: Kauai Recovery Index (24‐item) Rater: child When At 1 and 12 months | |
| Notes | Sample numbers were not reported, and these data could not be obtained from study authors | |
| Risk of bias | ||
| Bias | Authors' judgement | Support for judgement |
| Random sequence generation (selection bias) | Low risk | SPSS used to generate randomisation sequence. Randomised to 1 of 3 cohorts, then randomised to group or individual treatments |
| Allocation concealment (selection bias) | Unclear risk | Not reported |
| Blinding of participants (performance bias | High risk | Participants probably were aware of whether they had been allocated to individual or group therapy or wait list |
| Blinding of outcome assessment (detection bias) | High risk | Outcome assessment could not be blinded, as the only measure was self reported |
| Incomplete outcome data (attrition bias) | Unclear risk | Loss to follow‐up not clear |
| Selective reporting (reporting bias) | Low risk | All outcomes appear to have been reported |
| Other bias | Low risk | No other bias was apparent |
| Methods | Randomised trial of Emotional Freedom Technique vs no treatment | |
| Participants | Included (n = 16) Males 12 to 17 years of age who were removed by court order to a residential facility because of physical, psychological or sexual abuse, parental abandonment or negligence and could understand the instructions on the Impact of Events Scale. Average age: 13.7 years. All participants scored in the moderate clinical range on the IES Total, with an average score of 34.2 Excluded Organic or neurological conditions, prior clinical psychiatric diagnoses, concurrent pharmacological treatment Setting Residential facility in Trujillo, Peru | |
| Interventions | Emotional Freedom Technique (n = 8) The Emotional Freedom Technique (EFT) is an exposure‐based therapy in which participants pair the memory of a highly traumatic event with a statement of self acceptance while tapping prescribed acupuncture points. The therapist asks the child to recall the most troubling specific incident of abuse as though it were a movie, give the movie a title and rate the level of distress associated with the trauma (subjective units of distress scale of 0 to 10). EFT was repeated until the distress level was at or near 0 over a single 1‐hour session Mean number of EFT was 2.47 (range, 2 to 4) Control (n = 8) No treatment Therapists Investigators providing therapy were trained with 'other psychologists in EFT'. Clinical supervisors monitored fidelity to the EFT manual | |
| Outcomes | Trauma symptoms Scale: Impact of Events Scale (15‐item) ‐ intrusion, avoidance, total Rater: child/adolescent When At 1 month | |
| Notes | Data were not added to meta‐analyses because the effect sizes were several times higher than the overall estimate and contributed substantial heterogeneity | |
| Risk of bias | ||
| Bias | Authors' judgement | Support for judgement |
| Random sequence generation (selection bias) | Unclear risk | Not stated |
| Allocation concealment (selection bias) | Unclear risk | Not stated |
| Blinding of participants (performance bias | High risk | Participants probably were aware of whether they were in the active or no treatment group |
| Blinding of outcome assessment (detection bias) | High risk | 'Data [were] scored, offsite and blind, by a biostatistician', but data were collected by a therapy supervisor and measures were self reported |
| Incomplete outcome data (attrition bias) | Low risk | No loss to follow‐up |
| Selective reporting (reporting bias) | Unclear risk | Only 1 outcome measure was reported |
| Other bias | Unclear risk | Potential differences between groups were not investigated |
| Methods | Randomised trial of CBT vs supportive therapy | |
| Participants | Included (n = 86) Preschool children who had been sexually abused, with the most recent episode of sexual abuse reported within the previous 6 months with minimal symptoms defined as a Weekly Behavior Report score > 7 or any sexually inappropriate behavior reported on the Child Sexual Behavior Inventory. Mean age: 4.7 years. Female: 58%. Caucasian 54%, African American 42%, other 4%. Trauma: 25% abused once, 26% abused 2 to 5 times Excluded Children with mental retardation, pervasive developmental disorder, psychotic symptoms or serious mental illness or in short‐term care (< 12 months), or parents with a psychotic disorder or current substance abuse Setting Children were referred to the Center for Traumatic Stress in Children and Adolescents, Pittsburgh, USA | |
| Interventions | Cognitive‐behavioural therapy for sexually abused preschool children (CBT‐SAP) (n = 39 completing treatment) A short‐term treatment model for sexually abused preschool children and their parents over 12 weekly sessions of 40 to 50 minutes with the child and 50 minutes with the parent. Specific issues addressed with the child were safety and assertiveness, ambivalence towards the perpetrator, behaviours, fears and anxiety. Interventions included cognitive reframing, thought stopping, positive imagery and contingency programmes. Issues addressed with parents included ambivalence to the perpetrator and their belief in the abuse, attributions, management of their fear and anxiety, their own history of abuse, feelings towards the child, legal issues and emotional support and behavioural management for the child Non‐directive supportive therapy (NST) (n = 28 completing treatment) Support from an understanding and concerned professional over 12 weekly sessions of 40 to 50 minutes with the child and 50 minutes with the parent designed to reduce isolation, loneliness, hopelessness and anxiety; improve understanding of their feelings; and validate these feelings. The therapist did not make interpretations or offer directive advice but could help identify alternatives through non‐directive suggestions Therapists Both therapists were master’s level clinicians who had worked with sexually abused children for several years. Two therapists were trained in both treatments before the study began. Detailed treatment manuals were provided for both therapies. Weekly individual supervision was provided. All treatment sessions were audiotaped, and scores for compliance with the treatment model were rated as greater than 90% | |
| Outcomes | Behaviour Scale: Child Behavior Checklist Rater: parent When Post therapy and at 6‐ and 12‐month follow‐up | |
| Notes | ||
| Risk of bias | ||
| Bias | Authors' judgement | Support for judgement |
| Random sequence generation (selection bias) | Low risk | Children and their parents were randomised by Efron's biased coin toss to ensure the 2 groups were balanced in terms of perpetrator, type of abuse, gender and age |
| Allocation concealment (selection bias) | Unclear risk | Not reported |
| Blinding of participants (performance bias | Unclear risk | Participants could not be blinded, but both groups received a psychological therapy |
| Blinding of outcome assessment (detection bias) | Unclear risk | Outcome assessment could not be blinded, as all measures were self reported or parent reported |
| Incomplete outcome data (attrition bias) | High risk | Overall loss to follow‐up at the end of treatment was 22% and 50% at 6 and 12 months and was > 50% for the supportive therapy group at 6 and 12 months |
| Selective reporting (reporting bias) | Low risk | All outcomes appear to have been reported |
| Other bias | Low risk | No other bias was apparent |
| Methods | Randomised trial of sexual abuse‐specific CBT vs non‐directive supportive therapy | |
| Participants | Included (n = 82) Females 8 to 15 years of age who had experienced validated contact sexual abuse by someone ≥ 5 years older within the previous 6 months, had significant symptoms related to the abuse and had a non‐offending parent or primary caregiver able to participate in treatment. Participants were referred from a variety of sources. Mean age: 11 years. Female: 69%. Caucasian 60%, African American 37%, bi‐racial 2%, Hispanic 1%. Trauma exposure: 54% of participants experienced anal and/or vaginal intercourse, 33% were abused more than 10 times, and, for most, the abuse was accompanied by use of threatened or actual force Excluded Children with mental retardation, pervasive developmental disorder, active psychosis or substance abuse or serious medical illness, or whose caretaker was not long‐term (≥ 12 months) or had active psychosis or substance abuse Settting Urban outpatient child psychiatric programme specialising in the treatment of traumatic stress in children, USA | |
| Interventions | Sexual abuse‐specific CBT (n = 41) CBT methods with the child focused on depression, anxiety and behavioural difficulties and with the parent focused on parental emotional distress, enhanced support for the child and management of behavioural difficulties. Major components for the child included identification of feelings, stress inoculation techniques, gradual exposure exercises, cognitive processing of the abuse, education about healthy sexuality and safety skill building. Parental components paralleled those for the child, with the addition of building parenting management skills. Each of the 12 weekly sessions consisted of 45 minutes with the child and 45 minutes with the parent Non‐directive supportive therapy (n = 41) Therapists did not provide specific suggestions or directive advice but encouraged exploration of alternative attributions, behaviours and feelings. Issues were addressed as they were raised by child or parent. Interventions provided a high degree of non‐judgmental empathy and support; encouraged identification, clarification and acceptance of upsetting feelings; and re‐established trust and positive interpersonal expectations. Each of the 12 weekly sessions consisted of 45 minutes with the child and 45 minutes with the parent Both therapies Appropriate referrals to non‐therapeutic ancillary care were made when indicated, and mothers in either group with a DSM‐III‐R diagnosis were also offered a referral for individual therapy Therapists Both therapists had received a master's level degree in clinical social work and were trained and experienced in both models. Halfway through the programme, therapists swapped to the other treatment model. Both therapies were manualised. Therapists received weekly supervision, and sessions were audiotaped and audited weekly to ensure adherence, which was rated at > 90% | |
| Outcomes | Trauma‐related symptoms Scale:Trauma Symptom Checklist for Children (54‐item) Rater: child/adolescent Depression Scale: Children’s Depression Inventory (27‐item) Rater: child/adolescent Anxiety Scale: State‐Trait Anxiety Inventory for Children TSCC Rater: child/adolescent Behaviour Scale: Child Behavior Checklist Rater: parent When Post therapy and at 6‐ and 12‐month follow‐up | |
| Notes | Because loss to follow‐up was greater than 54% in the supportive therapy group, only loss to follow‐up data were used in this review | |
| Risk of bias | ||
| Bias | Authors' judgement | Support for judgement |
| Random sequence generation (selection bias) | Low risk | Random number series generated by computer |
| Allocation concealment (selection bias) | Unclear risk | Not reported |
| Blinding of participants (performance bias | Unclear risk | Participants could not be blinded, but both groups received a psychological therapy |
| Blinding of outcome assessment (detection bias) | Unclear risk | Outcome assessment could not be blinded, as all measures were child reported or parent reported |
| Incomplete outcome data (attrition bias) | High risk | Last observation carried forward was used to account for missing data, but loss to follow‐up was greater than 54% for the NST group at all intervals and was high overall: post therapy 40%, 6 months 44%, 12 months 52% |
| Selective reporting (reporting bias) | Low risk | All outcomes appear to have been reported |
| Other bias | Low risk | No other bias was apparent |
| Methods | Randomised trial of trauma‐focused CBT vs child‐centred therapy | |
| Participants | Included (n = 124) Children of mothers attending a community women’s health service in the United States, 7 to 14 years of age with ≥ 5 interpersonal violence (IPV)‐related PTSD symptoms, including ≥ 1 symptom from each of the 3 clusters, who were fluent in English and had an English‐speaking mother who was a direct victim of IPV. Mean age: 9.64 years. Female: 63. Ethnicity: white 69, black 41, bi‐racial 14. Only 14.5% no longer had contact with the perpetrator Excluded Significant development disorder, IQ < 80, serious psychotic symptoms in parent or child, living in an IPV shelter Settting Community women's centre for victims of interpersonal violence, Pittsburgh, USA, 2004 to 2009 | |
| Interventions | Trauma‐focused CBT (n = 64) Develops a narrative of the child’s experiences, corrects maladaptive cognitions and includes mastery of trauma reminders. Treatment included psychoeducation about trauma, how to develop individualised relaxation skills, expression and modulation of upsetting feelings and development of cognitive coping skills. Some of the session time was given to joint child‐parent sessions in which the child was encouraged to discuss his or her IPV experience and safety plans. Child and parent each attended eight 45‐minute individual therapy sessions. The same therapist saw child and parent Child‐centred therapy (n = 60) Aimed at establishing an empowering and trusting relationship between therapist and client by encouraging the child and parent to direct the content of their own treatment. The therapist provided active listening, reflection, accurate empathy, encouragement to talk about feelings and belief in the client’s ability to develop positive coping strategies. Child and parent each attended eight 45‐minute individual therapy sessions. The same therapist saw child and parent Therapists Three master's‐level social workers providing child therapy at the Women’s Center and Shelter were trained in the TF‐CBT model and in distinctions between TF‐CBT and Child‐centred therapy models. Workers were supervised and adherence to therapy was checked, with a blinded rating of 25% of randomly selected sessions and ratings greater than 90%. A manual that differentiated the 2 therapies was also available | |
| Outcomes | PTSD symptoms Scale: Schedule for Affective Disorders and Schizophrenia for School Age Children ‐ Present and Lifetime version (K‐SADS‐PL) Scores: change from baseline in total scores and in avoidance, hyperarousal and re‐experiencing subscores Rater: Trained research co‐ordinators interviewed child and parent Scale: UCLA PTSD Reaction Index Rater: child Depression Scale: Children’s Depression Inventory Rater: child Anxiety Scale: Screen for Child Anxiety‐Related Emotional Disorders (SCARED) Rater: child Behaviour Scale: Child Behavior Checklist Rater: parent When Post therapy | |
| Notes | K‐SADS‐PL data were used for PTSD symptoms | |
| Risk of bias | ||
| Bias | Authors' judgement | Support for judgement |
| Random sequence generation (selection bias) | Low risk | Random assignment to treatment by computer‐generated random number series. However, 24 received the same treatment as the randomised sibling |
| Allocation concealment (selection bias) | Low risk | Randomisation lists were locked in therapists’ offices |
| Blinding of participants (performance bias | Unclear risk | Participants could not be blinded, but both groups received a psychological therapy |
| Blinding of outcome assessment (detection bias) | Unclear risk | Two project co‐ordinators blinded to treatment assignment were trained in administration of the K‐SADS‐PL, but all other measures were child‐reported or parent report |
| Incomplete outcome data (attrition bias) | High risk | Last observation carried forward was used to account for missing data, but loss to follow‐up was 40% |
| Selective reporting (reporting bias) | Low risk | All outcomes appear to have been reported |
| Other bias | Low risk | No other bias was apparent |
| Methods | Randomised trial of a Web‐based psychoeducation intervention vs no treatment | |
| Participants | Included (n = 85) Children between 7 and 16 years of age recruited from paediatric surgical wards over 12 months, hospitalised overnight, who had acquired an accidental or unintentional injury including mild traumatic brain injury, with family Internet access. Mean age: 10.90 years. Female: 26. Type of injury: 41 falls, 13 sports, 12 MVA, 6 burns, 13 other. Mean injury severity score, 7 Excluded Parents' or child’s English was inadequate for completion of questionnaires, child had acquired a moderate to severe head injury, injury was the result of suspected intentional trauma Setting Children’s hospital in Queensland, Australia, 2007 | |
| Interventions | Web‐based intervention (n = 44) Consisted of a booklet for parents containing information regarding common child reactions, their likely time course and how parents can best assist their child’s emotional recovery, as well as a Website for children. Both aimed to normalise and relieve trauma reactions and incorporated practical tools based on cognitive‐behavioural and resiliency strategies including relaxation, coping skills, problem solving, identification of strengths and reflections on trauma Control group (n = 41) Assessed at each interval | |
| Outcomes | PTSD symptoms Scale: Trauma Symptom Checklist for Children‐A (TSCC‐A; 44‐item) Rater: child/adolescent Scale: Impact of Events Scale‐Revised (IES‐R; 22‐item): intrusion, avoidance and hyperarousal Rater: parent Depression Scale: TSCC‐A: depression Rater: child/adolescent Anxiety Scale: TSCC‐A: anxiety Rater: child/adolescent When Post intervention (4 to 6 weeks) and at 6 months post injury | |
| Notes | ||
| Risk of bias | ||
| Bias | Authors' judgement | Support for judgement |
| Random sequence generation (selection bias) | Low risk | Computerised random number generator in Microsoft Excel |
| Allocation concealment (selection bias) | Unclear risk | Not reported |
| Blinding of participants (performance bias | High risk | Participants probably were aware of whether they had been allocated to treatment or no treatment groups |
| Blinding of outcome assessment (detection bias) | High risk | Outcome assessments could not be blinded, as all were self reported or parent reported |
| Incomplete outcome data (attrition bias) | High risk | Analysis was based on last observation carried forward, but loss to follow‐up was 34% post therapy and 31% at 6 months |
| Selective reporting (reporting bias) | Low risk | All outcomes appear to have been reported |
| Other bias | Low risk | No other bias was apparent |
| Methods | Randomised trial of trauma‐focused CBT vs no treatment in children who had been physically abused | |
| Participants | Included (n = 18) Physically abused children who were referred by local community organisations and other local child protection institutes. Mean age: 11.3 years. Female: 0. Types of trauma: All had undergone physical abuse (most within 4 to 6 months before therapy) and had clinical symptoms of PTSD and depression for ≥ 5 weeks before. treatment. Mean PTSS‐C: TF‐CBT 23.66, control 24.55 (moderate to severe range) Excluded Not stated Setting Child care unit at Institute for Family Health (Jordan 2012) | |
| Interventions | Trauma‐focused CBT (n = 9) Trauma‐related cognitions and feelings, along with skills training. Parents also received ‘Better Parenting Skills Education’. Ten sessions of 60 minutes (90 minutes for 2 Better Parenting sessions) for children and parents over 2 weeks Therapists Two qualified and accredited registered child counsellors who had previous experience working with abused children and had attended 6 days of TF‐CBT training. Counsellors were supervised for every session and via meetings or email. Sessions were directly monitored by the supervisor Control (n = 9) No treatment | |
| Outcomes | PTSD symptoms Scale: Post‐Traumatic Stress Symptoms in Children (PTSS‐C; 30‐item) Rater: child/adolescent Depression Scale: Children’s Depression Inventory (27‐item) Rater: child/adolescent When Post treatment and at 4‐month follow‐up | |
| Notes | PTSD symptom data were not added to meta‐analyses because the effect sizes were several times higher than the overall estimate and contributed substantial heterogeneity | |
| Risk of bias | ||
| Bias | Authors' judgement | Support for judgement |
| Random sequence generation (selection bias) | Unclear risk | Not described |
| Allocation concealment (selection bias) | Unclear risk | Not described |
| Blinding of participants (performance bias | High risk | Control group appears to have been given no treatment |
| Blinding of outcome assessment (detection bias) | High risk | Self report measures were used, and participants probably realised whether or not they were receiving treatment |
| Incomplete outcome data (attrition bias) | Low risk | Follow‐up appears to have been 100% |
| Selective reporting (reporting bias) | Unclear risk | Protocol not identified |
| Other bias | Unclear risk | Comparison between groups not explored |
| Methods | Randomised trial of family therapy vs treatment as usual | |
| Participants | Included (n = 30) Treatment‐seeking adolescents who could recollect ≥ 1 childhood unwanted/forced contact sexual abuse. Mean age: 14.8 years. Female: 88%. African American 46%, white 37.5%, Native American 4.2%, bi‐racial 8.3% and Hispanic 4%. Age at first/only abuse: 4 to 15 years. Mean time since most recent assault: 3.7 years; 23 reported other traumatic events Excluded Adolescents with mental retardation Setting Therapy was delivered through the outpatient clinic and by an outreach programme at an urban clinic specialising in treatment of trauma in the USA | |
| Interventions | Risk reduction through family therapy (RRFT) (n =15) RRFT was developed to reduce the risk of substance use, other high‐risk behaviours and trauma‐related psychopathology in adolescents who had experienced child sexual abuse. RRFT was built upon the principles and interventions applied in multi‐system therapy (MST) and trauma‐focused cognitive‐behavioural therapy (TF‐CBT). The protocol has 7 components: psychoeducation, coping, family communication, substance abuse, PTSD, healthy dating and sexual decision making and re‐victimisation risk reduction. Strategic family therapy is utilised to help the family define problems and work together to find solutions. Weekly sessions of 60 to 90 minutes with the therapist were held, with adolescents and caregivers individually and as a family. The order of and time spent on each component was determined by the needs of each youth and family. A mean of 23 sessions were completed Treatment as usual (TAU) (n =15) No single treatment emerged as consistently delivered across youth and families assigned to the TAU group. The mean number of sessions was 13 Therapists Participants in both groups were treated by clinical psychology graduate students completing a predoctoral internship. RRFT adherence was assessed by review of randomly selected audiotaped sessions (2 per client per month), weekly individual supervision by the treatment developer (a licenced clinical psychologist) and an RRFT adherence checklist completed by therapists immediately after completion of each session. TAU therapists were supervised by other licenced psychologists in the clinic | |
| Outcomes | Trauma symptoms Scale: UCLA PTSD Index Rater: adolescent, parent Depression Scale: CDI Rater: adolescent Behaviour Scale: Behavioral Assessment System for Children (BASC‐2) Rater: adolescent, parent When Post therapy and at 3‐ and 6‐month follow‐up | |
| Notes | ||
| Risk of bias | ||
| Bias | Authors' judgement | Support for judgement |
| Random sequence generation (selection bias) | Low risk | Participants were randomly assigned by computerised block randomisation |
| Allocation concealment (selection bias) | Unclear risk | Not reported |
| Blinding of participants (performance bias | High risk | Participants probably were aware of whether they had been allocated to treatment or no treatment groups |
| Blinding of outcome assessment (detection bias) | High risk | Outcome assessment could not be blinded, as all were self‐reported or parent report |
| Incomplete outcome data (attrition bias) | Low risk | Post therapy, 7% were lost to follow‐up, but imputed data appear to have been used, and none were lost to follow‐up at 3 months |
| Selective reporting (reporting bias) | Unclear risk | Parent‐rated BASC‐2 scores were not reported |
| Other bias | Low risk | No other bias was apparent |
| Methods | Randomised trial of CBT for child only, CBT for non‐offending mother only, CBT for non‐offending mother and child and standard community care | |
| Participants | Included (n = 100) Children 7 to 13 years of age who had contact sexual abuse substantiated by the Division of Youth and Family Services or the prosecutor’s office with ≥ 3 symptoms of PTSD, including ≥ 1 avoidance or re‐experiencing symptom. Mean age: 9.8 years. Female: 83%. Caucasian 72%, African American 20%, Hispanic 6%, other 2%. Time since last abuse: ≤ 6 months 66%, 6 months to 2 years 16%, > 2 years 18% Excluded Children with severe developmental delay, psychosis, ongoing unsupervised contact with perpetrator, danger to self or others or mother unwilling to take part Setting Centre for Children's Support, USA | |
| Interventions | CBT therapies (child only n = 25, mother only n = 25, combined n = 25) Therapies with the child focused on coping skills training, gradual exposure and processing, education and prevention skills training. Parent therapy concentrated on education, coping, communication, modelling, gradual exposure and behaviour management skills. Individual treatment sessions were 12 weekly treatments of 45 minutes each and 90 minutes for the combined child and parent group Control group (n = 25) Participants were given information about their children’s symptom patterns and were strongly encouraged to seek therapy Therapists Mental health therapists were intensively trained in the CBT intervention, including 1 pilot case. Treatment was manualised, and therapists were supervised weekly and monitored for adherence/fidelity | |
| Outcomes | PTSD diagnosis Assessment: Schedule for Affective Disorders and Schizophrenia for School‐Aged Children (K‐SADS‐E) (DSM‐III‐R criteria) Rater: clinician PTSD symptoms Scale: K‐SADS‐E Rater: clinician Depression Scale: Child Depression Inventory (27‐item) Rater: child Anxiety Scale: State/Trait Anxiety Inventory for Children: state, trait (20‐item) Rater: child Behaviour Scale: Child Behavior Checklist: internalising, externalising (118 behaviour problem items) Rater: parent When Post therapy and at 3‐, 6‐, 12‐ and 24‐month follow‐up | |
| Notes | Loss to follow‐up was greater than 40% in the control group for PTSD and behaviour at 3 and 12 months | |
| Risk of bias | ||
| Bias | Authors' judgement | Support for judgement |
| Random sequence generation (selection bias) | Unclear risk | Not reported |
| Allocation concealment (selection bias) | Unclear risk | Not reported |
| Blinding of participants (performance bias | High risk | Participants probably were aware of whether they had been allocated to treatment or no treatment groups |
| Blinding of outcome assessment (detection bias) | High risk | Most measures were based on child or parent report |
| Incomplete outcome data (attrition bias) | High risk | Completer analysis reported, and follow‐up data reported only for those who were available at all 4 measurement intervals; loss to follow‐up 23% |
| Selective reporting (reporting bias) | Unclear risk | All outcomes were reported at all intervals, except anxiety and behaviour, which were reported only post therapy |
| Other bias | Low risk | No other bias was apparent |
| Methods | Randomised trial of a CBT group vs a supportive therapy group | |
| Participants | Included (n = 44) Children 2 to 8 years of age referred to the Regional Child Abuse Diagnostic and Treatment Centre. All had credible disclosures of sexual abuse. Mean age: 5.45 years. Female: 27. Ethnicity: white 28, black 1, Hispanic 1, other 6 Excluded Children with, or children of parents with, psychotic disorders, severe developmental delay and/or behaviours that were dangerous to themselves or others Setting Regional Child Abuse Diagnostic and Treatment Centre, USA | |
| Interventions | CBT (21 completers) Therapy consisted of 11 weekly sessions of 1 hour and 45 minutes with children and parents individually and 15 minutes for a joint parent and child activity. Sessions utilised an interactive format and a workbook. Parent sessions assisted parents to cope with their emotions, so they could support their children, provide education about communication skills and teach behaviour management skills. The main objectives were to help children communicate and cope with their feelings, identify okay and not okay touches and learn abuse response skills. An additional 15 minutes was used for a combined mother/child activity Supportive therapy (23 completers) The main objectives of supportive therapy with children were the same as with the CBT group but used a didactic approach. Parent sessions were based on self help models and were less structured than CBT sessions for parents. Eleven weekly sessions of 1 hour and 45 minutes of counselling were provided for children and parents Both Therapists for both groups were checked for adherence and were supervised weekly | |
| Outcomes | PTSD symptoms Scale: Schedule for Affective Disorders and Schizophrenia for School‐Age Children ‐ Epidemiologic version (K‐SADS‐E) Rater: parent Behaviour Scale: Child Behavior Checklist Rater: parent When Post therapy and at 3‐month follow‐up | |
| Notes | PTSD symptom scores were skewed | |
| Risk of bias | ||
| Bias | Authors' judgement | Support for judgement |
| Random sequence generation (selection bias) | Low risk | Randomly determined by computer programme |
| Allocation concealment (selection bias) | Unclear risk | Not reported |
| Blinding of participants (performance bias | Unclear risk | Both groups received a psychological therapy |
| Blinding of outcome assessment (detection bias) | Unclear risk | Both measures were based on parent report |
| Incomplete outcome data (attrition bias) | High risk | Data were reported for completing participants, and loss to follow‐up was 30% at all intervals |
| Selective reporting (reporting bias) | Low risk | All outcomes appear to have been reported |
| Other bias | Low risk | No other bias was apparent |
| Methods | Randomised trial of trauma narrative therapy + trauma‐focused CBT vs trauma‐focused CBT | |
| Participants | Included (n = 210) Children 4 to 11 years of age referred for verified contact sexual abuse with ≥ 5 PTSD symptoms, including 1 from each cluster. Mean age: 7.7 years. Female: 96/158 at follow‐up. Caucasian 103, African American 22, Hispanic 11, other 22 Excluded Children with an IQ < 70, with continued unsupervised face‐to‐face contact with perpetrator or with parent who had a serious medical or mental health illness that would impact participation Setting New Jersey and Pennsylvania, USA | |
| Interventions | Trauma‐focused narrative therapy + CBT (n = 104) As for CBT + children, were encouraged to develop a detailed trauma narrative about the sexual abuse, which they processed and reviewed with the caregiver and therapist Trauma‐focused CBT (n = 106) Included psychoeducation and parenting, relaxation, affective modulation, cognitive coping, in vivo exposure, enhanced safety and future development, delivered as 8 or 16 weekly conjoint parent/child sessions of 90 minutes each. Mean number of sessions attended: 7.36 and 13.92, respectively Therapists Therapists had graduate degrees in psychology, clinical social work or a related field with ≥ 3 years of clinical experience. They were supervised weekly, and adherence to inclusion or non‐inclusion of trauma narrative was checked | |
| Outcomes | PTSD symptoms Scale: Schedule for Affective Disorders and Schizophrenia for School‐Age Children ‐ Present and Lifetime version (K‐SADS‐PL) Rater: clinician administered individually to child and parent Depression Scale: Children's Depression Inventory (27‐item) Rater: child Anxiety Scale: Multidimensional Anxiety Scale for Children (39‐item) Rater: child Behaviour Scale: Child Behavior Checklist (120‐item) Rater: parent rating When Post therapy and at 6‐ and 12‐month follow‐up | |
| Notes | Data for 8‐ and 16‐week groups were pooled | |
| Risk of bias | ||
| Bias | Authors' judgement | Support for judgement |
| Random sequence generation (selection bias) | Unclear risk | Children were randomised to groups, but 17 siblings were allocated to the same intervention as the first randomised sibling |
| Allocation concealment (selection bias) | Unclear risk | Not reported |
| Blinding of participants (performance bias | Unclear risk | Both groups were given a psychological therapy |
| Blinding of outcome assessment (detection bias) | Unclear risk | 'The project coordinator who was blind to assignment conducted assessments'; however, most scales were child‐reported or parent report |
| Incomplete outcome data (attrition bias) | Unclear risk | ITT analysis was used, but follow‐up means and SDs were reported. Loss to follow‐up: 25% |
| Selective reporting (reporting bias) | Low risk | All outcomes appear to have been reported |
| Other bias | Low risk | No other bias was apparent |
| Methods | Parallel RCT of trauma‐focused CBT vs EMDR in children and adolescents recruited from a trauma centre | |
| Participants | Included (n = 48) Between 8 and 18 years of age; command of the Dutch language; exposure to ≥ 1 single traumatic event; last traumatic event occurred ≥ 4 weeks before the first measurement; partial or full PTSD. Mean age: 13 years. Female: 30. Majority were Dutch (77%): 46% with Dutch mothers and 33% with Dutch fathers. Types of trauma: accidents 23%, sexual assaults 17%, threats (with weapon) 13%, kidnapping 10%, serious illness 7%, other 30%. Exposure to domestic violence 44%, sexual assault 39%, multiple‐event trauma 17%. Seven children in the TF‐CBT condition were diagnosed with PTSD on the ADIS‐P: 6 fulfilled a partial diagnosis and 4 had no PTSD. EMDR condition: 9 children in the EMDR group fulfilled a PTSD diagnosis, 5 fulfilled a partial diagnosis and 1 had no diagnosis (Note: This accounts for only 32 participants) Excluded Children showing clinical signs of psychotic disorder, substance use disorder, pervasive developmental disorder (e.g. autism) or acute suicidality Setting Department of Child and Adolescent Psychiatry Trauma Centre, The Netherlands, 2009 to 2012 | |
| Interventions | Trauma‐focused CBT (n = 23) The following components were included in this programme: psychoeducation, relaxation, affective expression and regulation, cognitive coping, gradual exposure through creation of child’s trauma narrative, parent management skills, conjoint child/parent session, enhanced future safety and development. Children worked on their trauma narrative in sessions 4, 5 and 6 and shared the narrative with their parents in session 7 Parents were invited to also join sessions 1, 2, 3 and 8 or spent 15 minutes of a session alone with the therapist Therapy was delivered over 8 weekly sessions of 60 minutes but could be terminated earlier if all modules were administered, the child’s score on the CRIES‐13 was < 10 and the child and parent agreed EMDR (n = 25) The main components of this protocol include the following: psychoeducation about the trauma and therapy, preparation of the target memory, desensitisation of the memory, identification and processing of body sensations, re‐evaluation of the target. Desensitisation of the memory started in session 3 and was pursued until session 7. Children were asked to keep the target image in mind while simultaneously concentrating on the distracting stimulus (typically following the finger of the therapist). After episodes of 30 minutes, the child was asked to report what he or she had just experienced. This was repeatedly done until the target did not induce distress in the child. Parents were invited to join 15 minutes of each session, or to spend this time alone with the therapist. Therapy was delivered over 8 weekly sessions of 60 minutes Therapists Eight experienced CBT therapists were trained in both TF‐CBT and EMDR before the study. Four were EMDR practitioners, and 2 had competed advanced training. Supervision was provided weekly by an expert on EMDR for children and experts on TF‐CBT. Therapists filled out protocol‐specific checklists and recorded each session on video. A random selection of 25% of all videos was evaluated by therapists for treatment integrity (not clear which therapists). Treatment integrity was scored as 75% for EMDR and 73% for TF‐CBT | |
| Outcomes | PTSD diagnosis Scale: ADIS‐P PTSD (47‐item) Rater: parent PTSD symptoms Scale: improvement on CAPS‐CA Rater: clinician Scale: CRIES‐13 Rater: child/adolescent Behaviour Scale: SDQ domains Rater: parent Anxiety Scale: Revised Child Anxiety and Depression Scale Rater: child/adolescent and parent When Post treatment | |
| Notes | Starting date: 1 June 2009 Completion date: proposed completion December 2009 Contact information: Dr. R.J.L. Lindauer Academic Medical Center (AMC), Medical Research B.V. | |
| Risk of bias | ||
| Bias | Authors' judgement | Support for judgement |
| Random sequence generation (selection bias) | Low risk | “A methodologist prepared the randomization list” |
| Allocation concealment (selection bias) | Low risk | "The researcher managing the randomization list directly communicated the assigned condition to the therapist” |
| Blinding of participants (performance bias | Low risk | Participants were not blinded, but both groups received therapy |
| Blinding of outcome assessment (detection bias) | Low risk | “Assessors were blinded to the allocated treatment condition of the children” |
| Incomplete outcome data (attrition bias) | Unclear risk | “Multiple imputation” was used; overall loss to follow‐up was 25%, but 68% were lost to follow‐up for measures other than PTSD symptoms in the EMDR group |
| Selective reporting (reporting bias) | Unclear risk | CRIES‐13 scores not reported |
| Other bias | Low risk | No other biases were identified |
| Methods | Randomised trial of CBT or supportive therapy | |
| Participants | Included (n = 32) Sexually abused children and adolescents 6 to 17 years of age referred to a Victims' Resource Institute. Mean age: 10 years. Female: 19. Caucasian 48%, Hispanic 40%, African American 8%, other 4% Excluded Children and adolescents with mental retardation, brain damage, psychotic or autistic behaviour, learning disabilities, perpetrators of violence or gang members, substance abusers and conduct‐disordered children Setting University of Houston, USA | |
| Interventions | CBT (n = 22) Participants were taught to normalise their responses and skills to manage their affective, cognitive and behavioural responses to the traumatic event, and to identify and address deficits in interpersonal function. Therapy was based on 20 weekly sessions but could vary depending on participant need Supportive therapy (n = 10) The goal of therapy was to identify and encourage the participant's use of existing coping behaviours and to reflect on and validate their experiences and emotional reactions. A central component was the therapeutic relationship based on genuineness, unconditional positive regard for the participant and accurate empathic understanding. Therapy was based on 20 weekly sessions but could vary depending on need Therapists Therapists were 10 'upper level' graduate students in clinical psychology supervised weekly by PhD‐level clinical psychologists. Both therapies were manualised and all progress notes checked for use of CBT elements in CBT group and non‐use of CBT in supportive therapy group. CBT elements were used in 86% of CBT sessions and in 57% of supportive therapy sessions | |
| Outcomes | PTSD symptoms Scale: Impact of Event Scale‐Revised: avoidance and intrusion (15‐item) Rater: clinician Depression Scale: Children's Depression Inventory (27‐item) Rater: clinician When Every second week during treatment | |
| Notes | Only slope and intercept of outcome growth curves were reported. No significant differences were noted between the 2 treatments | |
| Risk of bias | ||
| Bias | Authors' judgement | Support for judgement |
| Random sequence generation (selection bias) | Unclear risk | Not reported |
| Allocation concealment (selection bias) | Unclear risk | Not reported |
| Blinding of participants (performance bias | Unclear risk | Participants could not be blinded, but all participants received a psychological therapy |
| Blinding of outcome assessment (detection bias) | Unclear risk | Clinician‐rated outcomes were used, but blinding of assessment was not reported |
| Incomplete outcome data (attrition bias) | High risk | Completer analysis reported. Loss to follow‐up: 22% |
| Selective reporting (reporting bias) | Low risk | All outcomes appear to have been reported |
| Other bias | Low risk | No other bias was apparent |
| Methods | Randomised trial of motivation‐adaptive skills‐trauma resolution + EMDR vs wait list | |
| Participants | Included (n = 65) Traumatised adolescents with conduct problems in Youth Protective Services reporting traumatic events with high impact on the Lifetime Incidence of Traumatic Events questionnaire. Participants were French‐speaking and 13 to 17 years of age; 25 were female. Participants were exposed to a mean 4.4 types of trauma Excluded Adolescents with psychosis, suicidal or mentally retarded Setting Youth Protective Services in Quebec, Canada, 2005 to 2006 | |
| Interventions | Motivation ‐ Adaptive Skills ‐ Trauma Resolution (MASTR) + EMDR (n = 33) Consisted of 12 weekly individual sessions. Sessions 1 to 4 aimed to establish rapport, assess history, identify goals, visualise a positive future and develop a case formulation and treatment plan. Sessions 5 to 8 covered self management skills, avoidance of high‐risk situations and imaginal rehearsal of behavioural choices. Sessions 9 to 12 were devoted to trauma resolution by EMDR. A manualised EMDR protocol with minor age‐appropriate modifications was used. Participants in the MASTR‐EMDR group continued to receive other types of therapy. Participants attended a mean 11 sessions over 8 months Wait list control (n = 32) Among the wait list group, 57% received another form of therapy and attended a mean 17 sessions over 8 months Therapists EMDR was provided by 2 licenced master's‐level therapists who together had 30 years of experience working with youth, had completed EMDR training and received ongoing supervision from the developer of MASTR. Treatment fidelity (of a random selection of 30% of sessions) was assessed as 94% | |
| Outcomes | PTSD diagnosis Scale: Diagnostic Interview Schedule for Children Rater: not clear, appear to have been research assistants PTSD symptoms Scale: Trauma Symptom Checklist for Children (TSCC; 54‐item) Rater: adolescent Anxiety Scale: TSCC Rater: adolescent Depression Scale: Child Behavior Checklist (118‐item) Rater: parent When Post therapy and at 3 months | |
| Notes | Although participants in the MASTR‐EMDR group continued to receive other types of therapy, this was not described | |
| Risk of bias | ||
| Bias | Authors' judgement | Support for judgement |
| Random sequence generation (selection bias) | Unclear risk | Not reported |
| Allocation concealment (selection bias) | Unclear risk | Not reported |
| Blinding of participants (performance bias | High risk | Participants probably were aware of whether they were in the wait list or therapy group |
| Blinding of outcome assessment (detection bias) | High risk | Research assistants were not 'consistently blind to the treatment condition', and measures were self reported or parent reported |
| Incomplete outcome data (attrition bias) | High risk | Only data available for the 40 participants assessed post treatment and at 3 months follow‐up were reported (loss to follow‐up: EMDR 42%, control 34%) |
| Selective reporting (reporting bias) | Low risk | All outcomes appear to have been reported |
| Other bias | High risk | Twice as many males (48% vs 26%) were included; more came from low‐income families in the control group (75% vs 41%). Nearly twice as many had received a diagnosis of PTSD (37% vs 19%), and PTSD symptoms were greater (6.4 vs 3.7) in the treatment group |
| Methods | Randomised trial of psychoeducation vs wait list | |
| Participants | Included (n = 50) High school students 14 to 18 years of age who had experienced and/or witnessed violent events that were significantly stressful and/or traumatic. Mean age: 16.1 years. Female: 30. Caucasian 20, Hispanic 10, African American 8. Overall trauma exposure scores for traumatic violence and physical or verbal abuse were moderate but for indirect violence were high Excluded Students in the behavioural disorders class, those with ≥ 5 absences in a semester, those who could not behave appropriately (angry, anxious or impulsive) during the initial interview Setting High school in USA, 1998 | |
| Interventions | Group psychoeducation (n = 25) Group intervention was designed to provide education about the effects of trauma and violence and the connection of these effects to re‐enactment and risk‐taking behaviours. Key topics over the 8 weekly 70‐minute sessions were prevalence of violence and trauma, violence‐related trauma and PTSD, defences, avoiding further trauma and violence, re‐exposure, re‐enactment, combating helplessness and the role of family in combating helplessness Wait list control (n = 25) Therapists It was not reported whether the protocol was manualised, whether supervision occurred and whether fidelity/adherence was checked | |
| Outcomes | PTSD symptoms Scale: Impact of Event Scale‐Revised (22‐item) Rater: adolescent Behaviour Scale: Youth Self‐Report (112 behavioural items) Rater: adolescent When Post therapy | |
| Notes | ||
| Risk of bias | ||
| Bias | Authors' judgement | Support for judgement |
| Random sequence generation (selection bias) | Low risk | Each student was assigned by a randomly generated number and was successively placed into 1 of 2 treatment groups or wait list |
| Allocation concealment (selection bias) | Unclear risk | Not reported |
| Blinding of participants (performance bias | High risk | Quite probable that participants were aware of whether they were in the wait list or therapy group |
| Blinding of outcome assessment (detection bias) | High risk | Not reported, but measures were self reported |
| Incomplete outcome data (attrition bias) | Unclear risk | Completer analysis reported; loss to follow‐up was 6% |
| Selective reporting (reporting bias) | Unclear risk | All outcomes appear to have been reported |
| Other bias | Unclear risk | Data from a student who joined the treatment group after randomisation were included |
| Methods | Randomised trial of EMDR vs CBT | |
| Participants | Included (n = 16) Sixth grade girls 12 to 13 years of age from an urban school in Iran who reported contact sexual abuse occurring ≥ 6 months previously Excluded Girls subjected to ongoing abuse Setting University clinic, Iran | |
| Interventions | CBT (n = 8) Sessions focused on skill development and exposure and were limited to 45 minutes, with a maximum 12 and a minimum 10 sessions. Treatment was terminated earlier if the Subjective Units of Distress score was between 0 and 2 and abuse‐related anxiety symptoms were 25% or less. Homework followed all sessions (a total of 10 to 15 hours) and included checklists, drawings and listening to tapes of the exposure narrative. Parents attended a psychoeducation session within the first 2 weeks EMDR (n = 8) Focus on the identified trauma memory was not as strict as with the CBT group. The EMDR therapist was allowed to treat spontaneous trauma memories that arose during work with the index trauma but was not allowed to systematically work through all trauma memories. The maximum 12 sessions (with no minimum) were limited to 45 minutes each, but most lasted approximately 30 minutes. Homework was minimal and was limited to drawing a ‘safe place’ on 1 occasion. Treatment was terminated earlier if the Subjective Units of Distress score was 0 to 2 and positive self statements were 6 or 7 on a 7‐point scale related to the abuse. Parents attended a psychoeducation session within the first 2 weeks Therapists Each treatment was manualised. Therapists were clinical psychologists experienced in working with children and trained in the respective therapies | |
| Outcomes | PTSD symptoms Scale: Child Report of Post‐Traumatic Symptoms (26‐item) Rater: child Scale: Parent Report of Post‐Traumatic Symptoms (32‐item) Rater: parent When Post therapy | |
| Notes | ||
| Risk of bias | ||
| Bias | Authors' judgement | Support for judgement |
| Random sequence generation (selection bias) | Low risk | Randomised by picking names out of a hat |
| Allocation concealment (selection bias) | Unclear risk | Not reported |
| Blinding of participants (performance bias | Unclear risk | Blinding was not possible, but both groups received a psychological therapy |
| Blinding of outcome assessment (detection bias) | Unclear risk | Child‐ and parent‐reported outcomes were used |
| Incomplete outcome data (attrition bias) | Unclear risk | Completer analysis reported. Loss to follow‐up: 13% |
| Selective reporting (reporting bias) | Low risk | All outcomes appear to have been reported |
| Other bias | Low risk | No other bias was apparent |
| Methods | Randomised trial of Surviving Cancer Competently Program or wait list | |
| Participants | Included (n = 150) Adolescent survivors of childhood cancer 11 to 19 years of age who had completed treatment within the previous 1 to 10 years and their families. Female: 51%. Ethnicity: white 85%, black 9%, Hispanic 5%, Asian 1% Excluded Adolescents who had relapsed, had mental retardation, lacked fluency in English or lived more than 150 miles from the hospital Setting Children's Hospital, Philadelphia, USA | |
| Interventions | Surviving Cancer Competently Program (n = 76) A manualised family group programme integrating CBT and family therapy principles over 1 day. The 4 sessions covered 'How Cancer Has Affected Me and My Family', 'Coping Skills', 'Getting on With Life' and 'Family Health and Our Future' Wait list control (n = 74) Therapists Therapists included psychologists, nurses and social workers who were given 12 hours of training. Treatment adherence was assessed as 96% across sessions | |
| Outcomes | PTSD symptoms Scale: Impact of Events Scale ‐ Revised (22‐item) Rater: child/adolescent Scale: UCLA PTSD Reaction Index (20‐item) Rater: child/adolescent Anxiety Scale: Revised Children's Manifest Anxiety Scale (RCMAS; 37‐item) Rater: child/adolescent When At 3 to 5 months after therapy | |
| Notes | Sample sizes for the RCMAS were not clear SDs were calculated from 95% CIs | |
| Risk of bias | ||
| Bias | Authors' judgement | Support for judgement |
| Random sequence generation (selection bias) | Unclear risk | Stratified randomisation by age group (11 to 14 and 15 to 18 years) and gender, but no other details given |
| Allocation concealment (selection bias) | Unclear risk | Not reported |
| Blinding of participants (performance bias | High risk | Quite probable participants were aware of whether they were in the wait list or therapy group |
| Blinding of outcome assessment (detection bias) | High risk | All measures were self reported |
| Incomplete outcome data (attrition bias) | High risk | Imputed values were given, but loss to follow‐up was 38% in the intervention group compared with 7% in the wait list control group; overall loss to follow‐up was 26% |
| Selective reporting (reporting bias) | Low risk | All outcomes appear to have been reported |
| Other bias | Low risk | No other bias was apparent |
| Methods | Randomised trial of EMDR vs wait list | |
| Participants | Included (n = 27) Children 6 to 12 years of age admitted to a hospital emergency department after a motor vehicle accident, and scoring ≥ 12 on the Child Post‐Traumatic Stress – Reaction Index, or with ≥ 2 DSM‐IV criteria for PTSD. Mean age: 8.93 years. Female: 12. Mean time since accident: 8.35 months Excluded Children taking psychotropic medication; those with a concurrent psychological condition, with history of sexual or physical abuse or neglect, with head injury with persistent associated neurological dysfunction or scoring < 12 on the Glasgow Coma Scale Setting Not reported, Australian study | |
| Interventions | EMDR (n = 14) Four 60‐minute sessions over 6 weeks included client history and assessment, engagement and orientation to EMDR, assessment of target traumatic memory and desensitisation, instillation, body scan and closure Wait list control (n = 13) Received EMDR after 6 weeks Therapist All sessions were delivered by the same doctoral level psychologist, who had received advanced EMDR training. Fidelity was rated as acceptable to highly acceptable by an experienced child clinical psychologist with advanced EMDR training | |
| Outcomes | PTSD symptoms Scale: Child Post‐Traumatic Stress ‐ Reaction Index Rater: child, parent Scale: Impact of Events Scale (IES) Rater: parent Anxiety Scale: State Trait Anxiety Inventory Rater: child Depression Scale: Children’s Depression Scale Rater: child Behavioural problems Scale: Child Behavior Checklist Rater: parent When Post therapy and at 3 and 12 months, but the wait list group received therapy after 6 weeks; therefore, only post‐treatment data can be used | |
| Notes | ||
| Risk of bias | ||
| Bias | Authors' judgement | Support for judgement |
| Random sequence generation (selection bias) | Unclear risk | Not reported |
| Allocation concealment (selection bias) | Unclear risk | Not reported |
| Blinding of participants (performance bias | High risk | Quite probable participants were aware of whether they were in the therapy or wait list group |
| Blinding of outcome assessment (detection bias) | High risk | All measures were self reported |
| Incomplete outcome data (attrition bias) | Unclear risk | Loss to follow‐up was 11% |
| Selective reporting (reporting bias) | Low risk | All outcomes appear to have been reported |
| Other bias | High risk | More females were included (9 vs 3) and IES scores (34.64 vs 22.33) were significantly higher in the wait list group |
| Methods | Randomised trial of a classroom‐based psychoeducation and skills intervention with or without an additional trauma and grief component | |
| Participants | Included (n = 159) War‐exposed adolescents in year 1 to 3 of high school who had undergone significant trauma exposure, reporting significant current distress and functional impairment. Mean age: 15.9 years. Females: 82. 73% had experienced a direct life threat Excluded Students with signs of psychosis, disruptive behavioural or substance abuse problems; those who represented a risk to themselves or others; those unable to participate in groups Setting Ten secondary schools in postwar central Bosnia, 2000 to 2001 | |
| Interventions | Trauma and grief‐focused component therapy + psychoeducation and skills intervention (n = 77) Included a trauma and grief‐focused group, which provided trauma and grief processing in addition to psychoeducation and skills intervention. Specific features of the intervention included psychoeducation about reactions to trauma; enhanced coping; trauma and grief processing; building of social support skills; enhanced problem solving; understanding of links between behaviour and trauma; and reappraisal of traumatic expectations. Groups of 6 to 10 participants met for 60 to 90 minutes over 17 to 20 weeks Psychoeducation and skills intervention (n = 82) Classroom intervention that included psychoeducation, skills for managing reminders of trauma and loss and other coping skills taken from selected modules of the trauma and grief component therapy for adolescents. Number of sessions not clear Therapists The 2 therapies were based on different modules of the manualised Trauma and Grief Focused Component Therapy. Treatment was implemented by 16 school counsellors, who received supervision every 2 to 4 weeks | |
| Outcomes | PTSD symptoms Scale: UCLA PTSD Reaction Index (17‐item) Rater: adolescents Depression Scale: Depression Self‐Rating Scale (18‐item) Rater: adolescents When Post therapy and at 4 months | |
| Notes | Loss to follow‐up was greater than 40% for therapy and control groups at 4 months | |
| Risk of bias | ||
| Bias | Authors' judgement | Support for judgement |
| Random sequence generation (selection bias) | Unclear risk | Counsellors at each school pulled the names of eligible students out of a box |
| Allocation concealment (selection bias) | Unclear risk | Not reported |
| Blinding of participants (performance bias | Unclear risk | Participants were not blinded; both received a psychological therapy, and 1 was classroom‐based |
| Blinding of outcome assessment (detection bias) | Unclear risk | All measures were self reported |
| Incomplete outcome data (attrition bias) | High risk | Data were reported for completing participants, and risk was high to follow‐up at both intervals: post therapy 20%; 4 months 38% |
| Selective reporting (reporting bias) | Low risk | All outcomes appear to have been reported |
| Other bias | Low risk | No other bias was apparent |
| Methods | Randomised trial of child/parent psychotherapy or case management | |
| Participants | Included (n = 75) Preschool children 3 to 5 years of age who had been exposed to marital violence but still were not living with the perpetrator. Mean age: 4.1 years. Female: 39. Ethnicity: mixed 38.7%, Latino 28%, African American 14.7%, white 9.3%, Asian 6.7%, other 2.6% Excluded Children with mental retardation or autism spectrum disorder, or who had mothers who had abused the child, had current substance abuse, were homeless or had mental retardation or psychosis Setting Appears to have been a general hospital in the USA | |
| Interventions | Child/parent psychotherapy (n = 42) Targeted maladaptive behaviours, supported appropriate interactions and guided child and mother in creating a joint narrative of traumatic events in weekly mother and child sessions of 60 minutes over 50 weeks. This was guided by child/parent interactions and the child's play with developmentally appropriate toys selected to elicit trauma play and to foster social interaction Case management (n = 33) Mothers received assessment feedback and information on mental health clinics and were connected to the clinic of their choice. They received a monthly call, usually of 30 minutes, from their case manager, whom they could also contact as needed. Face‐to‐face meetings were scheduled when indicated Therapists Psychotherapy clinicians had master's or PhD qualifications in clinical psychology, and treatment fidelity was monitored through weekly supervision. The case manager was an experienced PhD level clinician | |
| Outcomes | PTSD diagnosis Criteria: semi‐structured Interview for Diagnostic Classification Rater: clinician PTSD symptoms Scale: semi‐structured Interview for Diagnostic Classification Rater: clinician Behaviour Scale: Child Behavior Checklist Rater: parent When Post therapy and at 6 months | |
| Notes | ||
| Risk of bias | ||
| Bias | Authors' judgement | Support for judgement |
| Random sequence generation (selection bias) | Unclear risk | Not reported |
| Allocation concealment (selection bias) | Unclear risk | Not reported |
| Blinding of participants (performance bias | High risk | Participants probably were aware of whether they were in the active or control group |
| Blinding of outcome assessment (detection bias) | Low risk | Risk of bias for assessing PTSD seems low, as 'every effort was made to keep assessors blind to group assignment'; however, parents completing behavioural scores probably were aware of group assignment |
| Incomplete outcome data (attrition bias) | High risk | Completer analysis reported; although loss to follow‐up post therapy was moderate (13%), it was high at 6 months (33%) |
| Selective reporting (reporting bias) | Unclear risk | 6‐Month PTSD scores were not reported |
| Other bias | Low risk | No other bias was apparent |
| Methods | Parallel single‐blind RCT of group‐based trauma‐focused CBT compared with wait list in former child soldiers and other war‐affected children in the Democratic Republic of Congo | |
| Participants | Included: male former child soldiers and war‐affected 'street boys' 13 to 17 years of age, screened for symptoms of psychological distress in eastern Democratic Republic of Congo (n = 58) Excluded: those who psychosis, had not experienced traumatic war events, or were unable to speak Swahili, French or English | |
| Interventions | Trauma‐focused CBT (n = 25) 15 sessions of a manualised, culturally adapted, group‐based, trauma‐focused cognitive‐behavioural intervention that includes psychoeducation, relaxation, affect modulation, cognitive processing and construction of a trauma narrative Wait list control (n = 25) After treatment and post testing of the intervention group, wait list controls begin the intervention Therapists Delivered by the first and second authors and two experienced Congolese counsellors. Daily training and evaluation sessions were held with these facilitators to ensure fidelity. | |
| Outcomes | Trauma symptoms Scale: UCLA‐PTSD Revised Index Rater: adolescent Behaviour Scale: antisocial behaviour measured with the African Youth Psychosocial Assessment Rater: adolescent Combined anxiety‐depression subscale: Scale: antisocial behaviour measured with the African Youth Psychosocial Assessment Rater: adolescent When Post therapy and 3 months follow‐up | |
| Notes | Data were not added to meta‐analyses because the effect sizes were several times higher than the overall estimate and contributed substantial heterogeneity | |
| Risk of bias | ||
| Bias | Authors' judgement | Support for judgement |
| Random sequence generation (selection bias) | Low risk | Participants were ranked on a list according to their UCLA‐PTSD RI Total score and then randomly allocated, by the first author, to either TF‐CBT intervention group or wait‐list control group using a matched dyad sequence from a computer randomisation program (www.random.org) generated by the third author (off site). |
| Allocation concealment (selection bias) | Unclear risk | No described |
| Blinding of participants (performance bias | High risk | Outcomes were self‐reported and participants are likely to have know they were in the intervention group |
| Blinding of outcome assessment (detection bias) | High risk | Outcomes were self‐reported |
| Incomplete outcome data (attrition bias) | High risk | 3 month outcome data could not be reported because all participants in the control group were lost to follow up |
| Selective reporting (reporting bias) | Low risk | All outcomes listed in the protocol were reported |
| Other bias | Unclear risk | No other apparent biases |
| Methods | Randomised trial of trauma‐focused CBT + trauma narrative vs wait list | |
| Participants | Included (n = 52) War‐affected girls 12 to 17 years of age who had witnessed or had personal experience of rape, sexual abuse or inappropriate sexual touch attending vocational training sponsored by World Vision. Mean age: 16.02 years. Mean number of traumatic events: 12 Excluded Intellectual disability, psychosis, severe emotional and behavioural problems that prevented group participation Setting Urban setting, Beni, Democratic Republic of Congo, 2006 to 2007 | |
| Interventions | Trauma‐focused CBT + trauma narrative (n = 24) Intervention group received a 15‐session, manualised, culturally modified TF‐CBT. It included the following modules: introduction, stress management, feelings, cognitive coping, trauma narratives, identification of and changes to inaccurate or unhelpful cognitions. All modules were group‐based, with the exception of trauma narratives, which were covered in 3 individual sessions. Intervention finished with a graduation ceremony also attended by parents/guardians, community leaders and other representatives. Sessions ran for 2 hours per day, 3 days per week for 5 weeks. Average attendance was 13.19 sessions Three caregiver sessions took place for parents/guardians of girls in the intervention group. Caregiver attendance ranged from 82% to 100% Wait list (n = 28) No details Therapists Intervention facilitators were social workers employed by World Vision. Daily pre‐therapy and post‐therapy meetings took place with facilitators and lead authors to ensure that module content was understood. The lead researcher monitored each session to ensure treatment integrity | |
| Outcomes | Trauma symptoms Scale: UCLA PTSD Reaction Index (22‐item) Rater: child/adolescent Depression/anxiety Scale: African Youth Psychological Assessment Instrument (40‐item) ‐ internalising and externalising Rater: child/adolescent Behaviour Scale: African Youth Psychological Assessment Instrument (40‐item) ‐ internalising and externalising Rater: child/adolescent When Post therapy | |
| Notes | ||
| Risk of bias | ||
| Bias | Authors' judgement | Support for judgement |
| Random sequence generation (selection bias) | Low risk | Participants were listed in order of their UCLA‐PTSD‐RI score, then were randomly assigned by a computer‐generated random sequence of numbers from the top of the list. The random sequence was supplied by an off‐site investigator |
| Allocation concealment (selection bias) | Low risk | 'Treatment allocation was concealed from those responsible for participant enrolment and ensuring that the person responsible for assigned participants had met none of the participants before the group allocation' |
| Blinding of participants (performance bias | High risk | Participants probably were aware of whether they were in the active or control group |
| Blinding of outcome assessment (detection bias) | High risk | Not stated, but self report measures were used |
| Incomplete outcome data (attrition bias) | Unclear risk | Loss to follow‐up: 11.5% |
| Selective reporting (reporting bias) | Unclear risk | All outcomes appear to have been reported |
| Other bias | Low risk | No other differences were identified |
| Methods | Parallel randomised double‐blind trial of trauma‐focused CBT vs control for children and adolescents affected by war | |
| Participants | Included (n = 160) War‐affected children and young people 7 to 18 years of age who witnessed a violent event involving a direct threat to life, or at risk of abduction or attack by armed groups and able to attend a 3‐week intervention. Mean age: 13.42 years. Female: 72. Types of trauma: 81% had a family member killed in the conflict, 77% had a family member who had been abducted and 22% had themselves been abducted; 99% reported that they were in fear of attack by the Lord's Resistance Army. Mean score: 11.85 on the CRIES‐8; 26/159 had a score ≥ 17 on the CRIES‐8 Excluded Children and young people with psychosis, mental retardation, inability to understand Swahili, severe emotional and behavioural problems that made group participation impossible Setting Villages of Kiliwa and Li‐May in northeastern Democratic Republic of Congo, with combined population < 1000 in 2012 | |
| Interventions | "Chuo Cha Maisha" group‐based trauma‐focused CBT (n = 79) Included effective communication and conflict resolution and contributed to community, psychoeducation, relaxation training and mobile cinema screenings that modelled how abducted children can be welcomed back into the community. Effective parenting was also covered for parents. Participants and caregivers attended 8 gender‐based groups over 3 weeks. Session attendance was 88% for participants and 84% for caregivers Therapists Three male and 3 female local lay facilitators were given a copy of the intervention manual and met with the lead researcher for 3 hours beforehand to discuss preparations for the programme and needed modifications. Lead researcher provided on‐site supervision during sessions and ensured that each module was covered Wait list (n = 80) Received intervention after intervention group had completed the programme | |
| Outcomes | PTSD symptoms Scale: CRIES‐8 (8‐item) Behaviours ‐ internalising, externalising, conduct, prosocial Scale: African Youth Psychosocial Assessment Instrument (AYPA) Rater: child/adolescent and parent for conduct When Post treatment | |
| Notes | NCT01509872 | |
| Risk of bias | ||
| Bias | Authors' judgement | Support for judgement |
| Random sequence generation (selection bias) | Low risk | Computer‐generated stratified random sequence run off‐site by 1 of the study authors |
| Allocation concealment (selection bias) | Low risk | Lead author allocated participants on the basis of randomised sequence |
| Blinding of participants (performance bias | High risk | Participants would have known whether or not they were receiving treatment |
| Blinding of outcome assessment (detection bias) | High risk | “assessed by blinded interviewers”, but PTSD symptoms were reported by participants and parents |
| Incomplete outcome data (attrition bias) | Low risk | Missing values were replaced by using regression estimates; loss to follow‐up: 1.9% post treatment; 13.8% at 3 months; 3‐month control data were not reported |
| Selective reporting (reporting bias) | High risk | Daily function (Youth Daily Task Functioning Questionnaire), family function (an 8‐item family function questionnaire) and community function (AYPA) measures were also proposed in the protocol but were not reported |
| Other bias | High risk | Conduct scores (both self reported and parent reported) were approximately 17% higher in the intervention group |
| Methods | Multi‐centre cluster‐randomised controlled trial of a trauma‐focused psychoeducational intervention compared with supportive therapy in children exposed to interparental violence | |
| Participants | Included (n = 164) Children 6 to 12 years of age who experienced psychological and/or physical interparental violence, who were referred to the programme by agencies such as the police and child protection agencies. Mean age: 9.22 years. Female: 44.5% (69). Mean length of abusive relationship: 10.87 years Excluded Children and parents with intellectual, psychiatric or behavioural problems that prevent participation in groups Setting Eight organisations in 7 cities in The Netherlands, 2009 to 2012 | |
| Interventions | En nu ik! (’It’s my turn now!’) (n = 108) Focused on how to differentiate and express emotions; increasing feelings of emotional security, learning how to cope with feelings and problems in a non‐violent way, developing a trauma narrative, improving parent/child interaction and psychoeducation, processing interparental violence experiences. Nine sessions of 90 minutes were provided for a maximum of 8 children, and 9 parallel sessions for the non‐violent custodial parent Therapists Therapists for parallel sessions usually included a mental health professional and a social worker who had received 1 day of training in the manualised intervention and participated in ≥ 3 peer supervision meetings. 69% of sessions were rated as having no or few deviations Jij hoort erbij ("You belong") (n = 56) Comparable with intervention on non‐specific factors by offering positive attention, positive expectations, recreation, distraction, warmth and empathy of the therapist, as well as social support among group participants. Also 9 sessions of 90 minutes for a maximum of 8 children, and 9 parallel sessions for the custodial parent Therapists Parallel sessions were provided by a mental health professional along with a mental health professional in training or a social worker. Therapists followed a manual for every session and participated in ≥ 3 peer supervision meetings. 78% of sessions were rated as having no or few deviations | |
| Outcomes | PTSD symptoms Scale: Trauma Symptom Checklist for Young Children (TSCYC; 90‐item) Rater: parent Scale: Trauma Symptom Checklist for Children (TSCC; 54‐item) Rater: children ≥ 7.5 years of age Behaviour Scale: CBCL (119‐item) Rater: parent Scale: Teacher Report Form (133‐item) Rater: teacher Depression Scale: CDI (27‐item) Rater: children ≥ 7.5 years of age When At 1 week and 6 months after completion of the programme | |
| Notes | Netherlands Trial register: NTR 3064 | |
| Risk of bias | ||
| Bias | Authors' judgement | Support for judgement |
| Random sequence generation (selection bias) | Low risk | “An independent researcher will make the allocation schedule with a computerized random number generator”. Therapists were randomised in blocks of 3 (2:1 intervention:control) |
| Allocation concealment (selection bias) | Low risk | “Concealed random allocation” |
| Blinding of participants (performance bias | Low risk | Parents and children were blind to group allocation until 2 weeks before the start of the programme; both programmes were presented as useful |
| Blinding of outcome assessment (detection bias) | Low risk | ‘The researchers coding the observation tasks and analyzing the data will be blind to the group condition of parents and children, as well as assessment’ |
| Incomplete outcome data (attrition bias) | Unclear risk | The ‘last value carried forward will be applied’ for missing data. Loss to follow‐up: 20.1% |
| Selective reporting (reporting bias) | Unclear risk | All outcomes listed in protocol were reported |
| Other bias | Low risk | No other bias was identified |
| Methods | Randomised trial of cognitive‐based compassion training vs wait list | |
| Participants | Included (n = 71) Adolescents in the Georgia foster care system with a documented history of trauma and neglect Mean age: 14.7 years. Female: 31. Ethnicity: African American 74%, Caucasian 13%, multi‐racial 7%, Asian 4%. Mean number of psychiatric diagnoses: 1.74. Trauma was neglect 40.20%, physical abuse 25.07%, sexual abuse 11.66% Excluded Adolescents taking medications known to influence immune and endocrine functioning, including corticosteroids and non‐steroidal anti‐inflammatory compounds; medical illness including cancer, cardiovascular disease, diabetes and autoimmune disorders, schizophrenia, bipolar I disorder, eating disorders and major depression severe enough to require hospitalisation Setting Georgia State foster care system, USA, 2010 | |
| Interventions | Cognitive‐based compassion training (n = 37) Participants in the cognitive‐based compassion training (CBCT) group attended classes of 1 hour twice a week for 6 weeks. CBCT is a secular, analytical meditation‐based programme derived from Tibetan Buddhist mind‐training. The goal of CBCT is to challenge unexamined assumptions regarding feelings and actions toward others, with a focus on generating spontaneous empathy and compassion for the self as well as others Wait list (n = 34) Control group was on a 6‐week wait list Therapists Not described | |
| Outcomes | Depression Scale: Quick Inventory of Depressive Symptomatology Rater: child/adolescent Anxiety Scale: State‐Trait Anxiety Inventory Rater: child/adolescent When Post therapy | |
| Notes | ||
| Risk of bias | ||
| Bias | Authors' judgement | Support for judgement |
| Random sequence generation (selection bias) | Low risk | 'Participants were evenly randomized by a list of random numbers, generated by computer' |
| Allocation concealment (selection bias) | Unclear risk | Not stated |
| Blinding of participants (performance bias | High risk | Participants probably were aware of whether they were in the active or control group |
| Blinding of outcome assessment (detection bias) | High risk | Not stated, but self report measures were used |
| Incomplete outcome data (attrition bias) | High risk | Loss to follow‐up: 22.5% |
| Selective reporting (reporting bias) | Low risk | All outcomes appear to have been reported |
| Other bias | High risk | Percentage of participants who had undergone sexual abuse was much higher in the intervention group than in the control group (18.52% vs 4.00%), and neglect was much higher in the control group (52.00% vs 29.63%) |
| Methods | Cluster‐randomised trial of teaching recovery techniques vs wait list in 10‐ to 13‐year‐old boys and girls in heavily bombarded areas | |
| Participants | Included (n = 482) Children in 5th and 6th grades from 2 randomly selected schools in heavily bombarded areas. Mean age: 11.29 years. Female: 49.4%. 86% lived in urban areas, 12% in refugee camps, 3% in villages; 49% had unemployed fathers. Clinically significant post‐traumatic stress symptoms: 64% intervention group, 43% control group Excluded Not stated Setting Schools in heavily bombarded areas in North Gaza and Gaza City, Palestine, after the Gaza War in 2008 to 2009 | |
| Interventions | Teaching Recovery Techniques (n = 242) The Teaching Recovery programme was modified to suit a war situation. It incorporated trauma‐related psychoeducation, CBT methods, coping skills training and creative‐expressive elements such as dream work and drawing. Problem solving, storytelling and role play techniques were also applied Four groups of 15 children were also attended by family members. Two weekly sessions of 2 hours over 4 weeks Four psychologists (2 male and 2 female) were trained in Teaching Recovery Techniques and had weekly preparatory and supervisory meetings with the primary author. Supervision covered case consultation, therapeutic elements, guidance through role playing and review of field diaries and sessions Wait list (n = 240) After 6 months, the control group was provided the same intervention for 1 month | |
| Outcomes | PTSD symptoms Scale: CRIES (13‐item) Rater: child/adolescent Depression Scale: Depression Self‐Rating Scale (18‐item) Rater: child/adolescent Behaviour Scale: SDQ Rater: child/adolescent When Post treatment and at 6‐month follow‐up | |
| Notes | ||
| Risk of bias | ||
| Bias | Authors' judgement | Support for judgement |
| Random sequence generation (selection bias) | Unclear risk | Four schools were randomly sampled from a Ministry of Education list. Two girls’ and two boys’ classes were randomly sampled at each of the 4 schools. Classes were randomly allocated (stratified by gender) to intervention and control groups |
| Allocation concealment (selection bias) | Unclear risk | Not described |
| Blinding of participants (performance bias | High risk | “Children, families, teachers, and research assistants were not aware of the intervention status of children at the baseline”, but it is likely they would have known whether they received treatment, once the study started |
| Blinding of outcome assessment (detection bias) | High risk | Outcomes were self reported |
| Incomplete outcome data (attrition bias) | High risk | Loss to follow‐up between post treatment and 6 months: 16.2% |
| Selective reporting (reporting bias) | Low risk | Alll outcomes appear to have been reported |
| Other bias | High risk | Clinically significant symptoms were significantly greater in the intervention group (64% vs 43%) |
| Methods | Randomised trial of structured sensory therapy (SITCAP‐ART) vs wait list | |
| Participants | Included (n = 23) Traumatised adjudicated adolescents in residential treatment. Two‐thirds of research participants were between 16 and 17 years of age, 9 of 20 who completed were female, 17 were white. Eleven had been diagnosed with PTSD, and 4 with traumatic or complicated grief Setting Multi‐county Attention Center, Ohio, USA | |
| Interventions | Structured Sensory Therapy (n =13) SITCAP‐ART is structured trauma treatment that uses a series of drawing tasks and treatment‐specific questions targeting the major sensations experienced in a traumatic event, so that traumatic memories are experienced at a sensory level and are reactivated in a safe environment to be moderated and tolerated with a sense of power and a feeling of safety. It consisted of 10 to 11 sessions of 1 hour and 15 minutes. Seven were group sessions with 6 participants. One session was held for individual debriefing, 1 for individual processing and 1 was a parent and adolescent session. Sessions covered identification of PTSD reactions; revisiting the trauma; normalisation of reactions; and helping parents respond to the child's reactions and resolve their own reactions Wait list (n = 10) Therapist The therapist completed a fidelity checklist for each session, which was rated as 98.5% overall | |
| Outcomes | Trauma symptoms Scale: Trauma Symptom Checklist for Children Rater: adolescent Behaviour Scale: Youth Self‐Report Rater: adolescent When Post therapy | |
| Notes | Once they had received treatment, only pooled outcome data from the treatment group and the wait list group were reported | |
| Risk of bias | ||
| Bias | Authors' judgement | Support for judgement |
| Random sequence generation (selection bias) | Unclear risk | Not reported |
| Allocation concealment (selection bias) | Unclear risk | Not reported |
| Blinding of participants (performance bias | High risk | Participants probably would have been aware of whether they were in the active or wait list group |
| Blinding of outcome assessment (detection bias) | High risk | All outcomes were self reported |
| Incomplete outcome data (attrition bias) | High risk | Loss to follow‐up: 13% reported (p 176) but 5 reported to have dropped out in 'the early sessions of the group therapy' (22%; p 181) |
| Selective reporting (reporting bias) | Low risk | All outcomes appear to have been reported |
| Other bias | High risk | Five additional participants were reported to have dropped out in 'the early sessions of the group therapy', but their data were not reported |
| Methods | Randomised trial of individual vs group delivery of the Project LAST intervention | |
| Participants | Included (n = 56) School children 7 to 12 years of age who were grieving ≥ 1 month after death or moderate PTSD symptoms (≥ 25 on the UCLA PTSD Index) due to death or related to Hurricane Katrina, and clinically appropriate for group participation. Female: 21. African American: 51. Thirty‐seven reported someone close to them had died, 14 had witnessed domestic violence, 12 witnessed a shooting or stabbing, 3 had experienced abuse. Eight children had received or were receiving mental health treatment Excluded Actively suicidal, loss within last month Setting School or after school programmes at 3 schools in New Orleans after Hurricane Katrina, January to May 2006 | |
| Interventions | Individual sessions (n = 28) Project LAST is a manualised intervention developed specifically for 7‐ to 12‐year‐olds experiencing grief and trauma due to death, disaster and/or violence. It has 3 overlapping phases: resilience and safety; restorative retelling; and reconnecting. It combines techniques from CBT and narrative therapy. Individual sessions were 1 hour each week over 10 weeks, and 1 parent session covered psychoeducation and support strategies Children attended a mean of 8.36 sessions Group sessions (n = 28) The Project LAST intervention was delivered through 9 weekly sessions for 5 to 6 children and 1 individual “pullout” session for the child. Children attended a mean of 7.82 sessions. Therapists All clinicians were master’s level social workers. To ensure fidelity, clinicians met with a consulting clinical social worker and the developer of the LAST intervention. Adherence for individual treatment was 98% and for the group intervention 100% | |
| Outcomes | PTSD diagnosis Scale: Score ≥ 38 on the UCLA PTSD Index Rater: child PTSD symptoms Scale: UCLA PTSD Index (22‐item) Rater: child Depression diagnosis Scale: Score ≥ 29 on the Mood and Feelings Questionnaire Rater: child Depression symptoms Scale: Mood and Feelings Questionnaire (33 items) Rater: child When Post therapy and at 3‐week follow‐up | |
| Notes | ||
| Risk of bias | ||
| Bias | Authors' judgement | Support for judgement |
| Random sequence generation (selection bias) | Unclear risk | Not reported |
| Allocation concealment (selection bias) | Unclear risk | Not reported |
| Blinding of participants (performance bias | Unclear risk | Participants would have been aware of whether they were allocated to individual or group therapy |
| Blinding of outcome assessment (detection bias) | Unclear risk | Observers were blinded, but all measures were self reported |
| Incomplete outcome data (attrition bias) | High risk | Data were reported for those available at 3 weeks. Loss to follow‐up: 20% |
| Selective reporting (reporting bias) | Unclear risk | Clinically significant PTSD and depression were not reported by group, but symptom scores were given |
| Other bias | Low risk | No other bias was apparent |
| Methods | Randomised trial of a grief and trauma intervention with and without narrative processing | |
| Participants | Included (n = 72) Children who had experienced potentially traumatic events with a score ≥ 25 on the UCLA PTSD Index. Mean age: 9.6 years. Female: 31. All were African American. Sixty‐seven had been exposed to Hurricane Katrina. Most reported exposure to acts of violence including a beating (84.3%), a shooting (40%) or a dead body (31.4%), and 51.5% reported ≥ 3 exposures to violence Excluded Suicidal ideation, or not considered 'clinically appropriate' for group participation Setting Four elementary schools in New Orleans, after Hurricane Katrina, 2008 to 2009 | |
| Interventions | Grief and trauma intervention plus narrative processing (n = 37) This intervention was developed originally for children who had lost someone close through murder or had witnessed community violence. It combines techniques from CBT and narrative therapy over the 3 overlapping phases of resilience and safety; restorative retelling; and reconnecting. Children were instructed to share their stories, which were compiled in a book, with a caring adult. Therapy was delivered through 10 weekly group sessions and 1 individual session of 50 minutes to 1 hour plus a parent meeting that consisted predominantly of psychoeducation Grief and trauma intervention (n = 33) This was similar to the grief and trauma Intervention plus narrative processing, except that it did not include restorative storytelling or positive memories of the deceased. Children constructed a Coping Book, which they were instructed to share with a caring adult Therapists Therapists were 10 master's level social workers, 2 social work interns and 1 doctoral level psychologist. All received 3 days of training in the intervention they were using and were supervised twice a week. Fidelity checklists were completed after each session: 96% for the narrative intervention, 92% for grief and trauma | |
| Outcomes | PTSD diagnosis Scale: Score ≥ 38 on the UCLA PTSD Index Rater: child PTSD symptoms Scale: UCLA PTSD Index (22‐item) Rater: child Depression diagnosis Scale: Score ≥ 29 on the Mood and Feelings Questionnaire Rater: child Depression symptoms Scale: Mood and Feelings Questionnaire (33‐item) Rater: child Behaviour Scale: Child Behavior Checklist Rater: parent When Post therapy and at 3 and 12 months | |
| Notes | Two Hispanic children, both of whom were randomised to the narrative processing group, were omitted from the final analysis, as all other participants were African American | |
| Risk of bias | ||
| Bias | Authors' judgement | Support for judgement |
| Random sequence generation (selection bias) | Low risk | 'using Excel randomization' |
| Allocation concealment (selection bias) | Unclear risk | Not reported |
| Blinding of participants (performance bias | Unclear risk | Blinding not possible, but both groups received psychological therapies |
| Blinding of outcome assessment (detection bias) | Unclear risk | It was stated that assessments were conducted by blinded personnel, but all measures were reported by child or parent |
| Incomplete outcome data (attrition bias) | Unclear risk | Last observation carried forward analysis was used, but means and SDs were reported for those followed up at all intervals. Loss to follow‐up: 11% |
| Selective reporting (reporting bias) | Low risk | All outcomes appear to have been reported |
| Other bias | Low risk | No other bias was apparent |
| Methods | Randomised trial of trauma‐focused CBT vs child‐centred play therapy | |
| Participants | Included (n = 31) Elementary school students 6 to 13 years of age who met full or partial criteria for PTSD on the UCLA PTSD Index, or had a clinical score on the Post‐Traumatic Symptoms Parent Report. Mean age: 9.16 years. Female: 45.5%. Their backgrounds covered 15 countries from Africa, Asia, Europe and the Middle East. Fifteen scored in the full PTSD range on the UCLA PTSD Index and Parent Report Excluded Children were excluded if they participated in counselling outside of this study Setting Three elementary schools in northwestern USA. All participating schools had more than average numbers of students who were English language learners | |
| Interventions | Trauma‐focused CBT (n = 17) Treatment was tailored to specific needs of refugee children, including information and education about trauma in general and refugee trauma in particular. Children participated in twice‐weekly 30‐minute sessions over 12 weeks, with an average of 17 completed sessions. Therapists met with parents twice on average Child‐centred play therapy (n = 14) Children attended 30‐minute sessions twice weekly for 12 weeks in the school. The playroom was additionally equipped with multi‐cultural dolls, musical instruments, play food and other toys reflective of the cultural backgrounds of the children. Children completed an average of 17 sessions, and therapists met with parents an average of 3 times Therapists All therapists were second‐ or third‐year graduate students in a master's level counsellor education programme. Face‐to‐face supervision of at least 1 hour was provided for every 10 hours of clinical work. All TF‐CBT therapists were trained and supervised by a doctoral level licenced professional counsellor, counsellor educator and certified TF‐CBT therapist. All CCPT therapists were trained and supervised by a doctoral level licenced professional counsellor, counsellor educator and registered play therapist supervisor. Supervisors for both therapies rated videotapes of each therapist's treatment sessions for adherence to treatment manuals; these were rated as excellent overall | |
| Outcomes | PTSD symptoms Scale: UCLA PTSD Index for DSM‐IV Rater: clinician PTSD symptoms Scale: Parent Report of Post‐Traumatic Symptoms (32‐item) Rater: parent When Post therapy | |
| Notes | ||
| Risk of bias | ||
| Bias | Authors' judgement | Support for judgement |
| Random sequence generation (selection bias) | Low risk | 'Using a computer‐generated random numbers table' |
| Allocation concealment (selection bias) | Unclear risk | Not reported |
| Blinding of participants (performance bias | Unclear risk | Blinding was not possible, but both groups received a psychological therapy |
| Blinding of outcome assessment (detection bias) | Unclear risk | Not reported |
| Incomplete outcome data (attrition bias) | High risk | Loss to follow‐up: 16% |
| Selective reporting (reporting bias) | Low risk | Al outcomes appear to have been reported |
| Other bias | Low risk | No other bias was apparent |
| Methods | Cluster‐randomised trial of group trauma therapy vs wait list | |
| Participants | Included (n = 164) Elementary school students in Israel 9 to 14 years of age screened for post‐traumatic reactions with the Child Post‐Traumatic Stress Reaction Index (cutoff score 12). Female: 112 (68%). Most children were Jewish (82%), and all other participants were Arabic Excluded Not stated Setting Elementary and secondary schools in Israel, 2006 to 2007 | |
| Interventions | Group trauma therapy (n = 98) Treatment used activities and therapeutic games aimed at enhancing expression and exploration of feelings in a group context of mutual support over 10 sessions. Eighteen treatment groups were included: 5 for war‐related trauma, 7 for loss and divorce and 6 for mixed traumas Wait list (n = 66) Control children received treatment after the experimental group was terminated Therapists Therapists were 18 school counsellors who received training in the expressive‐supportive therapy modality over 56 hours and received group supervision . | |
| Outcomes | PTSD symptoms Scale: Child Post‐Traumatic Stress Reaction Index (20‐item) Rater: child/adolescent Anxiety Scale: Revised Children’s Manifest Anxiety Scale (37‐item) Rater: child/adolescent When Post therapy | |
| Notes | ||
| Risk of bias | ||
| Bias | Authors' judgement | Support for judgement |
| Random sequence generation (selection bias) | Unclear risk | Cluster‐randomised by group, but how this was done was not reported |
| Allocation concealment (selection bias) | Unclear risk | Not reported |
| Blinding of participants (performance bias | High risk | Participants probably were aware of whether they were in the wait list control or active group |
| Blinding of outcome assessment (detection bias) | High risk | Observers were not blinded |
| Incomplete outcome data (attrition bias) | High risk | Loss to follow‐up: 17% |
| Selective reporting (reporting bias) | Low risk | All outcomes appear to have been reported |
| Other bias | Low risk | No other bias was apparent |
| Methods | RCT of modified CBT vs usual care for referred adolescents with a depressive disorder and a history of interpersonal trauma | |
| Participants | Included (n = 43) Adolescents referred for outpatient treatment who had been exposed to interpersonal trauma and met diagnostic criteria for a depressive disorder. Mean age: 15.48 years. Female: 36. Type of trauma: reported at least 1 incident of physical abuse (49%), witnessing family violence (58%), sexual abuse (67%) and verbal/emotional abuse (47%) in response to a highly structured screening interview. Diagnosis of PTSD: modified CBT group 30%, usual care group 61% Excluded Receiving concurrent psychological treatment for (1) depression, (2) attempted suicide within 3 months before intake, (3) engaged in self injurious behaviour that required hospitalisation or emergency room treatment within the previous 3 months, (4) met diagnostic criteria for bipolar disorder and/or substance dependence disorder, (5) presented with psychotic symptoms or intellectual deficit. None were receiving antidepressants Setting Two outpatient clinics of a large urban community mental health centre in an ethnically diverse urban city in the Rocky Mountains, USA | |
| Interventions | Modified CBT (n = 20) A CBT protocol for adolescent depression was modified to address cognitive deficits and distortions associated with interpersonal trauma. Core elements of the manualised therapy included mood monitoring, cognitive restructuring, relaxation training and interpersonal problem solving and mindfulness and explicitly addressed cognitions related to the experience of interpersonal trauma Therapy consisted of 12 weekly individual sessions, which were not time‐limited; however, the mean number of sessions attended was 5.33 Therapists Therapy was delivered by 1 male doctoral level psychologist with 28 years of clinical experience and 1 female master's level therapist with 10 years of experience. Therapists completed a 1‐day workshop and a practice case under supervision before the start of the trial Graduate‐level coders rated 86% of treatment elements delivered as specified in audio recordings of sessions Usual care (n = 23) Treatment strategies and procedures that therapists used regularly and believed to be effective for particular case formulations. Therapists described these as eclectic, although favouring client‐centred, psychodynamic and family approaches Usual care also consisted of weekly individual sessions, which were not time‐limited. The mean number of sessions attended was 6.22 Therapists Usual care therapists were 2 female doctoral level psychologists with 3 and 4 years of clinical experience. They were supervised by the clinic team leader; this included weekly group supervision and individual consultation on an as needed basis | |
| Outcomes | PTSD symptoms Scale: Disorders and Schizophrenia ‐ Present and Lifetime Version (K‐SADS‐LS) Rater: adolescent Depression Scale: Beck Depression Inventory (BDI‐II; 21‐item) Rater: adolescent Scale: K‐SADS‐LS (BDI‐II; 21‐item) Rater: adolescent Behaviour Scale: CBCL (118‐item) Rater: caregiver When BDI‐II was used during sessions 1, 4, 8 and 12 and at 16 weeks post treatment. K‐SADS‐PL and CBCL were rated post treatment | |
| Notes | ||
| Risk of bias | ||
| Bias | Authors' judgement | Support for judgement |
| Random sequence generation (selection bias) | Unclear risk | Clinicians were assigned on the basis of clinic location, but randomisation was not described |
| Allocation concealment (selection bias) | Unclear risk | Not described |
| Blinding of participants (performance bias | Low risk | Both groups received individual therapy |
| Blinding of outcome assessment (detection bias) | Low risk | PTSD symptoms, behaviour and depression scales were completed by participants and caregivers |
| Incomplete outcome data (attrition bias) | Unclear risk | Last observation carried forward (LOCF) was used for missing post‐treatment BDI‐II scores. Loss to follow‐up: 18.6% |
| Selective reporting (reporting bias) | High risk | Only BDI‐II depression scores for females were reported |
| Other bias | High risk | Percentage of participants with a baseline diagnosis of PTSD was twice as high (61%) in the control group as in the intervention group (30%). Therapists in the intervention group had 38 years of clinical experience between them as compared with 7 years in the usual care group. Also, intervention therapists received 'more targeted and frequent' case supervision |
| Methods | Randomised trial of debriefing therapy vs control | |
| Participants | Included (n = 158) Children and young people 7 to 18 years of age attending the A&E department after a road traffic accident. Mean age: 15 years. Female: 83 Excluded Children living outside the area, with significant learning disabilities, involved in > 1 incident Setting Hospital in the UK, 2000 to 2002 | |
| Interventions | Debriefing group (n = 82) A manualised series of standard prompts was used to guide the child through a structured debriefing process, including reconstruction of the accident in detail, helping the child identify thoughts about the trauma and discuss emotional reactions. Information was provided about common thoughts and feelings experienced by people who had undergone trauma as a way of normalising their reactions. Written information on coping with common problems was provided. The intervention was provided 4 weeks after the accident Control (n = 76) A series of prompt questions were used to engage the child in a discussion not focused on the accident Therapist Not reported | |
| Outcomes | PTSD diagnosis Scale: Clinician Administered Post‐Traumatic Stress Disorder Scale for Children Rater: clinician PTSD symptoms Scale: Impact of Events Scale Rater: child/adolescent Anxiety Scale: Revised Manifest Anxiety Scale Rater: child/adolescent Depression: Birleson Depression Inventory Rater: child/adolescent Behaviour Scale: Strengths and Difficulties Questionnaire (SDQ) Rater: child/adolescent and parent When At 8‐month follow‐up | |
| Notes | ||
| Risk of bias | ||
| Bias | Authors' judgement | Support for judgement |
| Random sequence generation (selection bias) | Low risk | Randomised allocation stratified by gender |
| Allocation concealment (selection bias) | Low risk | Allocated by sequentially numbered sealed, opaque envelopes |
| Blinding of participants (performance bias | High risk | Participants may have been aware of whether they received an active treatment |
| Blinding of outcome assessment (detection bias) | Low risk | Low risk for diagnosis, as "assessments were undertaken by a second researcher, who was blind to the child's status"; however, all other measures were self reported or parent reported |
| Incomplete outcome data (attrition bias) | High risk | Completer analysis reported. Loss to follow‐up: 16% |
| Selective reporting (reporting bias) | Unclear risk | Data were not reported for parent SDQ |
| Other bias | High risk | Proportion of children diagnosed with PTSD at baseline was higher in the control group (35.5%) than in the experimental group (23.2%) |
| Methods | Randomised trial of a cognitive‐behavioural intervention for trauma vs wait list | |
| Participants | Included (n = 126) Sixth grade students from 2 large middle schools who reported exposure to violence and had clinical symptoms of PTSD. Mean age: 11 years. Female: 56%. Mean number of violent events witnessed by students: 5.9 Excluded Children considered too disruptive to participate in group therapy Setting Two large middle schools in a socioeconomically disadvantaged, primarily Latino, area in the USA, 2001 to 2002 | |
| Interventions | Cognitive‐behavioural intervention for trauma in schools (n = 61) Consisted of 10 usually weekly sessions of 5 to 8 students per group delivered by psychiatric social workers. The intervention incorporated psychoeducation, exposure, relaxation training, games and worksheets and addressed symptoms of PTSD, depression and anxiety related to exposure to violence Wait list (n = 65) Students randomised to the wait list group completed the intervention 6 months after the intervention group had started Therapists Three psychiatric social workers working in mental health services who received 2 days of training in the manualised intervention with weekly supervision. Completion of required intervention elements in randomly selected audiotapes of sessions ranged from 67% to 100% | |
| Outcomes | PTSD symptoms Scale: Child PTSD Symptom Scale (17‐item) Rater: child Depression Scale: Child Depression Inventory minus suicidality item (26‐item) Rater: child Behaviour Scale: Teacher‐Child Rating Scale (6‐item) Rater: teacher Function Scale: Pediatric Symptom Checklist ‐ psychosocial dysfunction (33‐item) Rater: parent When At 2 weeks after treatment completion | |
| Notes | SDs estimated from 95% CI of mean difference | |
| Risk of bias | ||
| Bias | Authors' judgement | Support for judgement |
| Random sequence generation (selection bias) | Low risk | A central office was used for randomisation |
| Allocation concealment (selection bias) | Low risk | See sequence generation |
| Blinding of participants (performance bias | High risk | Participants probably were aware of whether they were in the active or wait list group |
| Blinding of outcome assessment (detection bias) | High risk | Most outcomes were child reported or parent reported |
| Incomplete outcome data (attrition bias) | Unclear risk | Completer analysis reported. Loss to follow‐up: 7% |
| Selective reporting (reporting bias) | Low risk | All outcomes appear to have been reported |
| Other bias | Low risk | No other bias was apparent |
| Methods | Stratified randomised trial of combined skills group training and individual mentoring vs control | |
| Participants | Included (n = 156) Children 9 to 11 years of age who had been placed in foster care by court order because of maltreatment within the preceding year; currently resided within 35 minutes' drive to skills group sites; had lived with their current caregiver ≥ 3 weeks; demonstrated adequate proficiency in English Excluded None reported Setting Denver metropolitan area, 2002 to 2009 | |
| Interventions | Combined skills group training and individual mentoring (n = 77) Consisted of a manualised skills group and 30 weeks of 1‐on‐1 mentoring by graduate students in social work for each child. The skills group, which included 8 to 10 children and 2 facilitators, met for 1.5 hours over 30 weeks. Groups combined CBT skills with materials covering emotion recognition, perspective taking, problem solving, anger management, cultural identity, change and loss, healthy relationships, peer pressure, abuse prevention and future orientation. Mentors spent 2 to 4 hours a week with each child. The purpose of mentoring was to create empowering relationships with children, provide positive role models, ensure that children received appropriate services and support, help children generalise skills and promote a positive future orientation. Children attended a mean of 25.0 group sessions and 26.7 mentoring sessions Control (n = 79) Received assessment only Therapists The 2 facilitators were licenced clinicians and graduate student trainees. Mentors were graduate students in social work who received weekly individual and group supervision | |
| Outcomes | PTSD symptoms Scale: Trauma Symptom Checklist for Children Rater: child Quality of life Scale: Life Satisfaction Survey Rater: child When Post therapy and at 6 months | |
| Notes | SDs calculated from SEs | |
| Risk of bias | ||
| Bias | Authors' judgement | Support for judgement |
| Random sequence generation (selection bias) | Unclear risk | Randomisation was stratified by gender and county, followed by 'manually randomized, by cohort, in a single block'. No other details were provided. When multiple members of a sibling group were eligible, 1 sibling was randomly selected to participate in the randomised controlled trial |
| Allocation concealment (selection bias) | Unclear risk | Not reported |
| Blinding of participants (performance bias | High risk | Participants probably knew whether they were in the active or control group |
| Blinding of outcome assessment (detection bias) | High risk | 'Interviewers were masked to participant group', but all outcomes were self reported |
| Incomplete outcome data (attrition bias) | Unclear risk | Post‐therapy loss to follow‐up: 9%; loss to follow‐up at 6 months: 7% |
| Selective reporting (reporting bias) | Low risk | All outcomes appear to have been reported |
| Other bias | Unclear risk | IQ, coping and social support scores were higher in the intervention group. Also, participants in the intervention group were more likely to have undergone physical abuse and maternal neglect and to have a mother with a criminal history |
| Methods | Cluster‐randomised trial of a group‐based CBT intervention vs wait list | |
| Participants | Included (n = 403) Children attending randomly selected schools in violence‐affected communities were screened for exposure to ≥ 1 violent event, scored ≥ 12 on the PTSD scale and ≥ 5 on the anxiety scale Mean age: 9.94 years. Female: 196. Mean number of violent exposures: 3.9 Excluded Considered unable to function in a group setting, including aggression, mutism, mental retardation, substance abuse, dissociative disorders, unmedicated epilepsy, panic or phobic disorders, child psychosis Setting Fourteen schools in Central Sulawesi Indonesia, 2006 | |
| Interventions | Intervention (n = 182) Manualised, school‐based intervention that integrates CBT techniques over 15 sessions in 5 weeks to groups of approximately 15 children. Sessions included psychoeducation, trauma‐processing activities, cooperative play and creative/expressive elements Control (n = 221) Wait list control group Therapists Locally trained paraprofessionals who had been selected for their social skills and received 2 weeks of training. Adherence was rated as 90% | |
| Outcomes | PTSD symptoms Scale: Child Post‐Traumatic Stress Scale (17‐item) Rater: child Depression Scale: Depression Self‐Rating Scale (8‐item) Rater: child Anxiety Scale: Self‐Report for Anxiety‐Related Disorder (SCARED‐5; 5 items) Rater: child Behaviour Scale: Children’s Aggression Scale for Parents (33‐item) Rater: parent Function Scale: Functional impairment (10‐item) Rater: child, parent When At 1 week and 6 months | |
| Notes | Functional impairment change scores were analysed as positive values to assess improvement in function | |
| Risk of bias | ||
| Bias | Authors' judgement | Support for judgement |
| Random sequence generation (selection bias) | Unclear risk | Not reported |
| Allocation concealment (selection bias) | Unclear risk | Not reported |
| Blinding of participants (performance bias | High risk | Participants probably were aware of whether they were in the active or wait list group |
| Blinding of outcome assessment (detection bias) | High risk | Observers were not blinded, but all measures were child reported or parent reported |
| Incomplete outcome data (attrition bias) | Low risk | Last observation carried forward analysis was used. Loss to follow‐up was low: 1 week 3%, 6 months 9% |
| Selective reporting (reporting bias) | Low risk | All outcomes appear to have been reported |
| Other bias | High risk | Displacement was higher in the control group (75%) than in the intervention group (37%) |
| Methods | Cluster‐randomised trial of a school‐based mental health intervention vs wait list | |
| Participants | Included (n = 399) Children in grades 4 through 7 were screened for war‐related risk factors, current psychological symptoms, affected school function and absence of protective factors using the Child Psychosocial Distress Screener (CPDS). Age ranged from 9 to 13 years (mean, 11.03). Boys: 61.4%; 81.0% were of the Hindu religion. Children were exposed to an average of 2 war‐related events Excluded None reported Setting Two divisions of the Jaffna District, northern Sri Lanka, 2007 to 2008 | |
| Interventions | School‐based mental health intervention (n = 199) The manualised intervention consisted of cognitive‐behavioural techniques, psychoeducation, coping and guided exposure to past traumatic events through drawing and creative expressive elements. It was delivered to groups of around 15 children in 15 sessions over 5 weeks Wait list control (n = 200) Therapists Interventionists were locally identified non‐specialised personnel who had received at least a high school diploma and were selected for their affinity and capacity to work with children. They were trained and supervised in implementing the manualised intervention for 1 year before the study | |
| Outcomes | PTSD symptoms Scale: Child PTSD Symptom Scale (17‐item) Rater: child Depression Scale: Depression Self Rating Scale (18‐item) Rater: child Anxiety Scale: Screen for Anxiety‐Related Disorders (5‐item) Rater: child Behaviour Scale: Strengths and Difficulties Questionnaire (25‐item) Rater: child Function Scale: Functional impairment scale developed by study authors (10‐item) Rater: child When At 1 week and 6 months | |
| Notes | Data were reported for 201 participants in the wait list group at 3 months (123 boys and 78 girls), although the total was previously reported as 199 Data were pooled across genders for meta‐analysis | |
| Risk of bias | ||
| Bias | Authors' judgement | Support for judgement |
| Random sequence generation (selection bias) | Unclear risk | Not reported |
| Allocation concealment (selection bias) | Unclear risk | Not reported |
| Blinding of participants (performance bias | High risk | Participants probably were aware of whether they were in the active or wait list group |
| Blinding of outcome assessment (detection bias) | High risk | Observers were blinded, but all measures were child reported |
| Incomplete outcome data (attrition bias) | Low risk | No loss to follow‐up was reported at 1 week; loss to follow‐up was very small at 3 months (0.5%) |
| Selective reporting (reporting bias) | Unclear risk | Data from 1 week of follow‐up were not reported |
| Other bias | Low risk | No other bias was apparent |
| Methods | Cluster‐randomised trial of a classroom‐based CBT intervention vs wait list for children in war‐affected Burundi | |
| Participants | Included (n = 329) Children screened for exposure to traumatic events, who scored above the standard cutoff on symptom checklists for PTSD (≥ 11)**, depression (≥ 15) or anxiety (≥ 5). Mean age 12.29 years. Female 48% (158). Mean number of traumatic events: intervention 4.6, wait list 4.1; mean PTSD symptom scores: intervention 15.62, wait list 16.30 Excluded Serious psychopathology and psychiatric disorders (mutism, retardation, psychotic symptoms) or incapability to function in a group (conduct disorders, harming others), as judged by local psychosocial counsellors Setting Random selection of schools in 2 northwestern provinces (Bubanza and Cibitoke) in Burundi, 2006 to 2007 | |
| Interventions | Classroom‐based CBT intervention (n = 153) Cognitive‐behavioural techniques including psychoeducation, coping skills and working with the trauma narrative, using creative expressive elements such as drawing, music, drama, dance, structured movement and cooperative games. The manualised intervention consisted of 15 sessions over 5 weeks with classroom‐based groups of around 15 children Therapists Locally identified non‐specialised facilitators were trained and supervised in the intervention for 1 year before the study. Facilitators had a minimum education level of a high school diploma and were selected for their affinity and capacity to work with children Wait list (n = 176) Provision of treatment after the research was completed | |
| Outcomes | PTSD symptoms Scale: Child Post‐Traumatic Symptom Scale (17‐item) Rater: child Depression Scale: Depression Self‐Rating Scale (18‐item) Rater: child Behaviour Scale: not reported but aggression scale was listed in the protocol Rater: not reported Function Scale: function impairment measure (9‐item) Rater: child When At 1 week and 3 months after treatment | |
| Notes | **Criterion validity of the PTSD symptom checklist against a psychiatric diagnostic interview with the Schedule for Affective Disorders and Schizophrenia for School‐Age Children gave an optimum cutoff score for PTSD of 26 (sensitivity 0.71, specificity 0.83) | |
| Risk of bias | ||
| Bias | Authors' judgement | Support for judgement |
| Random sequence generation (selection bias) | Unclear risk | Not described |
| Allocation concealment (selection bias) | Unclear risk | Not described |
| Blinding of participants (performance bias | High risk | Participants would have known whether they were in the intervention or wait list group |
| Blinding of outcome assessment (detection bias) | High risk | Measures were self reported |
| Incomplete outcome data (attrition bias) | Unclear risk | Not described |
| Selective reporting (reporting bias) | Unclear risk | Aggression was not reported but was referred to in the protocol; anxiety was not used because of low values of Cronbach's alpha for the SCARED. One week follow‐up data were not reported for any outcome |
| Other bias | Low risk | None identified |
| Methods | Randomised trial of individual vs group psychotherapy | |
| Participants | Included (n = 75) Girls 6 to 14 years of age who had confirmed contact sexual abuse disclosed within the previous 2 years and experiencing emotional or behavioural disturbance that warranted treatment (n = 58). Mean age 10 years. Ethnicity: white 8, black Caribbean 7, mixed 5, Chinese 5, Mediterranean 4, unknown 2 Excluded Girls with severe developmental delay, psychosis, possibility of further abuse, hospitalisation at evaluation and 'other' clinical and legal issues Setting Two clinics in London: 1 tertiary and 1 community | |
| Interventions | Individual psychotherapy (n = 35 entered therapy) Comprised up to 30 weekly 50‐minute sessions. The first 5 were based on engagement, the next 25 on issues identified as relevant to the child and the final 10 on separation and ending Group psychotherapy (n = 36 entered therapy) Psychoeducational and psychotherapeutic. Participants attended up to 18 sessions Face‐to‐face contact time was comparable overall with individual sessions Therapists For both interventions, therapy was manualised and supervised. Therapists were trainee psychotherapists or experienced mental health professionals | |
| Outcomes | PTSD symptoms Scale: Schedule for Affective Disorders and Schizophrenia for School‐Age Children (K‐SADS, shortened version) Rater: clinician PTSD symptoms Scale: Orvaschel's PTSD scale (19‐item) Rater: clinician Function Scale: Kiddie Global Assessment Scale Rater: clinician Cost Scale: GBP When At 12 and 24 months | |
| Notes | ||
| Risk of bias | ||
| Bias | Authors' judgement | Support for judgement |
| Random sequence generation (selection bias) | Unclear risk | Not reported |
| Allocation concealment (selection bias) | Unclear risk | Not reported |
| Blinding of participants (performance bias | Unclear risk | Although all participants received therapy, they would have known whether they received individual or group treatment |
| Blinding of outcome assessment (detection bias) | Unclear risk | All outcomes were clinician rated, but blinding was not reported |
| Incomplete outcome data (attrition bias) | Unclear risk | Last observation carried forward analyses were used, but completer data (means and SDs) were reported. Loss to follow‐up: 23% |
| Selective reporting (reporting bias) | High risk | Depression, anxiety and hyperarousal were not reported |
| Other bias | Low risk | No other bias was apparent |
| Methods | Stratified randomised trial of single‐session early psychological intervention for children after road traffic accidents vs standard care | |
| Participants | Included (n = 101) Children or adolescents receiving inpatient or outpatient medical treatment after a road traffic accident, who were fluent in German Excluded Severe head injury (Glasgow Coma Scale > 11) or previous evidence of intellectual impairment Setting University Children’s Hospital in Zurich, Switzerland, 2004 to 2007 | |
| Interventions | Single‐session early psychological intervention (n = 51) The manualised intervention was provided to the child and ≥ 1 parent around 10 days after the child’s involvement in a road traffic accident. The psychologist used a series of standard prompts systematically to guide the child through a structured, 4‐step process, including detailed reconstruction of the accident and creation of a trauma narrative with drawings and toys used as aids, identification of accident‐related appraisals by asking children about trauma‐related thoughts and assistance modifying dysfunctional appraisals and psychoeducation on common stress reactions. The psychologist then discussed with the child and the parents helpful strategies for dealing with acute stress reactions, and parents were given advice on how to support their child, along with written information on post‐traumatic stress and a contact address Children of this group received standard medical care, including clinical diagnostics and comprehensive medical treatment. Psychological support was available but was not routinely provided Therapist The therapist was a psychologist. No other details were reported | |
| Outcomes | PTSD symptoms Scale: Clinician‐Administered PTSD Scale for Children and Adolescents (CAPS‐CA) Rater: clinician Depression Scale: Children’s Depression Inventory (26‐item) Rater: child/adolescent Behaviour Scale: Child Behavior Checklist (120‐item) Rater: parent When At 2 and 6 months | |
| Notes | ||
| Risk of bias | ||
| Bias | Authors' judgement | Support for judgement |
| Random sequence generation (selection bias) | Unclear risk | The randomisation list, stratified by gender, was generated by a computer programme |
| Allocation concealment (selection bias) | Unclear risk | Not reported |
| Blinding of participants (performance bias | High risk | Participants probably were aware of whether they were in an active or control group |
| Blinding of outcome assessment (detection bias) | High risk | Not reported, but 2 of the 3 measures were child and parent reported |
| Incomplete outcome data (attrition bias) | Low risk | ITT not used, but loss to follow‐up was small: 2 months 1%, 6 months 2% |
| Selective reporting (reporting bias) | Low risk | All outcomes appear to have been reported |
| Other bias | Low risk | No other bias was apparent |
CDI: Children's Depression Inventory
Characteristics of excluded studies [ordered by study ID]
| Study | Reason for exclusion |
| Not screened for trauma | |
| Screened for depression but not trauma | |
| Not randomised; matched control | |
| All participants had to meet criteria for PTSD to be included in this study; therefore, it was reviewed in Gillies 2012 | |
| All participants had scores > 18 on the CRIES‐13, which was cited as 81% sensitivity and 77% specificity for PTSD ‐ to be reviewed in the update of Gillies 2012 | |
| All participants had to meet criteria for PTSD to be included in this study; therefore, it was reviewed in Gillies 2012 | |
| Exposure to trauma was not an inclusion criterion | |
| Intervention for mothers only | |
| Not randomised | |
| No data reported, and study authors could not be contacted | |
| All participants had to meet criteria for PTSD to be included in this study; therefore, it was reviewed in Gillies 2012 | |
| Exposure to trauma was not an inclusion criterion | |
| Not randomised; matched control | |
| Pre‐post study | |
| Partcipants were sequentially allocated to groups | |
| Not screened for trauma | |
| All participants had to meet criteria for PTSD; therefore, this study will be reviewed in the update of Gillies 2012 | |
| Not randomised | |
| Included participants had scores ≥ 15 on the Child PTSD Symptom Scale, which is considered diagnostic of PTSD ‐ to be included in the update of Gillies 2012 | |
| Exposure to trauma was not an inclusion criterion | |
| Randomised trial of stepped care versus usual care | |
| Data for randomised controls not reported and could not be obtained | |
| Case control study | |
| All participants had to be diagnosed with PTSD to be included in this study; therefore, it was reviewed in Gillies 2012 | |
| Children were alternately allocated to trauma‐focused interpersonal therapy or CBT | |
| Interim analysis of the data (30/55 not LTFU – 86 randomised in total with 31 LTFU at this report) | |
| Did not report included outcomes | |
| Mean baseline trauma symptom item scores (PTSD‐RI 38‐item trauma symptom scale) were 1.88 in the TF‐CBT group and 1.75 in the TAU group ‐ to be reviewed in the update of Gillies 2012 | |
| Families were alternately allocated; loss to follow‐up was 75% in the no treatment group | |
| Intervention was not a psychological therapy | |
| Ongoing study of cognitive processing therapy versus usual care for treatment of adolescents and young adults with PTSD following abuse. To be reviewed in the update of Gillies 2012 | |
| Not screened for trauma | |
| All participants had to meet criteria for PTSD to be included in this study; therefore, it was reviewed in Gillies 2012 | |
| Study of Lifeline‐NET, short‐term narrative exposure therapy for refugees and asylum Seekers aged 16 to 60 years with PTSD. This will be reviewed in the update of Gillies 2012 | |
| Only 1 of 10 participants in the usual care group were followed up | |
| Average age of participants was 19 years | |
| All participants had to meet criteria for PTSD to be included in this study; therefore, it was reviewed in Gillies 2012 | |
| Less than 50% of the intervention group were randomised | |
| No comparison group | |
| Not randomised | |
| Study of attachment‐based play therapy compared to supportive therapy for children with developmental trauma disorder. This will be reviewed in the update of Gillies 2012 | |
| Both interventions working with mother, although directed at the parent/child interaction | |
| Not randomised | |
| Not screened for trauma; case control study | |
| Not randomised | |
| Not randomised |
LTFU: Loss to follow‐up
Characteristics of studies awaiting assessment [ordered by study ID]
| Methods | Randomised single‐blind trial of narrative exposure therapy for violent offenders versus no treatment for aggressive behaviour and symptoms of PTSD in former street children and vulnerable children in Burundi |
| Participants | Included: male former street children and vulnerable children in Burundi 12 to 23 years of age who took part in an aid programme for reintegration into society and demonstrated positive emotions towards aggressive behavior (n = 42) Excluded: those with current substance dependence, those with use of antipsychotic drugs, chronically ill children |
| Interventions | Narrative exposure therapy for violent offenders (NETvo): With the assistance of the therapist over 4 sessions, the client constructs a chronological narrative of his life with a focus on exposure to traumatic stress and perpetrated violent acts. Key components of the therapist's behaviour are empathic understanding, active listening, congruency and unconditional positive regard, while asking about emotions, cognitions, sensory information and physiological reactions, and linking these to an autobiographical context. Positive emotions and cognitions reported for violent acts are linked to the respective past. In the fifth session, plans and ideas for the future are developed to assist reintegration into society Control: no treatment |
| Outcomes | Aggressive behavior: Appetitive Aggressions Scale for children and students All measured at 6 months |
| Notes | Contact: Anselm Crombach, University of Konstanz Trial identifier: NCT01519193 |
| Methods | Parallel single‐blind RCT comparing NET truth education, conflict resolution training and traditional methods for previously abducted and other vulnerable youths in Northern Uganda |
| Participants | Included: males and females 12 to 30 years of age (n = 600). Participants had to have a diagnosis of PTSD to be included in the individual NET trial, but all youths in the selected vocational training centres are eligible for inclusion in the trial of group interventions |
| Interventions | NET truth education: individual narrative exposure and truth education in groups Conflict resolution and social competence skills; conflict resolution and social competence skills in groups Traditional methods: methods collected by local teachers to help vulnerable children and youths in Northern Uganda |
| Outcomes | Primary outcomes: PTSD symptoms and functional level at 6 and 12 months of follow‐up |
| Notes | Contact: Prof. Dr. Thomas Elbert, University of Konstanz Trial identifier: NCT00893750 |
| Methods | Parallel RCT of FORNET versus CBT versus treatment as usual |
| Participants | Included: 44 former young male offenders 10 to 30 years of age with high levels of aggression and exposed to traumatic stress in South Africa Excluded: participants with neurological or psychiatric disorders other than those resulting from exposure to trauma, including chronic psychosis or acute substance use |
| Interventions | FORNET: a narrative exposure therapy adapted to forensic offender rehabilitation CBT Treatment as usual |
| Outcomes | Primary outcome measures: change in PTSD symptom severity with the Post‐Traumatic Stress Disorder Scale ‐ Interview Secondary outcome measures: change in self committed violence with the Appetitive Aggression Scale All measured at 6 and 12 months post‐treatment follow‐up |
| Notes | Contact: Prof. Dr. Thomas Elbert, University of Konstanz Trial identifier: NCT02012738 |
| Methods | Parallel RCT of trauma‐focused CBT compared with treatment as usual treatment for children exposed or subjected to intimate partner violence or child abuse |
| Participants | Included 1. Children and adolescents 5 to 17 years of age attending child psychiatric services exposed to intimate partner violence or child abuse as measured by the revised Conflict Tactics Scale 2 (CTS2) or child version (CTS‐C). Excluded: Child with IQ < 70 or pervasive developmental disorder; child or parent needs an interpreter to fulfil treatment; parent unable to take part in the treatment; child needs inpatient treatment. Setting Child psychiatric services, Sweden |
| Interventions | Trauma‐focused CBT 10‐15 sessions of Individual trauma‐focused CBT Treatment as usual |
| Outcomes | Trauma symptoms, psychiatric symptoms, psychological well‐being at the end of treatment and one year from treatment |
| Notes | Contact: Ole Hultmann Trial identifier: ISRCTN58027256 (Retrospectively registered) |
| Methods | Randomised trial comparing the intervention 'Letting the Future In' with a wait list control for children affected by sexual abuse in the UK |
| Participants | Included: children aged between 4‐17 years who have made a disclosure of sexual abuse and who have a safe carer who is willing to participate. Excluded: those with severe learning disability |
| Interventions | Letting the Future In: Up to 24 sessions with a trained social worker or therapist. LTFI also emphasises work with the child’s safe carer, who may receive up to six individual sessions as well as joint sessions with the child. Wait list Offered therapy after 6 months |
| Outcomes | Trauma symptoms, victimisation, parenting stress at baseline and 3 and 12 months follow‐up |
| Notes | Contact: Tricia Jessiman Trial identifier: ISRCTN65340805 |
| Methods | Randomised controlled trial of Coping Coach, a Web‐based preventive intervention to prevent or reduce symptoms of post‐traumatic stress after acute paediatric medical events compared with wait list |
| Participants | Included: children 8 to 12 years of age who had experienced a medical event, have access to Internet and telephone and have sufficient competency in English to complete measures and understand the intervention, Philadelphia, USA |
| Interventions | Coping Coach: Children in the intervention condition will complete module 1. Feelings identification in the hospital and instructions on how to complete module 2. Appraisals and module 3. Avoidance online Wait list: After 12‐week assessment, children will receive instructions for completing the intervention |
| Outcomes | PTSD symptoms, coping, health‐related quality of life |
| Notes | Contact: Nancy Kassam‐Adams PhD, Center for Injury Research & Prevention, Children's Hospital of Philadelphia Trial identifier: NCT01653288 |
| Methods | Parallel randomised single‐blind trial of brief early psychological intervention versus standard medical care for children and adolescents hospitalised for burns or road traffic accident injury |
| Participants | Included: children and adolescents (2 to 16 years of age) hospitalised for burns or road traffic accident injury, with Glasgow Coma Scale (GCS) > 8, German speaking, with burn accident or road traffic accident, at high risk of developing PTSD in Zurich, Switzerland Excluded: those with > 2 weeks in the paediatric intensive care unit, with previous mental retardation |
| Interventions | Intervention: age‐appropriate 2‐session intervention that includes detailed reconstruction of the accident, psychoeducation and discussion of helpful coping strategies. Both control and intervention groups are reassessed by blind raters at 3 and 6 months after the accident Standard medical care: not described |
| Outcomes | Post‐traumatic stress symptoms, depression, anxiety, behaviour, health‐related quality of life 3 and 6 months after the accident |
| Notes | Contact: Markus Landolt PhD, Psychosomatic and Psychiatry, University Children's Hospital Zurich Trial identifier: unknown |
| Methods | RCT of group CBT with and without an art and sport intervention, art and sport alone and control for adolescents who survived the Bam earthquake |
| Participants | Included (n = 200) Adolescents with PTSD symptoms who survived the Bam earthquake. Setting Iran |
| Interventions | Group CBT: includes CBT with and without an art and sport intervention Control: no treatment or an art and sport intervention |
| Outcomes | PTSD symptoms |
| Notes | Contact: J Mahmoudi‐Gharaei, Hospital Tehran University of Medical Sciences. Trial identifier: unknown |
| Methods | Randomised trial of cognitive processing therapy versus control |
| Participants | Included (n = 60) Male students in first, second and third high school grades in Uromia who had experienced traumatic events Setting Iran |
| Interventions | Cognitive processing therapy: holographic reprocessing Control |
| Outcomes | PTSD symptoms Anxiety Depression |
| Notes | Contact: Trial identifier: Status September 2016: Information about methods and data needed |
| Methods | Cluster‐randomised non‐blinded trial of Teaching Recovery Techniques versus wait list in young migrants exposed to war‐related trauma |
| Participants | Included males and females 11 to 17 years of age exposed to war‐related trauma before migrating to Australia, lived in Australia for less than 7 years, self reporting symptoms of PTSD Excluded diagnosis of PTSD, limited English, non‐accompanied humanitarian entrant, currently receiving psychological treatment for PTSD |
| Interventions | Teaching Recovery Techniques (Smith et al., 2000): group‐based CBT aimed at educating children about their symptoms and teaching adaptive coping strategies, which include creation of self coping statements, relaxation and exposure strategies (manual and workbook available from www.childrenandwar.org). The intervention runs for 1 hour a week for 8 weeks and is facilitated by 2 trained facilitators Wait list: will not receive any intervention until the end of the trial |
| Outcomes | PTSD symptoms, depression, anxiety at baseline, post‐test and 3 months follow‐up |
| Notes | Contact: Dr Chew Ooi, School of Psychology Curtin University, [email protected] Trial identifier: ACTRN12611000948998 (Retrospectively registered) Status September 2016: |
| Methods | Parallel repeated‐measures intention‐to‐treat RCT of family therapy versus CBT |
| Participants | Included: adolescents 13 to 17 years of age who met American Society for Addiction Medicine criteria for outpatient substance abuse treatment, at least mild trauma symptoms on the PTSD‐Reaction Index following Hurricane Katrina and not receiving other behavioural treatment Excluded: adolescents with mental retardation, pervasive developmental disorders, psychotic disorder or current suicidality |
| Interventions | Multi‐dimensional family therapy (MDFT): a multi‐system family‐based approach designed to address the multiple developmental disruptions and symptoms that result from interaction of individual, family, peer and community risk factors Group CBT: peer group‐based CBT model based on established guidelines for CBT therapy for teen substance abuse by targeting cognitions about use and focusing on accompanying problem behaviours such as poor academic performance and limited social skills |
| Outcomes | Trauma symptoms: revised PTSD‐RI School problems: based on school records Delinquency: court records and the National Youth Survey Self‐Report Delinquency Scale All measured 1 year before intake through 12‐month follow‐up |
| Notes | Contact: Cynthia Rowe, Research Associate Professor, University of Miami Trial identifier: NCT01859000 |
| Methods | Parallel randomised double‐blind trial of a Web‐based intervention versus control for adolescents affected by natural disaster |
| Participants | Included: adolescents 12 to 17 years of age residing in identified locations at the time of disaster who had home Internet connectivity and their primary caregiver, USA Excluded: those for whom primary caregiver was not available |
| Interventions | Bounce Back Now: a Web‐based child, parenting and parent psychoeducation and self help Website Control: child and parent Web‐based assessment |
| Outcomes | Adolescent and parent mental health symptoms, parent/child conflict and relationship |
| Notes | Contact: Kenneth Ruggiero PhD, Medical University of South Carolina Trial identifier: NCT01606514 |
| Methods | Randomised trial of Expressive group counselling versus control |
| Participants | Included (n = 120) Children who were 'affected by earthquake but had no grave psychic trauma' Setting China |
| Interventions | Expressive group counselling (n = 60) Control (n = 60) |
| Outcomes | Anxiety Scale: Social Anxiety Scale for Children Rater: child/adolescent When Post treatment |
| Notes | Contact: unknown Trial identifier: unknown |
| Methods | Parallel randomised single‐blind trial of guided narrative technique versus expressive writing instruction group for children affected by earthquake |
| Participants | Included: children 9 to 14 years of age who had experienced the earthquake in Beichuan County, China, and did not attend other trauma‐focused interventions Excluded: children who cannot write |
| Interventions | Guided narrative technique: writing instructions Control: expressive writing instruction group |
| Outcomes | PTSD, depression, anxiety, coping, social support, outlook scores |
| Notes | Contact: Yinyin Zang, Nigel Hunt, Nottingham University, Trial identifier: ChiCTR‐TRC‐12002940, ChiCTR‐TRC‐12002941 registered retrospectively |
Characteristics of ongoing studies [ordered by study ID]
| Trial name or title | FamilyLive Feasibility and Effectiveness Study |
| Methods | Parallel RCT of FamilyLive versus standard mental health treatment in children exposed to neglect |
| Participants | Included: children 5 to 17 years of age exposed to neglect, enrolled in treatment at the Kennedy Krieger Family Center, who continue to exhibit behavior dysregulation (CBCL > 60) and/or attachment difficulties after 3 months of standard mental health care treatments; and their parents who also have a history of neglect with or without trauma (n = 300), Baltimore, USA Excluded: children with cardiac arrhythmias, with endocrine disorders associated with heart rate irregularities, not able to co‐operate with or understand study procedures, Non‐English‐speaking children, hearing impaired, children in foster care |
| Interventions | FamilyLive: an intervention for families with a history of intergenerational neglect and trauma exposure aimed at unresolved and untreated histories of neglect and disrupted attachment and providing support to improve parental self care, stress management, emotional regulation, self awareness and management of children's responses and behaviours Standard mental health treatment: standard trauma‐informed mental health treatment |
| Outcomes | Behaviour; post‐traumatic stress disorder symptoms; function at baseline, 3, 6 and 12 months |
| Starting date | February 2009 |
| Contact information | Contact: Harolyn M.E. Belcher, MD |
| Notes | Trial identifier: NCT01524185 Status September 2016: active, not recruiting Estimated study completion: November 2021 |
| Trial name or title | Randomized Controlled Trial of Trauma‐Focused CBT in Tanzania and Kenya for Children Whose Parent Has Died |
| Methods | Parallel RCT of 12‐week trauma‐focused CBT group treatment for children and their guardians versus usual care |
| Participants | Included children 7 to 13 years of age living in Moshi, Tanzania, or Bungoma, Kenya, who have had 1 or both parents die since they were 3 years of age or older, those with symptoms of traumatic grief and/or traumatic stress, those living with an adult guardian willing to participate in 12 weekly group sessions Excluded children living in an institution |
| Interventions | Trauma‐focused CBT |
| Outcomes | PTSD, behaviour, traumatic grief, function, child/guardian relationship |
| Starting date | August 2012 |
| Contact information | Shannon Dorsey PhD, University of Washington Department of Psychology |
| Notes | Trial identifier: NCT01822366 Status September 2016: This study is ongoing, but not recruiting participants Estimated study completion: December 2017 |
| Trial name or title | A Randomized Comparison of Eye Movement Desensitization and Reprocessing (EMDR) and Cognitive Behavioral Writing Therapy (CBWT) in Pediatric Post‐Traumatic Stress Disorder Following Single‐Incident Trauma |
| Methods | Parallel randomised single‐blind trial of EMDR versus cognitive‐behavioural writing therapy in children and adolescents following single‐incident trauma |
| Participants | Included: children and adolescents between 8 and 18 years of age who have experienced a single traumatic event, have had 5 post‐traumatic stress symptoms after 1 month, with sufficient Dutch language, The Netherlands Excluded: those with acute psychiatric problems (suicidality, psychosis), IQ < 80 |
| Interventions | EMDR: requires the client to attend a distracting stimulus, typically the therapist’s fingers moving back and forth, while concentrating on the trauma memory. Treatment consists of (1) history taking and treatment planning, (2) explanation of and preparation for EMDR, (3) preparation of the target memory, (4) desensitisation of the memory, (5) guidance for the client to embrace a relevant positive belief regarding the event, (6) identification and processing of any residual disturbing body sensations, (7) closure of the session and (8) re‐evaluation |
| Outcomes | PTSD symptoms, anxiety, depression, somatic and behavioural symptoms, quality of life, post‐traumatic cognitions, somatic symptoms, post‐traumatic growth |
| Starting date | October 2010 |
| Contact information | Carlijn de Roos Psychotrauma Centre for Children and Youth, MHI Rivierduinen |
| Notes | Trial identifier: NTR3870 Status September 2016: open for patient inclusion |
| Trial name or title | Online Group‐Based Cognitive‐Behavioural Therapy for Adolescents and Young Adults After Cancer Treatment |
| Methods | Cluster‐randomised single‐blind trial of Recapture Life, an online group‐based CBT, versus on‐line peer support and wait list for adolescents and young adults following cancer treatment |
| Participants | Included adolescents and young adults 15 to 25 years of age who had finished cancer treatment in the preceding 1 to 6 months, were able to read English and provide contact details of a trusted health professional and had access to the Internet in a private location, Australia Excluded those with insufficient English language skills to complete the intake interview, extremely severe depression and/or serious suicidal intent, symptoms of psychosis or substance abuse |
| Interventions | Recapture Life: Sessions focus on acquisition and application of cognitive‐behavioural skills, such as cognitive restructuring and problem solving to returning to normality after cancer treatment. Delivered over the Internet by a clinical psychologist in 6 weekly 90‐minute group sessions with a 1‐off 'booster' session 6 weeks afterwards Peer support group: gives young cancer survivors an open forum to discuss their experience and includes non‐directive counselling with no cognitive‐behavioural components Delivered over the Internet by a clinical psychologist in 6 weekly 90‐minute group sessions with a 1‐off 'booster' session 6 weeks afterwards Wait list |
| Outcomes | Quality of life, depression, anxiety, stress, family functioning, coping, cancer‐related identity |
| Starting date | 30 August 2010 |
| Contact information | Ursula M. Sansom‐Daly |
| Notes | Trial identifier: ACTRN12610000717055 Status September 2016: Recruiting Estimated study completion: |
| Trial name or title | Prevention of Depression in Maltreated and Non‐Maltreated Adolescents |
| Methods | Parallel randomised open trial of interpersonal therapy for adolescents versus enhanced care |
| Participants | Included: maltreated and non‐maltreated adolescent girls 13 to 15 years of age of low socioeconomic status (girls in the maltreated depressive symptom group will have Child Protection Service‐documented child maltreatment) who live in Rochester or surrounding counties, USA Excluded: those taking antidepressants or prescription medications for anxiety, receiving mental health treatment, actively suicidal, diagnosed with a severe mental disorder, abusing drugs or alcohol, compromised cognitive ability, pervasive developmental disorder, major physical or neurological disorder, non‐English speaking |
| Interventions | Interpersonal psychotherapy for adolescents: a manualised intervention for depression and prevention of depression that emphasises current interpersonal relationships, while focusing on immediate social context Enhanced care: consistent with care typically provided in community settings to treat and prevent depression |
| Outcomes | Depression |
| Starting date | July 2011 |
| Contact information | Sheree Toth University of Rochester 585‐275‐2991 |
| Notes | Trial identifier: http://grantome.com/grant/NIH/R01‐MH091070‐04 Status September 2016: Estimated study completion: May 2016 |
Data and analyses
| Outcome or subgroup title | No. of studies | No. of participants | Statistical method | Effect size |
| 1 PTSD diagnosis Show forest plot | 5 | 874 | Odds Ratio (M‐H, Random, 95% CI) | 0.51 [0.34, 0.77] |
| Analysis 1.1  Comparison 1 All psychotherapies versus control (short‐term), Outcome 1 PTSD diagnosis. | ||||
| 1.1 CBT | 3 | 769 | Odds Ratio (M‐H, Random, 95% CI) | 0.59 [0.43, 0.80] |
| 1.2 EMDR | 1 | 40 | Odds Ratio (M‐H, Random, 95% CI) | 0.2 [0.01, 4.44] |
| 1.3 Family therapy | 1 | 65 | Odds Ratio (M‐H, Random, 95% CI) | 0.11 [0.02, 0.56] |
| 2 PTSD total symptoms Show forest plot | 15 | 2051 | Std. Mean Difference (IV, Random, 95% CI) | ‐0.42 [‐0.61, ‐0.24] |
| Analysis 1.2 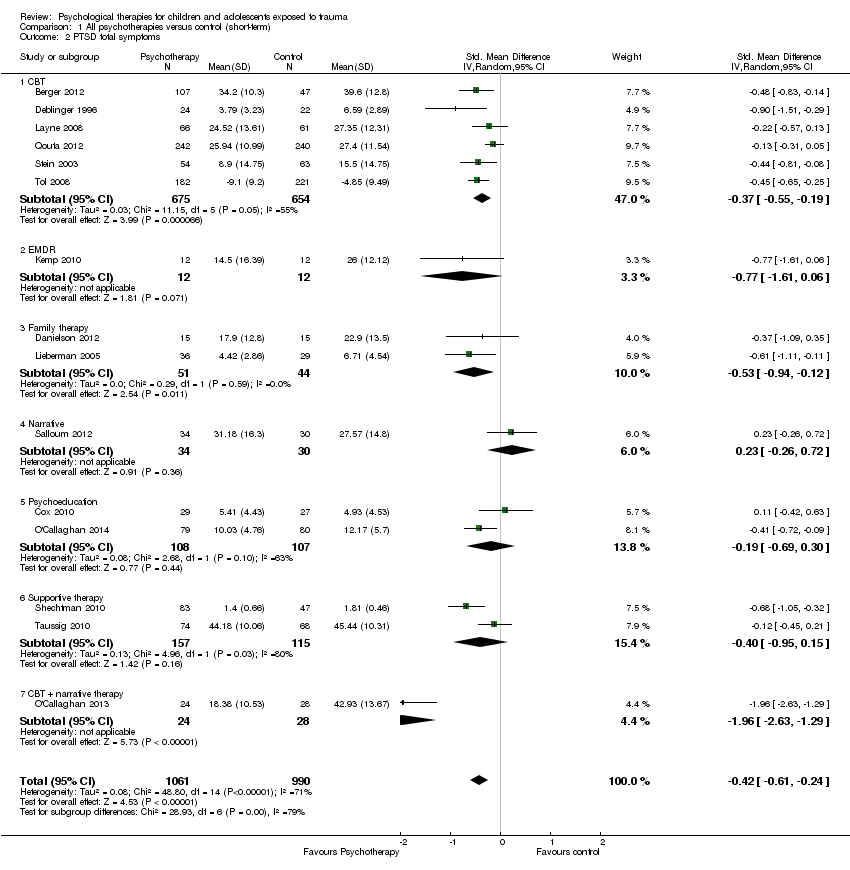 Comparison 1 All psychotherapies versus control (short‐term), Outcome 2 PTSD total symptoms. | ||||
| 2.1 CBT | 6 | 1329 | Std. Mean Difference (IV, Random, 95% CI) | ‐0.37 [‐0.55, ‐0.19] |
| 2.2 EMDR | 1 | 24 | Std. Mean Difference (IV, Random, 95% CI) | ‐0.77 [‐1.61, 0.06] |
| 2.3 Family therapy | 2 | 95 | Std. Mean Difference (IV, Random, 95% CI) | ‐0.53 [‐0.94, ‐0.12] |
| 2.4 Narrative | 1 | 64 | Std. Mean Difference (IV, Random, 95% CI) | 0.23 [‐0.26, 0.72] |
| 2.5 Psychoeducation | 2 | 215 | Std. Mean Difference (IV, Random, 95% CI) | ‐0.19 [‐0.69, 0.30] |
| 2.6 Supportive therapy | 2 | 272 | Std. Mean Difference (IV, Random, 95% CI) | ‐0.40 [‐0.95, 0.15] |
| 2.7 CBT + narrative therapy | 1 | 52 | Std. Mean Difference (IV, Random, 95% CI) | ‐1.96 [‐2.63, ‐1.29] |
| 3 PTSD avoidance Show forest plot | 2 | 205 | Std. Mean Difference (IV, Random, 95% CI) | ‐0.02 [‐0.29, 0.26] |
| Analysis 1.3  Comparison 1 All psychotherapies versus control (short‐term), Outcome 3 PTSD avoidance. | ||||
| 3.1 Narrative | 1 | 158 | Std. Mean Difference (IV, Random, 95% CI) | 0.05 [‐0.27, 0.36] |
| 3.2 Psychoeducation | 1 | 47 | Std. Mean Difference (IV, Random, 95% CI) | ‐0.23 [‐0.80, 0.35] |
| 4 PTSD hyperarousal Show forest plot | 2 | 205 | Std. Mean Difference (IV, Random, 95% CI) | 0.05 [‐0.22, 0.32] |
| Analysis 1.4  Comparison 1 All psychotherapies versus control (short‐term), Outcome 4 PTSD hyperarousal. | ||||
| 4.1 Narrative | 1 | 158 | Std. Mean Difference (IV, Random, 95% CI) | 0.10 [‐0.21, 0.41] |
| 4.2 Psychoeducation | 1 | 47 | Std. Mean Difference (IV, Random, 95% CI) | ‐0.12 [‐0.70, 0.45] |
| 5 PTSD intrusion Show forest plot | 2 | 205 | Std. Mean Difference (IV, Random, 95% CI) | 0.11 [‐0.16, 0.39] |
| Analysis 1.5  Comparison 1 All psychotherapies versus control (short‐term), Outcome 5 PTSD intrusion. | ||||
| 5.1 Narrative | 1 | 158 | Std. Mean Difference (IV, Random, 95% CI) | 0.15 [‐0.16, 0.46] |
| 5.2 Psychoeducation | 1 | 47 | Std. Mean Difference (IV, Random, 95% CI) | ‐0.02 [‐0.59, 0.55] |
| 6 Anxiety total symptoms Show forest plot | 7 | 959 | Std. Mean Difference (IV, Random, 95% CI) | ‐0.13 [‐0.26, 0.00] |
| Analysis 1.6 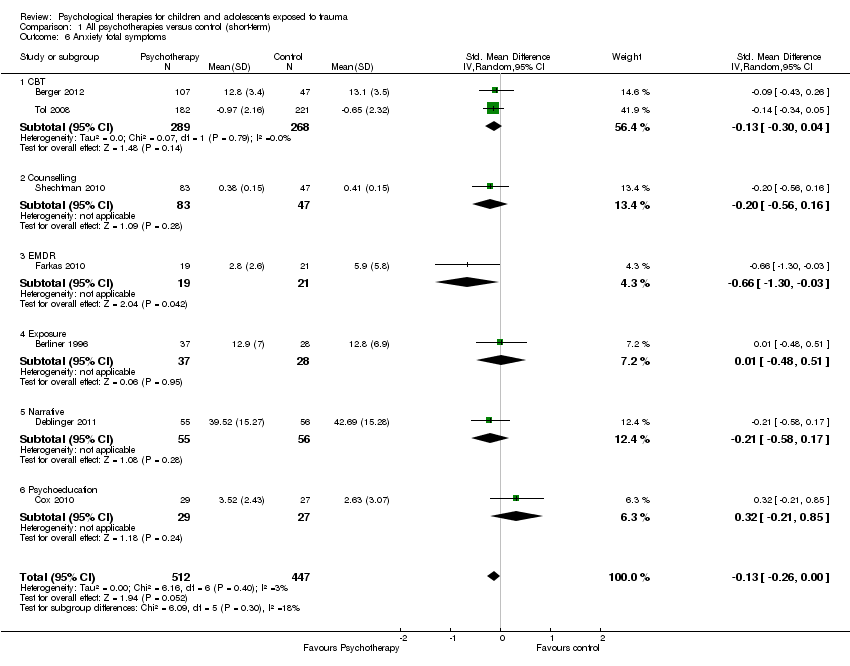 Comparison 1 All psychotherapies versus control (short‐term), Outcome 6 Anxiety total symptoms. | ||||
| 6.1 CBT | 2 | 557 | Std. Mean Difference (IV, Random, 95% CI) | ‐0.13 [‐0.30, 0.04] |
| 6.2 Counselling | 1 | 130 | Std. Mean Difference (IV, Random, 95% CI) | ‐0.20 [‐0.56, 0.16] |
| 6.3 EMDR | 1 | 40 | Std. Mean Difference (IV, Random, 95% CI) | ‐0.66 [‐1.30, ‐0.03] |
| 6.4 Exposure | 1 | 65 | Std. Mean Difference (IV, Random, 95% CI) | 0.01 [‐0.48, 0.51] |
| 6.5 Narrative | 1 | 111 | Std. Mean Difference (IV, Random, 95% CI) | ‐0.21 [‐0.58, 0.17] |
| 6.6 Psychoeducation | 1 | 56 | Std. Mean Difference (IV, Random, 95% CI) | 0.32 [‐0.21, 0.85] |
| 7 Anxiety ‐ state Show forest plot | 2 | 70 | Std. Mean Difference (IV, Random, 95% CI) | ‐0.64 [‐1.12, ‐0.16] |
| Analysis 1.7 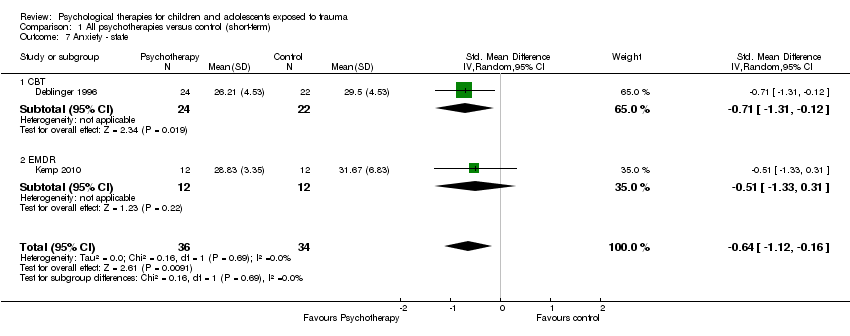 Comparison 1 All psychotherapies versus control (short‐term), Outcome 7 Anxiety ‐ state. | ||||
| 7.1 CBT | 1 | 46 | Std. Mean Difference (IV, Random, 95% CI) | ‐0.71 [‐1.31, ‐0.12] |
| 7.2 EMDR | 1 | 24 | Std. Mean Difference (IV, Random, 95% CI) | ‐0.51 [‐1.33, 0.31] |
| 8 Anxiety ‐ trait Show forest plot | 2 | 70 | Std. Mean Difference (IV, Random, 95% CI) | ‐0.34 [‐0.81, 0.14] |
| Analysis 1.8 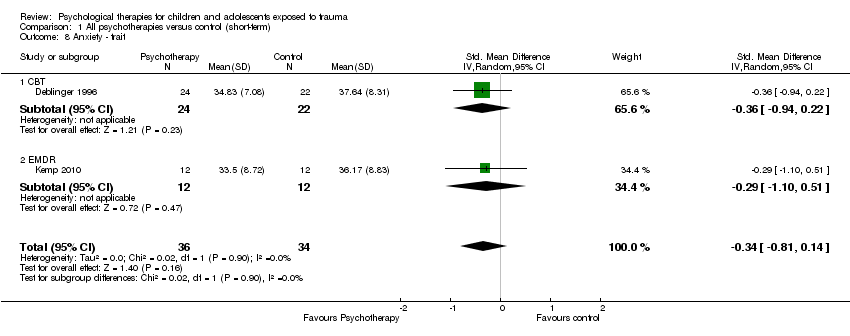 Comparison 1 All psychotherapies versus control (short‐term), Outcome 8 Anxiety ‐ trait. | ||||
| 8.1 CBT | 1 | 46 | Std. Mean Difference (IV, Random, 95% CI) | ‐0.36 [‐0.94, 0.22] |
| 8.2 EMDR | 1 | 24 | Std. Mean Difference (IV, Random, 95% CI) | ‐0.29 [‐1.10, 0.51] |
| 9 Depression Show forest plot | 13 | 1569 | Std. Mean Difference (IV, Random, 95% CI) | ‐0.13 [‐0.30, 0.04] |
| Analysis 1.9  Comparison 1 All psychotherapies versus control (short‐term), Outcome 9 Depression. | ||||
| 9.1 CBT | 6 | 1191 | Std. Mean Difference (IV, Random, 95% CI) | ‐0.21 [‐0.42, ‐0.00] |
| 9.2 EMDR | 2 | 64 | Std. Mean Difference (IV, Random, 95% CI) | ‐0.39 [‐1.41, 0.64] |
| 9.3 Exposure | 1 | 52 | Std. Mean Difference (IV, Random, 95% CI) | 0.10 [‐0.45, 0.65] |
| 9.4 Family therapy | 1 | 30 | Std. Mean Difference (IV, Random, 95% CI) | 0.05 [‐0.66, 0.77] |
| 9.5 Narrative | 2 | 176 | Std. Mean Difference (IV, Random, 95% CI) | 0.13 [‐0.52, 0.77] |
| 9.6 Psychoeducation | 1 | 56 | Std. Mean Difference (IV, Random, 95% CI) | 0.09 [‐0.43, 0.62] |
| 10 Behaviour ‐ total Show forest plot | 3 | 166 | Std. Mean Difference (IV, Random, 95% CI) | ‐0.04 [‐0.51, 0.42] |
| Analysis 1.10 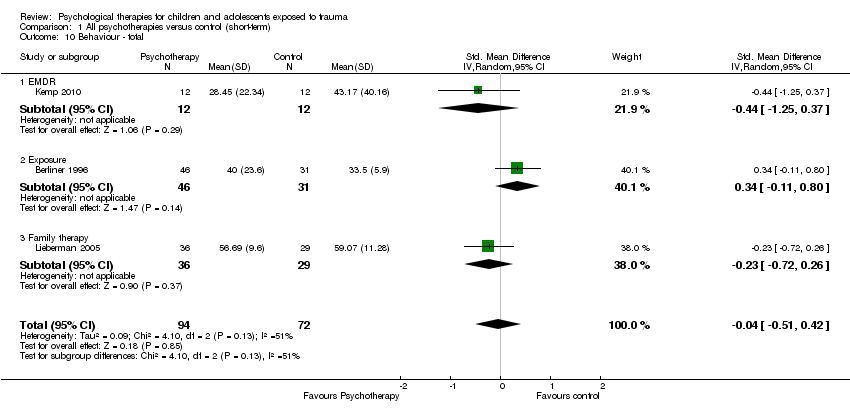 Comparison 1 All psychotherapies versus control (short‐term), Outcome 10 Behaviour ‐ total. | ||||
| 10.1 EMDR | 1 | 24 | Std. Mean Difference (IV, Random, 95% CI) | ‐0.44 [‐1.25, 0.37] |
| 10.2 Exposure | 1 | 77 | Std. Mean Difference (IV, Random, 95% CI) | 0.34 [‐0.11, 0.80] |
| 10.3 Family therapy | 1 | 65 | Std. Mean Difference (IV, Random, 95% CI) | ‐0.23 [‐0.72, 0.26] |
| 11 Behaviour ‐ internalising Show forest plot | 10 | 719 | Std. Mean Difference (IV, Random, 95% CI) | ‐0.04 [‐0.20, 0.13] |
| Analysis 1.11 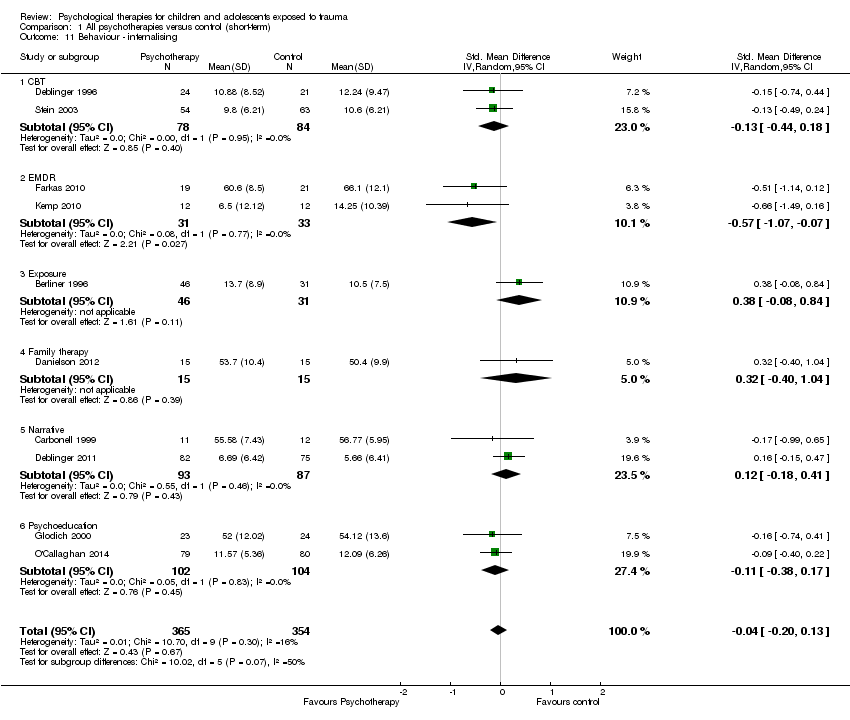 Comparison 1 All psychotherapies versus control (short‐term), Outcome 11 Behaviour ‐ internalising. | ||||
| 11.1 CBT | 2 | 162 | Std. Mean Difference (IV, Random, 95% CI) | ‐0.13 [‐0.44, 0.18] |
| 11.2 EMDR | 2 | 64 | Std. Mean Difference (IV, Random, 95% CI) | ‐0.57 [‐1.07, ‐0.07] |
| 11.3 Exposure | 1 | 77 | Std. Mean Difference (IV, Random, 95% CI) | 0.38 [‐0.08, 0.84] |
| 11.4 Family therapy | 1 | 30 | Std. Mean Difference (IV, Random, 95% CI) | 0.32 [‐0.40, 1.04] |
| 11.5 Narrative | 2 | 180 | Std. Mean Difference (IV, Random, 95% CI) | 0.12 [‐0.18, 0.41] |
| 11.6 Psychoeducation | 2 | 206 | Std. Mean Difference (IV, Random, 95% CI) | ‐0.11 [‐0.38, 0.17] |
| 12 Behaviour ‐ externalising Show forest plot | 12 | 1174 | Std. Mean Difference (IV, Random, 95% CI) | ‐0.10 [‐0.33, 0.14] |
| Analysis 1.12  Comparison 1 All psychotherapies versus control (short‐term), Outcome 12 Behaviour ‐ externalising. | ||||
| 12.1 CBT | 3 | 565 | Std. Mean Difference (IV, Random, 95% CI) | ‐0.11 [‐0.28, 0.06] |
| 12.2 EMDR | 2 | 64 | Std. Mean Difference (IV, Random, 95% CI) | ‐0.55 [‐1.19, 0.10] |
| 12.3 Exposure | 1 | 77 | Std. Mean Difference (IV, Random, 95% CI) | 0.49 [0.03, 0.95] |
| 12.4 Family therapy | 1 | 30 | Std. Mean Difference (IV, Random, 95% CI) | 0.23 [‐0.49, 0.95] |
| 12.5 Narrative | 2 | 180 | Std. Mean Difference (IV, Random, 95% CI) | 0.20 [‐0.41, 0.81] |
| 12.6 Psychoeducation | 2 | 206 | Std. Mean Difference (IV, Random, 95% CI) | ‐0.03 [‐0.52, 0.46] |
| 12.7 CBT + narrative therapy | 1 | 52 | Std. Mean Difference (IV, Random, 95% CI) | ‐1.06 [‐1.64, ‐0.47] |
| 13 Functional impairment Show forest plot | 2 | Std. Mean Difference (IV, Random, 95% CI) | Subtotals only | |
| Analysis 1.13  Comparison 1 All psychotherapies versus control (short‐term), Outcome 13 Functional impairment. | ||||
| 13.1 CBT | 2 | 557 | Std. Mean Difference (IV, Random, 95% CI) | ‐0.41 [‐0.59, ‐0.24] |
| 14 Quality of life Show forest plot | 1 | Std. Mean Difference (IV, Random, 95% CI) | Totals not selected | |
| Analysis 1.14  Comparison 1 All psychotherapies versus control (short‐term), Outcome 14 Quality of life. | ||||
| 14.1 Supportive therapy | 1 | Std. Mean Difference (IV, Random, 95% CI) | 0.0 [0.0, 0.0] | |
| 15 Loss to follow‐up Show forest plot | 26 | 3872 | Risk Ratio (M‐H, Random, 95% CI) | 0.98 [0.69, 1.39] |
| Analysis 1.15  Comparison 1 All psychotherapies versus control (short‐term), Outcome 15 Loss to follow‐up. | ||||
| 15.1 CBT | 14 | 2913 | Risk Ratio (M‐H, Random, 95% CI) | 0.87 [0.47, 1.62] |
| 15.2 Counselling | 1 | 164 | Risk Ratio (M‐H, Random, 95% CI) | 0.56 [0.30, 1.03] |
| 15.3 EMDR | 2 | 92 | Risk Ratio (M‐H, Random, 95% CI) | 1.64 [0.48, 5.59] |
| 15.4 Exposure | 1 | 16 | Risk Ratio (M‐H, Random, 95% CI) | 0.0 [0.0, 0.0] |
| 15.5 Family therapy | 2 | 105 | Risk Ratio (M‐H, Random, 95% CI) | 1.44 [0.48, 4.30] |
| 15.6 Narrative | 2 | 280 | Risk Ratio (M‐H, Random, 95% CI) | 0.87 [0.32, 2.39] |
| 15.7 Psychoeducation | 3 | 274 | Risk Ratio (M‐H, Random, 95% CI) | 1.21 [0.75, 1.96] |
| 15.8 Psychodrama | 1 | 28 | Risk Ratio (M‐H, Random, 95% CI) | 1.5 [0.29, 7.65] |
| Outcome or subgroup title | No. of studies | No. of participants | Statistical method | Effect size |
| 1 PTSD diagnosis Show forest plot | 4 | 742 | Odds Ratio (M‐H, Random, 95% CI) | 0.66 [0.26, 1.69] |
| Analysis 2.1  Comparison 2 All psychotherapies versus control (medium‐term), Outcome 1 PTSD diagnosis. | ||||
| 1.1 CBT | 2 | 570 | Odds Ratio (M‐H, Random, 95% CI) | 0.49 [0.09, 2.61] |
| 1.2 Debriefing | 1 | 132 | Odds Ratio (M‐H, Random, 95% CI) | 1.31 [0.47, 3.68] |
| 1.3 EMDR | 1 | 40 | Odds Ratio (M‐H, Random, 95% CI) | 0.35 [0.01, 9.13] |
| 2 PTSD total symptoms Show forest plot | 12 | 2337 | Std. Mean Difference (IV, Random, 95% CI) | ‐0.17 [‐0.38, 0.05] |
| Analysis 2.2 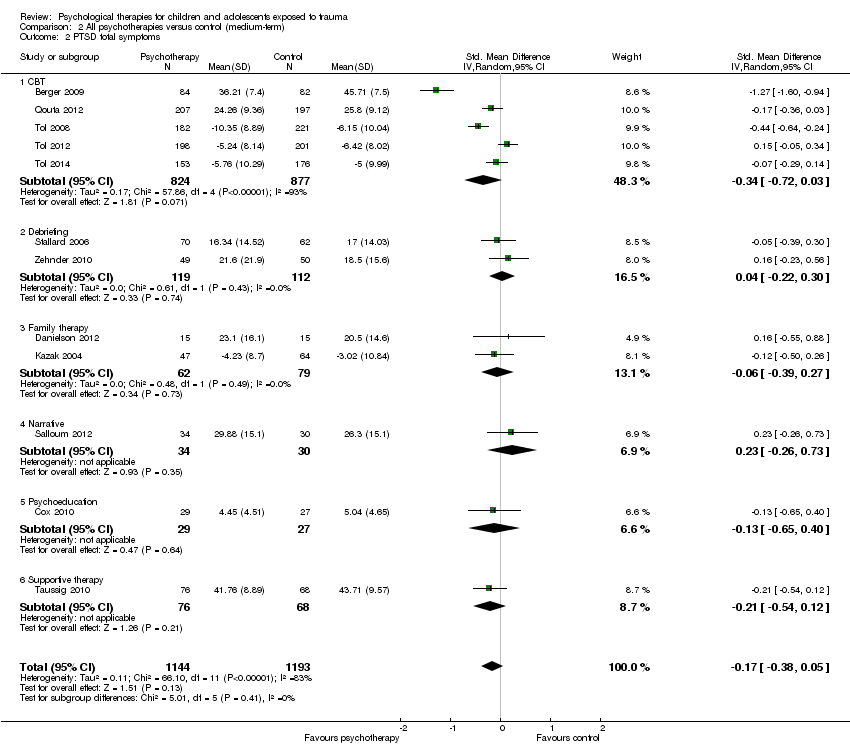 Comparison 2 All psychotherapies versus control (medium‐term), Outcome 2 PTSD total symptoms. | ||||
| 2.1 CBT | 5 | 1701 | Std. Mean Difference (IV, Random, 95% CI) | ‐0.34 [‐0.72, 0.03] |
| 2.2 Debriefing | 2 | 231 | Std. Mean Difference (IV, Random, 95% CI) | 0.04 [‐0.22, 0.30] |
| 2.3 Family therapy | 2 | 141 | Std. Mean Difference (IV, Random, 95% CI) | ‐0.06 [‐0.39, 0.27] |
| 2.4 Narrative | 1 | 64 | Std. Mean Difference (IV, Random, 95% CI) | 0.23 [‐0.26, 0.73] |
| 2.5 Psychoeducation | 1 | 56 | Std. Mean Difference (IV, Random, 95% CI) | ‐0.13 [‐0.65, 0.40] |
| 2.6 Supportive therapy | 1 | 144 | Std. Mean Difference (IV, Random, 95% CI) | ‐0.21 [‐0.54, 0.12] |
| 3 PTSD ‐ avoidance Show forest plot | 2 | 243 | Std. Mean Difference (IV, Fixed, 95% CI) | 0.04 [‐0.22, 0.29] |
| Analysis 2.3 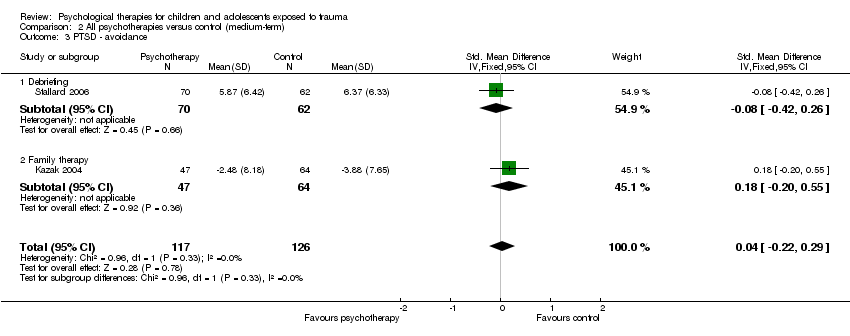 Comparison 2 All psychotherapies versus control (medium‐term), Outcome 3 PTSD ‐ avoidance. | ||||
| 3.1 Debriefing | 1 | 132 | Std. Mean Difference (IV, Fixed, 95% CI) | ‐0.08 [‐0.42, 0.26] |
| 3.2 Family therapy | 1 | 111 | Std. Mean Difference (IV, Fixed, 95% CI) | 0.18 [‐0.20, 0.55] |
| 4 PTSD ‐ hyperarousal Show forest plot | 2 | 243 | Std. Mean Difference (IV, Random, 95% CI) | ‐0.13 [‐0.43, 0.17] |
| Analysis 2.4  Comparison 2 All psychotherapies versus control (medium‐term), Outcome 4 PTSD ‐ hyperarousal. | ||||
| 4.1 Debriefing | 1 | 132 | Std. Mean Difference (IV, Random, 95% CI) | 0.01 [‐0.33, 0.35] |
| 4.2 Family therapy | 1 | 111 | Std. Mean Difference (IV, Random, 95% CI) | ‐0.29 [‐0.67, 0.09] |
| 5 PTSD ‐ intrusion Show forest plot | 2 | 243 | Std. Mean Difference (IV, Fixed, 95% CI) | ‐0.04 [‐0.29, 0.21] |
| Analysis 2.5  Comparison 2 All psychotherapies versus control (medium‐term), Outcome 5 PTSD ‐ intrusion. | ||||
| 5.1 Debriefing | 1 | 132 | Std. Mean Difference (IV, Fixed, 95% CI) | ‐0.05 [‐0.39, 0.29] |
| 5.2 Family therapy | 1 | 111 | Std. Mean Difference (IV, Fixed, 95% CI) | ‐0.03 [‐0.40, 0.35] |
| 6 Anxiety total symptoms Show forest plot | 7 | 1470 | Std. Mean Difference (IV, Random, 95% CI) | ‐0.10 [‐0.20, 0.00] |
| Analysis 2.6 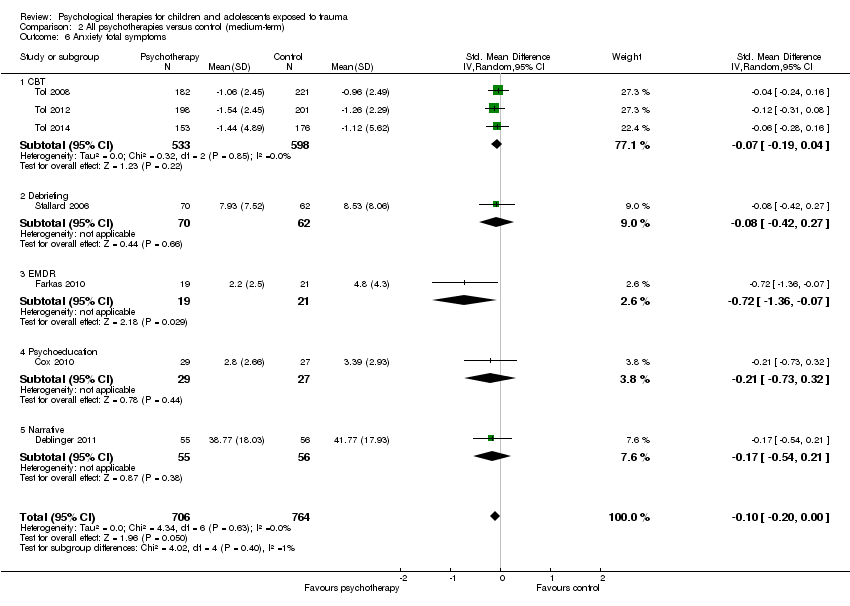 Comparison 2 All psychotherapies versus control (medium‐term), Outcome 6 Anxiety total symptoms. | ||||
| 6.1 CBT | 3 | 1131 | Std. Mean Difference (IV, Random, 95% CI) | ‐0.07 [‐0.19, 0.04] |
| 6.2 Debriefing | 1 | 132 | Std. Mean Difference (IV, Random, 95% CI) | ‐0.08 [‐0.42, 0.27] |
| 6.3 EMDR | 1 | 40 | Std. Mean Difference (IV, Random, 95% CI) | ‐0.72 [‐1.36, ‐0.07] |
| 6.4 Psychoeducation | 1 | 56 | Std. Mean Difference (IV, Random, 95% CI) | ‐0.21 [‐0.73, 0.32] |
| 6.5 Narrative | 1 | 111 | Std. Mean Difference (IV, Random, 95% CI) | ‐0.17 [‐0.54, 0.21] |
| 7 Anxiety ‐ state Show forest plot | 1 | Std. Mean Difference (IV, Fixed, 95% CI) | Totals not selected | |
| Analysis 2.7 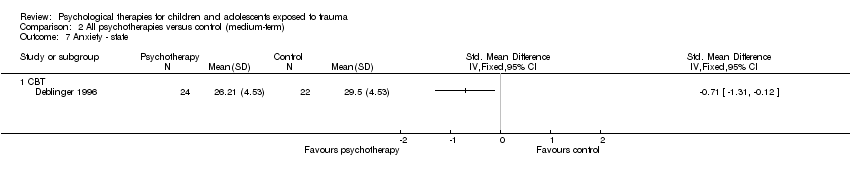 Comparison 2 All psychotherapies versus control (medium‐term), Outcome 7 Anxiety ‐ state. | ||||
| 7.1 CBT | 1 | Std. Mean Difference (IV, Fixed, 95% CI) | 0.0 [0.0, 0.0] | |
| 8 Anxiety ‐ trait Show forest plot | 2 | Std. Mean Difference (IV, Fixed, 95% CI) | Subtotals only | |
| Analysis 2.8 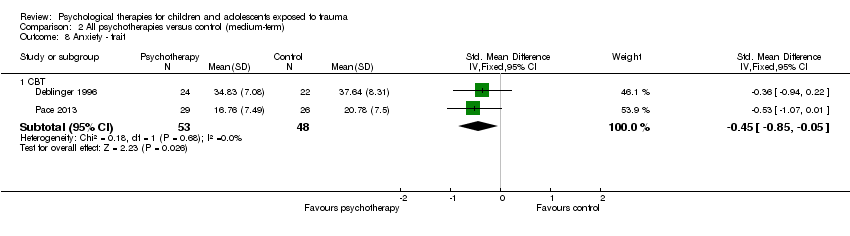 Comparison 2 All psychotherapies versus control (medium‐term), Outcome 8 Anxiety ‐ trait. | ||||
| 8.1 CBT | 2 | 101 | Std. Mean Difference (IV, Fixed, 95% CI) | ‐0.45 [‐0.85, ‐0.05] |
| 9 Depression Show forest plot | 13 | 2191 | Std. Mean Difference (IV, Random, 95% CI) | ‐0.07 [‐0.22, 0.07] |
| Analysis 2.9  Comparison 2 All psychotherapies versus control (medium‐term), Outcome 9 Depression. | ||||
| 9.1 CBT | 8 | 1810 | Std. Mean Difference (IV, Random, 95% CI) | ‐0.12 [‐0.31, 0.07] |
| 9.2 Debriefing | 2 | 231 | Std. Mean Difference (IV, Random, 95% CI) | ‐0.12 [‐0.38, 0.14] |
| 9.3 Family therapy | 1 | 30 | Std. Mean Difference (IV, Random, 95% CI) | 0.34 [‐0.38, 1.06] |
| 9.4 Narrative | 1 | 64 | Std. Mean Difference (IV, Random, 95% CI) | 0.34 [‐0.15, 0.84] |
| 9.5 Psychoeducation | 1 | 56 | Std. Mean Difference (IV, Random, 95% CI) | ‐0.14 [‐0.67, 0.38] |
| 10 Behaviour ‐ total Show forest plot | 3 | 281 | Std. Mean Difference (IV, Fixed, 95% CI) | ‐0.20 [‐0.43, 0.04] |
| Analysis 2.10  Comparison 2 All psychotherapies versus control (medium‐term), Outcome 10 Behaviour ‐ total. | ||||
| 10.1 Debriefing | 1 | 132 | Std. Mean Difference (IV, Fixed, 95% CI) | ‐0.28 [‐0.62, 0.06] |
| 10.2 Family therapy | 1 | 50 | Std. Mean Difference (IV, Fixed, 95% CI) | ‐0.37 [‐0.93, 0.19] |
| 10.3 Narrative | 1 | 99 | Std. Mean Difference (IV, Fixed, 95% CI) | 0.0 [‐0.39, 0.39] |
| 11 Behaviour ‐ internalising Show forest plot | 4 | 291 | Std. Mean Difference (IV, Random, 95% CI) | 0.01 [‐0.25, 0.28] |
| Analysis 2.11 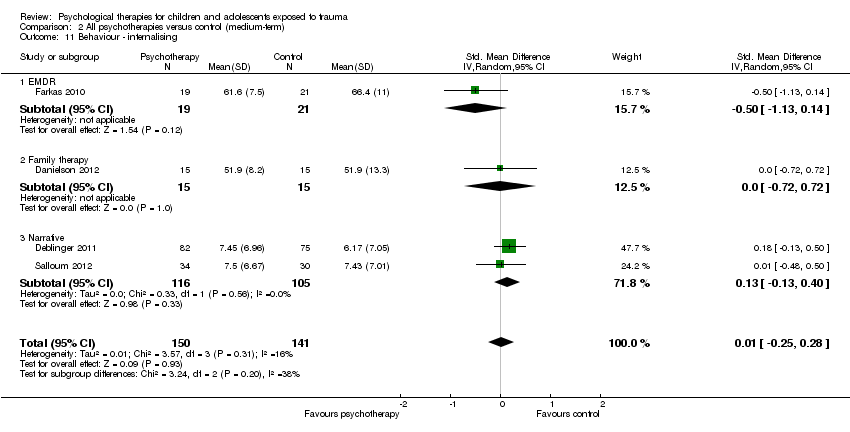 Comparison 2 All psychotherapies versus control (medium‐term), Outcome 11 Behaviour ‐ internalising. | ||||
| 11.1 EMDR | 1 | 40 | Std. Mean Difference (IV, Random, 95% CI) | ‐0.50 [‐1.13, 0.14] |
| 11.2 Family therapy | 1 | 30 | Std. Mean Difference (IV, Random, 95% CI) | 0.0 [‐0.72, 0.72] |
| 11.3 Narrative | 2 | 221 | Std. Mean Difference (IV, Random, 95% CI) | 0.13 [‐0.13, 0.40] |
| 12 Behaviour ‐ externalising Show forest plot | 5 | 694 | Std. Mean Difference (IV, Random, 95% CI) | 0.02 [‐0.32, 0.35] |
| Analysis 2.12  Comparison 2 All psychotherapies versus control (medium‐term), Outcome 12 Behaviour ‐ externalising. | ||||
| 12.1 CBT | 1 | 403 | Std. Mean Difference (IV, Random, 95% CI) | 0.07 [‐0.13, 0.27] |
| 12.2 EMDR | 1 | 40 | Std. Mean Difference (IV, Random, 95% CI) | 1.00 [‐1.66, ‐0.33] |
| 12.3 Family therapy | 1 | 30 | Std. Mean Difference (IV, Random, 95% CI) | ‐0.01 [‐0.72, 0.71] |
| 12.4 Narrative | 2 | 221 | Std. Mean Difference (IV, Random, 95% CI) | 0.31 [0.05, 0.58] |
| 13 Function Show forest plot | 3 | Std. Mean Difference (IV, Random, 95% CI) | Subtotals only | |
| Analysis 2.13  Comparison 2 All psychotherapies versus control (medium‐term), Outcome 13 Function. | ||||
| 13.1 CBT | 3 | 814 | Std. Mean Difference (IV, Random, 95% CI) | ‐0.46 [‐0.88, ‐0.05] |
| 14 Quality of life Show forest plot | 1 | Std. Mean Difference (IV, Random, 95% CI) | Totals not selected | |
| Analysis 2.14  Comparison 2 All psychotherapies versus control (medium‐term), Outcome 14 Quality of life. | ||||
| 14.1 Supportive therapy | 1 | Std. Mean Difference (IV, Random, 95% CI) | 0.0 [0.0, 0.0] | |
| 15 Loss to follow‐up Show forest plot | 20 | 3663 | Odds Ratio (M‐H, Fixed, 95% CI) | 1.00 [0.82, 1.21] |
| Analysis 2.15 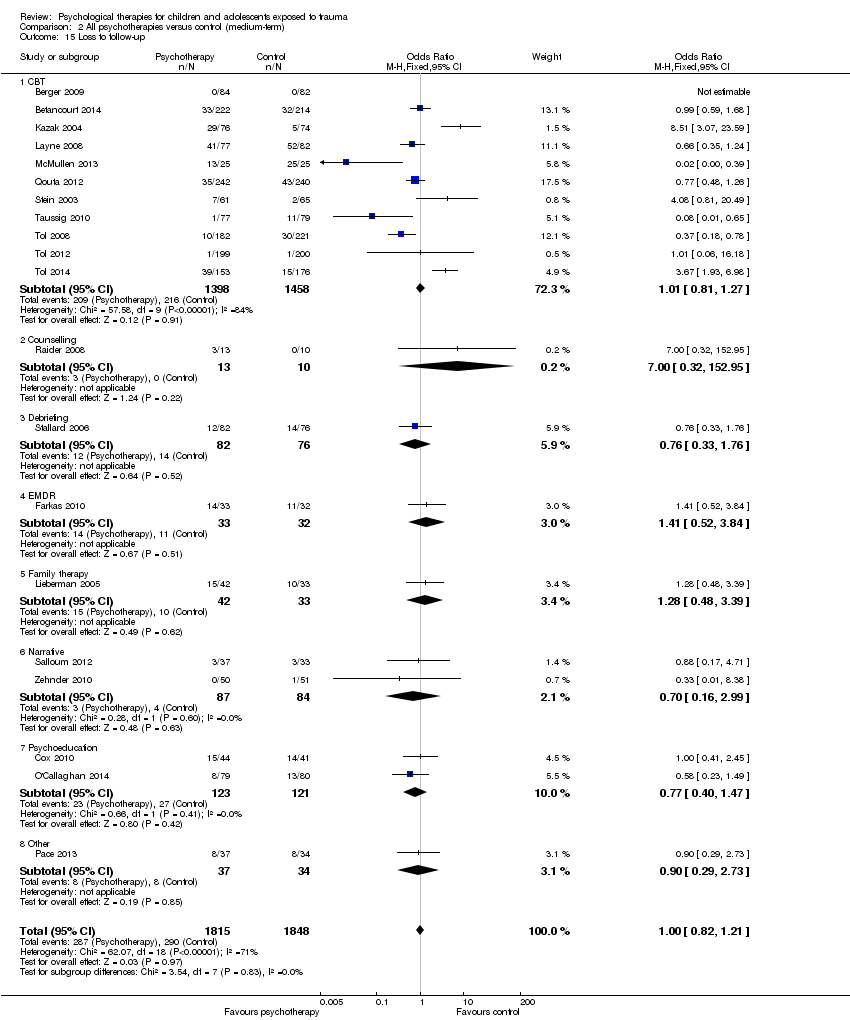 Comparison 2 All psychotherapies versus control (medium‐term), Outcome 15 Loss to follow‐up. | ||||
| 15.1 CBT | 11 | 2856 | Odds Ratio (M‐H, Fixed, 95% CI) | 1.01 [0.81, 1.27] |
| 15.2 Counselling | 1 | 23 | Odds Ratio (M‐H, Fixed, 95% CI) | 7.0 [0.32, 152.95] |
| 15.3 Debriefing | 1 | 158 | Odds Ratio (M‐H, Fixed, 95% CI) | 0.76 [0.33, 1.76] |
| 15.4 EMDR | 1 | 65 | Odds Ratio (M‐H, Fixed, 95% CI) | 1.41 [0.52, 3.84] |
| 15.5 Family therapy | 1 | 75 | Odds Ratio (M‐H, Fixed, 95% CI) | 1.28 [0.48, 3.39] |
| 15.6 Narrative | 2 | 171 | Odds Ratio (M‐H, Fixed, 95% CI) | 0.70 [0.16, 2.99] |
| 15.7 Psychoeducation | 2 | 244 | Odds Ratio (M‐H, Fixed, 95% CI) | 0.77 [0.40, 1.47] |
| 15.8 Other | 1 | 71 | Odds Ratio (M‐H, Fixed, 95% CI) | 0.90 [0.29, 2.73] |
| Outcome or subgroup title | No. of studies | No. of participants | Statistical method | Effect size |
| 1 PTSD diagnosis Show forest plot | 1 | Odds Ratio (M‐H, Random, 95% CI) | Totals not selected | |
| Analysis 3.1 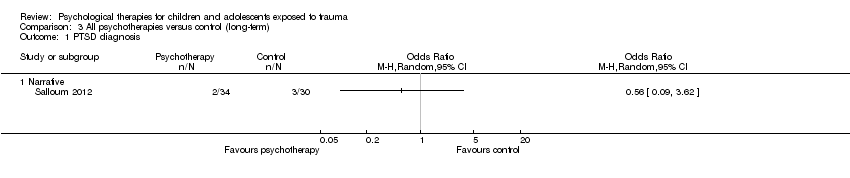 Comparison 3 All psychotherapies versus control (long‐term), Outcome 1 PTSD diagnosis. | ||||
| 1.1 Narrative | 1 | Odds Ratio (M‐H, Random, 95% CI) | 0.0 [0.0, 0.0] | |
| 2 PTSD total symptoms Show forest plot | 2 | 141 | Std. Mean Difference (IV, Random, 95% CI) | 0.17 [‐0.28, 0.62] |
| Analysis 3.2  Comparison 3 All psychotherapies versus control (long‐term), Outcome 2 PTSD total symptoms. | ||||
| 2.1 Exposure | 1 | 77 | Std. Mean Difference (IV, Random, 95% CI) | 0.39 [‐0.07, 0.85] |
| 2.2 Narrative | 1 | 64 | Std. Mean Difference (IV, Random, 95% CI) | ‐0.07 [‐0.56, 0.42] |
| 3 Anxiety Show forest plot | 2 | 176 | Std. Mean Difference (IV, Random, 95% CI) | ‐0.12 [‐0.41, 0.18] |
| Analysis 3.3  Comparison 3 All psychotherapies versus control (long‐term), Outcome 3 Anxiety. | ||||
| 3.1 Exposure | 1 | 65 | Std. Mean Difference (IV, Random, 95% CI) | ‐0.30 [‐0.80, 0.19] |
| 3.2 Narrative | 1 | 111 | Std. Mean Difference (IV, Random, 95% CI) | ‐0.01 [‐0.39, 0.36] |
| 4 Depression Show forest plot | 3 | 152 | Std. Mean Difference (IV, Fixed, 95% CI) | ‐0.24 [‐0.56, 0.08] |
| Analysis 3.4  Comparison 3 All psychotherapies versus control (long‐term), Outcome 4 Depression. | ||||
| 4.1 CBT | 1 | 36 | Std. Mean Difference (IV, Fixed, 95% CI) | ‐0.59 [‐1.27, 0.09] |
| 4.2 Exposure | 1 | 52 | Std. Mean Difference (IV, Fixed, 95% CI) | ‐0.29 [‐0.84, 0.26] |
| 4.3 Narrative | 1 | 64 | Std. Mean Difference (IV, Fixed, 95% CI) | ‐0.02 [‐0.51, 0.47] |
| 5 Behaviour ‐ total Show forest plot | 1 | Std. Mean Difference (IV, Random, 95% CI) | Totals not selected | |
| Analysis 3.5  Comparison 3 All psychotherapies versus control (long‐term), Outcome 5 Behaviour ‐ total. | ||||
| 5.1 Exposure | 1 | Std. Mean Difference (IV, Random, 95% CI) | 0.0 [0.0, 0.0] | |
| 6 Behaviour ‐ internalising Show forest plot | 2 | 141 | Std. Mean Difference (IV, Random, 95% CI) | 0.04 [‐0.51, 0.59] |
| Analysis 3.6 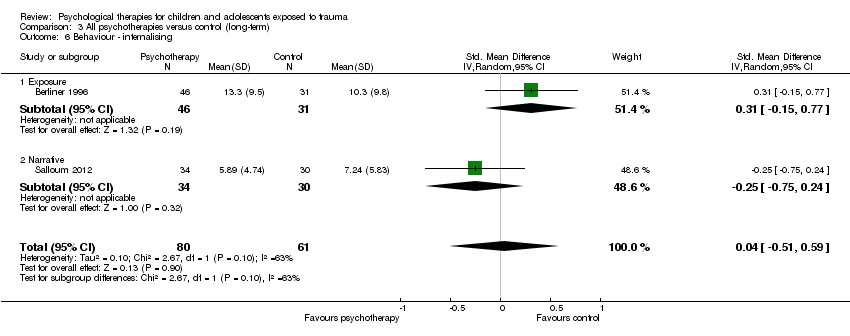 Comparison 3 All psychotherapies versus control (long‐term), Outcome 6 Behaviour ‐ internalising. | ||||
| 6.1 Exposure | 1 | 77 | Std. Mean Difference (IV, Random, 95% CI) | 0.31 [‐0.15, 0.77] |
| 6.2 Narrative | 1 | 64 | Std. Mean Difference (IV, Random, 95% CI) | ‐0.25 [‐0.75, 0.24] |
| 7 Behaviour ‐ externalising Show forest plot | 3 | 298 | Std. Mean Difference (IV, Random, 95% CI) | 0.28 [‐0.05, 0.60] |
| Analysis 3.7  Comparison 3 All psychotherapies versus control (long‐term), Outcome 7 Behaviour ‐ externalising. | ||||
| 7.1 Exposure | 1 | 77 | Std. Mean Difference (IV, Random, 95% CI) | 0.51 [0.04, 0.97] |
| 7.2 Narrative | 2 | 221 | Std. Mean Difference (IV, Random, 95% CI) | 0.17 [‐0.30, 0.64] |
| 8 Loss to follow‐up Show forest plot | 2 | 120 | Odds Ratio (M‐H, Random, 95% CI) | 0.45 [0.15, 1.32] |
| Analysis 3.8  Comparison 3 All psychotherapies versus control (long‐term), Outcome 8 Loss to follow‐up. | ||||
| 8.1 CBT | 1 | 50 | Odds Ratio (M‐H, Random, 95% CI) | 0.29 [0.08, 1.09] |
| 8.2 Narrative | 1 | 70 | Odds Ratio (M‐H, Random, 95% CI) | 0.88 [0.17, 4.71] |
| Outcome or subgroup title | No. of studies | No. of participants | Statistical method | Effect size |
| 1 PTSD diagnosis Show forest plot | 2 | 160 | Odds Ratio (M‐H, Random, 95% CI) | 0.74 [0.29, 1.91] |
| Analysis 4.1  Comparison 4 CBT versus other therapies (short‐term), Outcome 1 PTSD diagnosis. | ||||
| 1.1 EMDR | 1 | 36 | Odds Ratio (M‐H, Random, 95% CI) | 1.0 [0.06, 17.33] |
| 1.2 Supportive therapy | 1 | 124 | Odds Ratio (M‐H, Random, 95% CI) | 0.71 [0.26, 1.95] |
| 2 PTSD total symptoms Show forest plot | 7 | 466 | Std. Mean Difference (IV, Random, 95% CI) | ‐0.24 [‐0.42, ‐0.05] |
| Analysis 4.2  Comparison 4 CBT versus other therapies (short‐term), Outcome 2 PTSD total symptoms. | ||||
| 2.1 EMDR | 2 | 62 | Std. Mean Difference (IV, Random, 95% CI) | 0.06 [‐0.44, 0.56] |
| 2.2 Play therapy | 1 | 26 | Std. Mean Difference (IV, Random, 95% CI) | 0.21 [‐0.56, 0.98] |
| 2.3 Supportive therapies | 4 | 378 | Std. Mean Difference (IV, Random, 95% CI) | ‐0.32 [‐0.53, ‐0.12] |
| 3 PTSD avoidance Show forest plot | 1 | Std. Mean Difference (IV, Random, 95% CI) | Totals not selected | |
| Analysis 4.3 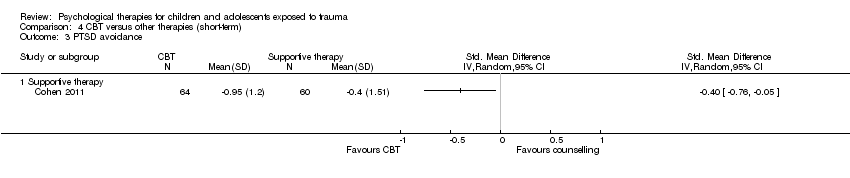 Comparison 4 CBT versus other therapies (short‐term), Outcome 3 PTSD avoidance. | ||||
| 3.1 Supportive therapy | 1 | Std. Mean Difference (IV, Random, 95% CI) | 0.0 [0.0, 0.0] | |
| 4 PTSD hyperarousal Show forest plot | 1 | Std. Mean Difference (IV, Random, 95% CI) | Totals not selected | |
| Analysis 4.4 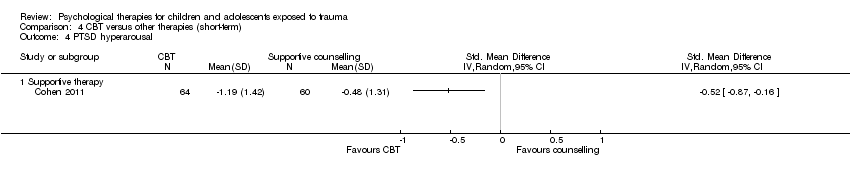 Comparison 4 CBT versus other therapies (short‐term), Outcome 4 PTSD hyperarousal. | ||||
| 4.1 Supportive therapy | 1 | Std. Mean Difference (IV, Random, 95% CI) | 0.0 [0.0, 0.0] | |
| 5 PTSD intrusion Show forest plot | 1 | Std. Mean Difference (IV, Random, 95% CI) | Totals not selected | |
| Analysis 4.5  Comparison 4 CBT versus other therapies (short‐term), Outcome 5 PTSD intrusion. | ||||
| 5.1 Supportive therapy | 1 | Std. Mean Difference (IV, Random, 95% CI) | 0.0 [0.0, 0.0] | |
| 6 Anxiety total symptoms Show forest plot | 2 | Std. Mean Difference (IV, Random, 95% CI) | Subtotals only | |
| Analysis 4.6  Comparison 4 CBT versus other therapies (short‐term), Outcome 6 Anxiety total symptoms. | ||||
| 6.1 Supportive therapy | 2 | 230 | Std. Mean Difference (IV, Random, 95% CI) | ‐0.48 [‐0.74, ‐0.22] |
| 7 Depression Show forest plot | 2 | Std. Mean Difference (IV, Random, 95% CI) | Subtotals only | |
| Analysis 4.7  Comparison 4 CBT versus other therapies (short‐term), Outcome 7 Depression. | ||||
| 7.1 Supportive therapy | 2 | 237 | Std. Mean Difference (IV, Random, 95% CI) | ‐0.14 [‐0.42, 0.14] |
| 8 Behaviour ‐ total Show forest plot | 3 | 182 | Std. Mean Difference (IV, Random, 95% CI) | 0.02 [‐0.27, 0.31] |
| Analysis 4.8  Comparison 4 CBT versus other therapies (short‐term), Outcome 8 Behaviour ‐ total. | ||||
| 8.1 EMDR | 1 | 14 | Std. Mean Difference (IV, Random, 95% CI) | ‐0.44 [‐1.50, 0.63] |
| 8.2 Supportive therapy | 2 | 168 | Std. Mean Difference (IV, Random, 95% CI) | 0.05 [‐0.25, 0.36] |
| 9 Behaviour ‐ internalising Show forest plot | 3 | Std. Mean Difference (IV, Random, 95% CI) | Subtotals only | |
| Analysis 4.9  Comparison 4 CBT versus other therapies (short‐term), Outcome 9 Behaviour ‐ internalising. | ||||
| 9.1 Supportive therapy | 3 | 235 | Std. Mean Difference (IV, Random, 95% CI) | ‐0.25 [‐0.79, 0.28] |
| 10 Behaviour ‐ externalising Show forest plot | 3 | Std. Mean Difference (IV, Random, 95% CI) | Subtotals only | |
| Analysis 4.10  Comparison 4 CBT versus other therapies (short‐term), Outcome 10 Behaviour ‐ externalising. | ||||
| 10.1 Supportive therapy | 3 | 235 | Std. Mean Difference (IV, Random, 95% CI) | ‐0.31 [‐0.58, ‐0.05] |
| 11 Function Show forest plot | 1 | Std. Mean Difference (IV, Random, 95% CI) | Totals not selected | |
| Analysis 4.11 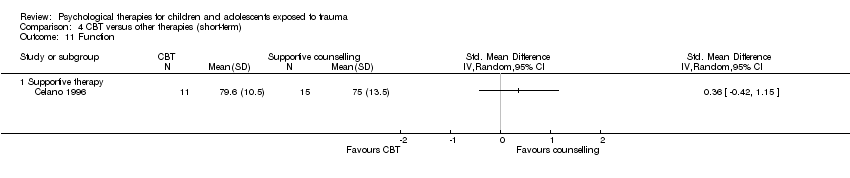 Comparison 4 CBT versus other therapies (short‐term), Outcome 11 Function. | ||||
| 11.1 Supportive therapy | 1 | Std. Mean Difference (IV, Random, 95% CI) | 0.0 [0.0, 0.0] | |
| 12 Loss to follow‐up Show forest plot | 8 | 544 | Odds Ratio (M‐H, Random, 95% CI) | 0.69 [0.41, 1.18] |
| Analysis 4.12  Comparison 4 CBT versus other therapies (short‐term), Outcome 12 Loss to follow‐up. | ||||
| 12.1 EMDR | 2 | 64 | Odds Ratio (M‐H, Random, 95% CI) | 0.76 [0.23, 2.52] |
| 12.2 Play therapy | 1 | 31 | Odds Ratio (M‐H, Random, 95% CI) | 0.08 [0.00, 1.56] |
| 12.3 Supportive therapy | 5 | 449 | Odds Ratio (M‐H, Random, 95% CI) | 0.74 [0.38, 1.43] |
| Outcome or subgroup title | No. of studies | No. of participants | Statistical method | Effect size |
| 1 PTSD total symptoms Show forest plot | 2 | Std. Mean Difference (IV, Random, 95% CI) | Subtotals only | |
| Analysis 5.1  Comparison 5 CBT versus other therapies (medium‐term), Outcome 1 PTSD total symptoms. | ||||
| 1.1 Supportive therapy | 2 | 223 | Std. Mean Difference (IV, Random, 95% CI) | ‐0.16 [‐0.43, 0.11] |
| 2 Anxiety total symptoms Show forest plot | 1 | Std. Mean Difference (IV, Random, 95% CI) | Totals not selected | |
| Analysis 5.2  Comparison 5 CBT versus other therapies (medium‐term), Outcome 2 Anxiety total symptoms. | ||||
| 2.1 Supportive therapy | 1 | Std. Mean Difference (IV, Random, 95% CI) | 0.0 [0.0, 0.0] | |
| 3 Depression Show forest plot | 1 | Std. Mean Difference (IV, Random, 95% CI) | Totals not selected | |
| Analysis 5.3  Comparison 5 CBT versus other therapies (medium‐term), Outcome 3 Depression. | ||||
| 3.1 Supportive therapy | 1 | Std. Mean Difference (IV, Random, 95% CI) | 0.0 [0.0, 0.0] | |
| 4 Behaviour ‐ total Show forest plot | 1 | Std. Mean Difference (IV, Random, 95% CI) | Totals not selected | |
| Analysis 5.4 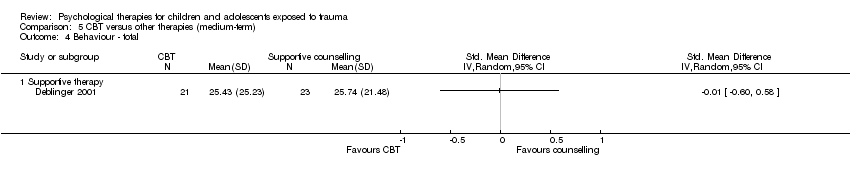 Comparison 5 CBT versus other therapies (medium‐term), Outcome 4 Behaviour ‐ total. | ||||
| 4.1 Supportive therapy | 1 | Std. Mean Difference (IV, Random, 95% CI) | 0.0 [0.0, 0.0] | |
| 5 Behaviour ‐ internalising Show forest plot | 2 | Std. Mean Difference (IV, Random, 95% CI) | Subtotals only | |
| Analysis 5.5  Comparison 5 CBT versus other therapies (medium‐term), Outcome 5 Behaviour ‐ internalising. | ||||
| 5.1 Supportive therapy | 2 | 178 | Std. Mean Difference (IV, Random, 95% CI) | ‐0.05 [‐0.36, 0.26] |
| 6 Behaviour ‐ externalising Show forest plot | 2 | Std. Mean Difference (IV, Random, 95% CI) | Subtotals only | |
| Analysis 5.6 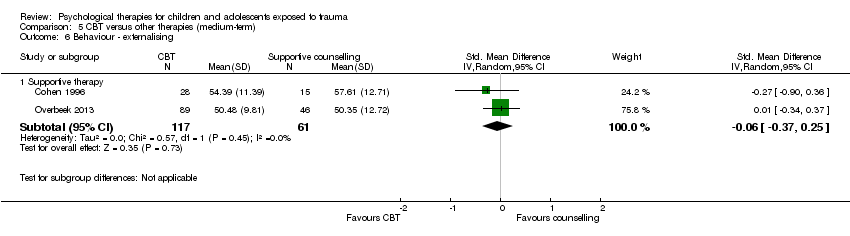 Comparison 5 CBT versus other therapies (medium‐term), Outcome 6 Behaviour ‐ externalising. | ||||
| 6.1 Supportive therapy | 2 | 178 | Std. Mean Difference (IV, Random, 95% CI) | ‐0.06 [‐0.37, 0.25] |
| 7 Loss to follow‐up Show forest plot | 1 | Odds Ratio (M‐H, Random, 95% CI) | Totals not selected | |
| Analysis 5.7  Comparison 5 CBT versus other therapies (medium‐term), Outcome 7 Loss to follow‐up. | ||||
| 7.1 Supportive therapy | 1 | Odds Ratio (M‐H, Random, 95% CI) | 0.0 [0.0, 0.0] | |
| Outcome or subgroup title | No. of studies | No. of participants | Statistical method | Effect size |
| 1 Behaviour ‐ internalising Show forest plot | 1 | Std. Mean Difference (IV, Random, 95% CI) | Totals not selected | |
| Analysis 6.1  Comparison 6 CBT versus other therapies (long‐term), Outcome 1 Behaviour ‐ internalising. | ||||
| 1.1 Supportive therapy | 1 | Std. Mean Difference (IV, Random, 95% CI) | 0.0 [0.0, 0.0] | |
| 2 Behaviour ‐ externalising Show forest plot | 1 | Std. Mean Difference (IV, Random, 95% CI) | Totals not selected | |
| Analysis 6.2  Comparison 6 CBT versus other therapies (long‐term), Outcome 2 Behaviour ‐ externalising. | ||||
| 2.1 Supportive therapy | 1 | Std. Mean Difference (IV, Random, 95% CI) | 0.0 [0.0, 0.0] | |
| 3 Loss to follow‐up Show forest plot | 1 | Odds Ratio (M‐H, Random, 95% CI) | Totals not selected | |
| Analysis 6.3  Comparison 6 CBT versus other therapies (long‐term), Outcome 3 Loss to follow‐up. | ||||
| 3.1 Supportive therapy | 1 | Odds Ratio (M‐H, Random, 95% CI) | 0.0 [0.0, 0.0] | |
| Outcome or subgroup title | No. of studies | No. of participants | Statistical method | Effect size |
| 1 PTSD total symptoms Show forest plot | 1 | Std. Mean Difference (IV, Random, 95% CI) | Totals not selected | |
| Analysis 7.1  Comparison 7 Subgroup analysis: Individual versus group therapy, Outcome 1 PTSD total symptoms. | ||||
| 1.1 Short‐term | 1 | Std. Mean Difference (IV, Random, 95% CI) | 0.0 [0.0, 0.0] | |
| Outcome or subgroup title | No. of studies | No. of participants | Statistical method | Effect size |
| 1 PTSD total symptoms Show forest plot | 1 | Std. Mean Difference (IV, Random, 95% CI) | Totals not selected | |
| Analysis 8.1 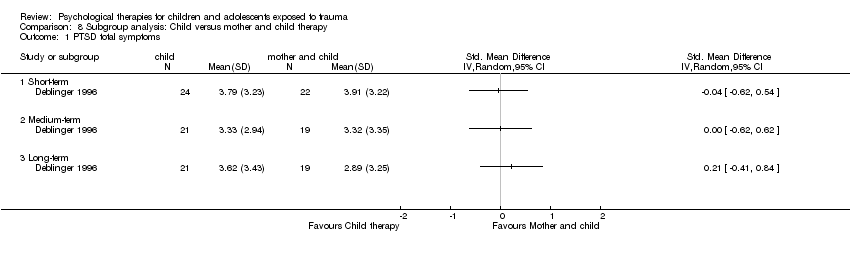 Comparison 8 Subgroup analysis: Child versus mother and child therapy, Outcome 1 PTSD total symptoms. | ||||
| 1.1 Short‐term | 1 | Std. Mean Difference (IV, Random, 95% CI) | 0.0 [0.0, 0.0] | |
| 1.2 Medium‐term | 1 | Std. Mean Difference (IV, Random, 95% CI) | 0.0 [0.0, 0.0] | |
| 1.3 Long‐term | 1 | Std. Mean Difference (IV, Random, 95% CI) | 0.0 [0.0, 0.0] | |
| Outcome or subgroup title | No. of studies | No. of participants | Statistical method | Effect size |
| 1 PTSD diagnosis Show forest plot | 6 | Odds Ratio (M‐H, Random, 95% CI) | Subtotals only | |
| Analysis 9.1  Comparison 9 Subgroup analysis: type of trauma, Outcome 1 PTSD diagnosis. | ||||
| 1.1 Community violence | 3 | 769 | Odds Ratio (M‐H, Random, 95% CI) | 0.59 [0.43, 0.80] |
| 1.2 Interpersonal violence | 1 | 65 | Odds Ratio (M‐H, Random, 95% CI) | 0.11 [0.02, 0.56] |
| 1.3 Natural disaster | 1 | 166 | Odds Ratio (M‐H, Random, 95% CI) | 0.16 [0.06, 0.45] |
| 1.4 Physical trauma | 1 | 132 | Odds Ratio (M‐H, Random, 95% CI) | 1.31 [0.47, 3.68] |
| 2 PTSD total symptoms Show forest plot | 18 | Std. Mean Difference (IV, Random, 95% CI) | Subtotals only | |
| Analysis 9.2  Comparison 9 Subgroup analysis: type of trauma, Outcome 2 PTSD total symptoms. | ||||
| 2.1 Community violence | 8 | 2170 | Std. Mean Difference (IV, Random, 95% CI) | ‐0.24 [‐0.41, ‐0.06] |
| 2.2 Interpersonal violence | 1 | 65 | Std. Mean Difference (IV, Random, 95% CI) | ‐0.61 [‐1.11, ‐0.11] |
| 2.3 Life‐threatening illness | 1 | 111 | Std. Mean Difference (IV, Random, 95% CI) | ‐0.12 [‐0.50, 0.26] |
| 2.4 Maltreatment | 1 | 142 | Std. Mean Difference (IV, Random, 95% CI) | ‐0.12 [‐0.45, 0.21] |
| 2.5 Natural disaster | 1 | 166 | Std. Mean Difference (IV, Random, 95% CI) | ‐1.27 [‐1.60, ‐0.94] |
| 2.6 Physical trauma | 4 | 311 | Std. Mean Difference (IV, Random, 95% CI) | ‐0.02 [‐0.29, 0.26] |
| 2.7 Sexual abuse | 2 | 76 | Std. Mean Difference (IV, Random, 95% CI) | ‐0.67 [‐1.18, ‐0.16] |
| Outcome or subgroup title | No. of studies | No. of participants | Statistical method | Effect size |
| 1 PTSD diagnosis Show forest plot | 7 | Odds Ratio (M‐H, Random, 95% CI) | Subtotals only | |
| Analysis 10.1 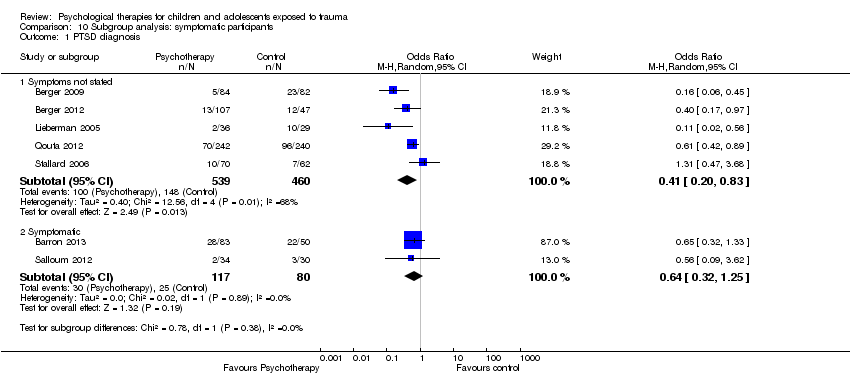 Comparison 10 Subgroup analysis: symptomatic participants, Outcome 1 PTSD diagnosis. | ||||
| 1.1 Symptoms not stated | 5 | 999 | Odds Ratio (M‐H, Random, 95% CI) | 0.41 [0.20, 0.83] |
| 1.2 Symptomatic | 2 | 197 | Odds Ratio (M‐H, Random, 95% CI) | 0.64 [0.32, 1.25] |
| 2 PTSD total symptoms Show forest plot | 21 | Std. Mean Difference (IV, Random, 95% CI) | Subtotals only | |
| Analysis 10.2 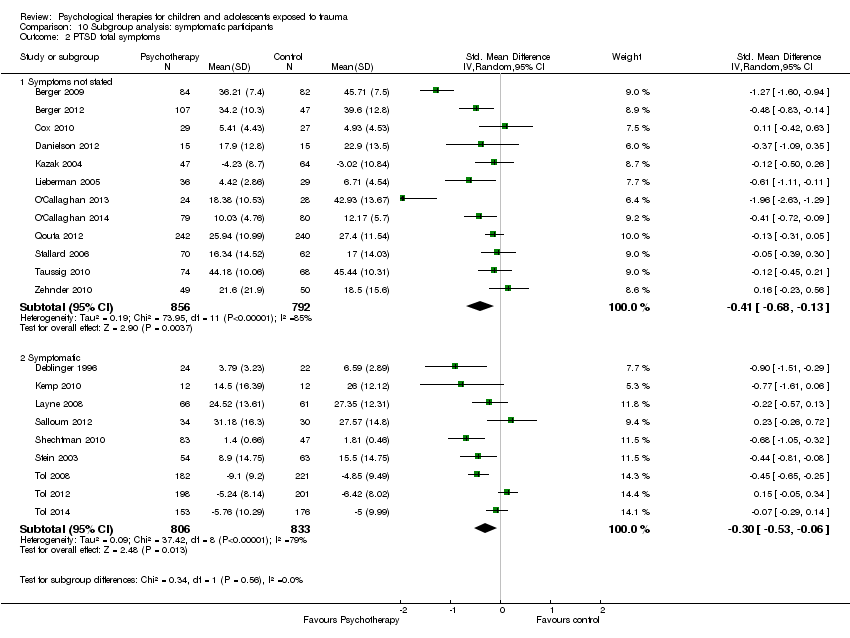 Comparison 10 Subgroup analysis: symptomatic participants, Outcome 2 PTSD total symptoms. | ||||
| 2.1 Symptoms not stated | 12 | 1648 | Std. Mean Difference (IV, Random, 95% CI) | ‐0.41 [‐0.68, ‐0.13] |
| 2.2 Symptomatic | 9 | 1639 | Std. Mean Difference (IV, Random, 95% CI) | ‐0.30 [‐0.53, ‐0.06] |
| Outcome or subgroup title | No. of studies | No. of participants | Statistical method | Effect size |
| 1 PTSD diagnosis Show forest plot | 7 | Odds Ratio (M‐H, Random, 95% CI) | Subtotals only | |
| Analysis 11.1  Comparison 11 Sensitivity analysis: type of control, Outcome 1 PTSD diagnosis. | ||||
| 1.1 Inactive control | 5 | 1067 | Odds Ratio (M‐H, Random, 95% CI) | 0.53 [0.32, 0.88] |
| 1.2 Active control | 2 | 129 | Odds Ratio (M‐H, Random, 95% CI) | 0.23 [0.05, 1.14] |
| 2 PTSD total symptoms Show forest plot | 21 | Std. Mean Difference (IV, Random, 95% CI) | Subtotals only | |
| Analysis 11.2  Comparison 11 Sensitivity analysis: type of control, Outcome 2 PTSD total symptoms. | ||||
| 2.1 Inactive control | 15 | 2856 | Std. Mean Difference (IV, Random, 95% CI) | ‐0.40 [‐0.61, ‐0.19] |
| 2.2 Active control | 6 | 431 | Std. Mean Difference (IV, Random, 95% CI) | ‐0.25 [‐0.58, 0.09] |
| Outcome or subgroup title | No. of studies | No. of participants | Statistical method | Effect size |
| 1 PTSD diagnosis Show forest plot | 7 | Odds Ratio (M‐H, Random, 95% CI) | Subtotals only | |
| Analysis 12.1  Comparison 12 Sensitivity analysis: best‐/worst‐case analysis, Outcome 1 PTSD diagnosis. | ||||
| 1.1 Best case | 7 | 1282 | Odds Ratio (M‐H, Random, 95% CI) | 0.52 [0.28, 0.99] |
| 1.2 Worst case | 7 | 1252 | Odds Ratio (M‐H, Random, 95% CI) | 0.64 [0.42, 0.98] |
| Outcome or subgroup title | No. of studies | No. of participants | Statistical method | Effect size |
| 1 PTSD diagnosis Show forest plot | 7 | Odds Ratio (M‐H, Random, 95% CI) | Subtotals only | |
| Analysis 13.1  Comparison 13 Sensitivity analysis: cluster‐randomisation, Outcome 1 PTSD diagnosis. | ||||
| 1.1 Cluster‐randomised | 4 | 935 | Odds Ratio (M‐H, Random, 95% CI) | 0.46 [0.27, 0.76] |
| 1.2 Individuals randomised | 3 | 261 | Odds Ratio (M‐H, Random, 95% CI) | 0.47 [0.10, 2.19] |
| 2 PTSD total symptoms Show forest plot | 20 | Std. Mean Difference (IV, Random, 95% CI) | Subtotals only | |
| Analysis 13.2  Comparison 13 Sensitivity analysis: cluster‐randomisation, Outcome 2 PTSD total symptoms. | ||||
| 2.1 Cluster‐randomised | 7 | 2063 | Std. Mean Difference (IV, Random, 95% CI) | ‐0.40 [‐0.71, ‐0.10] |
| 2.2 Individuals randomised | 13 | 1172 | Std. Mean Difference (IV, Random, 95% CI) | ‐0.22 [‐0.38, ‐0.06] |
| Outcome or subgroup title | No. of studies | No. of participants | Statistical method | Effect size |
| 1 PTSD diagnosis Show forest plot | 7 | Odds Ratio (M‐H, Random, 95% CI) | Subtotals only | |
| Analysis 14.1 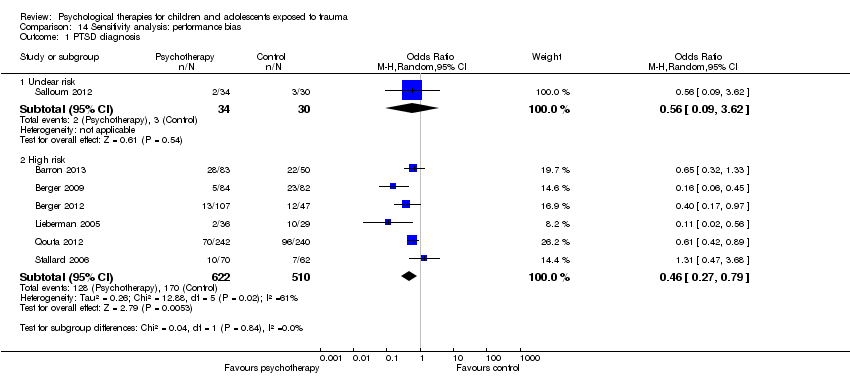 Comparison 14 Sensitivity analysis: performance bias, Outcome 1 PTSD diagnosis. | ||||
| 1.1 Unclear risk | 1 | 64 | Odds Ratio (M‐H, Random, 95% CI) | 0.56 [0.09, 3.62] |
| 1.2 High risk | 6 | 1132 | Odds Ratio (M‐H, Random, 95% CI) | 0.46 [0.27, 0.79] |
| 2 PTSD total symptoms Show forest plot | 21 | Std. Mean Difference (IV, Random, 95% CI) | Subtotals only | |
| Analysis 14.2  Comparison 14 Sensitivity analysis: performance bias, Outcome 2 PTSD total symptoms. | ||||
| 2.1 Unclear risk | 1 | 64 | Std. Mean Difference (IV, Random, 95% CI) | 0.23 [‐0.26, 0.72] |
| 2.2 High risk | 20 | 3223 | Std. Mean Difference (IV, Random, 95% CI) | ‐0.39 [‐0.57, ‐0.20] |
| Outcome or subgroup title | No. of studies | No. of participants | Statistical method | Effect size |
| 1 PTSD diagnosis Show forest plot | 7 | Odds Ratio (M‐H, Random, 95% CI) | Subtotals only | |
| Analysis 15.1 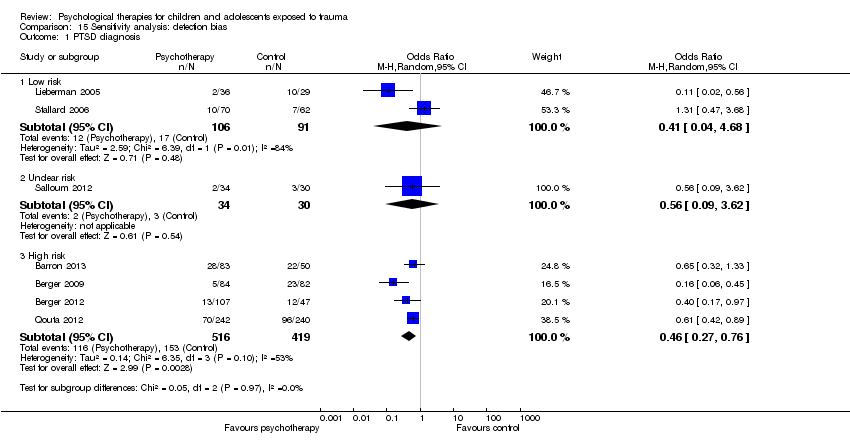 Comparison 15 Sensitivity analysis: detection bias, Outcome 1 PTSD diagnosis. | ||||
| 1.1 Low risk | 2 | 197 | Odds Ratio (M‐H, Random, 95% CI) | 0.41 [0.04, 4.68] |
| 1.2 Unclear risk | 1 | 64 | Odds Ratio (M‐H, Random, 95% CI) | 0.56 [0.09, 3.62] |
| 1.3 High risk | 4 | 935 | Odds Ratio (M‐H, Random, 95% CI) | 0.46 [0.27, 0.76] |
| 2 PTSD total symptoms Show forest plot | 21 | Std. Mean Difference (IV, Random, 95% CI) | Subtotals only | |
| Analysis 15.2  Comparison 15 Sensitivity analysis: detection bias, Outcome 2 PTSD total symptoms. | ||||
| 2.1 Low risk | 1 | 132 | Std. Mean Difference (IV, Random, 95% CI) | ‐0.05 [‐0.39, 0.30] |
| 2.2 Unclear risk | 2 | 191 | Std. Mean Difference (IV, Random, 95% CI) | ‐0.03 [‐0.46, 0.40] |
| 2.3 High risk | 18 | 2964 | Std. Mean Difference (IV, Random, 95% CI) | ‐0.42 [‐0.62, ‐0.22] |
| Outcome or subgroup title | No. of studies | No. of participants | Statistical method | Effect size |
| 1 PTSD diagnosis Show forest plot | 7 | Odds Ratio (M‐H, Random, 95% CI) | Subtotals only | |
| Analysis 16.1  Comparison 16 Sensitivity analysis: attrition bias, Outcome 1 PTSD diagnosis. | ||||
| 1.1 Low risk | 2 | 320 | Odds Ratio (M‐H, Random, 95% CI) | 0.27 [0.11, 0.65] |
| 1.2 Unclear risk | 3 | 329 | Odds Ratio (M‐H, Random, 95% CI) | 0.79 [0.45, 1.38] |
| 1.3 High risk | 2 | 547 | Odds Ratio (M‐H, Random, 95% CI) | 0.32 [0.06, 1.60] |
| 2 PTSD total symptoms Show forest plot | 21 | Std. Mean Difference (IV, Random, 95% CI) | Subtotals only | |
| Analysis 16.2 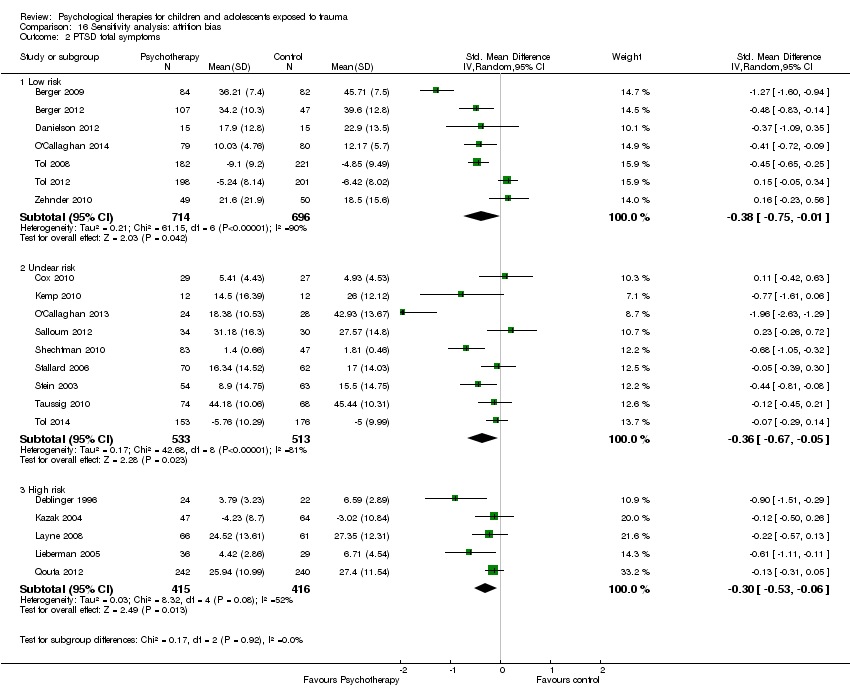 Comparison 16 Sensitivity analysis: attrition bias, Outcome 2 PTSD total symptoms. | ||||
| 2.1 Low risk | 7 | 1410 | Std. Mean Difference (IV, Random, 95% CI) | ‐0.38 [‐0.75, ‐0.01] |
| 2.2 Unclear risk | 9 | 1046 | Std. Mean Difference (IV, Random, 95% CI) | ‐0.36 [‐0.67, ‐0.05] |
| 2.3 High risk | 5 | 831 | Std. Mean Difference (IV, Random, 95% CI) | ‐0.30 [‐0.53, ‐0.06] |
| Outcome or subgroup title | No. of studies | No. of participants | Statistical method | Effect size |
| 1 PTSD diagnosis Show forest plot | 7 | Odds Ratio (M‐H, Random, 95% CI) | Subtotals only | |
| Analysis 17.1 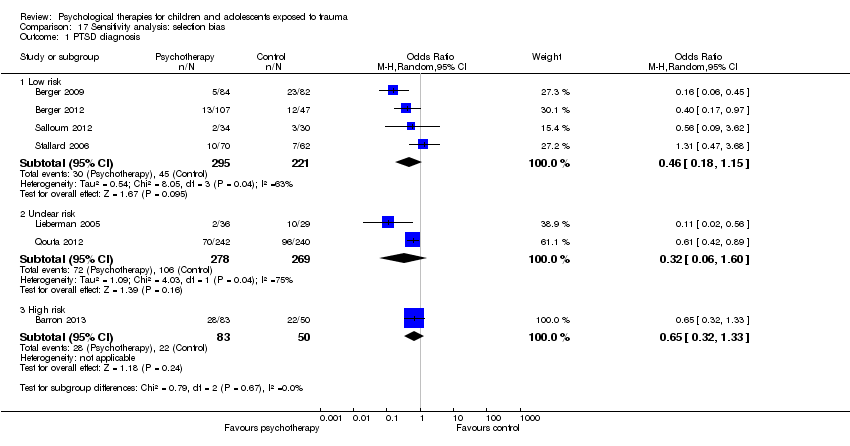 Comparison 17 Sensitivity analysis: selection bias, Outcome 1 PTSD diagnosis. | ||||
| 1.1 Low risk | 4 | 516 | Odds Ratio (M‐H, Random, 95% CI) | 0.46 [0.18, 1.15] |
| 1.2 Unclear risk | 2 | 547 | Odds Ratio (M‐H, Random, 95% CI) | 0.32 [0.06, 1.60] |
| 1.3 High risk | 1 | 133 | Odds Ratio (M‐H, Random, 95% CI) | 0.65 [0.32, 1.33] |
| 2 PTSD total symptoms Show forest plot | 21 | Std. Mean Difference (IV, Random, 95% CI) | Subtotals only | |
| Analysis 17.2  Comparison 17 Sensitivity analysis: selection bias, Outcome 2 PTSD total symptoms. | ||||
| 2.1 Low risk | 8 | 874 | Std. Mean Difference (IV, Random, 95% CI) | ‐0.57 [‐0.97, ‐0.17] |
| 2.2 Unclear risk | 13 | 2413 | Std. Mean Difference (IV, Random, 95% CI) | ‐0.22 [‐0.39, ‐0.06] |
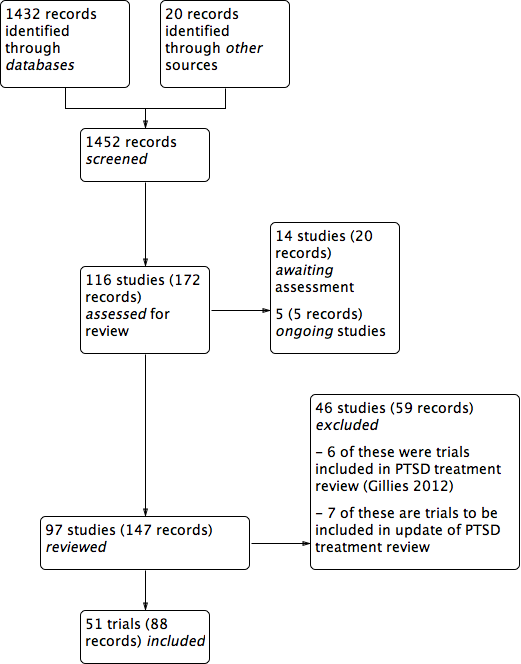
PRISMA study flow diagram.
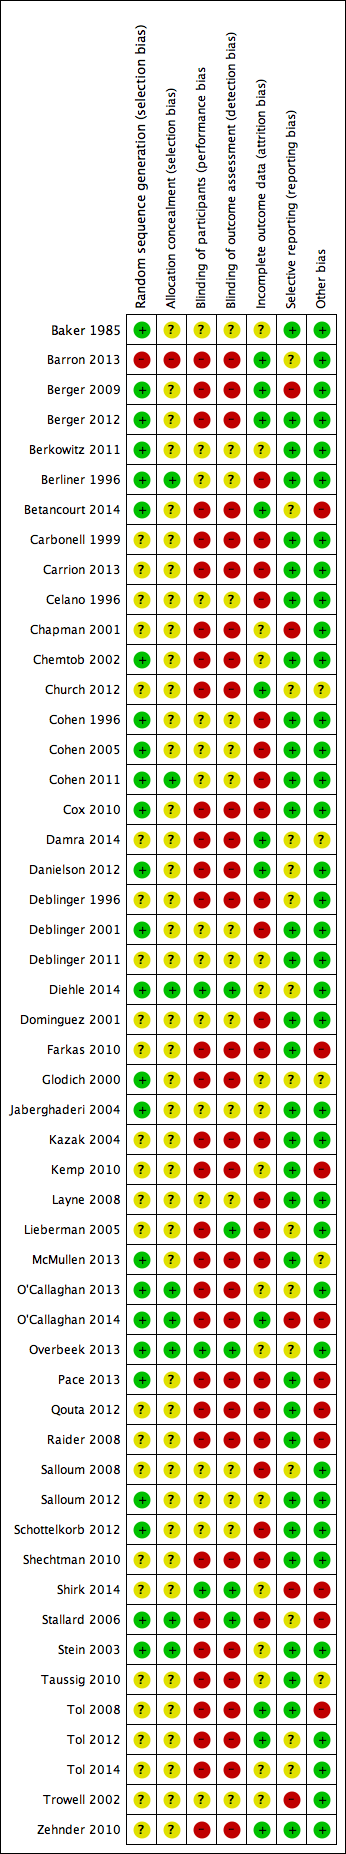
Risk of bias summary: review authors' judgements about each risk of bias item for each included study.
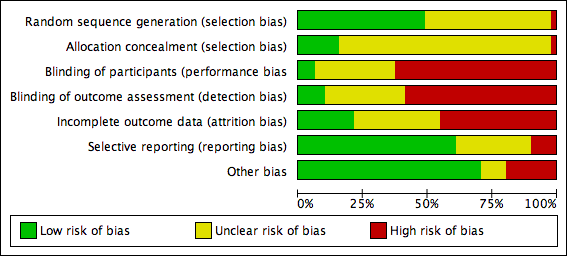
Risk of bias graph: review authors' judgements about each risk of bias item presented as percentages across all included studies.

Funnel plot of comparison: 1 All psychotherapies versus control (short‐term), outcome: 1.2 PTSD total symptoms.

Comparison 1 All psychotherapies versus control (short‐term), Outcome 1 PTSD diagnosis.

Comparison 1 All psychotherapies versus control (short‐term), Outcome 2 PTSD total symptoms.

Comparison 1 All psychotherapies versus control (short‐term), Outcome 3 PTSD avoidance.

Comparison 1 All psychotherapies versus control (short‐term), Outcome 4 PTSD hyperarousal.

Comparison 1 All psychotherapies versus control (short‐term), Outcome 5 PTSD intrusion.

Comparison 1 All psychotherapies versus control (short‐term), Outcome 6 Anxiety total symptoms.

Comparison 1 All psychotherapies versus control (short‐term), Outcome 7 Anxiety ‐ state.

Comparison 1 All psychotherapies versus control (short‐term), Outcome 8 Anxiety ‐ trait.
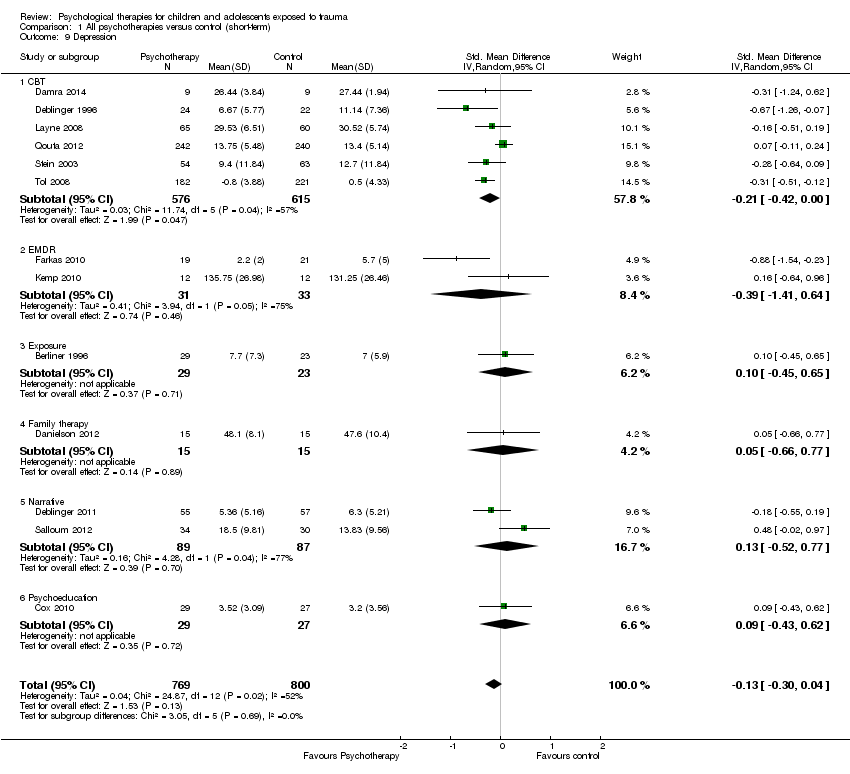
Comparison 1 All psychotherapies versus control (short‐term), Outcome 9 Depression.

Comparison 1 All psychotherapies versus control (short‐term), Outcome 10 Behaviour ‐ total.

Comparison 1 All psychotherapies versus control (short‐term), Outcome 11 Behaviour ‐ internalising.

Comparison 1 All psychotherapies versus control (short‐term), Outcome 12 Behaviour ‐ externalising.
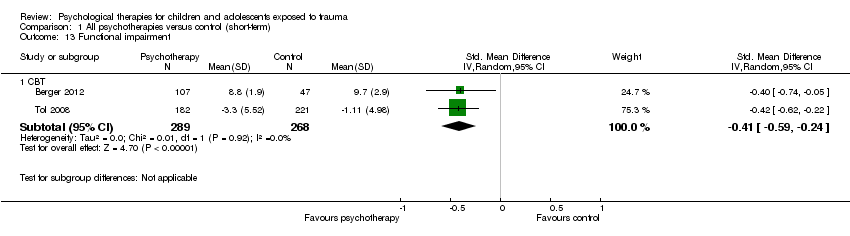
Comparison 1 All psychotherapies versus control (short‐term), Outcome 13 Functional impairment.

Comparison 1 All psychotherapies versus control (short‐term), Outcome 14 Quality of life.
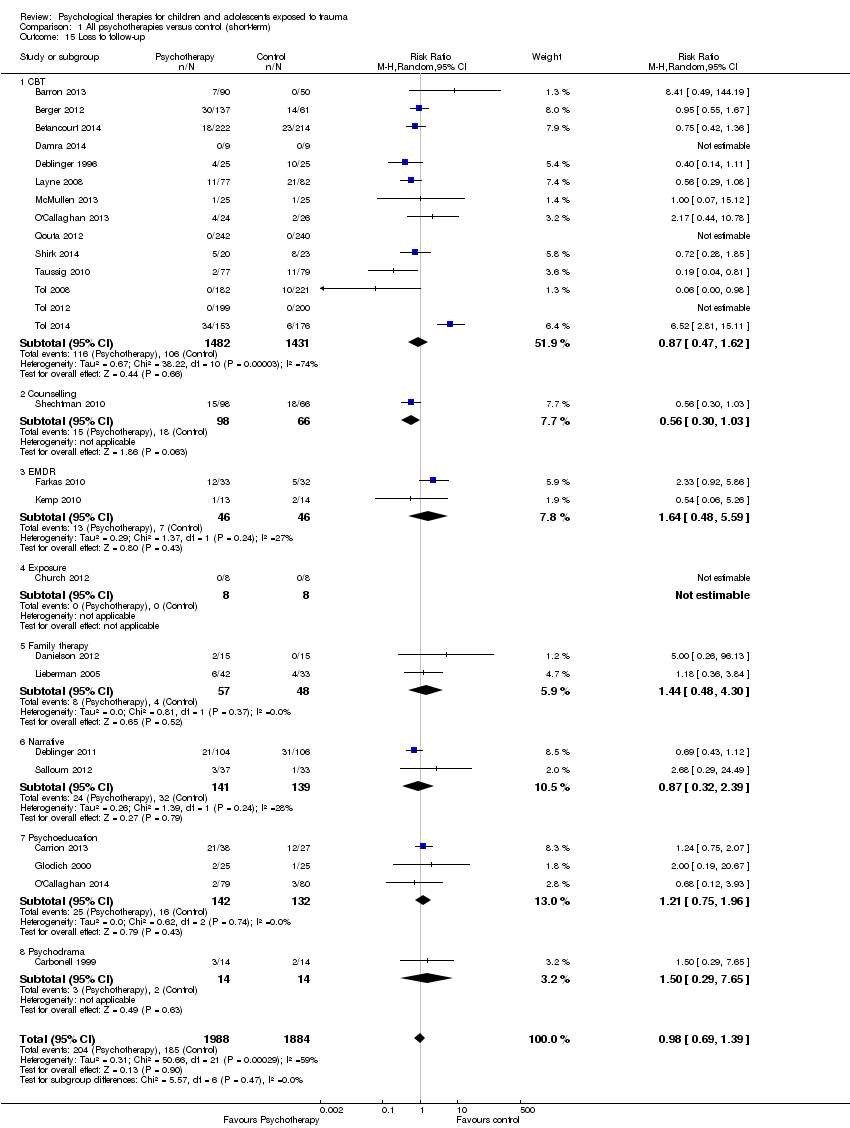
Comparison 1 All psychotherapies versus control (short‐term), Outcome 15 Loss to follow‐up.

Comparison 2 All psychotherapies versus control (medium‐term), Outcome 1 PTSD diagnosis.

Comparison 2 All psychotherapies versus control (medium‐term), Outcome 2 PTSD total symptoms.

Comparison 2 All psychotherapies versus control (medium‐term), Outcome 3 PTSD ‐ avoidance.

Comparison 2 All psychotherapies versus control (medium‐term), Outcome 4 PTSD ‐ hyperarousal.
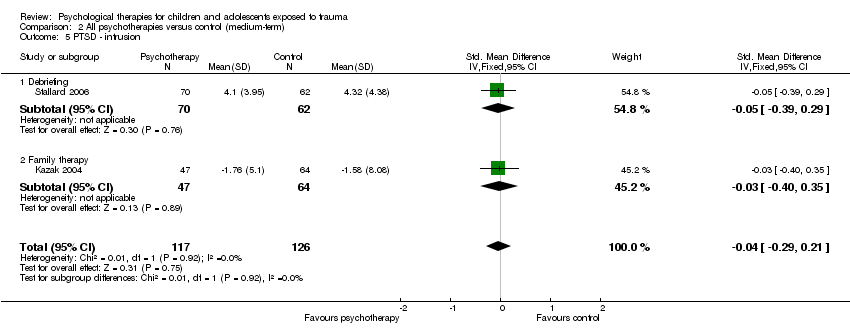
Comparison 2 All psychotherapies versus control (medium‐term), Outcome 5 PTSD ‐ intrusion.

Comparison 2 All psychotherapies versus control (medium‐term), Outcome 6 Anxiety total symptoms.

Comparison 2 All psychotherapies versus control (medium‐term), Outcome 7 Anxiety ‐ state.

Comparison 2 All psychotherapies versus control (medium‐term), Outcome 8 Anxiety ‐ trait.

Comparison 2 All psychotherapies versus control (medium‐term), Outcome 9 Depression.

Comparison 2 All psychotherapies versus control (medium‐term), Outcome 10 Behaviour ‐ total.

Comparison 2 All psychotherapies versus control (medium‐term), Outcome 11 Behaviour ‐ internalising.

Comparison 2 All psychotherapies versus control (medium‐term), Outcome 12 Behaviour ‐ externalising.

Comparison 2 All psychotherapies versus control (medium‐term), Outcome 13 Function.

Comparison 2 All psychotherapies versus control (medium‐term), Outcome 14 Quality of life.

Comparison 2 All psychotherapies versus control (medium‐term), Outcome 15 Loss to follow‐up.

Comparison 3 All psychotherapies versus control (long‐term), Outcome 1 PTSD diagnosis.

Comparison 3 All psychotherapies versus control (long‐term), Outcome 2 PTSD total symptoms.

Comparison 3 All psychotherapies versus control (long‐term), Outcome 3 Anxiety.

Comparison 3 All psychotherapies versus control (long‐term), Outcome 4 Depression.

Comparison 3 All psychotherapies versus control (long‐term), Outcome 5 Behaviour ‐ total.

Comparison 3 All psychotherapies versus control (long‐term), Outcome 6 Behaviour ‐ internalising.
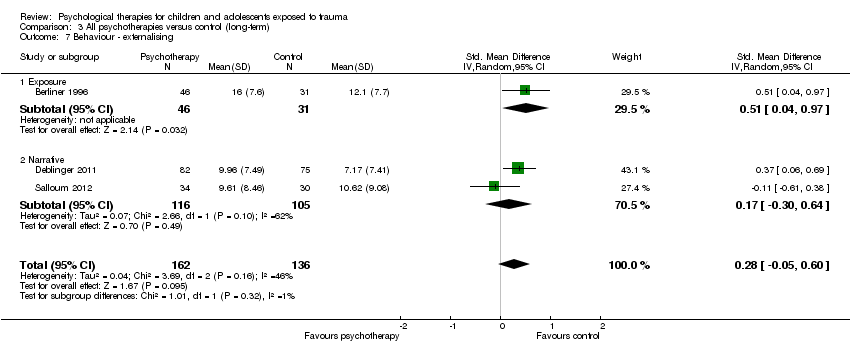
Comparison 3 All psychotherapies versus control (long‐term), Outcome 7 Behaviour ‐ externalising.
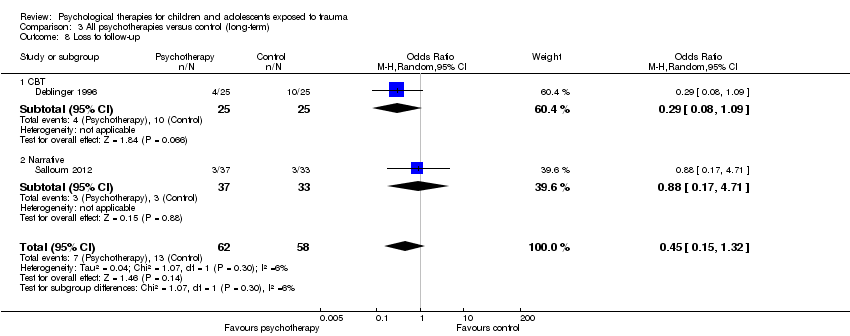
Comparison 3 All psychotherapies versus control (long‐term), Outcome 8 Loss to follow‐up.
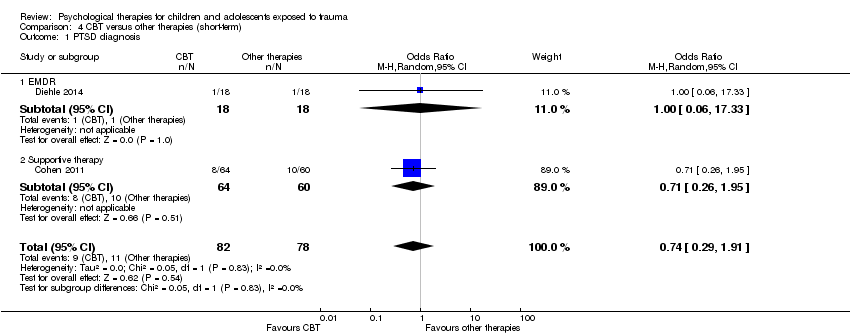
Comparison 4 CBT versus other therapies (short‐term), Outcome 1 PTSD diagnosis.
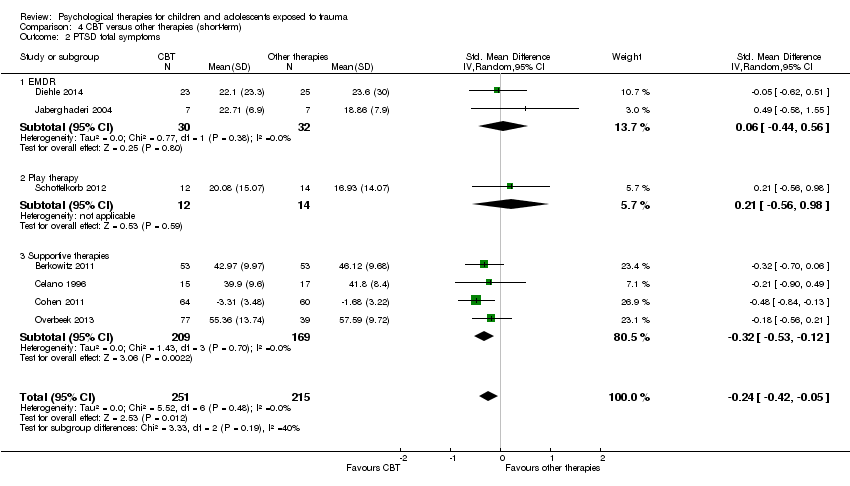
Comparison 4 CBT versus other therapies (short‐term), Outcome 2 PTSD total symptoms.

Comparison 4 CBT versus other therapies (short‐term), Outcome 3 PTSD avoidance.

Comparison 4 CBT versus other therapies (short‐term), Outcome 4 PTSD hyperarousal.
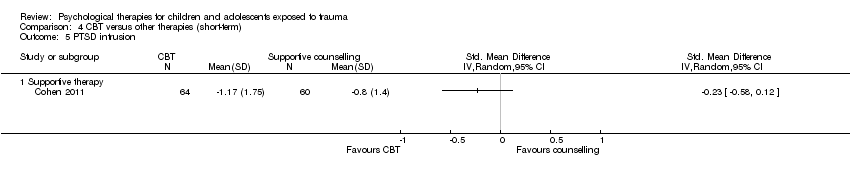
Comparison 4 CBT versus other therapies (short‐term), Outcome 5 PTSD intrusion.

Comparison 4 CBT versus other therapies (short‐term), Outcome 6 Anxiety total symptoms.

Comparison 4 CBT versus other therapies (short‐term), Outcome 7 Depression.

Comparison 4 CBT versus other therapies (short‐term), Outcome 8 Behaviour ‐ total.
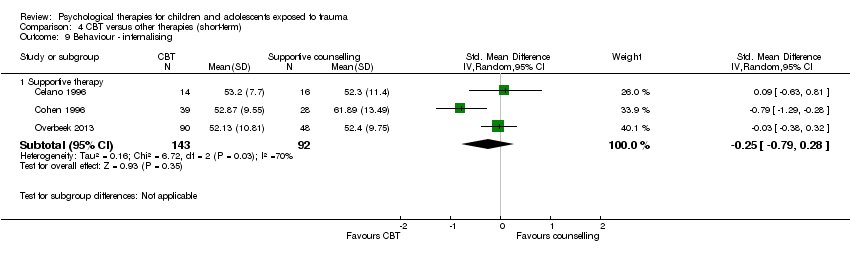
Comparison 4 CBT versus other therapies (short‐term), Outcome 9 Behaviour ‐ internalising.

Comparison 4 CBT versus other therapies (short‐term), Outcome 10 Behaviour ‐ externalising.

Comparison 4 CBT versus other therapies (short‐term), Outcome 11 Function.

Comparison 4 CBT versus other therapies (short‐term), Outcome 12 Loss to follow‐up.
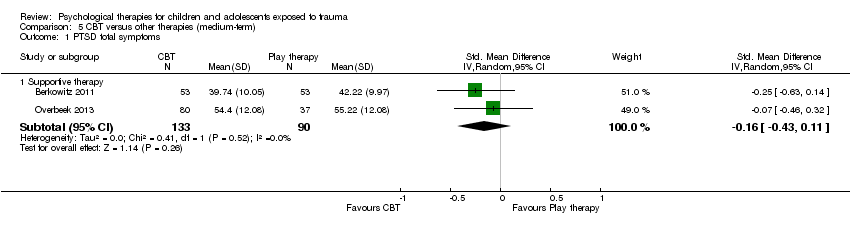
Comparison 5 CBT versus other therapies (medium‐term), Outcome 1 PTSD total symptoms.

Comparison 5 CBT versus other therapies (medium‐term), Outcome 2 Anxiety total symptoms.

Comparison 5 CBT versus other therapies (medium‐term), Outcome 3 Depression.

Comparison 5 CBT versus other therapies (medium‐term), Outcome 4 Behaviour ‐ total.

Comparison 5 CBT versus other therapies (medium‐term), Outcome 5 Behaviour ‐ internalising.

Comparison 5 CBT versus other therapies (medium‐term), Outcome 6 Behaviour ‐ externalising.
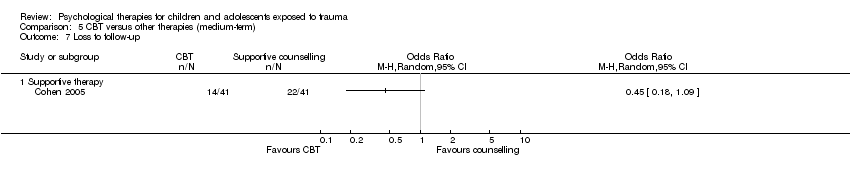
Comparison 5 CBT versus other therapies (medium‐term), Outcome 7 Loss to follow‐up.
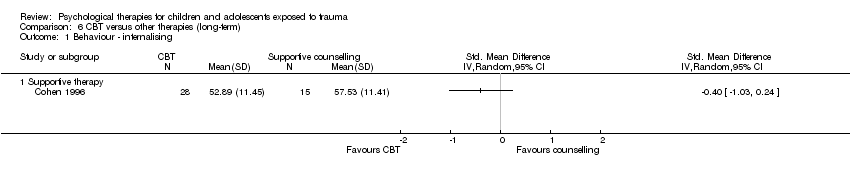
Comparison 6 CBT versus other therapies (long‐term), Outcome 1 Behaviour ‐ internalising.

Comparison 6 CBT versus other therapies (long‐term), Outcome 2 Behaviour ‐ externalising.
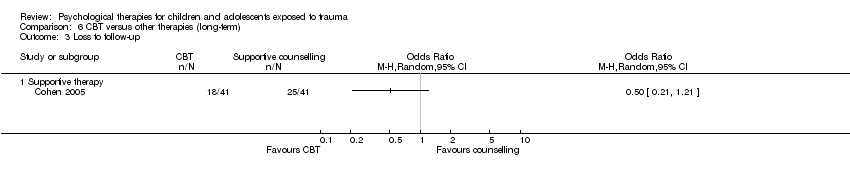
Comparison 6 CBT versus other therapies (long‐term), Outcome 3 Loss to follow‐up.
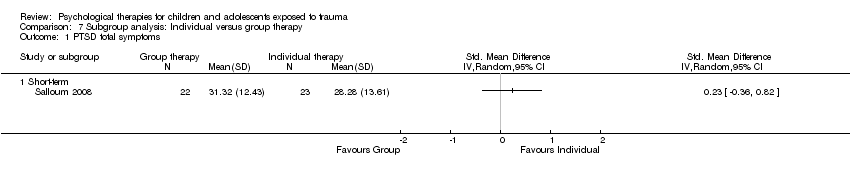
Comparison 7 Subgroup analysis: Individual versus group therapy, Outcome 1 PTSD total symptoms.

Comparison 8 Subgroup analysis: Child versus mother and child therapy, Outcome 1 PTSD total symptoms.
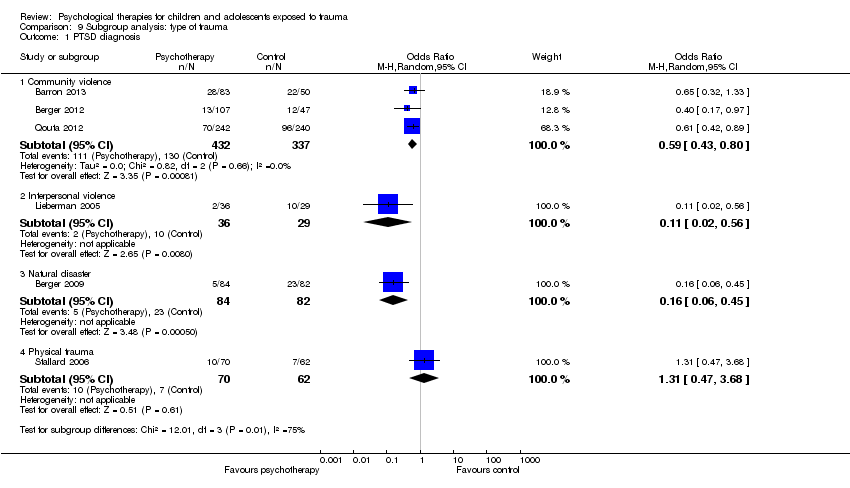
Comparison 9 Subgroup analysis: type of trauma, Outcome 1 PTSD diagnosis.
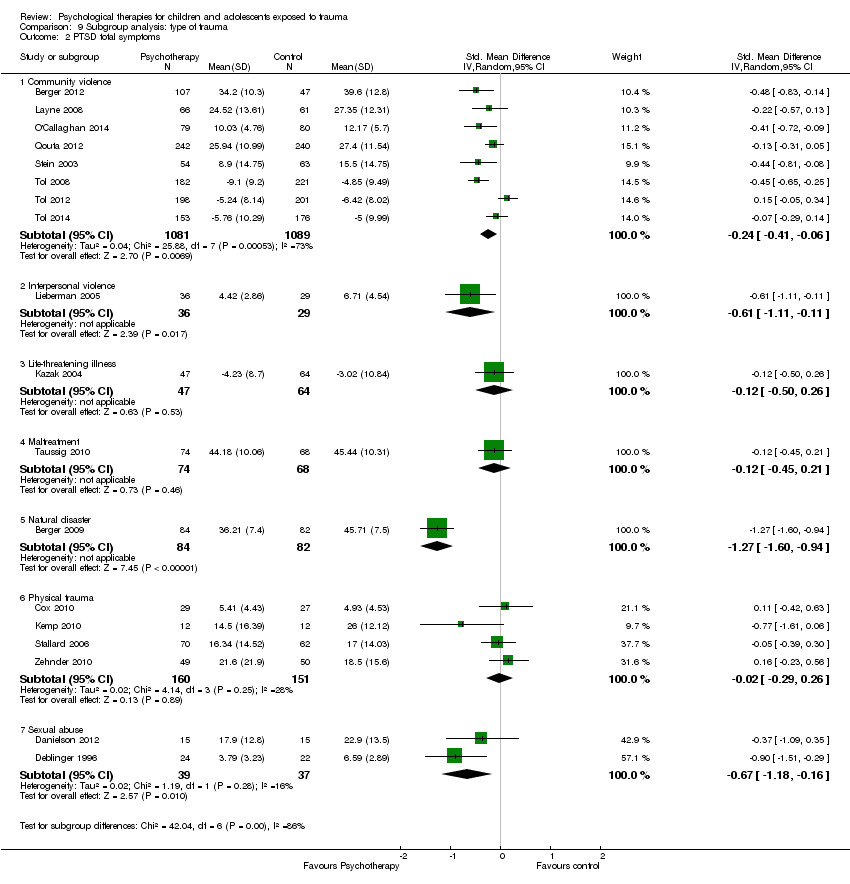
Comparison 9 Subgroup analysis: type of trauma, Outcome 2 PTSD total symptoms.

Comparison 10 Subgroup analysis: symptomatic participants, Outcome 1 PTSD diagnosis.

Comparison 10 Subgroup analysis: symptomatic participants, Outcome 2 PTSD total symptoms.

Comparison 11 Sensitivity analysis: type of control, Outcome 1 PTSD diagnosis.

Comparison 11 Sensitivity analysis: type of control, Outcome 2 PTSD total symptoms.

Comparison 12 Sensitivity analysis: best‐/worst‐case analysis, Outcome 1 PTSD diagnosis.

Comparison 13 Sensitivity analysis: cluster‐randomisation, Outcome 1 PTSD diagnosis.
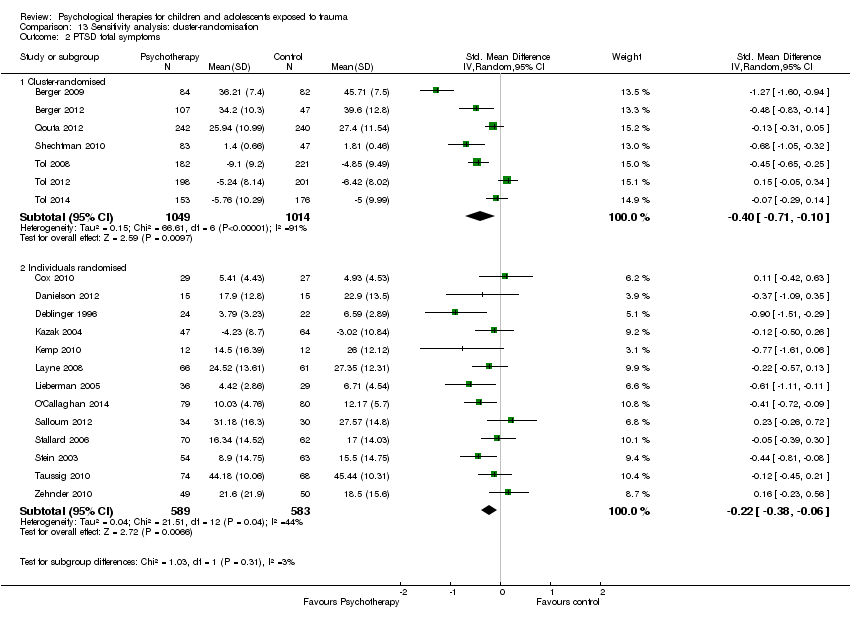
Comparison 13 Sensitivity analysis: cluster‐randomisation, Outcome 2 PTSD total symptoms.

Comparison 14 Sensitivity analysis: performance bias, Outcome 1 PTSD diagnosis.
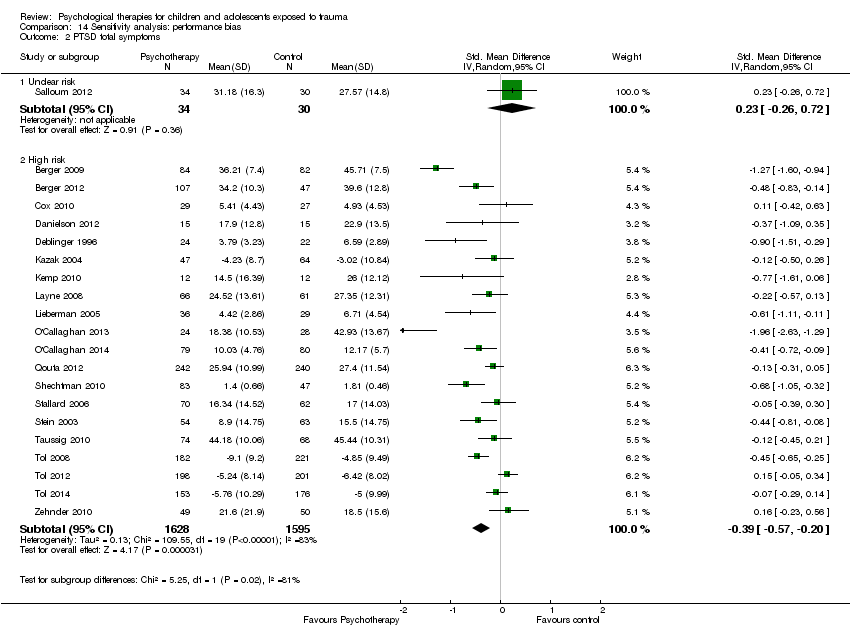
Comparison 14 Sensitivity analysis: performance bias, Outcome 2 PTSD total symptoms.

Comparison 15 Sensitivity analysis: detection bias, Outcome 1 PTSD diagnosis.

Comparison 15 Sensitivity analysis: detection bias, Outcome 2 PTSD total symptoms.

Comparison 16 Sensitivity analysis: attrition bias, Outcome 1 PTSD diagnosis.

Comparison 16 Sensitivity analysis: attrition bias, Outcome 2 PTSD total symptoms.

Comparison 17 Sensitivity analysis: selection bias, Outcome 1 PTSD diagnosis.
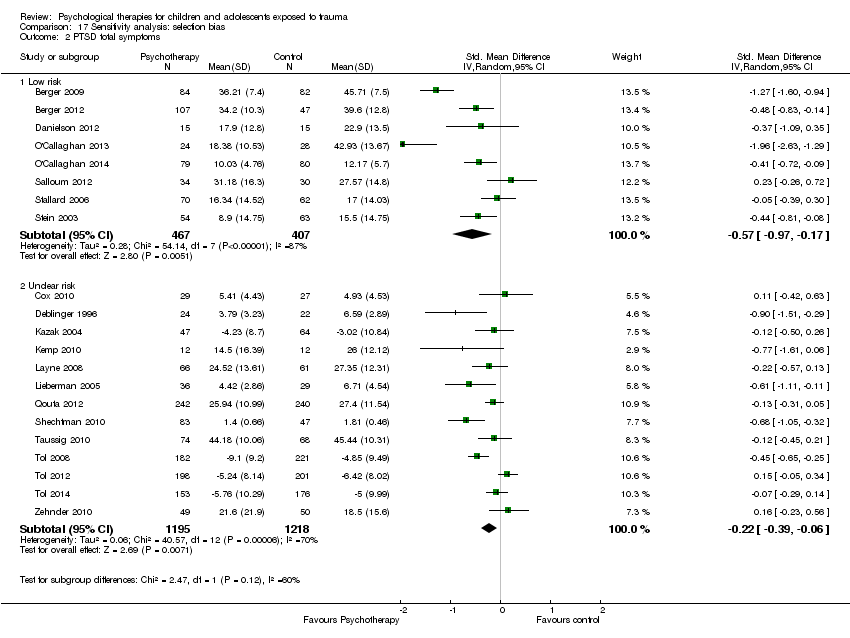
Comparison 17 Sensitivity analysis: selection bias, Outcome 2 PTSD total symptoms.
| Patient or population: children and adolescents exposed to trauma | ||||||
| Outcomes | Anticipated absolute effects* (95% CI) | Relative effect | Number of participants | Quality of the evidence | Comments | |
| Risk with control (short‐term) | Risk with all psychotherapies | |||||
| PTSD diagnosis | Study population | OR 0.51 | 874 | ⊕⊝⊝⊝ | ||
| 367 per 1000 | 228 per 1000 | |||||
| Moderate | ||||||
| 345 per 1000 | 212 per 1000 | |||||
| PTSD total symptoms | Mean PTSD total symptoms in the intervention group 0.42 standard deviations undefined fewer (0.61 fewer to 0.24 fewer) | Moderate effect size | 2051 | ⊕⊕⊝⊝ | ||
| *The risk in the intervention group (and its 95% confidence interval) is based on assumed risk in the comparison group and relative effect of the intervention (and its 95% CI) | ||||||
| GRADE Working Group grades of evidence | ||||||
| aParticipants are likely to have been aware of whether they received the active or inactive intervention in all studies, and diagnosis was based on self reported measures in 2 studies dParticipants were likely to have been aware of whether they received active or inactive intervention in all but one study, and scores were based on self reported measures in 10 studies eSubstantial heterogeneity between different types of psychological therapy (I2 = 71%) | ||||||
| Patient or population: children and adolescents exposed to trauma | ||||||
| Outcomes | Anticipated absolute effects* (95% CI) | Relative effect | Numer of participants | Quality of the evidence | Comments | |
| Risk with other therapies (short‐term) | Risk with CBT | |||||
| PTSD diagnosis | Study population | OR 0.74 | 160 | ⊕⊝⊝⊝ | ||
| 141 per 1000 | 108 per 1000 | |||||
| Moderate | ||||||
| 111 per 1000 | 85 per 1000 | |||||
| PTSD total symptoms | Mean PTSD total symptoms in the intervention group 0.24 standard deviations undefined fewer (0.42 fewer to 0.05 fewer) | Small effect size | 466 | ⊕⊕⊕⊝ | ||
| *The risk in the intervention group (and its 95% confidence interval) is based on assumed risk in the comparison group and relative effect of the intervention (and its 95% CI) | ||||||
| GRADE Working Group grades of evidence | ||||||
| aParticipants are likely to have been aware of whether they received active or inactive intervention in both studies, and diagnosis was based on self reported measures in both cParticipants are likely to have been aware of whether they received active or inactive intervention in all studies, and scores were based on self reported measures in 4 studies | ||||||
| Outcome | Group | n | Mean | SD |
| PTSD symptoms One month | Exposure therapy | 8 | 3.38 | 2.60 |
| Control | 8 | 31.38 | 3.84 | |
| Avoidance One month | Exposure therapy | 8 | 2.88 | 2.62 |
| Control | 8 | 20.25 | 2.38 | |
| Intrusion One month | Exposure therapy | 8 | 0.50 | 0.50 |
| Control | 8 | 11.13 | 2.93 |
| Outcome | Group | n | Mean | SD |
| PTSD symptoms Post therapy | TF‐CBT | 9 | 13.00 | 1.12 |
| Control | 9 | 24.20 | 1.54 | |
| PTSD symptoms 4 months | TF‐CBT | 9 | 11.88 | 1.96 |
| Control | 9 | 23.98 | 1.47 |
| Outcome | Group | n | Mean | SD |
| PTSD symptoms Post therapy | TF‐CBT | 24 | 10.6 | 4.5 |
| Control | 24 | 34.8 | 11.6 | |
| Conduct Problems Post therapy | TF‐CBT | 24 | 0.7 | 0.9 |
| Control | 24 | 7.1 | 7.0 |
| Outcome or subgroup title | No. of studies | No. of participants | Statistical method | Effect size |
| 1 PTSD diagnosis Show forest plot | 5 | 874 | Odds Ratio (M‐H, Random, 95% CI) | 0.51 [0.34, 0.77] |
| 1.1 CBT | 3 | 769 | Odds Ratio (M‐H, Random, 95% CI) | 0.59 [0.43, 0.80] |
| 1.2 EMDR | 1 | 40 | Odds Ratio (M‐H, Random, 95% CI) | 0.2 [0.01, 4.44] |
| 1.3 Family therapy | 1 | 65 | Odds Ratio (M‐H, Random, 95% CI) | 0.11 [0.02, 0.56] |
| 2 PTSD total symptoms Show forest plot | 15 | 2051 | Std. Mean Difference (IV, Random, 95% CI) | ‐0.42 [‐0.61, ‐0.24] |
| 2.1 CBT | 6 | 1329 | Std. Mean Difference (IV, Random, 95% CI) | ‐0.37 [‐0.55, ‐0.19] |
| 2.2 EMDR | 1 | 24 | Std. Mean Difference (IV, Random, 95% CI) | ‐0.77 [‐1.61, 0.06] |
| 2.3 Family therapy | 2 | 95 | Std. Mean Difference (IV, Random, 95% CI) | ‐0.53 [‐0.94, ‐0.12] |
| 2.4 Narrative | 1 | 64 | Std. Mean Difference (IV, Random, 95% CI) | 0.23 [‐0.26, 0.72] |
| 2.5 Psychoeducation | 2 | 215 | Std. Mean Difference (IV, Random, 95% CI) | ‐0.19 [‐0.69, 0.30] |
| 2.6 Supportive therapy | 2 | 272 | Std. Mean Difference (IV, Random, 95% CI) | ‐0.40 [‐0.95, 0.15] |
| 2.7 CBT + narrative therapy | 1 | 52 | Std. Mean Difference (IV, Random, 95% CI) | ‐1.96 [‐2.63, ‐1.29] |
| 3 PTSD avoidance Show forest plot | 2 | 205 | Std. Mean Difference (IV, Random, 95% CI) | ‐0.02 [‐0.29, 0.26] |
| 3.1 Narrative | 1 | 158 | Std. Mean Difference (IV, Random, 95% CI) | 0.05 [‐0.27, 0.36] |
| 3.2 Psychoeducation | 1 | 47 | Std. Mean Difference (IV, Random, 95% CI) | ‐0.23 [‐0.80, 0.35] |
| 4 PTSD hyperarousal Show forest plot | 2 | 205 | Std. Mean Difference (IV, Random, 95% CI) | 0.05 [‐0.22, 0.32] |
| 4.1 Narrative | 1 | 158 | Std. Mean Difference (IV, Random, 95% CI) | 0.10 [‐0.21, 0.41] |
| 4.2 Psychoeducation | 1 | 47 | Std. Mean Difference (IV, Random, 95% CI) | ‐0.12 [‐0.70, 0.45] |
| 5 PTSD intrusion Show forest plot | 2 | 205 | Std. Mean Difference (IV, Random, 95% CI) | 0.11 [‐0.16, 0.39] |
| 5.1 Narrative | 1 | 158 | Std. Mean Difference (IV, Random, 95% CI) | 0.15 [‐0.16, 0.46] |
| 5.2 Psychoeducation | 1 | 47 | Std. Mean Difference (IV, Random, 95% CI) | ‐0.02 [‐0.59, 0.55] |
| 6 Anxiety total symptoms Show forest plot | 7 | 959 | Std. Mean Difference (IV, Random, 95% CI) | ‐0.13 [‐0.26, 0.00] |
| 6.1 CBT | 2 | 557 | Std. Mean Difference (IV, Random, 95% CI) | ‐0.13 [‐0.30, 0.04] |
| 6.2 Counselling | 1 | 130 | Std. Mean Difference (IV, Random, 95% CI) | ‐0.20 [‐0.56, 0.16] |
| 6.3 EMDR | 1 | 40 | Std. Mean Difference (IV, Random, 95% CI) | ‐0.66 [‐1.30, ‐0.03] |
| 6.4 Exposure | 1 | 65 | Std. Mean Difference (IV, Random, 95% CI) | 0.01 [‐0.48, 0.51] |
| 6.5 Narrative | 1 | 111 | Std. Mean Difference (IV, Random, 95% CI) | ‐0.21 [‐0.58, 0.17] |
| 6.6 Psychoeducation | 1 | 56 | Std. Mean Difference (IV, Random, 95% CI) | 0.32 [‐0.21, 0.85] |
| 7 Anxiety ‐ state Show forest plot | 2 | 70 | Std. Mean Difference (IV, Random, 95% CI) | ‐0.64 [‐1.12, ‐0.16] |
| 7.1 CBT | 1 | 46 | Std. Mean Difference (IV, Random, 95% CI) | ‐0.71 [‐1.31, ‐0.12] |
| 7.2 EMDR | 1 | 24 | Std. Mean Difference (IV, Random, 95% CI) | ‐0.51 [‐1.33, 0.31] |
| 8 Anxiety ‐ trait Show forest plot | 2 | 70 | Std. Mean Difference (IV, Random, 95% CI) | ‐0.34 [‐0.81, 0.14] |
| 8.1 CBT | 1 | 46 | Std. Mean Difference (IV, Random, 95% CI) | ‐0.36 [‐0.94, 0.22] |
| 8.2 EMDR | 1 | 24 | Std. Mean Difference (IV, Random, 95% CI) | ‐0.29 [‐1.10, 0.51] |
| 9 Depression Show forest plot | 13 | 1569 | Std. Mean Difference (IV, Random, 95% CI) | ‐0.13 [‐0.30, 0.04] |
| 9.1 CBT | 6 | 1191 | Std. Mean Difference (IV, Random, 95% CI) | ‐0.21 [‐0.42, ‐0.00] |
| 9.2 EMDR | 2 | 64 | Std. Mean Difference (IV, Random, 95% CI) | ‐0.39 [‐1.41, 0.64] |
| 9.3 Exposure | 1 | 52 | Std. Mean Difference (IV, Random, 95% CI) | 0.10 [‐0.45, 0.65] |
| 9.4 Family therapy | 1 | 30 | Std. Mean Difference (IV, Random, 95% CI) | 0.05 [‐0.66, 0.77] |
| 9.5 Narrative | 2 | 176 | Std. Mean Difference (IV, Random, 95% CI) | 0.13 [‐0.52, 0.77] |
| 9.6 Psychoeducation | 1 | 56 | Std. Mean Difference (IV, Random, 95% CI) | 0.09 [‐0.43, 0.62] |
| 10 Behaviour ‐ total Show forest plot | 3 | 166 | Std. Mean Difference (IV, Random, 95% CI) | ‐0.04 [‐0.51, 0.42] |
| 10.1 EMDR | 1 | 24 | Std. Mean Difference (IV, Random, 95% CI) | ‐0.44 [‐1.25, 0.37] |
| 10.2 Exposure | 1 | 77 | Std. Mean Difference (IV, Random, 95% CI) | 0.34 [‐0.11, 0.80] |
| 10.3 Family therapy | 1 | 65 | Std. Mean Difference (IV, Random, 95% CI) | ‐0.23 [‐0.72, 0.26] |
| 11 Behaviour ‐ internalising Show forest plot | 10 | 719 | Std. Mean Difference (IV, Random, 95% CI) | ‐0.04 [‐0.20, 0.13] |
| 11.1 CBT | 2 | 162 | Std. Mean Difference (IV, Random, 95% CI) | ‐0.13 [‐0.44, 0.18] |
| 11.2 EMDR | 2 | 64 | Std. Mean Difference (IV, Random, 95% CI) | ‐0.57 [‐1.07, ‐0.07] |
| 11.3 Exposure | 1 | 77 | Std. Mean Difference (IV, Random, 95% CI) | 0.38 [‐0.08, 0.84] |
| 11.4 Family therapy | 1 | 30 | Std. Mean Difference (IV, Random, 95% CI) | 0.32 [‐0.40, 1.04] |
| 11.5 Narrative | 2 | 180 | Std. Mean Difference (IV, Random, 95% CI) | 0.12 [‐0.18, 0.41] |
| 11.6 Psychoeducation | 2 | 206 | Std. Mean Difference (IV, Random, 95% CI) | ‐0.11 [‐0.38, 0.17] |
| 12 Behaviour ‐ externalising Show forest plot | 12 | 1174 | Std. Mean Difference (IV, Random, 95% CI) | ‐0.10 [‐0.33, 0.14] |
| 12.1 CBT | 3 | 565 | Std. Mean Difference (IV, Random, 95% CI) | ‐0.11 [‐0.28, 0.06] |
| 12.2 EMDR | 2 | 64 | Std. Mean Difference (IV, Random, 95% CI) | ‐0.55 [‐1.19, 0.10] |
| 12.3 Exposure | 1 | 77 | Std. Mean Difference (IV, Random, 95% CI) | 0.49 [0.03, 0.95] |
| 12.4 Family therapy | 1 | 30 | Std. Mean Difference (IV, Random, 95% CI) | 0.23 [‐0.49, 0.95] |
| 12.5 Narrative | 2 | 180 | Std. Mean Difference (IV, Random, 95% CI) | 0.20 [‐0.41, 0.81] |
| 12.6 Psychoeducation | 2 | 206 | Std. Mean Difference (IV, Random, 95% CI) | ‐0.03 [‐0.52, 0.46] |
| 12.7 CBT + narrative therapy | 1 | 52 | Std. Mean Difference (IV, Random, 95% CI) | ‐1.06 [‐1.64, ‐0.47] |
| 13 Functional impairment Show forest plot | 2 | Std. Mean Difference (IV, Random, 95% CI) | Subtotals only | |
| 13.1 CBT | 2 | 557 | Std. Mean Difference (IV, Random, 95% CI) | ‐0.41 [‐0.59, ‐0.24] |
| 14 Quality of life Show forest plot | 1 | Std. Mean Difference (IV, Random, 95% CI) | Totals not selected | |
| 14.1 Supportive therapy | 1 | Std. Mean Difference (IV, Random, 95% CI) | 0.0 [0.0, 0.0] | |
| 15 Loss to follow‐up Show forest plot | 26 | 3872 | Risk Ratio (M‐H, Random, 95% CI) | 0.98 [0.69, 1.39] |
| 15.1 CBT | 14 | 2913 | Risk Ratio (M‐H, Random, 95% CI) | 0.87 [0.47, 1.62] |
| 15.2 Counselling | 1 | 164 | Risk Ratio (M‐H, Random, 95% CI) | 0.56 [0.30, 1.03] |
| 15.3 EMDR | 2 | 92 | Risk Ratio (M‐H, Random, 95% CI) | 1.64 [0.48, 5.59] |
| 15.4 Exposure | 1 | 16 | Risk Ratio (M‐H, Random, 95% CI) | 0.0 [0.0, 0.0] |
| 15.5 Family therapy | 2 | 105 | Risk Ratio (M‐H, Random, 95% CI) | 1.44 [0.48, 4.30] |
| 15.6 Narrative | 2 | 280 | Risk Ratio (M‐H, Random, 95% CI) | 0.87 [0.32, 2.39] |
| 15.7 Psychoeducation | 3 | 274 | Risk Ratio (M‐H, Random, 95% CI) | 1.21 [0.75, 1.96] |
| 15.8 Psychodrama | 1 | 28 | Risk Ratio (M‐H, Random, 95% CI) | 1.5 [0.29, 7.65] |
| Outcome or subgroup title | No. of studies | No. of participants | Statistical method | Effect size |
| 1 PTSD diagnosis Show forest plot | 4 | 742 | Odds Ratio (M‐H, Random, 95% CI) | 0.66 [0.26, 1.69] |
| 1.1 CBT | 2 | 570 | Odds Ratio (M‐H, Random, 95% CI) | 0.49 [0.09, 2.61] |
| 1.2 Debriefing | 1 | 132 | Odds Ratio (M‐H, Random, 95% CI) | 1.31 [0.47, 3.68] |
| 1.3 EMDR | 1 | 40 | Odds Ratio (M‐H, Random, 95% CI) | 0.35 [0.01, 9.13] |
| 2 PTSD total symptoms Show forest plot | 12 | 2337 | Std. Mean Difference (IV, Random, 95% CI) | ‐0.17 [‐0.38, 0.05] |
| 2.1 CBT | 5 | 1701 | Std. Mean Difference (IV, Random, 95% CI) | ‐0.34 [‐0.72, 0.03] |
| 2.2 Debriefing | 2 | 231 | Std. Mean Difference (IV, Random, 95% CI) | 0.04 [‐0.22, 0.30] |
| 2.3 Family therapy | 2 | 141 | Std. Mean Difference (IV, Random, 95% CI) | ‐0.06 [‐0.39, 0.27] |
| 2.4 Narrative | 1 | 64 | Std. Mean Difference (IV, Random, 95% CI) | 0.23 [‐0.26, 0.73] |
| 2.5 Psychoeducation | 1 | 56 | Std. Mean Difference (IV, Random, 95% CI) | ‐0.13 [‐0.65, 0.40] |
| 2.6 Supportive therapy | 1 | 144 | Std. Mean Difference (IV, Random, 95% CI) | ‐0.21 [‐0.54, 0.12] |
| 3 PTSD ‐ avoidance Show forest plot | 2 | 243 | Std. Mean Difference (IV, Fixed, 95% CI) | 0.04 [‐0.22, 0.29] |
| 3.1 Debriefing | 1 | 132 | Std. Mean Difference (IV, Fixed, 95% CI) | ‐0.08 [‐0.42, 0.26] |
| 3.2 Family therapy | 1 | 111 | Std. Mean Difference (IV, Fixed, 95% CI) | 0.18 [‐0.20, 0.55] |
| 4 PTSD ‐ hyperarousal Show forest plot | 2 | 243 | Std. Mean Difference (IV, Random, 95% CI) | ‐0.13 [‐0.43, 0.17] |
| 4.1 Debriefing | 1 | 132 | Std. Mean Difference (IV, Random, 95% CI) | 0.01 [‐0.33, 0.35] |
| 4.2 Family therapy | 1 | 111 | Std. Mean Difference (IV, Random, 95% CI) | ‐0.29 [‐0.67, 0.09] |
| 5 PTSD ‐ intrusion Show forest plot | 2 | 243 | Std. Mean Difference (IV, Fixed, 95% CI) | ‐0.04 [‐0.29, 0.21] |
| 5.1 Debriefing | 1 | 132 | Std. Mean Difference (IV, Fixed, 95% CI) | ‐0.05 [‐0.39, 0.29] |
| 5.2 Family therapy | 1 | 111 | Std. Mean Difference (IV, Fixed, 95% CI) | ‐0.03 [‐0.40, 0.35] |
| 6 Anxiety total symptoms Show forest plot | 7 | 1470 | Std. Mean Difference (IV, Random, 95% CI) | ‐0.10 [‐0.20, 0.00] |
| 6.1 CBT | 3 | 1131 | Std. Mean Difference (IV, Random, 95% CI) | ‐0.07 [‐0.19, 0.04] |
| 6.2 Debriefing | 1 | 132 | Std. Mean Difference (IV, Random, 95% CI) | ‐0.08 [‐0.42, 0.27] |
| 6.3 EMDR | 1 | 40 | Std. Mean Difference (IV, Random, 95% CI) | ‐0.72 [‐1.36, ‐0.07] |
| 6.4 Psychoeducation | 1 | 56 | Std. Mean Difference (IV, Random, 95% CI) | ‐0.21 [‐0.73, 0.32] |
| 6.5 Narrative | 1 | 111 | Std. Mean Difference (IV, Random, 95% CI) | ‐0.17 [‐0.54, 0.21] |
| 7 Anxiety ‐ state Show forest plot | 1 | Std. Mean Difference (IV, Fixed, 95% CI) | Totals not selected | |
| 7.1 CBT | 1 | Std. Mean Difference (IV, Fixed, 95% CI) | 0.0 [0.0, 0.0] | |
| 8 Anxiety ‐ trait Show forest plot | 2 | Std. Mean Difference (IV, Fixed, 95% CI) | Subtotals only | |
| 8.1 CBT | 2 | 101 | Std. Mean Difference (IV, Fixed, 95% CI) | ‐0.45 [‐0.85, ‐0.05] |
| 9 Depression Show forest plot | 13 | 2191 | Std. Mean Difference (IV, Random, 95% CI) | ‐0.07 [‐0.22, 0.07] |
| 9.1 CBT | 8 | 1810 | Std. Mean Difference (IV, Random, 95% CI) | ‐0.12 [‐0.31, 0.07] |
| 9.2 Debriefing | 2 | 231 | Std. Mean Difference (IV, Random, 95% CI) | ‐0.12 [‐0.38, 0.14] |
| 9.3 Family therapy | 1 | 30 | Std. Mean Difference (IV, Random, 95% CI) | 0.34 [‐0.38, 1.06] |
| 9.4 Narrative | 1 | 64 | Std. Mean Difference (IV, Random, 95% CI) | 0.34 [‐0.15, 0.84] |
| 9.5 Psychoeducation | 1 | 56 | Std. Mean Difference (IV, Random, 95% CI) | ‐0.14 [‐0.67, 0.38] |
| 10 Behaviour ‐ total Show forest plot | 3 | 281 | Std. Mean Difference (IV, Fixed, 95% CI) | ‐0.20 [‐0.43, 0.04] |
| 10.1 Debriefing | 1 | 132 | Std. Mean Difference (IV, Fixed, 95% CI) | ‐0.28 [‐0.62, 0.06] |
| 10.2 Family therapy | 1 | 50 | Std. Mean Difference (IV, Fixed, 95% CI) | ‐0.37 [‐0.93, 0.19] |
| 10.3 Narrative | 1 | 99 | Std. Mean Difference (IV, Fixed, 95% CI) | 0.0 [‐0.39, 0.39] |
| 11 Behaviour ‐ internalising Show forest plot | 4 | 291 | Std. Mean Difference (IV, Random, 95% CI) | 0.01 [‐0.25, 0.28] |
| 11.1 EMDR | 1 | 40 | Std. Mean Difference (IV, Random, 95% CI) | ‐0.50 [‐1.13, 0.14] |
| 11.2 Family therapy | 1 | 30 | Std. Mean Difference (IV, Random, 95% CI) | 0.0 [‐0.72, 0.72] |
| 11.3 Narrative | 2 | 221 | Std. Mean Difference (IV, Random, 95% CI) | 0.13 [‐0.13, 0.40] |
| 12 Behaviour ‐ externalising Show forest plot | 5 | 694 | Std. Mean Difference (IV, Random, 95% CI) | 0.02 [‐0.32, 0.35] |
| 12.1 CBT | 1 | 403 | Std. Mean Difference (IV, Random, 95% CI) | 0.07 [‐0.13, 0.27] |
| 12.2 EMDR | 1 | 40 | Std. Mean Difference (IV, Random, 95% CI) | 1.00 [‐1.66, ‐0.33] |
| 12.3 Family therapy | 1 | 30 | Std. Mean Difference (IV, Random, 95% CI) | ‐0.01 [‐0.72, 0.71] |
| 12.4 Narrative | 2 | 221 | Std. Mean Difference (IV, Random, 95% CI) | 0.31 [0.05, 0.58] |
| 13 Function Show forest plot | 3 | Std. Mean Difference (IV, Random, 95% CI) | Subtotals only | |
| 13.1 CBT | 3 | 814 | Std. Mean Difference (IV, Random, 95% CI) | ‐0.46 [‐0.88, ‐0.05] |
| 14 Quality of life Show forest plot | 1 | Std. Mean Difference (IV, Random, 95% CI) | Totals not selected | |
| 14.1 Supportive therapy | 1 | Std. Mean Difference (IV, Random, 95% CI) | 0.0 [0.0, 0.0] | |
| 15 Loss to follow‐up Show forest plot | 20 | 3663 | Odds Ratio (M‐H, Fixed, 95% CI) | 1.00 [0.82, 1.21] |
| 15.1 CBT | 11 | 2856 | Odds Ratio (M‐H, Fixed, 95% CI) | 1.01 [0.81, 1.27] |
| 15.2 Counselling | 1 | 23 | Odds Ratio (M‐H, Fixed, 95% CI) | 7.0 [0.32, 152.95] |
| 15.3 Debriefing | 1 | 158 | Odds Ratio (M‐H, Fixed, 95% CI) | 0.76 [0.33, 1.76] |
| 15.4 EMDR | 1 | 65 | Odds Ratio (M‐H, Fixed, 95% CI) | 1.41 [0.52, 3.84] |
| 15.5 Family therapy | 1 | 75 | Odds Ratio (M‐H, Fixed, 95% CI) | 1.28 [0.48, 3.39] |
| 15.6 Narrative | 2 | 171 | Odds Ratio (M‐H, Fixed, 95% CI) | 0.70 [0.16, 2.99] |
| 15.7 Psychoeducation | 2 | 244 | Odds Ratio (M‐H, Fixed, 95% CI) | 0.77 [0.40, 1.47] |
| 15.8 Other | 1 | 71 | Odds Ratio (M‐H, Fixed, 95% CI) | 0.90 [0.29, 2.73] |
| Outcome or subgroup title | No. of studies | No. of participants | Statistical method | Effect size |
| 1 PTSD diagnosis Show forest plot | 1 | Odds Ratio (M‐H, Random, 95% CI) | Totals not selected | |
| 1.1 Narrative | 1 | Odds Ratio (M‐H, Random, 95% CI) | 0.0 [0.0, 0.0] | |
| 2 PTSD total symptoms Show forest plot | 2 | 141 | Std. Mean Difference (IV, Random, 95% CI) | 0.17 [‐0.28, 0.62] |
| 2.1 Exposure | 1 | 77 | Std. Mean Difference (IV, Random, 95% CI) | 0.39 [‐0.07, 0.85] |
| 2.2 Narrative | 1 | 64 | Std. Mean Difference (IV, Random, 95% CI) | ‐0.07 [‐0.56, 0.42] |
| 3 Anxiety Show forest plot | 2 | 176 | Std. Mean Difference (IV, Random, 95% CI) | ‐0.12 [‐0.41, 0.18] |
| 3.1 Exposure | 1 | 65 | Std. Mean Difference (IV, Random, 95% CI) | ‐0.30 [‐0.80, 0.19] |
| 3.2 Narrative | 1 | 111 | Std. Mean Difference (IV, Random, 95% CI) | ‐0.01 [‐0.39, 0.36] |
| 4 Depression Show forest plot | 3 | 152 | Std. Mean Difference (IV, Fixed, 95% CI) | ‐0.24 [‐0.56, 0.08] |
| 4.1 CBT | 1 | 36 | Std. Mean Difference (IV, Fixed, 95% CI) | ‐0.59 [‐1.27, 0.09] |
| 4.2 Exposure | 1 | 52 | Std. Mean Difference (IV, Fixed, 95% CI) | ‐0.29 [‐0.84, 0.26] |
| 4.3 Narrative | 1 | 64 | Std. Mean Difference (IV, Fixed, 95% CI) | ‐0.02 [‐0.51, 0.47] |
| 5 Behaviour ‐ total Show forest plot | 1 | Std. Mean Difference (IV, Random, 95% CI) | Totals not selected | |
| 5.1 Exposure | 1 | Std. Mean Difference (IV, Random, 95% CI) | 0.0 [0.0, 0.0] | |
| 6 Behaviour ‐ internalising Show forest plot | 2 | 141 | Std. Mean Difference (IV, Random, 95% CI) | 0.04 [‐0.51, 0.59] |
| 6.1 Exposure | 1 | 77 | Std. Mean Difference (IV, Random, 95% CI) | 0.31 [‐0.15, 0.77] |
| 6.2 Narrative | 1 | 64 | Std. Mean Difference (IV, Random, 95% CI) | ‐0.25 [‐0.75, 0.24] |
| 7 Behaviour ‐ externalising Show forest plot | 3 | 298 | Std. Mean Difference (IV, Random, 95% CI) | 0.28 [‐0.05, 0.60] |
| 7.1 Exposure | 1 | 77 | Std. Mean Difference (IV, Random, 95% CI) | 0.51 [0.04, 0.97] |
| 7.2 Narrative | 2 | 221 | Std. Mean Difference (IV, Random, 95% CI) | 0.17 [‐0.30, 0.64] |
| 8 Loss to follow‐up Show forest plot | 2 | 120 | Odds Ratio (M‐H, Random, 95% CI) | 0.45 [0.15, 1.32] |
| 8.1 CBT | 1 | 50 | Odds Ratio (M‐H, Random, 95% CI) | 0.29 [0.08, 1.09] |
| 8.2 Narrative | 1 | 70 | Odds Ratio (M‐H, Random, 95% CI) | 0.88 [0.17, 4.71] |
| Outcome or subgroup title | No. of studies | No. of participants | Statistical method | Effect size |
| 1 PTSD diagnosis Show forest plot | 2 | 160 | Odds Ratio (M‐H, Random, 95% CI) | 0.74 [0.29, 1.91] |
| 1.1 EMDR | 1 | 36 | Odds Ratio (M‐H, Random, 95% CI) | 1.0 [0.06, 17.33] |
| 1.2 Supportive therapy | 1 | 124 | Odds Ratio (M‐H, Random, 95% CI) | 0.71 [0.26, 1.95] |
| 2 PTSD total symptoms Show forest plot | 7 | 466 | Std. Mean Difference (IV, Random, 95% CI) | ‐0.24 [‐0.42, ‐0.05] |
| 2.1 EMDR | 2 | 62 | Std. Mean Difference (IV, Random, 95% CI) | 0.06 [‐0.44, 0.56] |
| 2.2 Play therapy | 1 | 26 | Std. Mean Difference (IV, Random, 95% CI) | 0.21 [‐0.56, 0.98] |
| 2.3 Supportive therapies | 4 | 378 | Std. Mean Difference (IV, Random, 95% CI) | ‐0.32 [‐0.53, ‐0.12] |
| 3 PTSD avoidance Show forest plot | 1 | Std. Mean Difference (IV, Random, 95% CI) | Totals not selected | |
| 3.1 Supportive therapy | 1 | Std. Mean Difference (IV, Random, 95% CI) | 0.0 [0.0, 0.0] | |
| 4 PTSD hyperarousal Show forest plot | 1 | Std. Mean Difference (IV, Random, 95% CI) | Totals not selected | |
| 4.1 Supportive therapy | 1 | Std. Mean Difference (IV, Random, 95% CI) | 0.0 [0.0, 0.0] | |
| 5 PTSD intrusion Show forest plot | 1 | Std. Mean Difference (IV, Random, 95% CI) | Totals not selected | |
| 5.1 Supportive therapy | 1 | Std. Mean Difference (IV, Random, 95% CI) | 0.0 [0.0, 0.0] | |
| 6 Anxiety total symptoms Show forest plot | 2 | Std. Mean Difference (IV, Random, 95% CI) | Subtotals only | |
| 6.1 Supportive therapy | 2 | 230 | Std. Mean Difference (IV, Random, 95% CI) | ‐0.48 [‐0.74, ‐0.22] |
| 7 Depression Show forest plot | 2 | Std. Mean Difference (IV, Random, 95% CI) | Subtotals only | |
| 7.1 Supportive therapy | 2 | 237 | Std. Mean Difference (IV, Random, 95% CI) | ‐0.14 [‐0.42, 0.14] |
| 8 Behaviour ‐ total Show forest plot | 3 | 182 | Std. Mean Difference (IV, Random, 95% CI) | 0.02 [‐0.27, 0.31] |
| 8.1 EMDR | 1 | 14 | Std. Mean Difference (IV, Random, 95% CI) | ‐0.44 [‐1.50, 0.63] |
| 8.2 Supportive therapy | 2 | 168 | Std. Mean Difference (IV, Random, 95% CI) | 0.05 [‐0.25, 0.36] |
| 9 Behaviour ‐ internalising Show forest plot | 3 | Std. Mean Difference (IV, Random, 95% CI) | Subtotals only | |
| 9.1 Supportive therapy | 3 | 235 | Std. Mean Difference (IV, Random, 95% CI) | ‐0.25 [‐0.79, 0.28] |
| 10 Behaviour ‐ externalising Show forest plot | 3 | Std. Mean Difference (IV, Random, 95% CI) | Subtotals only | |
| 10.1 Supportive therapy | 3 | 235 | Std. Mean Difference (IV, Random, 95% CI) | ‐0.31 [‐0.58, ‐0.05] |
| 11 Function Show forest plot | 1 | Std. Mean Difference (IV, Random, 95% CI) | Totals not selected | |
| 11.1 Supportive therapy | 1 | Std. Mean Difference (IV, Random, 95% CI) | 0.0 [0.0, 0.0] | |
| 12 Loss to follow‐up Show forest plot | 8 | 544 | Odds Ratio (M‐H, Random, 95% CI) | 0.69 [0.41, 1.18] |
| 12.1 EMDR | 2 | 64 | Odds Ratio (M‐H, Random, 95% CI) | 0.76 [0.23, 2.52] |
| 12.2 Play therapy | 1 | 31 | Odds Ratio (M‐H, Random, 95% CI) | 0.08 [0.00, 1.56] |
| 12.3 Supportive therapy | 5 | 449 | Odds Ratio (M‐H, Random, 95% CI) | 0.74 [0.38, 1.43] |
| Outcome or subgroup title | No. of studies | No. of participants | Statistical method | Effect size |
| 1 PTSD total symptoms Show forest plot | 2 | Std. Mean Difference (IV, Random, 95% CI) | Subtotals only | |
| 1.1 Supportive therapy | 2 | 223 | Std. Mean Difference (IV, Random, 95% CI) | ‐0.16 [‐0.43, 0.11] |
| 2 Anxiety total symptoms Show forest plot | 1 | Std. Mean Difference (IV, Random, 95% CI) | Totals not selected | |
| 2.1 Supportive therapy | 1 | Std. Mean Difference (IV, Random, 95% CI) | 0.0 [0.0, 0.0] | |
| 3 Depression Show forest plot | 1 | Std. Mean Difference (IV, Random, 95% CI) | Totals not selected | |
| 3.1 Supportive therapy | 1 | Std. Mean Difference (IV, Random, 95% CI) | 0.0 [0.0, 0.0] | |
| 4 Behaviour ‐ total Show forest plot | 1 | Std. Mean Difference (IV, Random, 95% CI) | Totals not selected | |
| 4.1 Supportive therapy | 1 | Std. Mean Difference (IV, Random, 95% CI) | 0.0 [0.0, 0.0] | |
| 5 Behaviour ‐ internalising Show forest plot | 2 | Std. Mean Difference (IV, Random, 95% CI) | Subtotals only | |
| 5.1 Supportive therapy | 2 | 178 | Std. Mean Difference (IV, Random, 95% CI) | ‐0.05 [‐0.36, 0.26] |
| 6 Behaviour ‐ externalising Show forest plot | 2 | Std. Mean Difference (IV, Random, 95% CI) | Subtotals only | |
| 6.1 Supportive therapy | 2 | 178 | Std. Mean Difference (IV, Random, 95% CI) | ‐0.06 [‐0.37, 0.25] |
| 7 Loss to follow‐up Show forest plot | 1 | Odds Ratio (M‐H, Random, 95% CI) | Totals not selected | |
| 7.1 Supportive therapy | 1 | Odds Ratio (M‐H, Random, 95% CI) | 0.0 [0.0, 0.0] | |
| Outcome or subgroup title | No. of studies | No. of participants | Statistical method | Effect size |
| 1 Behaviour ‐ internalising Show forest plot | 1 | Std. Mean Difference (IV, Random, 95% CI) | Totals not selected | |
| 1.1 Supportive therapy | 1 | Std. Mean Difference (IV, Random, 95% CI) | 0.0 [0.0, 0.0] | |
| 2 Behaviour ‐ externalising Show forest plot | 1 | Std. Mean Difference (IV, Random, 95% CI) | Totals not selected | |
| 2.1 Supportive therapy | 1 | Std. Mean Difference (IV, Random, 95% CI) | 0.0 [0.0, 0.0] | |
| 3 Loss to follow‐up Show forest plot | 1 | Odds Ratio (M‐H, Random, 95% CI) | Totals not selected | |
| 3.1 Supportive therapy | 1 | Odds Ratio (M‐H, Random, 95% CI) | 0.0 [0.0, 0.0] | |
| Outcome or subgroup title | No. of studies | No. of participants | Statistical method | Effect size |
| 1 PTSD total symptoms Show forest plot | 1 | Std. Mean Difference (IV, Random, 95% CI) | Totals not selected | |
| 1.1 Short‐term | 1 | Std. Mean Difference (IV, Random, 95% CI) | 0.0 [0.0, 0.0] | |
| 1.2 Medium‐term | 1 | Std. Mean Difference (IV, Random, 95% CI) | 0.0 [0.0, 0.0] | |
| 1.3 Long‐term | 1 | Std. Mean Difference (IV, Random, 95% CI) | 0.0 [0.0, 0.0] | |
| Outcome or subgroup title | No. of studies | No. of participants | Statistical method | Effect size |
| 1 PTSD diagnosis Show forest plot | 6 | Odds Ratio (M‐H, Random, 95% CI) | Subtotals only | |
| 1.1 Community violence | 3 | 769 | Odds Ratio (M‐H, Random, 95% CI) | 0.59 [0.43, 0.80] |
| 1.2 Interpersonal violence | 1 | 65 | Odds Ratio (M‐H, Random, 95% CI) | 0.11 [0.02, 0.56] |
| 1.3 Natural disaster | 1 | 166 | Odds Ratio (M‐H, Random, 95% CI) | 0.16 [0.06, 0.45] |
| 1.4 Physical trauma | 1 | 132 | Odds Ratio (M‐H, Random, 95% CI) | 1.31 [0.47, 3.68] |
| 2 PTSD total symptoms Show forest plot | 18 | Std. Mean Difference (IV, Random, 95% CI) | Subtotals only | |
| 2.1 Community violence | 8 | 2170 | Std. Mean Difference (IV, Random, 95% CI) | ‐0.24 [‐0.41, ‐0.06] |
| 2.2 Interpersonal violence | 1 | 65 | Std. Mean Difference (IV, Random, 95% CI) | ‐0.61 [‐1.11, ‐0.11] |
| 2.3 Life‐threatening illness | 1 | 111 | Std. Mean Difference (IV, Random, 95% CI) | ‐0.12 [‐0.50, 0.26] |
| 2.4 Maltreatment | 1 | 142 | Std. Mean Difference (IV, Random, 95% CI) | ‐0.12 [‐0.45, 0.21] |
| 2.5 Natural disaster | 1 | 166 | Std. Mean Difference (IV, Random, 95% CI) | ‐1.27 [‐1.60, ‐0.94] |
| 2.6 Physical trauma | 4 | 311 | Std. Mean Difference (IV, Random, 95% CI) | ‐0.02 [‐0.29, 0.26] |
| 2.7 Sexual abuse | 2 | 76 | Std. Mean Difference (IV, Random, 95% CI) | ‐0.67 [‐1.18, ‐0.16] |
| Outcome or subgroup title | No. of studies | No. of participants | Statistical method | Effect size |
| 1 PTSD diagnosis Show forest plot | 7 | Odds Ratio (M‐H, Random, 95% CI) | Subtotals only | |
| 1.1 Symptoms not stated | 5 | 999 | Odds Ratio (M‐H, Random, 95% CI) | 0.41 [0.20, 0.83] |
| 1.2 Symptomatic | 2 | 197 | Odds Ratio (M‐H, Random, 95% CI) | 0.64 [0.32, 1.25] |
| 2 PTSD total symptoms Show forest plot | 21 | Std. Mean Difference (IV, Random, 95% CI) | Subtotals only | |
| 2.1 Symptoms not stated | 12 | 1648 | Std. Mean Difference (IV, Random, 95% CI) | ‐0.41 [‐0.68, ‐0.13] |
| 2.2 Symptomatic | 9 | 1639 | Std. Mean Difference (IV, Random, 95% CI) | ‐0.30 [‐0.53, ‐0.06] |
| Outcome or subgroup title | No. of studies | No. of participants | Statistical method | Effect size |
| 1 PTSD diagnosis Show forest plot | 7 | Odds Ratio (M‐H, Random, 95% CI) | Subtotals only | |
| 1.1 Inactive control | 5 | 1067 | Odds Ratio (M‐H, Random, 95% CI) | 0.53 [0.32, 0.88] |
| 1.2 Active control | 2 | 129 | Odds Ratio (M‐H, Random, 95% CI) | 0.23 [0.05, 1.14] |
| 2 PTSD total symptoms Show forest plot | 21 | Std. Mean Difference (IV, Random, 95% CI) | Subtotals only | |
| 2.1 Inactive control | 15 | 2856 | Std. Mean Difference (IV, Random, 95% CI) | ‐0.40 [‐0.61, ‐0.19] |
| 2.2 Active control | 6 | 431 | Std. Mean Difference (IV, Random, 95% CI) | ‐0.25 [‐0.58, 0.09] |
| Outcome or subgroup title | No. of studies | No. of participants | Statistical method | Effect size |
| 1 PTSD diagnosis Show forest plot | 7 | Odds Ratio (M‐H, Random, 95% CI) | Subtotals only | |
| 1.1 Best case | 7 | 1282 | Odds Ratio (M‐H, Random, 95% CI) | 0.52 [0.28, 0.99] |
| 1.2 Worst case | 7 | 1252 | Odds Ratio (M‐H, Random, 95% CI) | 0.64 [0.42, 0.98] |
| Outcome or subgroup title | No. of studies | No. of participants | Statistical method | Effect size |
| 1 PTSD diagnosis Show forest plot | 7 | Odds Ratio (M‐H, Random, 95% CI) | Subtotals only | |
| 1.1 Cluster‐randomised | 4 | 935 | Odds Ratio (M‐H, Random, 95% CI) | 0.46 [0.27, 0.76] |
| 1.2 Individuals randomised | 3 | 261 | Odds Ratio (M‐H, Random, 95% CI) | 0.47 [0.10, 2.19] |
| 2 PTSD total symptoms Show forest plot | 20 | Std. Mean Difference (IV, Random, 95% CI) | Subtotals only | |
| 2.1 Cluster‐randomised | 7 | 2063 | Std. Mean Difference (IV, Random, 95% CI) | ‐0.40 [‐0.71, ‐0.10] |
| 2.2 Individuals randomised | 13 | 1172 | Std. Mean Difference (IV, Random, 95% CI) | ‐0.22 [‐0.38, ‐0.06] |
| Outcome or subgroup title | No. of studies | No. of participants | Statistical method | Effect size |
| 1 PTSD diagnosis Show forest plot | 7 | Odds Ratio (M‐H, Random, 95% CI) | Subtotals only | |
| 1.1 Unclear risk | 1 | 64 | Odds Ratio (M‐H, Random, 95% CI) | 0.56 [0.09, 3.62] |
| 1.2 High risk | 6 | 1132 | Odds Ratio (M‐H, Random, 95% CI) | 0.46 [0.27, 0.79] |
| 2 PTSD total symptoms Show forest plot | 21 | Std. Mean Difference (IV, Random, 95% CI) | Subtotals only | |
| 2.1 Unclear risk | 1 | 64 | Std. Mean Difference (IV, Random, 95% CI) | 0.23 [‐0.26, 0.72] |
| 2.2 High risk | 20 | 3223 | Std. Mean Difference (IV, Random, 95% CI) | ‐0.39 [‐0.57, ‐0.20] |
| Outcome or subgroup title | No. of studies | No. of participants | Statistical method | Effect size |
| 1 PTSD diagnosis Show forest plot | 7 | Odds Ratio (M‐H, Random, 95% CI) | Subtotals only | |
| 1.1 Low risk | 2 | 197 | Odds Ratio (M‐H, Random, 95% CI) | 0.41 [0.04, 4.68] |
| 1.2 Unclear risk | 1 | 64 | Odds Ratio (M‐H, Random, 95% CI) | 0.56 [0.09, 3.62] |
| 1.3 High risk | 4 | 935 | Odds Ratio (M‐H, Random, 95% CI) | 0.46 [0.27, 0.76] |
| 2 PTSD total symptoms Show forest plot | 21 | Std. Mean Difference (IV, Random, 95% CI) | Subtotals only | |
| 2.1 Low risk | 1 | 132 | Std. Mean Difference (IV, Random, 95% CI) | ‐0.05 [‐0.39, 0.30] |
| 2.2 Unclear risk | 2 | 191 | Std. Mean Difference (IV, Random, 95% CI) | ‐0.03 [‐0.46, 0.40] |
| 2.3 High risk | 18 | 2964 | Std. Mean Difference (IV, Random, 95% CI) | ‐0.42 [‐0.62, ‐0.22] |
| Outcome or subgroup title | No. of studies | No. of participants | Statistical method | Effect size |
| 1 PTSD diagnosis Show forest plot | 7 | Odds Ratio (M‐H, Random, 95% CI) | Subtotals only | |
| 1.1 Low risk | 2 | 320 | Odds Ratio (M‐H, Random, 95% CI) | 0.27 [0.11, 0.65] |
| 1.2 Unclear risk | 3 | 329 | Odds Ratio (M‐H, Random, 95% CI) | 0.79 [0.45, 1.38] |
| 1.3 High risk | 2 | 547 | Odds Ratio (M‐H, Random, 95% CI) | 0.32 [0.06, 1.60] |
| 2 PTSD total symptoms Show forest plot | 21 | Std. Mean Difference (IV, Random, 95% CI) | Subtotals only | |
| 2.1 Low risk | 7 | 1410 | Std. Mean Difference (IV, Random, 95% CI) | ‐0.38 [‐0.75, ‐0.01] |
| 2.2 Unclear risk | 9 | 1046 | Std. Mean Difference (IV, Random, 95% CI) | ‐0.36 [‐0.67, ‐0.05] |
| 2.3 High risk | 5 | 831 | Std. Mean Difference (IV, Random, 95% CI) | ‐0.30 [‐0.53, ‐0.06] |
| Outcome or subgroup title | No. of studies | No. of participants | Statistical method | Effect size |
| 1 PTSD diagnosis Show forest plot | 7 | Odds Ratio (M‐H, Random, 95% CI) | Subtotals only | |
| 1.1 Low risk | 4 | 516 | Odds Ratio (M‐H, Random, 95% CI) | 0.46 [0.18, 1.15] |
| 1.2 Unclear risk | 2 | 547 | Odds Ratio (M‐H, Random, 95% CI) | 0.32 [0.06, 1.60] |
| 1.3 High risk | 1 | 133 | Odds Ratio (M‐H, Random, 95% CI) | 0.65 [0.32, 1.33] |
| 2 PTSD total symptoms Show forest plot | 21 | Std. Mean Difference (IV, Random, 95% CI) | Subtotals only | |
| 2.1 Low risk | 8 | 874 | Std. Mean Difference (IV, Random, 95% CI) | ‐0.57 [‐0.97, ‐0.17] |
| 2.2 Unclear risk | 13 | 2413 | Std. Mean Difference (IV, Random, 95% CI) | ‐0.22 [‐0.39, ‐0.06] |