Terapias psicológicas para niños y adolescentes expuestos a traumas
Información
- DOI:
- https://doi.org/10.1002/14651858.CD012371Copiar DOI

- Base de datos:
-
- Cochrane Database of Systematic Reviews
- Versión publicada:
-
- 11 octubre 2016see what's new
- Tipo:
-
- Intervention
- Etapa:
-
- Review
- Grupo Editorial Cochrane:
-
Grupo Cochrane de Trastornos mentales comunes
- Copyright:
-
- Copyright © 2016 The Cochrane Collaboration. Published by John Wiley & Sons, Ltd.
Cifras del artículo
Altmetric:
Citado por:
Autores
Contributions of authors
Donna Gillies ‐ review co‐ordination, study selection, data extraction, data entry and analysis, writing of the review.
Licia Maiocchi ‐ data extraction, data analysis.
Abhishta P. Bhandari ‐ study selection, data extraction.
Fiona Taylor ‐ study selection, data extraction.
Carl Gray ‐ data extraction.
Louise O'Brien ‐ data extraction.
Sources of support
Internal sources
-
Sydney West Area Health Service, Australia.
-
The University of Western Sydney, Australia.
External sources
-
No sources of support supplied
Declarations of interest
None known.
Acknowledgements
Pam Withey (Rogers) and Charles Meekings, co‐authors of the protocol for the original review (Gillies 2007).
CRG Funding Acknowledgement:
The National Institute for Health Research (NIHR) is the largest single funder of the Cochrane Common Mental Disorders Group.
Disclaimer:
The views and opinions expressed herein are those of the review authors and do not necessarily reflect those of the NIHR, the NHS or the Department of Health.
Version history
| Published | Title | Stage | Authors | Version |
| 2016 Oct 11 | Psychological therapies for children and adolescents exposed to trauma | Review | Donna Gillies, Licia Maiocchi, Abhishta P Bhandari, Fiona Taylor, Carl Gray, Louise O'Brien | |
Differences between protocol and review
Trauma exposure
It was proposed for prevention studies that we include only trials in which children or adolescents had been exposed to a traumatic event within a year before initiation of therapy. However, as time since exposure to trauma was not an inclusion/exclusion criterion in any included trials, the review authors decided to include all studies that met all other inclusion criteria.
Quality criteria
We stated in the protocol the intention to collect the following quality criteria. We collected these, but we updated the headings for quality criteria for consistency with quality criteria headings provided in the 'Risk of bias' table.
-
Adequate allocation concealment and sequence generation.
-
Clear inclusion and exclusion criteria.
-
No potential confounding variables.
-
Intention‐to‐treat analysis.
-
< 25% loss to follow‐up.
-
Blinded outcome assessment.
Skewed data
In the protocol, it was stated that "if the standard deviation multiplied by two was greater than the mean it will not be added to the meta‐analysis", but this was updated to comply with the Cochrane Handbook for Systematic Reviews of Interventions (Higgins 2008) (i.e. for a scale that starts from zero, a standard deviation greater than half the mean suggests skew, but a standard deviation greater than the mean is considered strong evidence of a skewed distribution). Therefore, if the standard deviation was greater than the mean for both groups, these data were not included in a meta‐analysis.
Best‐case/Worst‐case analyses
It was initially proposed that in best‐case and worst‐case analyses of primary binary outcomes, early departure of people from the study was considered to have had a negative effect in the treatment group and no negative effect in the control group (worst‐case scenario), or no negative effect in the treatment group and a negative effect in the control group (best‐case scenario). However, we considered it more appropriate that people from both groups would have left for the same reason; therefore, for worst‐case, we have considered that all people lost to follow‐up had the negative outcome (i.e. a diagnosis of PTSD), and for best‐case analysis, all those lost to follow‐up were considered not diagnosed with PTSD.
Keywords
MeSH
Medical Subject Headings (MeSH) Keywords
- Aggression [psychology];
- Child Abuse, Sexual [psychology];
- Cognitive Behavioral Therapy;
- Desensitization, Psychologic;
- Exposure to Violence [psychology];
- Family Therapy;
- Interview, Psychological;
- Psychotherapy [*methods];
- Psychotherapy, Psychodynamic;
- Randomized Controlled Trials as Topic;
- Stress Disorders, Post-Traumatic [*prevention & control, psychology];
- Treatment Outcome;
- War Exposure;
Medical Subject Headings Check Words
Adolescent; Child; Child, Preschool; Humans; Young Adult;
PICO
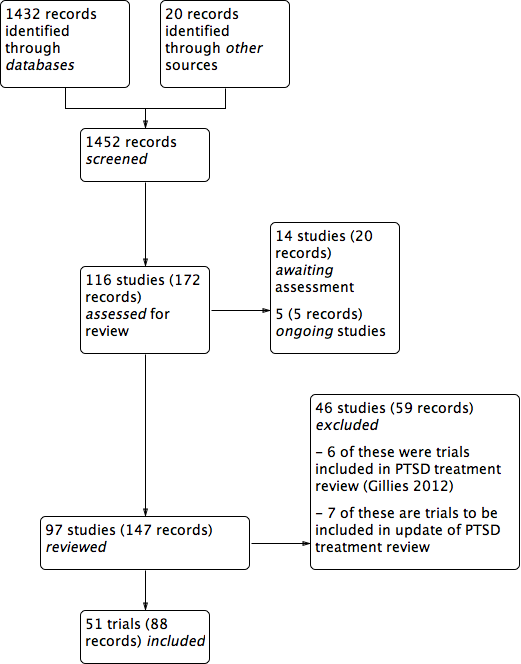
PRISMA study flow diagram.
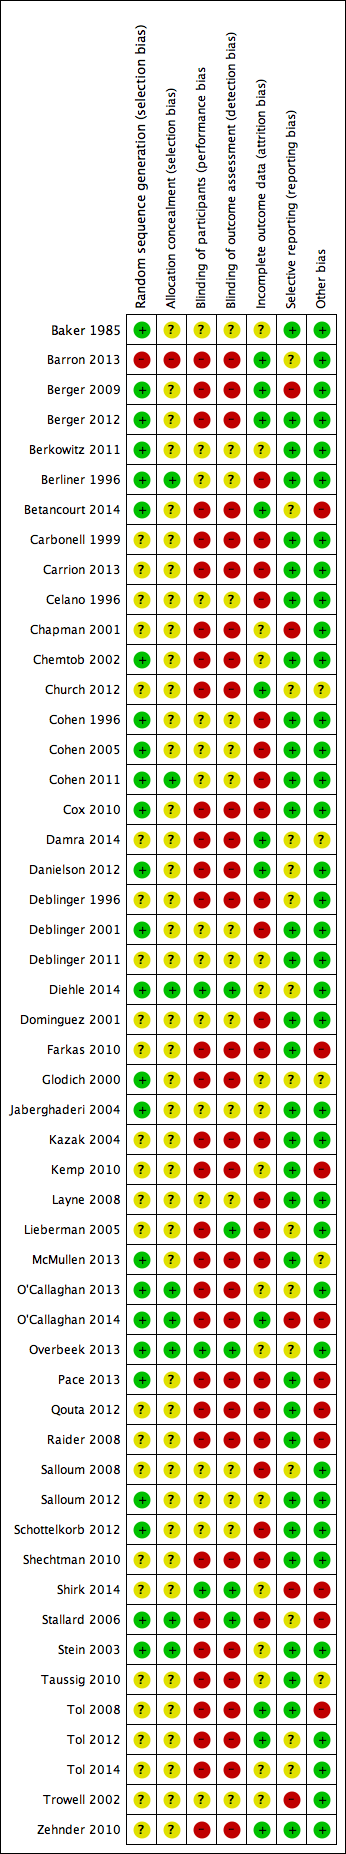
Risk of bias summary: review authors' judgements about each risk of bias item for each included study.
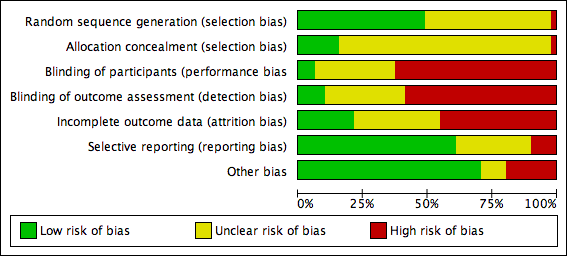
Risk of bias graph: review authors' judgements about each risk of bias item presented as percentages across all included studies.

Funnel plot of comparison: 1 All psychotherapies versus control (short‐term), outcome: 1.2 PTSD total symptoms.

Comparison 1 All psychotherapies versus control (short‐term), Outcome 1 PTSD diagnosis.

Comparison 1 All psychotherapies versus control (short‐term), Outcome 2 PTSD total symptoms.

Comparison 1 All psychotherapies versus control (short‐term), Outcome 3 PTSD avoidance.

Comparison 1 All psychotherapies versus control (short‐term), Outcome 4 PTSD hyperarousal.

Comparison 1 All psychotherapies versus control (short‐term), Outcome 5 PTSD intrusion.

Comparison 1 All psychotherapies versus control (short‐term), Outcome 6 Anxiety total symptoms.
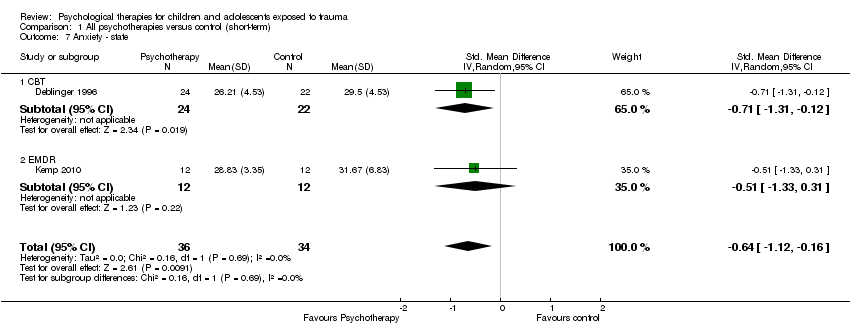
Comparison 1 All psychotherapies versus control (short‐term), Outcome 7 Anxiety ‐ state.

Comparison 1 All psychotherapies versus control (short‐term), Outcome 8 Anxiety ‐ trait.
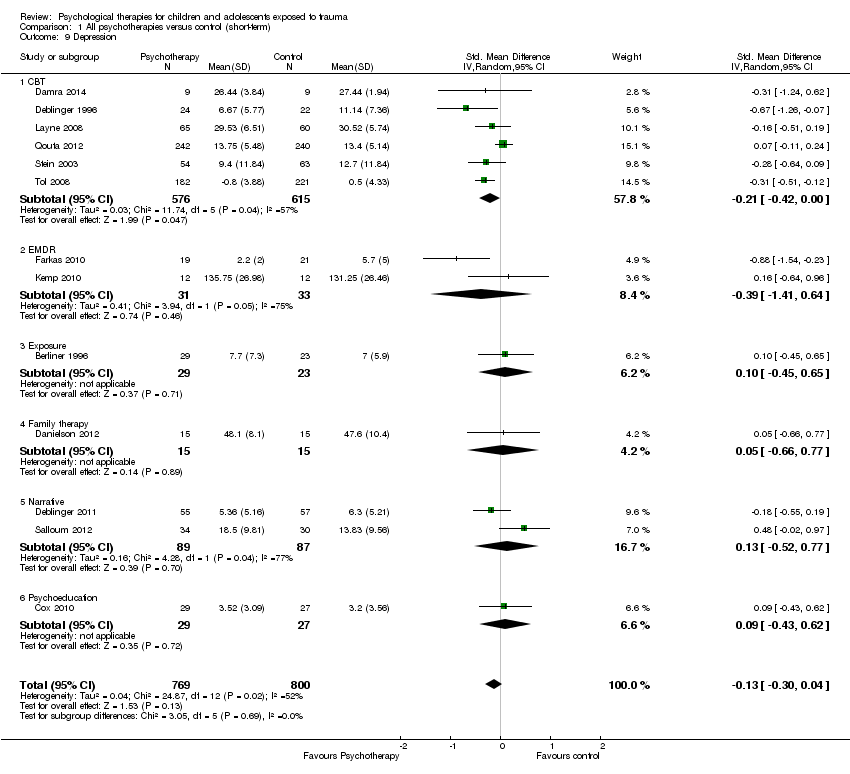
Comparison 1 All psychotherapies versus control (short‐term), Outcome 9 Depression.

Comparison 1 All psychotherapies versus control (short‐term), Outcome 10 Behaviour ‐ total.

Comparison 1 All psychotherapies versus control (short‐term), Outcome 11 Behaviour ‐ internalising.

Comparison 1 All psychotherapies versus control (short‐term), Outcome 12 Behaviour ‐ externalising.
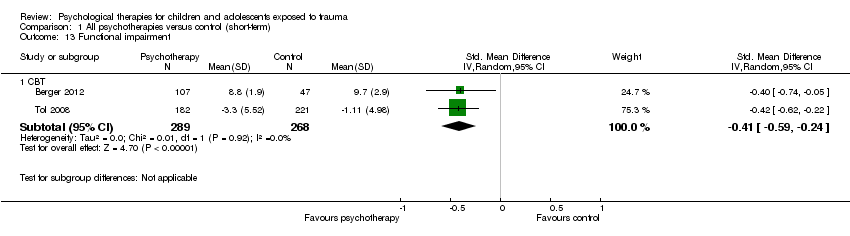
Comparison 1 All psychotherapies versus control (short‐term), Outcome 13 Functional impairment.

Comparison 1 All psychotherapies versus control (short‐term), Outcome 14 Quality of life.
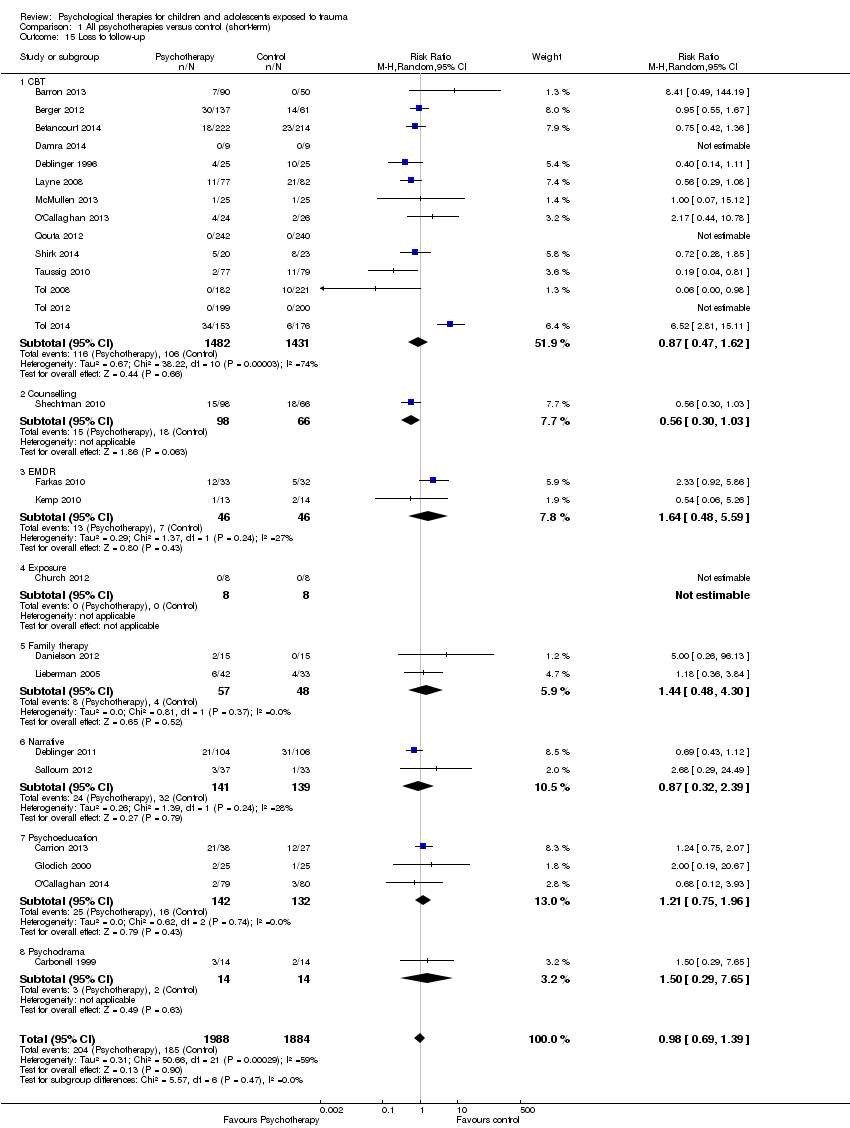
Comparison 1 All psychotherapies versus control (short‐term), Outcome 15 Loss to follow‐up.

Comparison 2 All psychotherapies versus control (medium‐term), Outcome 1 PTSD diagnosis.

Comparison 2 All psychotherapies versus control (medium‐term), Outcome 2 PTSD total symptoms.

Comparison 2 All psychotherapies versus control (medium‐term), Outcome 3 PTSD ‐ avoidance.

Comparison 2 All psychotherapies versus control (medium‐term), Outcome 4 PTSD ‐ hyperarousal.
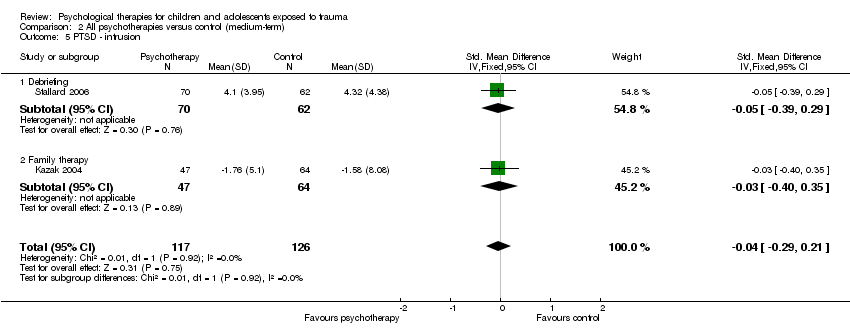
Comparison 2 All psychotherapies versus control (medium‐term), Outcome 5 PTSD ‐ intrusion.

Comparison 2 All psychotherapies versus control (medium‐term), Outcome 6 Anxiety total symptoms.

Comparison 2 All psychotherapies versus control (medium‐term), Outcome 7 Anxiety ‐ state.

Comparison 2 All psychotherapies versus control (medium‐term), Outcome 8 Anxiety ‐ trait.

Comparison 2 All psychotherapies versus control (medium‐term), Outcome 9 Depression.

Comparison 2 All psychotherapies versus control (medium‐term), Outcome 10 Behaviour ‐ total.
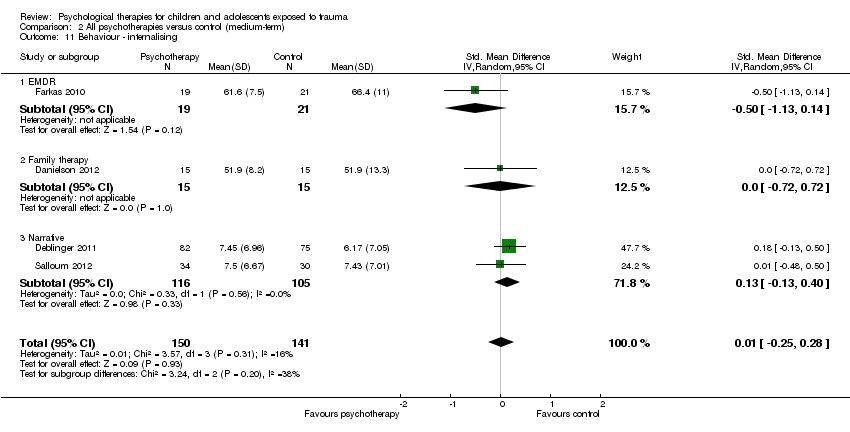
Comparison 2 All psychotherapies versus control (medium‐term), Outcome 11 Behaviour ‐ internalising.

Comparison 2 All psychotherapies versus control (medium‐term), Outcome 12 Behaviour ‐ externalising.

Comparison 2 All psychotherapies versus control (medium‐term), Outcome 13 Function.

Comparison 2 All psychotherapies versus control (medium‐term), Outcome 14 Quality of life.

Comparison 2 All psychotherapies versus control (medium‐term), Outcome 15 Loss to follow‐up.

Comparison 3 All psychotherapies versus control (long‐term), Outcome 1 PTSD diagnosis.

Comparison 3 All psychotherapies versus control (long‐term), Outcome 2 PTSD total symptoms.

Comparison 3 All psychotherapies versus control (long‐term), Outcome 3 Anxiety.

Comparison 3 All psychotherapies versus control (long‐term), Outcome 4 Depression.

Comparison 3 All psychotherapies versus control (long‐term), Outcome 5 Behaviour ‐ total.

Comparison 3 All psychotherapies versus control (long‐term), Outcome 6 Behaviour ‐ internalising.
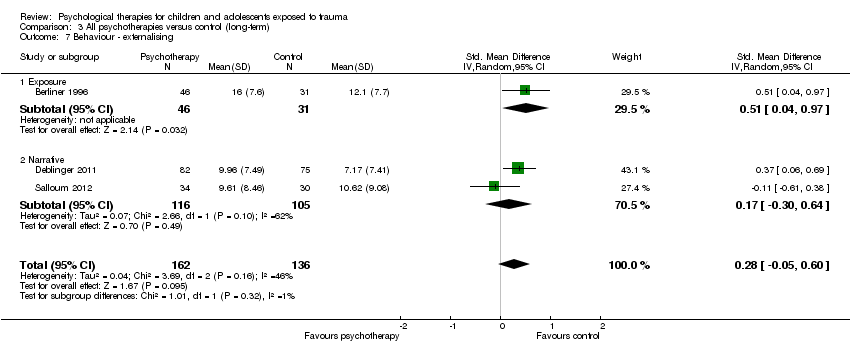
Comparison 3 All psychotherapies versus control (long‐term), Outcome 7 Behaviour ‐ externalising.
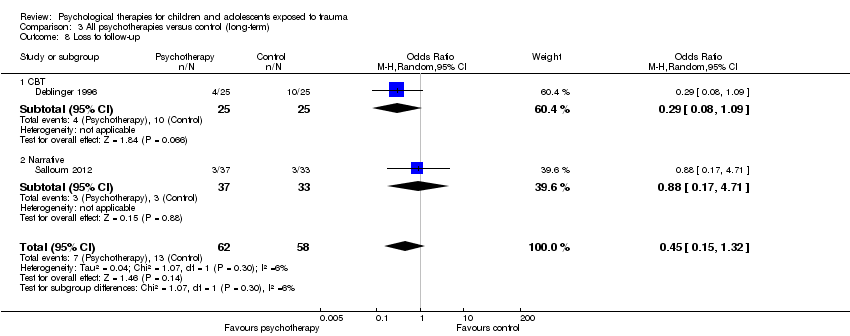
Comparison 3 All psychotherapies versus control (long‐term), Outcome 8 Loss to follow‐up.
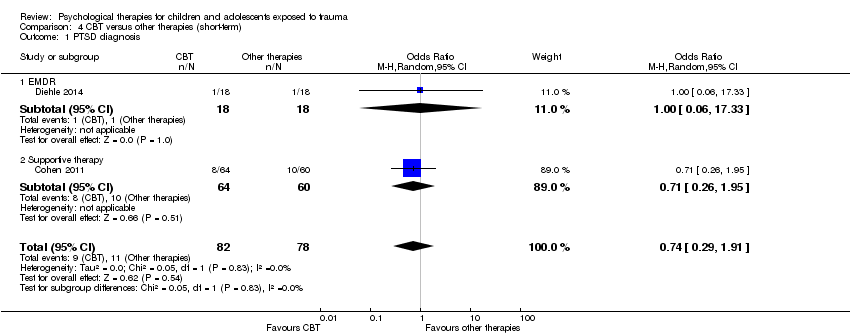
Comparison 4 CBT versus other therapies (short‐term), Outcome 1 PTSD diagnosis.
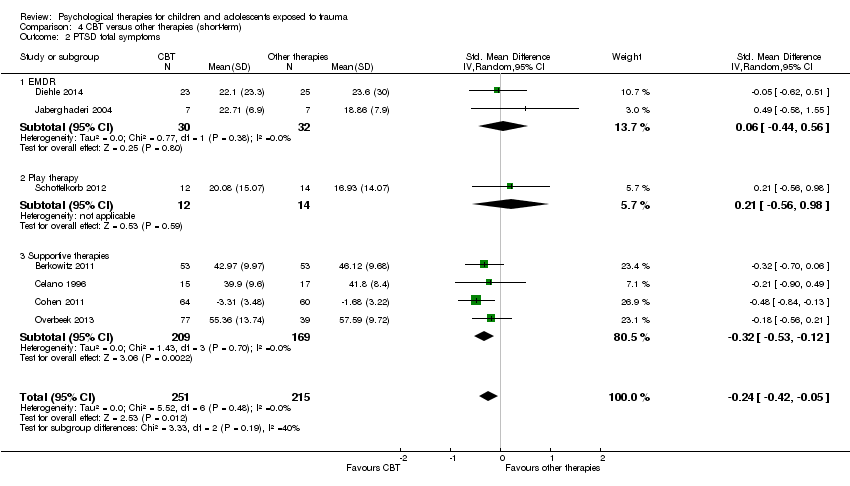
Comparison 4 CBT versus other therapies (short‐term), Outcome 2 PTSD total symptoms.

Comparison 4 CBT versus other therapies (short‐term), Outcome 3 PTSD avoidance.

Comparison 4 CBT versus other therapies (short‐term), Outcome 4 PTSD hyperarousal.
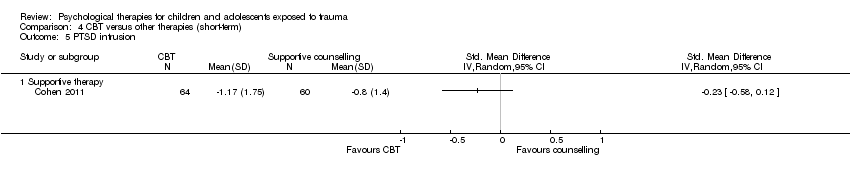
Comparison 4 CBT versus other therapies (short‐term), Outcome 5 PTSD intrusion.

Comparison 4 CBT versus other therapies (short‐term), Outcome 6 Anxiety total symptoms.

Comparison 4 CBT versus other therapies (short‐term), Outcome 7 Depression.

Comparison 4 CBT versus other therapies (short‐term), Outcome 8 Behaviour ‐ total.
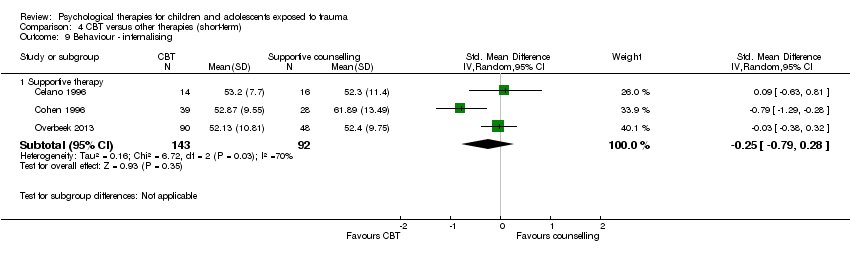
Comparison 4 CBT versus other therapies (short‐term), Outcome 9 Behaviour ‐ internalising.

Comparison 4 CBT versus other therapies (short‐term), Outcome 10 Behaviour ‐ externalising.

Comparison 4 CBT versus other therapies (short‐term), Outcome 11 Function.

Comparison 4 CBT versus other therapies (short‐term), Outcome 12 Loss to follow‐up.
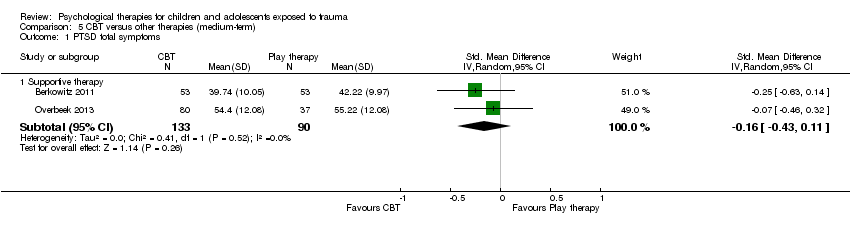
Comparison 5 CBT versus other therapies (medium‐term), Outcome 1 PTSD total symptoms.

Comparison 5 CBT versus other therapies (medium‐term), Outcome 2 Anxiety total symptoms.

Comparison 5 CBT versus other therapies (medium‐term), Outcome 3 Depression.

Comparison 5 CBT versus other therapies (medium‐term), Outcome 4 Behaviour ‐ total.

Comparison 5 CBT versus other therapies (medium‐term), Outcome 5 Behaviour ‐ internalising.

Comparison 5 CBT versus other therapies (medium‐term), Outcome 6 Behaviour ‐ externalising.
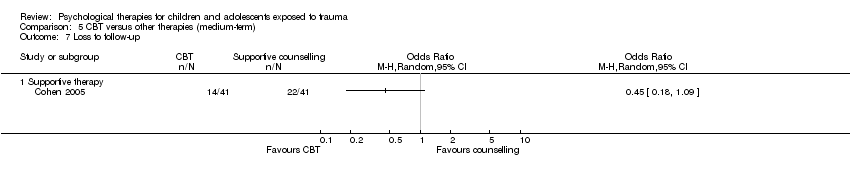
Comparison 5 CBT versus other therapies (medium‐term), Outcome 7 Loss to follow‐up.
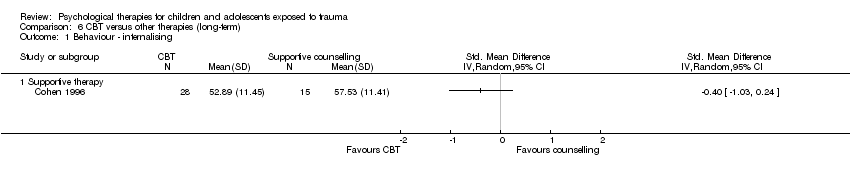
Comparison 6 CBT versus other therapies (long‐term), Outcome 1 Behaviour ‐ internalising.

Comparison 6 CBT versus other therapies (long‐term), Outcome 2 Behaviour ‐ externalising.
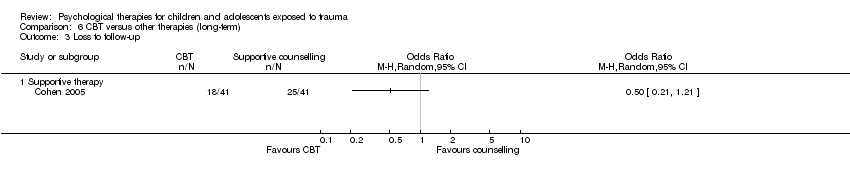
Comparison 6 CBT versus other therapies (long‐term), Outcome 3 Loss to follow‐up.
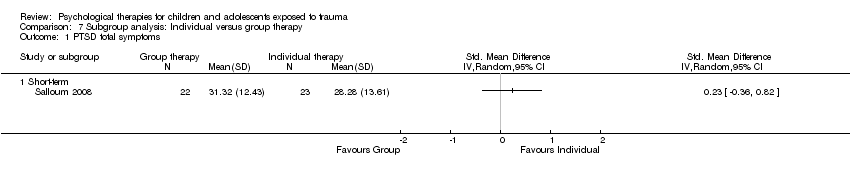
Comparison 7 Subgroup analysis: Individual versus group therapy, Outcome 1 PTSD total symptoms.

Comparison 8 Subgroup analysis: Child versus mother and child therapy, Outcome 1 PTSD total symptoms.
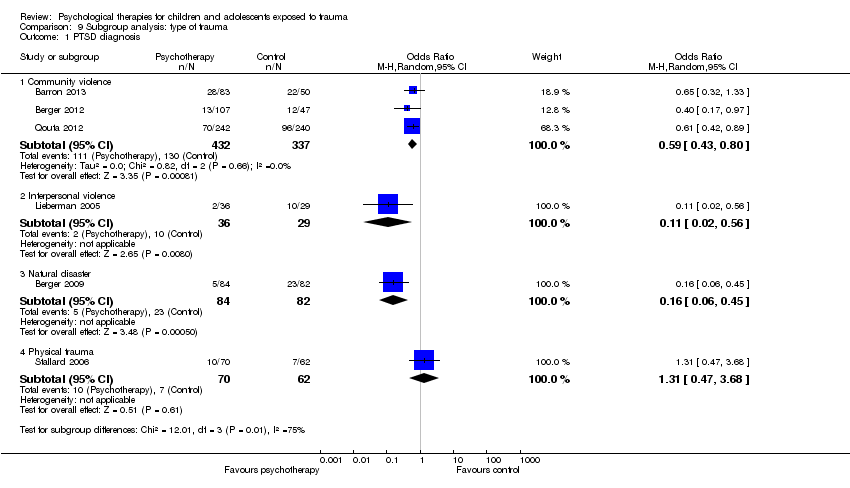
Comparison 9 Subgroup analysis: type of trauma, Outcome 1 PTSD diagnosis.
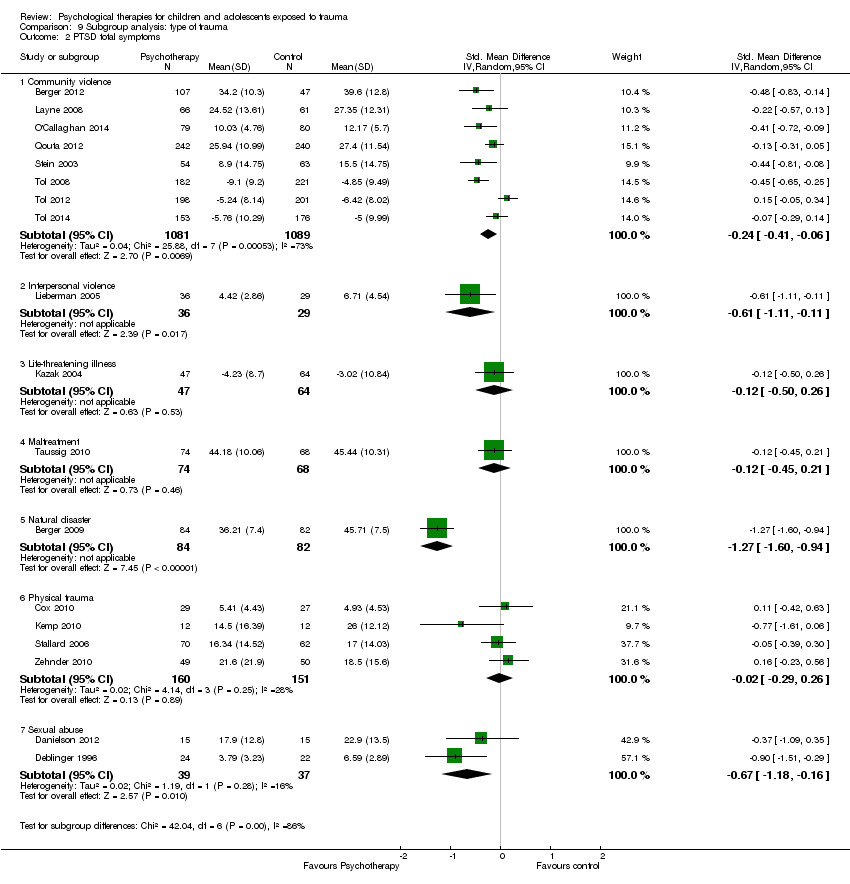
Comparison 9 Subgroup analysis: type of trauma, Outcome 2 PTSD total symptoms.

Comparison 10 Subgroup analysis: symptomatic participants, Outcome 1 PTSD diagnosis.

Comparison 10 Subgroup analysis: symptomatic participants, Outcome 2 PTSD total symptoms.

Comparison 11 Sensitivity analysis: type of control, Outcome 1 PTSD diagnosis.

Comparison 11 Sensitivity analysis: type of control, Outcome 2 PTSD total symptoms.

Comparison 12 Sensitivity analysis: best‐/worst‐case analysis, Outcome 1 PTSD diagnosis.

Comparison 13 Sensitivity analysis: cluster‐randomisation, Outcome 1 PTSD diagnosis.
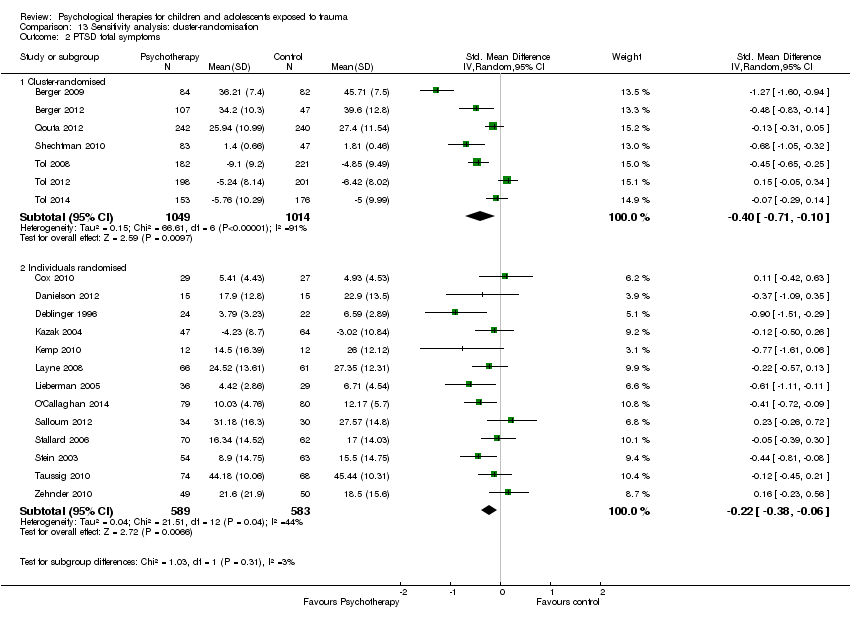
Comparison 13 Sensitivity analysis: cluster‐randomisation, Outcome 2 PTSD total symptoms.

Comparison 14 Sensitivity analysis: performance bias, Outcome 1 PTSD diagnosis.
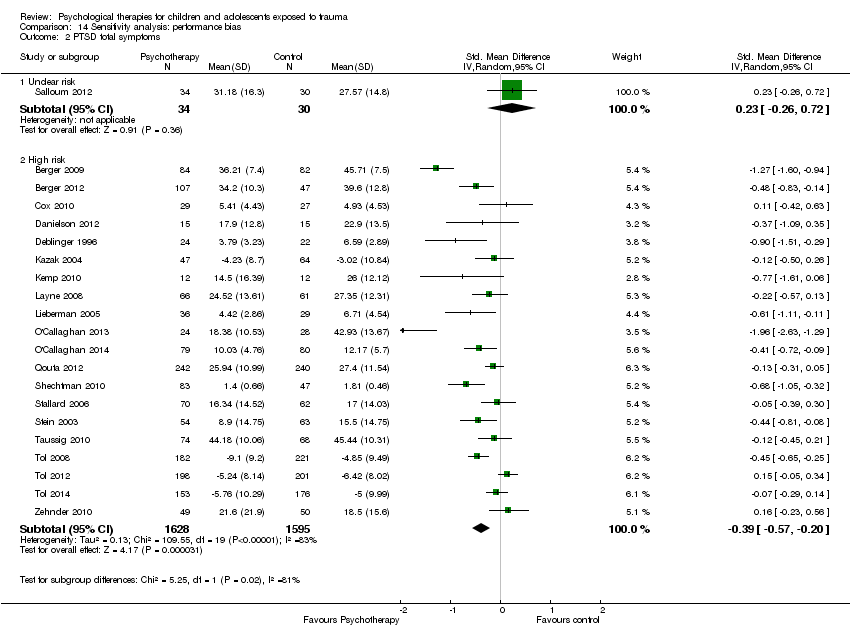
Comparison 14 Sensitivity analysis: performance bias, Outcome 2 PTSD total symptoms.

Comparison 15 Sensitivity analysis: detection bias, Outcome 1 PTSD diagnosis.

Comparison 15 Sensitivity analysis: detection bias, Outcome 2 PTSD total symptoms.

Comparison 16 Sensitivity analysis: attrition bias, Outcome 1 PTSD diagnosis.
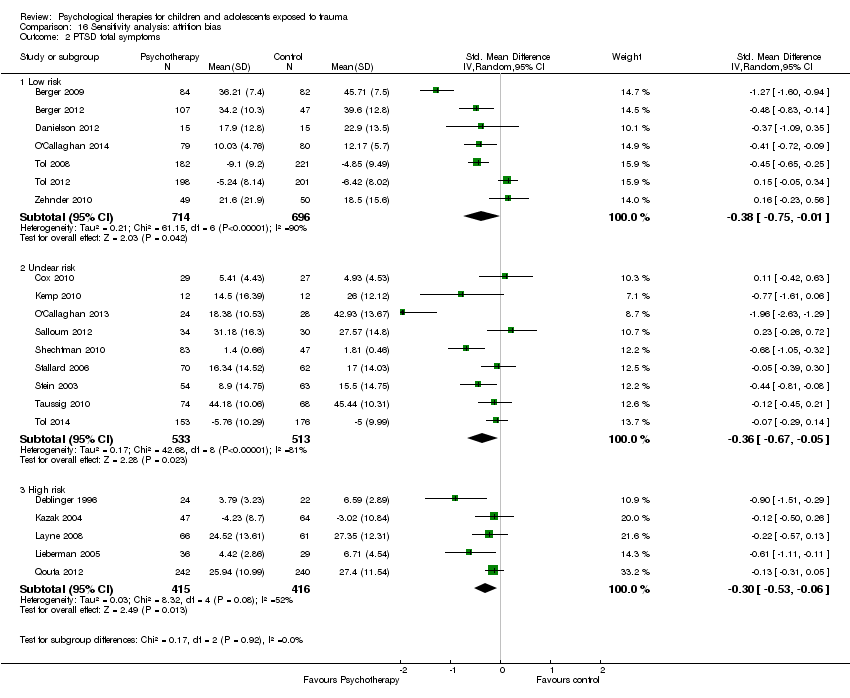
Comparison 16 Sensitivity analysis: attrition bias, Outcome 2 PTSD total symptoms.

Comparison 17 Sensitivity analysis: selection bias, Outcome 1 PTSD diagnosis.
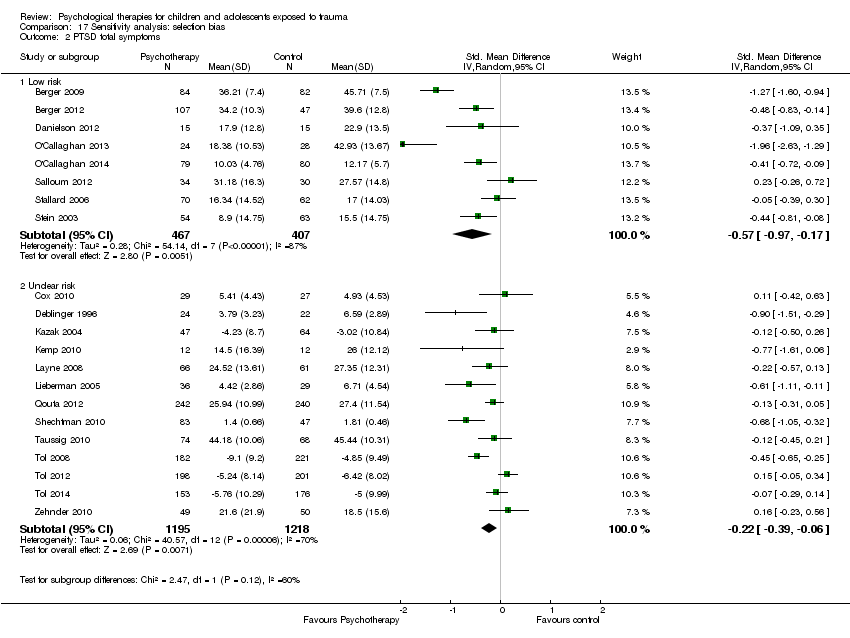
Comparison 17 Sensitivity analysis: selection bias, Outcome 2 PTSD total symptoms.
| Patient or population: children and adolescents exposed to trauma | ||||||
| Outcomes | Anticipated absolute effects* (95% CI) | Relative effect | Number of participants | Quality of the evidence | Comments | |
| Risk with control (short‐term) | Risk with all psychotherapies | |||||
| PTSD diagnosis | Study population | OR 0.51 | 874 | ⊕⊝⊝⊝ | ||
| 367 per 1000 | 228 per 1000 | |||||
| Moderate | ||||||
| 345 per 1000 | 212 per 1000 | |||||
| PTSD total symptoms | Mean PTSD total symptoms in the intervention group 0.42 standard deviations undefined fewer (0.61 fewer to 0.24 fewer) | Moderate effect size | 2051 | ⊕⊕⊝⊝ | ||
| *The risk in the intervention group (and its 95% confidence interval) is based on assumed risk in the comparison group and relative effect of the intervention (and its 95% CI) | ||||||
| GRADE Working Group grades of evidence | ||||||
| aParticipants are likely to have been aware of whether they received the active or inactive intervention in all studies, and diagnosis was based on self reported measures in 2 studies dParticipants were likely to have been aware of whether they received active or inactive intervention in all but one study, and scores were based on self reported measures in 10 studies eSubstantial heterogeneity between different types of psychological therapy (I2 = 71%) | ||||||
| Patient or population: children and adolescents exposed to trauma | ||||||
| Outcomes | Anticipated absolute effects* (95% CI) | Relative effect | Numer of participants | Quality of the evidence | Comments | |
| Risk with other therapies (short‐term) | Risk with CBT | |||||
| PTSD diagnosis | Study population | OR 0.74 | 160 | ⊕⊝⊝⊝ | ||
| 141 per 1000 | 108 per 1000 | |||||
| Moderate | ||||||
| 111 per 1000 | 85 per 1000 | |||||
| PTSD total symptoms | Mean PTSD total symptoms in the intervention group 0.24 standard deviations undefined fewer (0.42 fewer to 0.05 fewer) | Small effect size | 466 | ⊕⊕⊕⊝ | ||
| *The risk in the intervention group (and its 95% confidence interval) is based on assumed risk in the comparison group and relative effect of the intervention (and its 95% CI) | ||||||
| GRADE Working Group grades of evidence | ||||||
| aParticipants are likely to have been aware of whether they received active or inactive intervention in both studies, and diagnosis was based on self reported measures in both cParticipants are likely to have been aware of whether they received active or inactive intervention in all studies, and scores were based on self reported measures in 4 studies | ||||||
| Outcome | Group | n | Mean | SD |
| PTSD symptoms One month | Exposure therapy | 8 | 3.38 | 2.60 |
| Control | 8 | 31.38 | 3.84 | |
| Avoidance One month | Exposure therapy | 8 | 2.88 | 2.62 |
| Control | 8 | 20.25 | 2.38 | |
| Intrusion One month | Exposure therapy | 8 | 0.50 | 0.50 |
| Control | 8 | 11.13 | 2.93 |
| Outcome | Group | n | Mean | SD |
| PTSD symptoms Post therapy | TF‐CBT | 9 | 13.00 | 1.12 |
| Control | 9 | 24.20 | 1.54 | |
| PTSD symptoms 4 months | TF‐CBT | 9 | 11.88 | 1.96 |
| Control | 9 | 23.98 | 1.47 |
| Outcome | Group | n | Mean | SD |
| PTSD symptoms Post therapy | TF‐CBT | 24 | 10.6 | 4.5 |
| Control | 24 | 34.8 | 11.6 | |
| Conduct Problems Post therapy | TF‐CBT | 24 | 0.7 | 0.9 |
| Control | 24 | 7.1 | 7.0 |
| Outcome or subgroup title | No. of studies | No. of participants | Statistical method | Effect size |
| 1 PTSD diagnosis Show forest plot | 5 | 874 | Odds Ratio (M‐H, Random, 95% CI) | 0.51 [0.34, 0.77] |
| 1.1 CBT | 3 | 769 | Odds Ratio (M‐H, Random, 95% CI) | 0.59 [0.43, 0.80] |
| 1.2 EMDR | 1 | 40 | Odds Ratio (M‐H, Random, 95% CI) | 0.2 [0.01, 4.44] |
| 1.3 Family therapy | 1 | 65 | Odds Ratio (M‐H, Random, 95% CI) | 0.11 [0.02, 0.56] |
| 2 PTSD total symptoms Show forest plot | 15 | 2051 | Std. Mean Difference (IV, Random, 95% CI) | ‐0.42 [‐0.61, ‐0.24] |
| 2.1 CBT | 6 | 1329 | Std. Mean Difference (IV, Random, 95% CI) | ‐0.37 [‐0.55, ‐0.19] |
| 2.2 EMDR | 1 | 24 | Std. Mean Difference (IV, Random, 95% CI) | ‐0.77 [‐1.61, 0.06] |
| 2.3 Family therapy | 2 | 95 | Std. Mean Difference (IV, Random, 95% CI) | ‐0.53 [‐0.94, ‐0.12] |
| 2.4 Narrative | 1 | 64 | Std. Mean Difference (IV, Random, 95% CI) | 0.23 [‐0.26, 0.72] |
| 2.5 Psychoeducation | 2 | 215 | Std. Mean Difference (IV, Random, 95% CI) | ‐0.19 [‐0.69, 0.30] |
| 2.6 Supportive therapy | 2 | 272 | Std. Mean Difference (IV, Random, 95% CI) | ‐0.40 [‐0.95, 0.15] |
| 2.7 CBT + narrative therapy | 1 | 52 | Std. Mean Difference (IV, Random, 95% CI) | ‐1.96 [‐2.63, ‐1.29] |
| 3 PTSD avoidance Show forest plot | 2 | 205 | Std. Mean Difference (IV, Random, 95% CI) | ‐0.02 [‐0.29, 0.26] |
| 3.1 Narrative | 1 | 158 | Std. Mean Difference (IV, Random, 95% CI) | 0.05 [‐0.27, 0.36] |
| 3.2 Psychoeducation | 1 | 47 | Std. Mean Difference (IV, Random, 95% CI) | ‐0.23 [‐0.80, 0.35] |
| 4 PTSD hyperarousal Show forest plot | 2 | 205 | Std. Mean Difference (IV, Random, 95% CI) | 0.05 [‐0.22, 0.32] |
| 4.1 Narrative | 1 | 158 | Std. Mean Difference (IV, Random, 95% CI) | 0.10 [‐0.21, 0.41] |
| 4.2 Psychoeducation | 1 | 47 | Std. Mean Difference (IV, Random, 95% CI) | ‐0.12 [‐0.70, 0.45] |
| 5 PTSD intrusion Show forest plot | 2 | 205 | Std. Mean Difference (IV, Random, 95% CI) | 0.11 [‐0.16, 0.39] |
| 5.1 Narrative | 1 | 158 | Std. Mean Difference (IV, Random, 95% CI) | 0.15 [‐0.16, 0.46] |
| 5.2 Psychoeducation | 1 | 47 | Std. Mean Difference (IV, Random, 95% CI) | ‐0.02 [‐0.59, 0.55] |
| 6 Anxiety total symptoms Show forest plot | 7 | 959 | Std. Mean Difference (IV, Random, 95% CI) | ‐0.13 [‐0.26, 0.00] |
| 6.1 CBT | 2 | 557 | Std. Mean Difference (IV, Random, 95% CI) | ‐0.13 [‐0.30, 0.04] |
| 6.2 Counselling | 1 | 130 | Std. Mean Difference (IV, Random, 95% CI) | ‐0.20 [‐0.56, 0.16] |
| 6.3 EMDR | 1 | 40 | Std. Mean Difference (IV, Random, 95% CI) | ‐0.66 [‐1.30, ‐0.03] |
| 6.4 Exposure | 1 | 65 | Std. Mean Difference (IV, Random, 95% CI) | 0.01 [‐0.48, 0.51] |
| 6.5 Narrative | 1 | 111 | Std. Mean Difference (IV, Random, 95% CI) | ‐0.21 [‐0.58, 0.17] |
| 6.6 Psychoeducation | 1 | 56 | Std. Mean Difference (IV, Random, 95% CI) | 0.32 [‐0.21, 0.85] |
| 7 Anxiety ‐ state Show forest plot | 2 | 70 | Std. Mean Difference (IV, Random, 95% CI) | ‐0.64 [‐1.12, ‐0.16] |
| 7.1 CBT | 1 | 46 | Std. Mean Difference (IV, Random, 95% CI) | ‐0.71 [‐1.31, ‐0.12] |
| 7.2 EMDR | 1 | 24 | Std. Mean Difference (IV, Random, 95% CI) | ‐0.51 [‐1.33, 0.31] |
| 8 Anxiety ‐ trait Show forest plot | 2 | 70 | Std. Mean Difference (IV, Random, 95% CI) | ‐0.34 [‐0.81, 0.14] |
| 8.1 CBT | 1 | 46 | Std. Mean Difference (IV, Random, 95% CI) | ‐0.36 [‐0.94, 0.22] |
| 8.2 EMDR | 1 | 24 | Std. Mean Difference (IV, Random, 95% CI) | ‐0.29 [‐1.10, 0.51] |
| 9 Depression Show forest plot | 13 | 1569 | Std. Mean Difference (IV, Random, 95% CI) | ‐0.13 [‐0.30, 0.04] |
| 9.1 CBT | 6 | 1191 | Std. Mean Difference (IV, Random, 95% CI) | ‐0.21 [‐0.42, ‐0.00] |
| 9.2 EMDR | 2 | 64 | Std. Mean Difference (IV, Random, 95% CI) | ‐0.39 [‐1.41, 0.64] |
| 9.3 Exposure | 1 | 52 | Std. Mean Difference (IV, Random, 95% CI) | 0.10 [‐0.45, 0.65] |
| 9.4 Family therapy | 1 | 30 | Std. Mean Difference (IV, Random, 95% CI) | 0.05 [‐0.66, 0.77] |
| 9.5 Narrative | 2 | 176 | Std. Mean Difference (IV, Random, 95% CI) | 0.13 [‐0.52, 0.77] |
| 9.6 Psychoeducation | 1 | 56 | Std. Mean Difference (IV, Random, 95% CI) | 0.09 [‐0.43, 0.62] |
| 10 Behaviour ‐ total Show forest plot | 3 | 166 | Std. Mean Difference (IV, Random, 95% CI) | ‐0.04 [‐0.51, 0.42] |
| 10.1 EMDR | 1 | 24 | Std. Mean Difference (IV, Random, 95% CI) | ‐0.44 [‐1.25, 0.37] |
| 10.2 Exposure | 1 | 77 | Std. Mean Difference (IV, Random, 95% CI) | 0.34 [‐0.11, 0.80] |
| 10.3 Family therapy | 1 | 65 | Std. Mean Difference (IV, Random, 95% CI) | ‐0.23 [‐0.72, 0.26] |
| 11 Behaviour ‐ internalising Show forest plot | 10 | 719 | Std. Mean Difference (IV, Random, 95% CI) | ‐0.04 [‐0.20, 0.13] |
| 11.1 CBT | 2 | 162 | Std. Mean Difference (IV, Random, 95% CI) | ‐0.13 [‐0.44, 0.18] |
| 11.2 EMDR | 2 | 64 | Std. Mean Difference (IV, Random, 95% CI) | ‐0.57 [‐1.07, ‐0.07] |
| 11.3 Exposure | 1 | 77 | Std. Mean Difference (IV, Random, 95% CI) | 0.38 [‐0.08, 0.84] |
| 11.4 Family therapy | 1 | 30 | Std. Mean Difference (IV, Random, 95% CI) | 0.32 [‐0.40, 1.04] |
| 11.5 Narrative | 2 | 180 | Std. Mean Difference (IV, Random, 95% CI) | 0.12 [‐0.18, 0.41] |
| 11.6 Psychoeducation | 2 | 206 | Std. Mean Difference (IV, Random, 95% CI) | ‐0.11 [‐0.38, 0.17] |
| 12 Behaviour ‐ externalising Show forest plot | 12 | 1174 | Std. Mean Difference (IV, Random, 95% CI) | ‐0.10 [‐0.33, 0.14] |
| 12.1 CBT | 3 | 565 | Std. Mean Difference (IV, Random, 95% CI) | ‐0.11 [‐0.28, 0.06] |
| 12.2 EMDR | 2 | 64 | Std. Mean Difference (IV, Random, 95% CI) | ‐0.55 [‐1.19, 0.10] |
| 12.3 Exposure | 1 | 77 | Std. Mean Difference (IV, Random, 95% CI) | 0.49 [0.03, 0.95] |
| 12.4 Family therapy | 1 | 30 | Std. Mean Difference (IV, Random, 95% CI) | 0.23 [‐0.49, 0.95] |
| 12.5 Narrative | 2 | 180 | Std. Mean Difference (IV, Random, 95% CI) | 0.20 [‐0.41, 0.81] |
| 12.6 Psychoeducation | 2 | 206 | Std. Mean Difference (IV, Random, 95% CI) | ‐0.03 [‐0.52, 0.46] |
| 12.7 CBT + narrative therapy | 1 | 52 | Std. Mean Difference (IV, Random, 95% CI) | ‐1.06 [‐1.64, ‐0.47] |
| 13 Functional impairment Show forest plot | 2 | Std. Mean Difference (IV, Random, 95% CI) | Subtotals only | |
| 13.1 CBT | 2 | 557 | Std. Mean Difference (IV, Random, 95% CI) | ‐0.41 [‐0.59, ‐0.24] |
| 14 Quality of life Show forest plot | 1 | Std. Mean Difference (IV, Random, 95% CI) | Totals not selected | |
| 14.1 Supportive therapy | 1 | Std. Mean Difference (IV, Random, 95% CI) | 0.0 [0.0, 0.0] | |
| 15 Loss to follow‐up Show forest plot | 26 | 3872 | Risk Ratio (M‐H, Random, 95% CI) | 0.98 [0.69, 1.39] |
| 15.1 CBT | 14 | 2913 | Risk Ratio (M‐H, Random, 95% CI) | 0.87 [0.47, 1.62] |
| 15.2 Counselling | 1 | 164 | Risk Ratio (M‐H, Random, 95% CI) | 0.56 [0.30, 1.03] |
| 15.3 EMDR | 2 | 92 | Risk Ratio (M‐H, Random, 95% CI) | 1.64 [0.48, 5.59] |
| 15.4 Exposure | 1 | 16 | Risk Ratio (M‐H, Random, 95% CI) | 0.0 [0.0, 0.0] |
| 15.5 Family therapy | 2 | 105 | Risk Ratio (M‐H, Random, 95% CI) | 1.44 [0.48, 4.30] |
| 15.6 Narrative | 2 | 280 | Risk Ratio (M‐H, Random, 95% CI) | 0.87 [0.32, 2.39] |
| 15.7 Psychoeducation | 3 | 274 | Risk Ratio (M‐H, Random, 95% CI) | 1.21 [0.75, 1.96] |
| 15.8 Psychodrama | 1 | 28 | Risk Ratio (M‐H, Random, 95% CI) | 1.5 [0.29, 7.65] |
| Outcome or subgroup title | No. of studies | No. of participants | Statistical method | Effect size |
| 1 PTSD diagnosis Show forest plot | 4 | 742 | Odds Ratio (M‐H, Random, 95% CI) | 0.66 [0.26, 1.69] |
| 1.1 CBT | 2 | 570 | Odds Ratio (M‐H, Random, 95% CI) | 0.49 [0.09, 2.61] |
| 1.2 Debriefing | 1 | 132 | Odds Ratio (M‐H, Random, 95% CI) | 1.31 [0.47, 3.68] |
| 1.3 EMDR | 1 | 40 | Odds Ratio (M‐H, Random, 95% CI) | 0.35 [0.01, 9.13] |
| 2 PTSD total symptoms Show forest plot | 12 | 2337 | Std. Mean Difference (IV, Random, 95% CI) | ‐0.17 [‐0.38, 0.05] |
| 2.1 CBT | 5 | 1701 | Std. Mean Difference (IV, Random, 95% CI) | ‐0.34 [‐0.72, 0.03] |
| 2.2 Debriefing | 2 | 231 | Std. Mean Difference (IV, Random, 95% CI) | 0.04 [‐0.22, 0.30] |
| 2.3 Family therapy | 2 | 141 | Std. Mean Difference (IV, Random, 95% CI) | ‐0.06 [‐0.39, 0.27] |
| 2.4 Narrative | 1 | 64 | Std. Mean Difference (IV, Random, 95% CI) | 0.23 [‐0.26, 0.73] |
| 2.5 Psychoeducation | 1 | 56 | Std. Mean Difference (IV, Random, 95% CI) | ‐0.13 [‐0.65, 0.40] |
| 2.6 Supportive therapy | 1 | 144 | Std. Mean Difference (IV, Random, 95% CI) | ‐0.21 [‐0.54, 0.12] |
| 3 PTSD ‐ avoidance Show forest plot | 2 | 243 | Std. Mean Difference (IV, Fixed, 95% CI) | 0.04 [‐0.22, 0.29] |
| 3.1 Debriefing | 1 | 132 | Std. Mean Difference (IV, Fixed, 95% CI) | ‐0.08 [‐0.42, 0.26] |
| 3.2 Family therapy | 1 | 111 | Std. Mean Difference (IV, Fixed, 95% CI) | 0.18 [‐0.20, 0.55] |
| 4 PTSD ‐ hyperarousal Show forest plot | 2 | 243 | Std. Mean Difference (IV, Random, 95% CI) | ‐0.13 [‐0.43, 0.17] |
| 4.1 Debriefing | 1 | 132 | Std. Mean Difference (IV, Random, 95% CI) | 0.01 [‐0.33, 0.35] |
| 4.2 Family therapy | 1 | 111 | Std. Mean Difference (IV, Random, 95% CI) | ‐0.29 [‐0.67, 0.09] |
| 5 PTSD ‐ intrusion Show forest plot | 2 | 243 | Std. Mean Difference (IV, Fixed, 95% CI) | ‐0.04 [‐0.29, 0.21] |
| 5.1 Debriefing | 1 | 132 | Std. Mean Difference (IV, Fixed, 95% CI) | ‐0.05 [‐0.39, 0.29] |
| 5.2 Family therapy | 1 | 111 | Std. Mean Difference (IV, Fixed, 95% CI) | ‐0.03 [‐0.40, 0.35] |
| 6 Anxiety total symptoms Show forest plot | 7 | 1470 | Std. Mean Difference (IV, Random, 95% CI) | ‐0.10 [‐0.20, 0.00] |
| 6.1 CBT | 3 | 1131 | Std. Mean Difference (IV, Random, 95% CI) | ‐0.07 [‐0.19, 0.04] |
| 6.2 Debriefing | 1 | 132 | Std. Mean Difference (IV, Random, 95% CI) | ‐0.08 [‐0.42, 0.27] |
| 6.3 EMDR | 1 | 40 | Std. Mean Difference (IV, Random, 95% CI) | ‐0.72 [‐1.36, ‐0.07] |
| 6.4 Psychoeducation | 1 | 56 | Std. Mean Difference (IV, Random, 95% CI) | ‐0.21 [‐0.73, 0.32] |
| 6.5 Narrative | 1 | 111 | Std. Mean Difference (IV, Random, 95% CI) | ‐0.17 [‐0.54, 0.21] |
| 7 Anxiety ‐ state Show forest plot | 1 | Std. Mean Difference (IV, Fixed, 95% CI) | Totals not selected | |
| 7.1 CBT | 1 | Std. Mean Difference (IV, Fixed, 95% CI) | 0.0 [0.0, 0.0] | |
| 8 Anxiety ‐ trait Show forest plot | 2 | Std. Mean Difference (IV, Fixed, 95% CI) | Subtotals only | |
| 8.1 CBT | 2 | 101 | Std. Mean Difference (IV, Fixed, 95% CI) | ‐0.45 [‐0.85, ‐0.05] |
| 9 Depression Show forest plot | 13 | 2191 | Std. Mean Difference (IV, Random, 95% CI) | ‐0.07 [‐0.22, 0.07] |
| 9.1 CBT | 8 | 1810 | Std. Mean Difference (IV, Random, 95% CI) | ‐0.12 [‐0.31, 0.07] |
| 9.2 Debriefing | 2 | 231 | Std. Mean Difference (IV, Random, 95% CI) | ‐0.12 [‐0.38, 0.14] |
| 9.3 Family therapy | 1 | 30 | Std. Mean Difference (IV, Random, 95% CI) | 0.34 [‐0.38, 1.06] |
| 9.4 Narrative | 1 | 64 | Std. Mean Difference (IV, Random, 95% CI) | 0.34 [‐0.15, 0.84] |
| 9.5 Psychoeducation | 1 | 56 | Std. Mean Difference (IV, Random, 95% CI) | ‐0.14 [‐0.67, 0.38] |
| 10 Behaviour ‐ total Show forest plot | 3 | 281 | Std. Mean Difference (IV, Fixed, 95% CI) | ‐0.20 [‐0.43, 0.04] |
| 10.1 Debriefing | 1 | 132 | Std. Mean Difference (IV, Fixed, 95% CI) | ‐0.28 [‐0.62, 0.06] |
| 10.2 Family therapy | 1 | 50 | Std. Mean Difference (IV, Fixed, 95% CI) | ‐0.37 [‐0.93, 0.19] |
| 10.3 Narrative | 1 | 99 | Std. Mean Difference (IV, Fixed, 95% CI) | 0.0 [‐0.39, 0.39] |
| 11 Behaviour ‐ internalising Show forest plot | 4 | 291 | Std. Mean Difference (IV, Random, 95% CI) | 0.01 [‐0.25, 0.28] |
| 11.1 EMDR | 1 | 40 | Std. Mean Difference (IV, Random, 95% CI) | ‐0.50 [‐1.13, 0.14] |
| 11.2 Family therapy | 1 | 30 | Std. Mean Difference (IV, Random, 95% CI) | 0.0 [‐0.72, 0.72] |
| 11.3 Narrative | 2 | 221 | Std. Mean Difference (IV, Random, 95% CI) | 0.13 [‐0.13, 0.40] |
| 12 Behaviour ‐ externalising Show forest plot | 5 | 694 | Std. Mean Difference (IV, Random, 95% CI) | 0.02 [‐0.32, 0.35] |
| 12.1 CBT | 1 | 403 | Std. Mean Difference (IV, Random, 95% CI) | 0.07 [‐0.13, 0.27] |
| 12.2 EMDR | 1 | 40 | Std. Mean Difference (IV, Random, 95% CI) | 1.00 [‐1.66, ‐0.33] |
| 12.3 Family therapy | 1 | 30 | Std. Mean Difference (IV, Random, 95% CI) | ‐0.01 [‐0.72, 0.71] |
| 12.4 Narrative | 2 | 221 | Std. Mean Difference (IV, Random, 95% CI) | 0.31 [0.05, 0.58] |
| 13 Function Show forest plot | 3 | Std. Mean Difference (IV, Random, 95% CI) | Subtotals only | |
| 13.1 CBT | 3 | 814 | Std. Mean Difference (IV, Random, 95% CI) | ‐0.46 [‐0.88, ‐0.05] |
| 14 Quality of life Show forest plot | 1 | Std. Mean Difference (IV, Random, 95% CI) | Totals not selected | |
| 14.1 Supportive therapy | 1 | Std. Mean Difference (IV, Random, 95% CI) | 0.0 [0.0, 0.0] | |
| 15 Loss to follow‐up Show forest plot | 20 | 3663 | Odds Ratio (M‐H, Fixed, 95% CI) | 1.00 [0.82, 1.21] |
| 15.1 CBT | 11 | 2856 | Odds Ratio (M‐H, Fixed, 95% CI) | 1.01 [0.81, 1.27] |
| 15.2 Counselling | 1 | 23 | Odds Ratio (M‐H, Fixed, 95% CI) | 7.0 [0.32, 152.95] |
| 15.3 Debriefing | 1 | 158 | Odds Ratio (M‐H, Fixed, 95% CI) | 0.76 [0.33, 1.76] |
| 15.4 EMDR | 1 | 65 | Odds Ratio (M‐H, Fixed, 95% CI) | 1.41 [0.52, 3.84] |
| 15.5 Family therapy | 1 | 75 | Odds Ratio (M‐H, Fixed, 95% CI) | 1.28 [0.48, 3.39] |
| 15.6 Narrative | 2 | 171 | Odds Ratio (M‐H, Fixed, 95% CI) | 0.70 [0.16, 2.99] |
| 15.7 Psychoeducation | 2 | 244 | Odds Ratio (M‐H, Fixed, 95% CI) | 0.77 [0.40, 1.47] |
| 15.8 Other | 1 | 71 | Odds Ratio (M‐H, Fixed, 95% CI) | 0.90 [0.29, 2.73] |
| Outcome or subgroup title | No. of studies | No. of participants | Statistical method | Effect size |
| 1 PTSD diagnosis Show forest plot | 1 | Odds Ratio (M‐H, Random, 95% CI) | Totals not selected | |
| 1.1 Narrative | 1 | Odds Ratio (M‐H, Random, 95% CI) | 0.0 [0.0, 0.0] | |
| 2 PTSD total symptoms Show forest plot | 2 | 141 | Std. Mean Difference (IV, Random, 95% CI) | 0.17 [‐0.28, 0.62] |
| 2.1 Exposure | 1 | 77 | Std. Mean Difference (IV, Random, 95% CI) | 0.39 [‐0.07, 0.85] |
| 2.2 Narrative | 1 | 64 | Std. Mean Difference (IV, Random, 95% CI) | ‐0.07 [‐0.56, 0.42] |
| 3 Anxiety Show forest plot | 2 | 176 | Std. Mean Difference (IV, Random, 95% CI) | ‐0.12 [‐0.41, 0.18] |
| 3.1 Exposure | 1 | 65 | Std. Mean Difference (IV, Random, 95% CI) | ‐0.30 [‐0.80, 0.19] |
| 3.2 Narrative | 1 | 111 | Std. Mean Difference (IV, Random, 95% CI) | ‐0.01 [‐0.39, 0.36] |
| 4 Depression Show forest plot | 3 | 152 | Std. Mean Difference (IV, Fixed, 95% CI) | ‐0.24 [‐0.56, 0.08] |
| 4.1 CBT | 1 | 36 | Std. Mean Difference (IV, Fixed, 95% CI) | ‐0.59 [‐1.27, 0.09] |
| 4.2 Exposure | 1 | 52 | Std. Mean Difference (IV, Fixed, 95% CI) | ‐0.29 [‐0.84, 0.26] |
| 4.3 Narrative | 1 | 64 | Std. Mean Difference (IV, Fixed, 95% CI) | ‐0.02 [‐0.51, 0.47] |
| 5 Behaviour ‐ total Show forest plot | 1 | Std. Mean Difference (IV, Random, 95% CI) | Totals not selected | |
| 5.1 Exposure | 1 | Std. Mean Difference (IV, Random, 95% CI) | 0.0 [0.0, 0.0] | |
| 6 Behaviour ‐ internalising Show forest plot | 2 | 141 | Std. Mean Difference (IV, Random, 95% CI) | 0.04 [‐0.51, 0.59] |
| 6.1 Exposure | 1 | 77 | Std. Mean Difference (IV, Random, 95% CI) | 0.31 [‐0.15, 0.77] |
| 6.2 Narrative | 1 | 64 | Std. Mean Difference (IV, Random, 95% CI) | ‐0.25 [‐0.75, 0.24] |
| 7 Behaviour ‐ externalising Show forest plot | 3 | 298 | Std. Mean Difference (IV, Random, 95% CI) | 0.28 [‐0.05, 0.60] |
| 7.1 Exposure | 1 | 77 | Std. Mean Difference (IV, Random, 95% CI) | 0.51 [0.04, 0.97] |
| 7.2 Narrative | 2 | 221 | Std. Mean Difference (IV, Random, 95% CI) | 0.17 [‐0.30, 0.64] |
| 8 Loss to follow‐up Show forest plot | 2 | 120 | Odds Ratio (M‐H, Random, 95% CI) | 0.45 [0.15, 1.32] |
| 8.1 CBT | 1 | 50 | Odds Ratio (M‐H, Random, 95% CI) | 0.29 [0.08, 1.09] |
| 8.2 Narrative | 1 | 70 | Odds Ratio (M‐H, Random, 95% CI) | 0.88 [0.17, 4.71] |
| Outcome or subgroup title | No. of studies | No. of participants | Statistical method | Effect size |
| 1 PTSD diagnosis Show forest plot | 2 | 160 | Odds Ratio (M‐H, Random, 95% CI) | 0.74 [0.29, 1.91] |
| 1.1 EMDR | 1 | 36 | Odds Ratio (M‐H, Random, 95% CI) | 1.0 [0.06, 17.33] |
| 1.2 Supportive therapy | 1 | 124 | Odds Ratio (M‐H, Random, 95% CI) | 0.71 [0.26, 1.95] |
| 2 PTSD total symptoms Show forest plot | 7 | 466 | Std. Mean Difference (IV, Random, 95% CI) | ‐0.24 [‐0.42, ‐0.05] |
| 2.1 EMDR | 2 | 62 | Std. Mean Difference (IV, Random, 95% CI) | 0.06 [‐0.44, 0.56] |
| 2.2 Play therapy | 1 | 26 | Std. Mean Difference (IV, Random, 95% CI) | 0.21 [‐0.56, 0.98] |
| 2.3 Supportive therapies | 4 | 378 | Std. Mean Difference (IV, Random, 95% CI) | ‐0.32 [‐0.53, ‐0.12] |
| 3 PTSD avoidance Show forest plot | 1 | Std. Mean Difference (IV, Random, 95% CI) | Totals not selected | |
| 3.1 Supportive therapy | 1 | Std. Mean Difference (IV, Random, 95% CI) | 0.0 [0.0, 0.0] | |
| 4 PTSD hyperarousal Show forest plot | 1 | Std. Mean Difference (IV, Random, 95% CI) | Totals not selected | |
| 4.1 Supportive therapy | 1 | Std. Mean Difference (IV, Random, 95% CI) | 0.0 [0.0, 0.0] | |
| 5 PTSD intrusion Show forest plot | 1 | Std. Mean Difference (IV, Random, 95% CI) | Totals not selected | |
| 5.1 Supportive therapy | 1 | Std. Mean Difference (IV, Random, 95% CI) | 0.0 [0.0, 0.0] | |
| 6 Anxiety total symptoms Show forest plot | 2 | Std. Mean Difference (IV, Random, 95% CI) | Subtotals only | |
| 6.1 Supportive therapy | 2 | 230 | Std. Mean Difference (IV, Random, 95% CI) | ‐0.48 [‐0.74, ‐0.22] |
| 7 Depression Show forest plot | 2 | Std. Mean Difference (IV, Random, 95% CI) | Subtotals only | |
| 7.1 Supportive therapy | 2 | 237 | Std. Mean Difference (IV, Random, 95% CI) | ‐0.14 [‐0.42, 0.14] |
| 8 Behaviour ‐ total Show forest plot | 3 | 182 | Std. Mean Difference (IV, Random, 95% CI) | 0.02 [‐0.27, 0.31] |
| 8.1 EMDR | 1 | 14 | Std. Mean Difference (IV, Random, 95% CI) | ‐0.44 [‐1.50, 0.63] |
| 8.2 Supportive therapy | 2 | 168 | Std. Mean Difference (IV, Random, 95% CI) | 0.05 [‐0.25, 0.36] |
| 9 Behaviour ‐ internalising Show forest plot | 3 | Std. Mean Difference (IV, Random, 95% CI) | Subtotals only | |
| 9.1 Supportive therapy | 3 | 235 | Std. Mean Difference (IV, Random, 95% CI) | ‐0.25 [‐0.79, 0.28] |
| 10 Behaviour ‐ externalising Show forest plot | 3 | Std. Mean Difference (IV, Random, 95% CI) | Subtotals only | |
| 10.1 Supportive therapy | 3 | 235 | Std. Mean Difference (IV, Random, 95% CI) | ‐0.31 [‐0.58, ‐0.05] |
| 11 Function Show forest plot | 1 | Std. Mean Difference (IV, Random, 95% CI) | Totals not selected | |
| 11.1 Supportive therapy | 1 | Std. Mean Difference (IV, Random, 95% CI) | 0.0 [0.0, 0.0] | |
| 12 Loss to follow‐up Show forest plot | 8 | 544 | Odds Ratio (M‐H, Random, 95% CI) | 0.69 [0.41, 1.18] |
| 12.1 EMDR | 2 | 64 | Odds Ratio (M‐H, Random, 95% CI) | 0.76 [0.23, 2.52] |
| 12.2 Play therapy | 1 | 31 | Odds Ratio (M‐H, Random, 95% CI) | 0.08 [0.00, 1.56] |
| 12.3 Supportive therapy | 5 | 449 | Odds Ratio (M‐H, Random, 95% CI) | 0.74 [0.38, 1.43] |
| Outcome or subgroup title | No. of studies | No. of participants | Statistical method | Effect size |
| 1 PTSD total symptoms Show forest plot | 2 | Std. Mean Difference (IV, Random, 95% CI) | Subtotals only | |
| 1.1 Supportive therapy | 2 | 223 | Std. Mean Difference (IV, Random, 95% CI) | ‐0.16 [‐0.43, 0.11] |
| 2 Anxiety total symptoms Show forest plot | 1 | Std. Mean Difference (IV, Random, 95% CI) | Totals not selected | |
| 2.1 Supportive therapy | 1 | Std. Mean Difference (IV, Random, 95% CI) | 0.0 [0.0, 0.0] | |
| 3 Depression Show forest plot | 1 | Std. Mean Difference (IV, Random, 95% CI) | Totals not selected | |
| 3.1 Supportive therapy | 1 | Std. Mean Difference (IV, Random, 95% CI) | 0.0 [0.0, 0.0] | |
| 4 Behaviour ‐ total Show forest plot | 1 | Std. Mean Difference (IV, Random, 95% CI) | Totals not selected | |
| 4.1 Supportive therapy | 1 | Std. Mean Difference (IV, Random, 95% CI) | 0.0 [0.0, 0.0] | |
| 5 Behaviour ‐ internalising Show forest plot | 2 | Std. Mean Difference (IV, Random, 95% CI) | Subtotals only | |
| 5.1 Supportive therapy | 2 | 178 | Std. Mean Difference (IV, Random, 95% CI) | ‐0.05 [‐0.36, 0.26] |
| 6 Behaviour ‐ externalising Show forest plot | 2 | Std. Mean Difference (IV, Random, 95% CI) | Subtotals only | |
| 6.1 Supportive therapy | 2 | 178 | Std. Mean Difference (IV, Random, 95% CI) | ‐0.06 [‐0.37, 0.25] |
| 7 Loss to follow‐up Show forest plot | 1 | Odds Ratio (M‐H, Random, 95% CI) | Totals not selected | |
| 7.1 Supportive therapy | 1 | Odds Ratio (M‐H, Random, 95% CI) | 0.0 [0.0, 0.0] | |
| Outcome or subgroup title | No. of studies | No. of participants | Statistical method | Effect size |
| 1 Behaviour ‐ internalising Show forest plot | 1 | Std. Mean Difference (IV, Random, 95% CI) | Totals not selected | |
| 1.1 Supportive therapy | 1 | Std. Mean Difference (IV, Random, 95% CI) | 0.0 [0.0, 0.0] | |
| 2 Behaviour ‐ externalising Show forest plot | 1 | Std. Mean Difference (IV, Random, 95% CI) | Totals not selected | |
| 2.1 Supportive therapy | 1 | Std. Mean Difference (IV, Random, 95% CI) | 0.0 [0.0, 0.0] | |
| 3 Loss to follow‐up Show forest plot | 1 | Odds Ratio (M‐H, Random, 95% CI) | Totals not selected | |
| 3.1 Supportive therapy | 1 | Odds Ratio (M‐H, Random, 95% CI) | 0.0 [0.0, 0.0] | |
| Outcome or subgroup title | No. of studies | No. of participants | Statistical method | Effect size |
| 1 PTSD total symptoms Show forest plot | 1 | Std. Mean Difference (IV, Random, 95% CI) | Totals not selected | |
| 1.1 Short‐term | 1 | Std. Mean Difference (IV, Random, 95% CI) | 0.0 [0.0, 0.0] | |
| 1.2 Medium‐term | 1 | Std. Mean Difference (IV, Random, 95% CI) | 0.0 [0.0, 0.0] | |
| 1.3 Long‐term | 1 | Std. Mean Difference (IV, Random, 95% CI) | 0.0 [0.0, 0.0] | |
| Outcome or subgroup title | No. of studies | No. of participants | Statistical method | Effect size |
| 1 PTSD diagnosis Show forest plot | 6 | Odds Ratio (M‐H, Random, 95% CI) | Subtotals only | |
| 1.1 Community violence | 3 | 769 | Odds Ratio (M‐H, Random, 95% CI) | 0.59 [0.43, 0.80] |
| 1.2 Interpersonal violence | 1 | 65 | Odds Ratio (M‐H, Random, 95% CI) | 0.11 [0.02, 0.56] |
| 1.3 Natural disaster | 1 | 166 | Odds Ratio (M‐H, Random, 95% CI) | 0.16 [0.06, 0.45] |
| 1.4 Physical trauma | 1 | 132 | Odds Ratio (M‐H, Random, 95% CI) | 1.31 [0.47, 3.68] |
| 2 PTSD total symptoms Show forest plot | 18 | Std. Mean Difference (IV, Random, 95% CI) | Subtotals only | |
| 2.1 Community violence | 8 | 2170 | Std. Mean Difference (IV, Random, 95% CI) | ‐0.24 [‐0.41, ‐0.06] |
| 2.2 Interpersonal violence | 1 | 65 | Std. Mean Difference (IV, Random, 95% CI) | ‐0.61 [‐1.11, ‐0.11] |
| 2.3 Life‐threatening illness | 1 | 111 | Std. Mean Difference (IV, Random, 95% CI) | ‐0.12 [‐0.50, 0.26] |
| 2.4 Maltreatment | 1 | 142 | Std. Mean Difference (IV, Random, 95% CI) | ‐0.12 [‐0.45, 0.21] |
| 2.5 Natural disaster | 1 | 166 | Std. Mean Difference (IV, Random, 95% CI) | ‐1.27 [‐1.60, ‐0.94] |
| 2.6 Physical trauma | 4 | 311 | Std. Mean Difference (IV, Random, 95% CI) | ‐0.02 [‐0.29, 0.26] |
| 2.7 Sexual abuse | 2 | 76 | Std. Mean Difference (IV, Random, 95% CI) | ‐0.67 [‐1.18, ‐0.16] |
| Outcome or subgroup title | No. of studies | No. of participants | Statistical method | Effect size |
| 1 PTSD diagnosis Show forest plot | 7 | Odds Ratio (M‐H, Random, 95% CI) | Subtotals only | |
| 1.1 Symptoms not stated | 5 | 999 | Odds Ratio (M‐H, Random, 95% CI) | 0.41 [0.20, 0.83] |
| 1.2 Symptomatic | 2 | 197 | Odds Ratio (M‐H, Random, 95% CI) | 0.64 [0.32, 1.25] |
| 2 PTSD total symptoms Show forest plot | 21 | Std. Mean Difference (IV, Random, 95% CI) | Subtotals only | |
| 2.1 Symptoms not stated | 12 | 1648 | Std. Mean Difference (IV, Random, 95% CI) | ‐0.41 [‐0.68, ‐0.13] |
| 2.2 Symptomatic | 9 | 1639 | Std. Mean Difference (IV, Random, 95% CI) | ‐0.30 [‐0.53, ‐0.06] |
| Outcome or subgroup title | No. of studies | No. of participants | Statistical method | Effect size |
| 1 PTSD diagnosis Show forest plot | 7 | Odds Ratio (M‐H, Random, 95% CI) | Subtotals only | |
| 1.1 Inactive control | 5 | 1067 | Odds Ratio (M‐H, Random, 95% CI) | 0.53 [0.32, 0.88] |
| 1.2 Active control | 2 | 129 | Odds Ratio (M‐H, Random, 95% CI) | 0.23 [0.05, 1.14] |
| 2 PTSD total symptoms Show forest plot | 21 | Std. Mean Difference (IV, Random, 95% CI) | Subtotals only | |
| 2.1 Inactive control | 15 | 2856 | Std. Mean Difference (IV, Random, 95% CI) | ‐0.40 [‐0.61, ‐0.19] |
| 2.2 Active control | 6 | 431 | Std. Mean Difference (IV, Random, 95% CI) | ‐0.25 [‐0.58, 0.09] |
| Outcome or subgroup title | No. of studies | No. of participants | Statistical method | Effect size |
| 1 PTSD diagnosis Show forest plot | 7 | Odds Ratio (M‐H, Random, 95% CI) | Subtotals only | |
| 1.1 Best case | 7 | 1282 | Odds Ratio (M‐H, Random, 95% CI) | 0.52 [0.28, 0.99] |
| 1.2 Worst case | 7 | 1252 | Odds Ratio (M‐H, Random, 95% CI) | 0.64 [0.42, 0.98] |
| Outcome or subgroup title | No. of studies | No. of participants | Statistical method | Effect size |
| 1 PTSD diagnosis Show forest plot | 7 | Odds Ratio (M‐H, Random, 95% CI) | Subtotals only | |
| 1.1 Cluster‐randomised | 4 | 935 | Odds Ratio (M‐H, Random, 95% CI) | 0.46 [0.27, 0.76] |
| 1.2 Individuals randomised | 3 | 261 | Odds Ratio (M‐H, Random, 95% CI) | 0.47 [0.10, 2.19] |
| 2 PTSD total symptoms Show forest plot | 20 | Std. Mean Difference (IV, Random, 95% CI) | Subtotals only | |
| 2.1 Cluster‐randomised | 7 | 2063 | Std. Mean Difference (IV, Random, 95% CI) | ‐0.40 [‐0.71, ‐0.10] |
| 2.2 Individuals randomised | 13 | 1172 | Std. Mean Difference (IV, Random, 95% CI) | ‐0.22 [‐0.38, ‐0.06] |
| Outcome or subgroup title | No. of studies | No. of participants | Statistical method | Effect size |
| 1 PTSD diagnosis Show forest plot | 7 | Odds Ratio (M‐H, Random, 95% CI) | Subtotals only | |
| 1.1 Unclear risk | 1 | 64 | Odds Ratio (M‐H, Random, 95% CI) | 0.56 [0.09, 3.62] |
| 1.2 High risk | 6 | 1132 | Odds Ratio (M‐H, Random, 95% CI) | 0.46 [0.27, 0.79] |
| 2 PTSD total symptoms Show forest plot | 21 | Std. Mean Difference (IV, Random, 95% CI) | Subtotals only | |
| 2.1 Unclear risk | 1 | 64 | Std. Mean Difference (IV, Random, 95% CI) | 0.23 [‐0.26, 0.72] |
| 2.2 High risk | 20 | 3223 | Std. Mean Difference (IV, Random, 95% CI) | ‐0.39 [‐0.57, ‐0.20] |
| Outcome or subgroup title | No. of studies | No. of participants | Statistical method | Effect size |
| 1 PTSD diagnosis Show forest plot | 7 | Odds Ratio (M‐H, Random, 95% CI) | Subtotals only | |
| 1.1 Low risk | 2 | 197 | Odds Ratio (M‐H, Random, 95% CI) | 0.41 [0.04, 4.68] |
| 1.2 Unclear risk | 1 | 64 | Odds Ratio (M‐H, Random, 95% CI) | 0.56 [0.09, 3.62] |
| 1.3 High risk | 4 | 935 | Odds Ratio (M‐H, Random, 95% CI) | 0.46 [0.27, 0.76] |
| 2 PTSD total symptoms Show forest plot | 21 | Std. Mean Difference (IV, Random, 95% CI) | Subtotals only | |
| 2.1 Low risk | 1 | 132 | Std. Mean Difference (IV, Random, 95% CI) | ‐0.05 [‐0.39, 0.30] |
| 2.2 Unclear risk | 2 | 191 | Std. Mean Difference (IV, Random, 95% CI) | ‐0.03 [‐0.46, 0.40] |
| 2.3 High risk | 18 | 2964 | Std. Mean Difference (IV, Random, 95% CI) | ‐0.42 [‐0.62, ‐0.22] |
| Outcome or subgroup title | No. of studies | No. of participants | Statistical method | Effect size |
| 1 PTSD diagnosis Show forest plot | 7 | Odds Ratio (M‐H, Random, 95% CI) | Subtotals only | |
| 1.1 Low risk | 2 | 320 | Odds Ratio (M‐H, Random, 95% CI) | 0.27 [0.11, 0.65] |
| 1.2 Unclear risk | 3 | 329 | Odds Ratio (M‐H, Random, 95% CI) | 0.79 [0.45, 1.38] |
| 1.3 High risk | 2 | 547 | Odds Ratio (M‐H, Random, 95% CI) | 0.32 [0.06, 1.60] |
| 2 PTSD total symptoms Show forest plot | 21 | Std. Mean Difference (IV, Random, 95% CI) | Subtotals only | |
| 2.1 Low risk | 7 | 1410 | Std. Mean Difference (IV, Random, 95% CI) | ‐0.38 [‐0.75, ‐0.01] |
| 2.2 Unclear risk | 9 | 1046 | Std. Mean Difference (IV, Random, 95% CI) | ‐0.36 [‐0.67, ‐0.05] |
| 2.3 High risk | 5 | 831 | Std. Mean Difference (IV, Random, 95% CI) | ‐0.30 [‐0.53, ‐0.06] |
| Outcome or subgroup title | No. of studies | No. of participants | Statistical method | Effect size |
| 1 PTSD diagnosis Show forest plot | 7 | Odds Ratio (M‐H, Random, 95% CI) | Subtotals only | |
| 1.1 Low risk | 4 | 516 | Odds Ratio (M‐H, Random, 95% CI) | 0.46 [0.18, 1.15] |
| 1.2 Unclear risk | 2 | 547 | Odds Ratio (M‐H, Random, 95% CI) | 0.32 [0.06, 1.60] |
| 1.3 High risk | 1 | 133 | Odds Ratio (M‐H, Random, 95% CI) | 0.65 [0.32, 1.33] |
| 2 PTSD total symptoms Show forest plot | 21 | Std. Mean Difference (IV, Random, 95% CI) | Subtotals only | |
| 2.1 Low risk | 8 | 874 | Std. Mean Difference (IV, Random, 95% CI) | ‐0.57 [‐0.97, ‐0.17] |
| 2.2 Unclear risk | 13 | 2413 | Std. Mean Difference (IV, Random, 95% CI) | ‐0.22 [‐0.39, ‐0.06] |