Terapias psicológicas para niños y adolescentes expuestos a traumas
Resumen
Antecedentes
Los niños y adolescentes que han experimentado un trauma están en alto riesgo de desarrollar trastorno de estrés postraumático (TEPT) y otros resultados emocionales, conductuales y de salud mental negativos, todos asociados con costos personales y sanitarios altos. Se utiliza una gama amplia de tratamientos psicológicos para prevenir los resultados negativos asociados con el trauma en niños y adolescentes.
Objetivos
Evaluar los efectos de las terapias psicológicas en cuanto a la prevención del TEPT y los resultados emocionales, conductuales y de salud mental negativos asociados en niños y adolescentes que han experimentado un evento traumático.
Métodos de búsqueda
Se hicieron búsquedas en el registro especializado del Grupo Cochrane de Trastornos Mentales Comunes (Cochrane Common Mental Disorders Group) hasta 29 mayo 2015. Este registro contiene informes de ensayos controlados aleatorios relevantes de The Cochrane Library (todos los años), EMBASE (1974 hasta la actualidad), MEDLINE (1950 hasta la actualidad) y de PsycINFO (1967 hasta la actualidad). También se verificaron las listas de referencias de los estudios y revisiones relevantes. No se restringieron las búsquedas por fecha, idioma o estado de la publicación.
Criterios de selección
Todos los ensayos controlados aleatorios de las terapias psicológicas en comparación con un control como tratamiento habitual, lista de espera o ningún tratamiento, tratamiento farmacológico u otros tratamientos en niños o adolescentes que habían experimentado un evento traumático.
Obtención y análisis de los datos
Dos miembros del grupo de revisión extrajeron datos de forma independiente. Se calcularon los odds ratios para los resultados binarios y las diferencias de medias estandarizadas para los resultados continuos mediante un modelo de efectos aleatorios. Los datos se analizaron como a corto plazo (hasta e incluido un mes después del tratamiento), a plazo medio (un mes a un año después del tratamiento) y a largo plazo (un año o más).
Resultados principales
Los investigadores incluyeron 6201 participantes en los 51 ensayos incluidos. Veinte estudios incluyeron sólo a niños, dos incluyeron sólo a niños en edad preescolar y diez sólo a adolescentes; todos los otros incluyeron tanto a niños como a adolescentes. Los participantes habían estado expuestos al abuso sexual en 12 ensayos, a la guerra o la violencia en la comunidad en diez, al trauma físico en seis, a un desastre natural en seis, y a violencia interpersonal en tres; en un ensayo los participantes habían sufrido una enfermedad potencialmente mortal, y en uno habían sufrido abuso físico o maltrato. Los participantes de los ensayos restantes habían estado expuestos a diversos traumas.
La mayoría de los ensayos comparó un tratamiento psicológico con un control como tratamiento habitual, lista de espera o ningún tratamiento. Diecisiete ensayos usaron terapia cognitivoconductual (TCC); cuatro utilizaron terapia familiar; tres requirieron debriefing; dos ensayos usaron desensibilización y reprocesamiento del movimiento ocular y (DRMO), terapia narrativa, terapia de apoyo y psicoeducación; un ensayo proporcionó exposición y uno TCC más terapia narrativa. Ocho ensayos compararon TCC con terapia de apoyo; dos, TCC con DRMO; uno, TCC con tratamiento psicodinámico; uno, exposición más terapia de apoyo con terapia de apoyo sola; y uno, terapia narrativa más TCC versus TCC sola. Cuatro ensayos compararon la administración de terapia psicológica con un modelo grupal de la misma terapia, y uno comparó TCC para los niños versus TCC tanto para las madres como para los niños.
La probabilidad de un diagnóstico de TEPT en los niños y adolescentes que recibieron un tratamiento psicológico se redujo significativamente en comparación con los que recibieron ningún tratamiento, tratamiento habitual o que estuvieron en lista de espera durante hasta un mes luego del tratamiento (odds ratio [OR] 0,51; intervalo de confianza [IC] del 95%: 0,34 a 0,77; número necesario a tratar para lograr un resultado beneficioso adicional [NNTB] 6,25; IC del 95%: 3,70 a 16,67; cinco estudios; 874 participantes). Sin embargo la calidad general de las pruebas para el diagnóstico de TEPT fue calificada como muy baja. Los síntomas de TEPT también se redujeron significativamente durante un mes después del tratamiento (diferencia de medias estandarizada [DME] ‐0,42; IC del 95%: ‐0,61 a ‐0,24; 15 estudios; 2051 participantes) y la calidad de las pruebas se calificó como baja. Estos efectos de las terapias psicológicas no fueron evidentes a más largo plazo.
Se encontró que la TCC no fue más o menos efectiva que la DRMO y la terapia de apoyo para reducir el diagnóstico de TEPT a corto plazo (OR 0,74; IC del 95%: 0,29 a 1,91; dos estudios; 160 participantes), sin embargo estas pruebas se consideraron de calidad muy baja. Para la reducción de los síntomas del TEPT a corto plazo, hubo un efecto pequeño a favor de la TCC sobre la DRMO, la terapia de juego y las terapias de apoyo (DME ‐0,24; IC del 95%: ‐0,42 a ‐0,05; siete estudios; 466 participantes). La calidad de las pruebas para este resultado fue calificada como moderada.
No se identificaron estudios que compararan terapias farmacológicas con terapias psicológicas.
Conclusiones de los autores
Los metanálisis de esta revisión aportan algunas pruebas sobre la efectividad de las terapias psicológicas en la prevención del TEPT y la reducción de los síntomas en los niños y adolescentes expuestos al trauma durante hasta un mes. Sin embargo, la confianza en estos hallazgos es limitada por la calidad de los estudios incluidos y por la heterogeneidad apreciable entre los estudios. Se necesitan muchas más pruebas para demostrar la efectividad relativa de diferentes terapias psicológicas para los niños expuestos al trauma, en particular a más largo plazo. Deben realizarse estudios de alta calidad para comparar estas terapias.
PICOs
Resumen en términos sencillos
Terapias psicológicas para la prevención del trastorno de estrés postraumático en niños y adolescentes
¿Por qué es importante esta revisión?
Los niños y adolescentes que han experimentado un trauma están en alto riesgo de desarrollar trastorno de estrés postraumático (TEPT) y resultados psicológicos y sociales negativos.
¿A quién le interesará esta revisión?
Los niños y adolescentes que han experimentado un trauma y sus familias y cuidadores estarán interesados en esta revisión, junto con los profesionales de la asistencia sanitaria, en particular los que trabajan en los servicios de salud mental para niños y adolescentes.
¿Qué preguntas pretende contestar esta revisión?
• ¿Cuáles son los efectos de las terapias psicológicas en cuanto a la prevención del TEPT y otros resultados emocionales, conductuales y de salud mental negativos en los niños y adolescentes expuestos a un evento traumático?
• ¿Qué terapias psicológicas son las más efectivas?
• ¿Las terapias psicológicas son más efectivas que las terapias farmacológicas u otros tratamientos?
¿Qué estudios se incluyeron en la revisión?
Los autores de la revisión buscaron en las bases de datos hasta mayo 2015 para encontrar todos los ensayos relevantes. Para estar incluidos en la revisión, los estudios tenían que ser ensayos controlados aleatorios y tenían que incluir tanto a niños como a adolescentes expuestos a un trauma.
Se incluyeron 51 ensayos con un total de 6201 participantes. Los participantes habían estado expuestos al abuso sexual en 12 ensayos, a la guerra o la violencia en la comunidad en diez, al trauma físico y al desastre natural en seis ensayos y a la violencia interpersonal en tres. En un ensayo los participantes habían padecido una enfermedad potencialmente mortal o habían sido abusados o maltratados físicamente. Los participantes de los ensayos restantes habían estado expuestos a diversos traumas.
La mayoría de los ensayos comparó la terapia psicológica con una condición de control como tratamiento habitual, lista de espera o ningún tratamiento; otros compararon diferentes terapias psicológicas.
Un total de 43 estudios informó los resultados registrados dentro del primer mes después del tratamiento; 27 estudios informaron los resultados desde un mes hasta un año, y ocho informaron datos durante un año o más después del tratamiento.
¿Qué establecen las pruebas presentadas en la revisión?
Los niños y adolescentes que recibieron terapias psicológicas presentaron una probabilidad menor de ser diagnosticados con TEPT y tuvieron menos síntomas de TEPT hasta un mes después del tratamiento en comparación con los que recibieron ningún tratamiento, tratamiento habitual o estuvieron en lista de espera. La confianza en estos resultados es limitada debido a que la calidad general de las pruebas fue muy baja a baja. No hubo pruebas sobre la efectividad de las terapias psicológicas más allá de un mes. Hubo pruebas de calidad moderada de que la terapia cognitivoconductual (TCC) podría ser más efectiva para reducir los síntomas del TEPT en comparación con otras terapias psicológicas durante hasta un mes. No se informaron efectos adversos. No hubo ningún estudio que comparara las terapias psicológicas con tratamiento farmacológico.
¿Qué debería suceder a continuación?
Los investigadores deben realizar ensayos de alta calidad para evaluar aún más la efectividad de las terapias psicológicas para los niños y adolescentes expuestos al trauma. Estos ensayos deben estar diseñados para asegurar que los participantes y las familias no conozcan si están recibiendo terapia psicológica, en particular cuando las medidas son completadas por los participantes o sus padres. Además, deben realizarse esfuerzos para asegurar tasas altas de seguimiento más allá de un mes después de la finalización del tratamiento.
Asimismo, los estudios deben comparar diferentes tipos de terapia psicológica para ofrecer una mejor indicación de si los niños y adolescentes expuestos a diferentes tipos de trauma presentan más o menos probabilidades de responder a estas terapias.
Conclusiones de los autores
Summary of findings
| Patient or population: children and adolescents exposed to trauma | ||||||
| Outcomes | Anticipated absolute effects* (95% CI) | Relative effect | Number of participants | Quality of the evidence | Comments | |
| Risk with control (short‐term) | Risk with all psychotherapies | |||||
| PTSD diagnosis | Study population | OR 0.51 | 874 | ⊕⊝⊝⊝ | ||
| 367 per 1000 | 228 per 1000 | |||||
| Moderate | ||||||
| 345 per 1000 | 212 per 1000 | |||||
| PTSD total symptoms | Mean PTSD total symptoms in the intervention group 0.42 standard deviations undefined fewer (0.61 fewer to 0.24 fewer) | Moderate effect size | 2051 | ⊕⊕⊝⊝ | ||
| *The risk in the intervention group (and its 95% confidence interval) is based on assumed risk in the comparison group and relative effect of the intervention (and its 95% CI) | ||||||
| GRADE Working Group grades of evidence | ||||||
| aParticipants are likely to have been aware of whether they received the active or inactive intervention in all studies, and diagnosis was based on self reported measures in 2 studies dParticipants were likely to have been aware of whether they received active or inactive intervention in all but one study, and scores were based on self reported measures in 10 studies eSubstantial heterogeneity between different types of psychological therapy (I2 = 71%) | ||||||
| Patient or population: children and adolescents exposed to trauma | ||||||
| Outcomes | Anticipated absolute effects* (95% CI) | Relative effect | Numer of participants | Quality of the evidence | Comments | |
| Risk with other therapies (short‐term) | Risk with CBT | |||||
| PTSD diagnosis | Study population | OR 0.74 | 160 | ⊕⊝⊝⊝ | ||
| 141 per 1000 | 108 per 1000 | |||||
| Moderate | ||||||
| 111 per 1000 | 85 per 1000 | |||||
| PTSD total symptoms | Mean PTSD total symptoms in the intervention group 0.24 standard deviations undefined fewer (0.42 fewer to 0.05 fewer) | Small effect size | 466 | ⊕⊕⊕⊝ | ||
| *The risk in the intervention group (and its 95% confidence interval) is based on assumed risk in the comparison group and relative effect of the intervention (and its 95% CI) | ||||||
| GRADE Working Group grades of evidence | ||||||
| aParticipants are likely to have been aware of whether they received active or inactive intervention in both studies, and diagnosis was based on self reported measures in both cParticipants are likely to have been aware of whether they received active or inactive intervention in all studies, and scores were based on self reported measures in 4 studies | ||||||
Antecedentes
Descripción de la afección
Los niños y adolescentes expuestos al trauma están en alto riesgo de trastorno de estrés postraumático (de TEPT) y otros resultados emocionales, conductuales y de salud mental negativos. Aunque los cálculos de la prevalencia del TEPT en los niños y adolescentes que han experimentado un trauma varían, la mayoría de los estudios ha informado una prevalencia de un 30% a un 40% (AACAP 1998; Fletcher 2003; McNally 1996; Saigh 1996), y un metanálisis de 34 estudios de 2697 niños y adolescentes expuestos a eventos traumáticos (Fletcher 2003) informó una prevalencia general de un 36%. La prevalencia del TEPT parece variar con diversos factores, como el tipo de trauma, la frecuencia y la gravedad de la exposición y el tiempo desde el evento traumático (Carr 2004; Donnelly 2002; Fletcher 2003; Foy 1996; Yule 2001). Estudios múltiples han identificado comorbilidades entre el TEPT y otros trastornos psiquiátricos, que incluyen depresión y trastornos de ansiedad, trastornos de externalización, abuso de sustancias e ideación suicida (AACAP 1998; APA 2000; Donnelly 2002; Perrin 2000).
Los síntomas característicos del TEPT incluyen nueva experiencia del trauma (como recuerdos recurrentes o pesadillas), evitación de estímulos asociados con el trauma y aumento de la excitación y la reactividad (APA 2000; WHO 1990). Según los criterios del Diagnostic and Statistical Manual of Mental Disorders, 4th Edition, Text Revision (DSM‐IV‐TR) para un diagnóstico de TEPT, los síntomas deben estar presentes durante al menos un mes y deben causar dificultades o deterioros clínicamente significativos en áreas sociales, ocupacionales u otras áreas importantes de la función (APA 2000). Los tipos de eventos traumáticos que pueden causar TEPT incluyen desastres naturales y producidos por el hombre, guerras, abuso físico o sexual, violencia hacia uno mismo o hacia otros, exposición a actos suicidas, lesión grave y enfermedades potencialmente mortales como cáncer o quemaduras graves (AACAP 1998; APA 2000; Parry‐Jones 1995).
Descripción de la intervención
Para los niños que han estado expuestos a un trauma, las terapias psicológicas están orientadas a prevenir la aparición de síntomas relacionados con el trauma o el TEPT (Forman‐Hoffman 2013). Aunque se utiliza una diversidad de terapias psicológicas con los pacientes expuestos a un trauma (ver Cómo puede funcionar la intervención), la mayoría de las terapias se basa en uno o más elementos comunes. Los mismos pueden incluir elementos psicoeducativos, que pueden ayudar a los niños o adolescentes traumatizados a normalizar las reacciones del TEPT; elementos psicodinámicos, que pueden ayudarles a procesar el trauma emocionalmente y a adquirir una mejor comprensión de su significado para ellos; elementos de exposición, que pueden desensibilizarlos a los recuerdos relacionados con el trauma; elementos cognitivos‐conductuales, que les ayudan a replantear los supuestos y las reacciones al evento traumático; y elementos o aptitudes de afrontamiento, como la solución de problemas, la planificación de la seguridad y el control de la ansiedad (AACAP 2010; Carr 2004; Robertson 2004; Sones 2011). La inclusión de los padres puede mejorar la efectividad de estas terapias con niños y adolescentes mediante la mejoría del reconocimiento paterno de los síntomas del trauma y la mejoría de su capacidad de ayudar con la dificultad emocional del niño y controlar los problemas de comportamiento relacionados (AACAP 2010). Las terapias psicológicas pueden dirigirse al individuo o pueden ser basadas en grupos, y la frecuencia y la duración del tratamiento pueden variar ampliamente.
De qué manera podría funcionar la intervención
Se han utilizado varios enfoques terapéuticos psicológicos genéricos y específicos para el trauma con objeto de prevenir los resultados negativos entre los niños y adolescentes que han experimentado un trauma. La terapia cognitivoconductual (TCC) desafía los modelos de pensamiento distorsionados negativos asociados con el trauma para ayudar a los pacientes a desarrollar cogniciones y comportamientos más adaptativos (Robertson 2004; Sones 2011). La terapia de exposición se usa para ayudar a los pacientes a superar los síntomas al exponerlos a señales o recuerdos específicos o no específicos relacionados con el trauma (Neuner 2004; Robertson 2004). Debido a que se cree que la fragmentación y la distorsión de los recuerdos y las cogniciones asociadas con el trauma impiden la resolución de los síntomas, la terapia narrativa puede usarse para ayudar al paciente a reconstruir una descripción consistente acerca del trauma (Neuner 2004). Los terapeutas trabajan con individuos en la psicoterapia psicodinámica para ayudarles a desarrollar una mejor comprensión de sus respuestas al trauma y cómo repercute en sus sentimientos, comportamientos y relaciones (AACAP 2010; BluePages 2012; Foa 1997). En la desensibilización y reprocesamiento del movimiento ocular (DRMO), el individuo se centra en una imagen, recuerdo, emoción o cognición molesta asociada con el trauma, mientras el terapeuta inicia movimientos oculares rápidos y voluntarios (Bryant 2001; Robertson 2004). Otras terapias incluyen terapia de apoyo, mediante las cuales los consejeros ofrecen apoyo, escuchan a los pacientes y los ayudan a hablar sobre sus problemas (BluePages 2012); sesiones de debriefing, que permiten el procesamiento o discusión emocional al alentar la evocación, la discusión y reelaboración del evento traumático (Rose 2002); y la terapia familiar, que puede reducir los síntomas psicológicos al centrarse en la mejoría de la comunicación y el funcionamiento familiar (Henken 2007).
Por qué es importante realizar esta revisión
Aunque se ha realizado una revisión Cochrane para examinar la efectividad de las intervenciones psicológicas para los niños y adolescentes diagnosticados con TEPT (Gillies 2012), ninguna revisión Cochrane ha estudiado las terapias psicológicas disponibles para la prevención del TEPT en los niños y adolescentes expuestos al trauma. Por lo tanto, se ha preparado esta revisión Cochrane para tratar la necesidad existente de una revisión sistemática de la efectividad de las terapias psicológicas para la prevención del TEPT y otros resultados negativos en los niños y adolescentes que han experimentado un trauma.
Objetivos
Evaluar los efectos de las terapias psicológicas en cuanto a la prevención del TEPT y los resultados emocionales, conductuales y de salud mental negativos asociados en niños y adolescentes que han experimentado un evento traumático.
Métodos
Criterios de inclusión de estudios para esta revisión
Tipos de estudios
Todos los ensayos controlados aleatorios y cuasialeatorios relevantes. Los estudios cuasialeatorios incluían estudios que usaron métodos de asignación sin asociación evidente con las características de los participantes. Por ejemplo, podían incluir estudios que habían asignado a los participantes sobre la base de la última cifra del número identificador médico o el último número de la fecha de nacimiento.
Todos los ensayos cruzados y los ensayos con asignación al azar por grupos reunieron los requisitos para la inclusión.
Tipos de participantes
Características de los participantes
Se incluyeron estudios de niños o adolescentes, femeninos o masculinos, hasta los 18 años de edad inclusive, que habían estado expuestos a un evento traumático. El trauma se define como un evento en el cual el niño o adolescente experimentó, fue testigo o enfrentó un evento o eventos que involucraron la muerte real o una amenaza de muerte o lesión grave, o una amenaza a la integridad física de la persona propia o de otros y cuya respuesta involucró temor intenso, impotencia u horror, que en los niños pueden expresarse como un comportamiento desorganizado o agitado (APA 2000). El trauma puede incluir desastres naturales o producidos por el hombre, abuso físico o sexual, guerras, violencia y lesión potencialmente mortal.
El criterio primario de la exposición al trauma diferencia esta revisión, que se centra en la efectividad de las terapias psicológicas en cuanto a la prevención del TEPT, de la revisión previamente publicada sobre las terapias psicológicas como tratamiento para los niños y adolescentes con TEPT (Gillies 2012).
Diagnóstico
Aunque el criterio de inclusión para esta revisión fue la exposición a un trauma, los participantes de algunos estudios identificados podrían haber sido diagnosticados con TEPT o podrían haber tenido puntuaciones de los síntomas iniciales que estuvieran por encima de las puntuaciones límite validadas para el TEPT. Por lo tanto, para esta revisión se incluyeron los estudios en los que menos del 50% de los participantes de ambos grupos tenían puntuaciones de los síntomas iniciales por encima de los valores de corte validados, o que presentaban un diagnóstico de TEPT realizado mediante métodos validados. Cuando un 50% o más de los participantes presentaban un diagnóstico de TEPT o tenían puntuaciones iniciales por encima de las puntuaciones límite validadas, los mismos se consideraron estudios de tratamiento y se incluyeron en Gillies 2012 o, si se identificaron de forma reciente, se incluirían en las actualizaciones de Gillies 2012.
Comorbilidades
Se incluyeron estudios de participantes con comorbilidades.
Ámbito del estudio
No se estableció ninguna restricción en el contexto de los estudios.
Datos de subgrupos
Si los niños y adolescentes habían sido asignados por separado, y si los datos para los niños o los adolescentes se informaban como un subgrupo de datos en un estudio que incluía a adultos, se habrían incluido estos datos.
Tipos de intervenciones
Intervenciones experimentales
-
Las categorías principales de terapias psicológicas incluyeron TCC (que incluía componentes tanto cognitivos como conductuales), terapia de exposición, terapia familiar, DRMO, terapia narrativa, terapia psicodinámica (incluida la terapia de juego), intervenciones de psicoeducación inmediata postrauma como sesiones breves (debriefing) y primeros cuidados psicológicos y terapia de apoyo (incluida la orientación no dirigida). Las terapias tenían que usarse principalmente con el niño o adolescente y podían administrarse en cualquier formato incluidas las terapias individuales o grupales aunque también podían incluir a los padres o los padres podían asistir a sesiones paralelas.
Intervenciones de comparación
-
Control (tratamiento habitual, controles en lista de espera o ningún tratamiento).
-
Otra terapia psicológica.
-
Tratamiento farmacológico.
Tipos de medida de resultado
No se requirieron informes de los siguientes resultados para considerar los estudios para la inclusión en esta revisión. Si era evidente que estos resultados no se habían medido (en lugar de no haberse informado) con la revisión de estos estudios, los mismos se excluyeron y se proporcionaron las razones de la exclusión.
Resultados primarios
1. Diagnóstico del trastorno de estrés postraumático determinado por criterios de diagnóstico clínico aceptados como la International Classification of Diseases, Revision 10 (ICD‐10), o el DSM‐IV‐TR.
2. Síntomas de TEPT medido en escalas basadas en los criterios de diagnóstico como ICD‐10 o DSM‐IV‐TR con confiabilidad y validez publicada (p.ej. Children's PTSD Inventory) (Saigh 2000).
Resultados secundarios
3. Gravedad o incidencia de síntomas de ansiedad (p.ej. State‐Trait Anxiety Inventory for Children) (Spielberger 1973).
4. Gravedad o incidencia de síntomas depresivos (p.ej. Children's Depression Inventory) (Kovacs 1992).
5. Gravedad o incidencia de problemas conductuales (p.ej. Child Behavior Checklist) (Achenbach 1983).
6. Función (p.ej. Children's Global Assessment Scale) (Schaffer 1983).
7. Calidad de vida (p.ej., Pediatric Quality of Life Inventory, versión 4.0) (Varni 2001).
8. Cualquier evento adverso incluido el daño autoinfligido o la conducta suicida.
9. Coste.
10. Loss to follow‐up.
Escalas de resultado
Se incluyeron datos de resultado sólo si se informaba que la escala o el cuestionario eran válidos y fiables en una revista arbitrada por pares. Cuando se recopilaron datos utilizables para un resultado particular de diferentes fuentes (es decir síntomas de TEPT informados por el niño y el padre en Celano 1996; Danielson 2012; Jaberghaderi 2004; Kemp 2010 y Schottelkorb 2012), se usaron los datos que mostraban las tasas de respuesta más altas. Si el seguimiento era el mismo para todos los evaluadores, se prefirió utilizar las escalas clínicas debido a que las mismas se basaban en la entrevista por parte del médico con el niño y el padre, lo cual es considerado por los grupos de expertos como la forma más válida de evaluación (AACAP 1998).
Momento de la evaluación del resultado
Los datos se analizaron como a corto plazo (hasta e incluido un mes luego de la finalización de la terapia), a plazo medio (entre un mes y un año luego de la terapia) y a largo plazo (un año o más).
Jerarquía de las medidas de resultado
Cuando hubo dos o más grupos de datos disponibles para cualquiera de estos períodos, se utilizó el primer grupo de datos. Por ejemplo, si los datos de seguimiento se informaron a los tres meses y a los seis meses, se usaron los datos del período de seguimiento de tres meses.
Results
Description of studies
Results of the search
From 172 study records, we identified 116 studies for review (see Figure 1 for Search flow diagram), included 51 studies (88 citations) with a total of 6201 participants (see Characteristics of included studies) and excluded 46 studies (59 records) (Characteristics of excluded studies). We have not yet assessed 14 studies, three because they require translation and the remainder because data were not available at the time of writing the review (Characteristics of studies awaiting classification); we also identified five ongoing studies (Characteristics of ongoing studies).
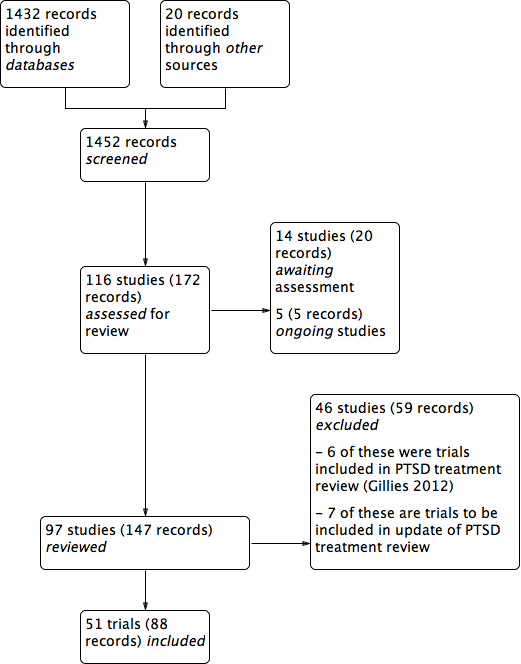
PRISMA study flow diagram.
Included studies
See Characteristics of included studies.
Ten included studies were cluster‐randomised controlled trials. Berger 2009, Berger 2012, Berliner 1996, Qouta 2012 and Shechtman 2010 randomised classes; Tol 2008, Tol 2012 and Tol 2014 randomised schools; Barron 2013 randomised counsellors; and Overbeek 2013 randomised children and family therapists. All other included studies randomised participants to interventions.
Settings
Most (27) included trials were done in the United States (Baker 1985; Berkowitz 2011; Berliner 1996; Carbonell 1999; Carrion 2013; Celano 1996; Chapman 2001; Chemtob 2002; Cohen 1996; Cohen 2005; Cohen 2011; Danielson 2012; Deblinger 1996; Deblinger 2001; Deblinger 2011; Dominguez 2001; Glodich 2000; Kazak 2004; Lieberman 2005; Pace 2013; Raider 2008; Salloum 2008; Salloum 2012; Shirk 2014; Stein 2003; Taussig 2010); three in the the Democratic Republic of Congo (O'Callaghan 2013; O'Callaghan 2014; McMullen 2013); two each were carried out in Australia (Cox 2010; Kemp 2010),Israel (Berger 2012; Shechtman 2010), the Netherlands (Diehle 2014; Overbeek 2013), Palestine (Barron 2013; Qouta 2012), Sri Lanka (Berger 2009; Tol 2012) and the UK (Stallard 2006; Trowell 2002). One study each was done in Bosnia (Layne 2008), Burundi (Tol 2014), Canada (Farkas 2010), Indonesia (Tol 2008), Iran (Jaberghaderi 2004), Jordan (Damra 2014), Peru (Church 2012), Sierra Leone (Betancourt 2014) and Switzerland (Zehnder 2010).
Participants
Included studies consisted of 6201 participants, and the number in each trial ranged from 16 (Church 2012; Jaberghaderi 2004) to 482 (Qouta 2012).
Ages of participants ranged from two to 24 years. Twenty trials included children only (Berliner 1996; Carbonell 1999; Celano 1996; Chemtob 2002; Damra 2014; Deblinger 1996; Deblinger 2001; Deblinger 2011; Jaberghaderi 2004; Kemp 2010; Overbeek 2013; Qouta 2012; Salloum 2008; Salloum 2012; Schottelkorb 2012; Stein 2003; Taussig 2010; Tol 2008; Tol 2012; Tol 2014), and 18 trials included both children and adolescents (Barron 2013; Berger 2009; Berkowitz 2011; Carrion 2013; Chapman 2001; Church 2012; Cohen 2005; Cohen 2011; Cox 2010; Diehle 2014; Dominguez 2001; Kazak 2004; O'Callaghan 2013; O'Callaghan 2014; Shechtman 2010; Stallard 2006; Trowell 2002; Zehnder 2010). Nine trials included only adolescents (Baker 1985; Berger 2012; Danielson 2012; Farkas 2010; Glodich 2000; Layne 2008; Pace 2013; Raider 2008; Shirk 2014) and two preschool children only (Cohen 1996; Lieberman 2005). Betancourt 2014 included adolescents and young adults, but because the mean age of participants was 18 years, we included this study.
In 12 trials, the targeted trauma was sexual abuse (Baker 1985; Berliner 1996; Celano 1996; Cohen 1996; Cohen 2005; Danielson 2012; Deblinger 1996; Deblinger 2001; Deblinger 2011; Dominguez 2001; Jaberghaderi 2004; Trowell 2002). Participants were exposed to war or community violence in ten trials (Betancourt 2014; Glodich 2000; Layne 2008; O'Callaghan 2014; McMullen 2013; Qouta 2012; Stein 2003; Tol 2008; Tol 2012; Tol 2014); physical trauma (Berkowitz 2011; Chapman 2001; Cox 2010; Kemp 2010; Stallard 2006; Zehnder 2010) and natural disaster in six trials each (Barron 2013; Berger 2009; Berger 2012; Chemtob 2002; Salloum 2008; Salloum 2012); and interpersonal violence in three (Cohen 2011; Lieberman 2005; Overbeek 2013); and had suffered a life‐threatening illness (Kazak 2004), had been physically abused (Damra 2014) or were maltreated (Taussig 2010) in one trial each. Participants in the remaining trials were exposed to a range of traumas (Carbonell 1999; Carrion 2013; Church 2012; Diehle 2014; Farkas 2010; O'Callaghan 2013; Pace 2013; Raider 2008; Schottelkorb 2012; Shechtman 2010; Shirk 2014). Participants were frequently exposed to more than one type of trauma in most trials.
Fifteen studies included participants on the basis of some measure of post‐trauma symptoms or reported baseline symptoms. To be included, participants needed a score of at least 12 on the Post‐Traumatic Stress Disorder Index (PTSD‐I) in Chapman 2001, a score of at least 7 on the Weekly Behaviour Report in Cohen 1996, at least one post‐traumatic symptom in Berkowitz 2011, significant symptoms in Cohen 2005, at least five symptoms with one from each cluster in Cohen 2011 and Deblinger 2011, clinical symptoms of PTSD in Damra 2014, at least three symptoms including at least one re‐experiencing or avoidance symptom in Deblinger 1996 and full or partial PTSD (although 5/32 had no diagnosis of PTSD) in Diehle 2014, or they had to be one of 10 students with the highest Children's Revised Impact of Events Scale (CRIES) scores in each class in Barron 2013. Mean baseline Post‐Traumatic Stress Disorder Reaction Index (PTSD‐RI) item scores were 0.68 in the therapies group and 0.77 in the control group in Betancourt 2014, PTSD‐RI total scores ranged from 22.70 to 25.80 in Carrion 2013, and mean Impact of Events Scale (IES) score was 34.2 in Church 2012. A ‘chart diagnosis’ was recorded for 81% of participants in Berliner 1996, and 88% met self reported Diagnostic and Statistical Manual, Fourth Edition (DSM‐IV) criteria for PTSD in Chemtob 2002.
Interventions
Most included trials compared a psychological therapy versus control (i.e. wait list, treatment as usual or no treatment). The psychological therapy was categorised predominantly as CBT in 17 trials (Barron 2013; Berger 2009; Berger 2012; Betancourt 2014; Carrion 2013; Damra 2014; Deblinger 1996; Layne 2008; O'Callaghan 2013; McMullen 2013; Pace 2013; Qouta 2012; Shirk 2014; Stein 2003; Tol 2008; Tol 2012; Tol 2014); as family therapy in four trials (Danielson 2012; Kazak 2004; Lieberman 2005; Raider 2008); as debriefing (Chapman 2001; Stallard 2006; Zehnder 2010) and psychoeducation/skills training (Cox 2010; Glodich 2000; O'Callaghan 2014) in three trials each; as narrative therapy (Carbonell 1999; Salloum 2012), supportive therapy (Shechtman 2010; Taussig 2010) and EMDR (Farkas 2010; Kemp 2010) in two trials each; and as exposure (Church 2012) or CBT plus narrative therapy (O'Callaghan 2013) in one trial each. Although these trials were broadly categorised under these therapies, several psychotherapeutic elements were common to a range of therapies. In particular, psychoeducation and coping skills were common to most interventions.
Among trials that compared one form of therapy versus another, eight compared CBT with supportive therapy (Berkowitz 2011; Celano 1996; Cohen 1996; Cohen 2005; Cohen 2011; Deblinger 2001; Dominguez 2001; Overbeek 2013), two compared CBT with EMDR (Diehle 2014; Jaberghaderi 2004) and one compared CBT with psychodynamic therapy (Schottelkorb 2012). Berliner 1996 compared exposure plus supportive therapy with supportive therapy only, and Deblinger 2011 compared narrative therapy plus CBT with CBT alone.
Five trials compared different models of delivery for psychological therapies. Four trials compared individual delivery of a psychological therapy versus group delivery of the same therapy (Baker 1985; Chemtob 2002; Salloum 2008; Trowell 2002), and Deblinger 1996 compared CBT for children only versus CBT for both mothers and children.
Three trials used a single intervention session (Chapman 2001; Stallard 2006; Zehnder 2010), and the remaining trials used between four and 40 therapy sessions but most commonly 10 to 15 sessions of 45 minutes to two hours, usually on a weekly basis. Interventions were delivered in a group setting in 20 trials (Barron 2013; Berger 2009; Berger 2012; Berliner 1996; Betancourt 2014; Carbonell 1999; Deblinger 2001; Glodich 2000; Kazak 2004; Layne 2008; O'Callaghan 2013; O'Callaghan 2014; Overbeek 2013; Pace 2013; Qouta 2012; Shechtman 2010; Stein 2003; Tol 2008; Tol 2012; Tol 2014).
Eleven trials were based on individual sessions with children (Carrion 2013; Chapman 2001; Church 2012; Diehle 2014; Dominguez 2001; Farkas 2010; Jaberghaderi 2004; Kemp 2010; Schottelkorb 2012; Shirk 2014; Stallard 2006), eight used a combination of individual and group delivery modes (Baker 1985; Chemtob 2002; McMullen 2013; Raider 2008; Salloum 2008; Salloum 2012; Taussig 2010; Trowell 2002) and one used a Web‐based intervention (Cox 2010). All other therapies involved parents or caregivers. Most of these were individual sessions that included parents for at least part of the therapy (Berkowitz 2011; Celano 1996; Cohen 1996; Deblinger 2011; Lieberman 2005; Zehnder 2010) or run in parallel with child and parent (Cohen 2005; Damra 2014) or consisted of both joint and parallel sessions (Cohen 2011; Danielson 2012; Deblinger 1996). Overbeek 2013 ran parallel group sessions for children and parents, and Qouta 2012 ran groups that included both.
Outcomes
Children and adolescents were diagnosed with PTSD on the basis of the Anxiety Disorder Interview Schedule for DSM‐IV (ADIS‐P; Diehle 2014), the Clinician Administered PostTraumatic Stress Disorder Scale for Children (Stallard 2006), the Diagnostic Interview Schedule for Children (Farkas 2010), the Semi Structured Interview for Diagnostic Classification (Lieberman 2005) and the Kiddie Schedule for Affective Disorders and Schizophrenia for school‐aged children ‐ Epidemiologic version (K‐SADS‐E; Deblinger 1996). They were also considered to have PTSD if they had a score of 3 or higher on one item of the University of California, Los Angeles (UCLA) PTSD Index (Berger 2009; Berger 2012), a total score of 38 or higher on the UCLA PTSD Index (Salloum 2008; Salloum 2012) or a score of 17 or higher on the intrusion/avoidance subscales of the Children's Revised Impact of Events Scale (CRIES)‐13 (Barron 2013).
The most frequently used measure for PTSD symptoms was the UCLA PTSD Index (Berger 2009; Betancourt 2014; Carrion 2013; Chapman 2001; Cohen 2011; Danielson 2012; Kazak 2004; Layne 2008; McMullen 2013; O'Callaghan 2013; Salloum 2008; Salloum 2012; Schottelkorb 2012) or the earlier version, the Child Post‐Traumatic Stress Reaction Index (Kemp 2010; Shechtman 2010), followed by the Trauma Symptom Checklist for Children (Berkowitz 2011; Cohen 2005; Cox 2010; Farkas 2010; Overbeek 2013; Raider 2008; Taussig 2010) or the Trauma Symptom Checklist for Young Children (Overbeek 2013); the Impact of Events Scale ‐ Revised (Church 2012; Cox 2010; Glodich 2000; Kazak 2004) or the earlier Impact of Traumatic Events Scale (Dominguez 2001; Kemp 2010; Stallard 2006); the K‐SADS‐E (Deblinger 1996; Deblinger 2001) and the K‐SADS ‐ Present and Lifetime (PL) version (Deblinger 2011; Shirk 2014; Trowell 2002); and the Child PTSD Symptoms Scale (Stein 2003; Tol 2008; Tol 2012; Tol 2014). Trauma symptoms were also measured by the CRIES‐13 (Barron 2013; Celano 1996; Diehle 2014; Qouta 2012) or revised version (CRIES‐8; O'Callaghan 2013); the Clinician Administered PTSD Scale (CAPS‐CA; Diehle 2014; Zehnder 2010); the Child Report of Post‐Traumatic Symptoms and the Parent Report of Post‐Traumatic Symptoms (Jaberghaderi 2004; Schottelkorb 2012); the Kauai Recovery Index (Chemtob 2002); Post‐Traumatic Stress Symptoms in Children (PTSS‐C; Damra 2014); and the Semi Structured Interview for Diagnostic Classification 0 to 3 (Lieberman 2005).
For depression, most used the Children's Depression Inventory (Berliner 1996; Carrion 2013; Cohen 2005; Cohen 2011; Damra 2014; Danielson 2012; Deblinger 1996; Deblinger 2011; Dominguez 2001; Overbeek 2013; Stein 2003; Zehnder 2010), followed by the Depression Self Rating Scale (Barron 2013; Layne 2008; Qouta 2012; Stallard 2006; Tol 2008; Tol 2012; Tol 2014). Other trials used the Beck Depression Inventory (Berger 2009; Shirk 2014); the Birleson Depression Inventory (Stallard 2006); the Children’s Depression Scale (Kemp 2010); the Institute for Personality and Ability Testing Depression Scale (Baker 1985); the Mood and Feelings Questionnaire (Salloum 2008; Salloum 2012); Orvaschel's PTSD scale (Trowell 2002); the Trauma Symptom Checklist for Children‐A (TSCC‐A; Cox 2010; Farkas 2010); and the Quick Inventory of Depressive Symptomatology (Pace 2013). Depression was diagnosed by a score of 29 or higher on the Mood and Feelings Questionnaire in Salloum 2008 and Salloum 2012 or on the K‐SADS‐PL (Shirk 2014).
The scales most frequently used to measure anxiety were the Revised Children's Manifest Anxiety Scale (Berliner 1996; Carrion 2013; Kazak 2004; Shechtman 2010; Stallard 2006), the State‐Trait Anxiety Inventory for Children (Cohen 2005; Deblinger 1996; Kemp 2010); the Screen for Child Anxiety Related Emotional Disorders (SCARED; Berger 2012; Cohen 2011; Tol 2008; Tol 2012); and the Trauma Symptom Checklist for Children (Berkowitz 2011; Cox 2010; Farkas 2010). Anxiety was also measured with the Institute for Personality and Ability Testing Anxiety Scale (Baker 1985); the Revised Child Anxiety and Depression Scale (Diehle 2014); the Multidimensional Anxiety Scale for Children (Deblinger 2011); and the State‐Trait Anxiety Inventory (Pace 2013).
Most trials measured behaviour with the Child Behavior Checklist (Berliner 1996; Celano 1996; Cohen 1996; Cohen 2005; Deblinger 1996; Deblinger 2001; Deblinger 2011; Farkas 2010; Kemp 2010; Lieberman 2005; Overbeek 2013; Salloum 2012; Shirk 2014; Zehnder 2010). Other measures of behaviour included the Strengths and Difficulties Questionnaire (SDQ; Barron 2013; Diehle 2014; Stallard 2006; Tol 2012); the Behavioral Assessment System for Children (BASC‐2; Danielson 2012); the Children’s Aggression Scale for Parents (Tol 2008); internalising and externalising items from the Oxford Measure of Psychosocial Adjustment (Betancourt 2014); the Teacher’s Report Form (Overbeek 2013); the Teacher‐Child Rating Scale (Stein 2003); the Youth Self‐Report (Glodich 2000; Raider 2008); and the African Youth Psychosocial Assessment (McMullen 2013; O'Callaghan 2013; O'Callaghan 2014).
Psychosocial function was measured by the Children's Global Assessment Scale (Celano 1996); the Kiddie Global Assessment Scale (Trowell 2002); the Pediatric Symptom Checklist (Stein 2003); and the Word Health Organization (WHO) Disability Adjustment Scale (Betancourt 2014). Functional impairment was measured by the Child Diagnostic Interview Schedule in Berger 2012 and by a scale developed by study authors in Tol 2008, Tol 2012 and Tol 2014.
Quality of life was measured by the Life Satisfaction Survey in Taussig 2010.
Cost in Great Britain pounds was reported in Trowell 2002.
Most studies (42) reported outcomes recorded within the first month after treatment; 27 studies reported outcomes from one month up to a year, and eight reported data for a year or longer after completion of treatment.
Data that could not be added to the meta‐analysis
Data from six studies could not be used because loss to follow‐up was greater than 50% for at least one group. Data included post‐treatment function in Celano 1996, PTSD symptoms and behaviour at three and 12 months in Deblinger 1996, symptoms of PTSD and depression at four months in Layne 2008 and all post‐treatment outcomes in Carrion 2013. Other than behaviour post treatment in Cohen 1996, loss to follow‐up was greater than 50% in the supportive therapy group at six and 12 months in Cohen 1996 and for all intervals in Cohen 2005.
Data from three studies could not be used in meta‐analyses because the required data were not reported and could not be calculated or obtained from study authors. Sample numbers were not clear in Chemtob 2002, and outcomes were reported as the intercept and the slope of a growth curve in Dominguez 2001; no variance was given in Chapman 2001.
Data from two studies could not be used in meta‐analyses because they showed substantial evidence of skew. Standard deviations were greater than mean PTSD scores for all groups in Deblinger 2001 and greater than all PTSD subscores in Cox 2010.
Data from three studies (Church 2012; Damra 2014; McMullen 2013) are reported separately (Table 1; Table 2; Table 3) because the effect size in all studies was several times higher than the overall estimate and contributed from 45% to 90% heterogeneity if they were added to meta‐analyses.
| Outcome | Group | n | Mean | SD |
| PTSD symptoms One month | Exposure therapy | 8 | 3.38 | 2.60 |
| Control | 8 | 31.38 | 3.84 | |
| Avoidance One month | Exposure therapy | 8 | 2.88 | 2.62 |
| Control | 8 | 20.25 | 2.38 | |
| Intrusion One month | Exposure therapy | 8 | 0.50 | 0.50 |
| Control | 8 | 11.13 | 2.93 |
| Outcome | Group | n | Mean | SD |
| PTSD symptoms Post therapy | TF‐CBT | 9 | 13.00 | 1.12 |
| Control | 9 | 24.20 | 1.54 | |
| PTSD symptoms 4 months | TF‐CBT | 9 | 11.88 | 1.96 |
| Control | 9 | 23.98 | 1.47 |
| Outcome | Group | n | Mean | SD |
| PTSD symptoms Post therapy | TF‐CBT | 24 | 10.6 | 4.5 |
| Control | 24 | 34.8 | 11.6 | |
| Conduct Problems Post therapy | TF‐CBT | 24 | 0.7 | 0.9 |
| Control | 24 | 7.1 | 7.0 |
Excluded studies
See Characteristics of excluded studies.
We excluded 46 studies, but six of these (Catani 2009; Cohen 2004; Ertl 2011; King 2000; Ruf 2010; Schauer 2008) were included in the Cochrane review on psychological therapies for treatment of PTSD in children and adolescents (Gillies 2012), and seven will be reviewed in the update (Chen 2014; Jacob 2014; Jensen 2014; Murray 2015; Rosner 2014; Ruf 2012; Soltanifar 2012).
We obtained full copies of the remaining 33 studies, as it was not clear from the available title or abstract whether they would meet the inclusion criteria. We excluded most because allocation was not randomised (Burke 1988; Ehntholt 2005; Gellman 2001; Goenjian 1997; Jeffres 2004; Kenardy 2008; Krueger 2013; Pfeffer 2002; Shooshtary 2008; Thabet 2005; Wang 2011; Wolmer 2011a; Wolmer 2011b) or study participants were not screened for exposure to trauma (Berger 2007; Bolton 2007; Cooley‐Strickland 2011; Gelkopf 2009; Hardin 2002; Jordans 2010; Rubin 2001; Wang 2011). Less than 50% of participants in the intervention group were randomised in Scheeringa 2011, the average age of participants was 19 years in Schaal 2009, no comparison group was included in Goenjian 1997 and Shelby 1995, the intervention was not a psychological therapy in Kassam‐Adams 2011 and Phipps 2012 and was used with mothers only in Dybdahl 2001 and follow‐up was only 10% in Saxe 2012 and 25% in the control group in Pfeffer 2002. Data were not reported and could not be obtained for Ensink 2004 and McWhirter 2011, and no data for the control group could be obtained for Kataoka 2003. Lyshak‐Stelzer 2007 was an interim publication of a trial that had already reported very high loss to follow‐up.
Studies awaiting classification
Fourteen studies are awaiting assessment (see Characteristics of studies awaiting classification). We have not yet assessed three randomised controlled trials (RCTs) as translations of these findings are not yet available (Mahmoudi‐Gharaei 2006; Narimani 2013,Shen 2012). The remainder have not been assessed as data were not available at the time of writing this review.
In contrast to our included studies, which were mostly done in the United States, the studies awaiting assessment were conducted in African countries including Burundi (Crombach 2012), Northern Uganda (Elbert 2009); and South Africa (Elbert 2013), Australia (Ooi 2010), China (Shen 2012; Zang 2013), Iran (Mahmoudi‐Gharaei 2006; Narimani 2013), Sweden (Hultmann 2012), Switzerland (Kramer 2014), and the UK (Jessiman 2013), with three in the United States (Kassam‐Adams 2016; Rowe 2013; Ruggiero 2015).
Participants had been affected by natural disasters (Mahmoudi‐Gharaei 2006; Rowe 2013; Shen 2012; Zang 2013); by war (Elbert 2009; Ooi 2010); by interpersonal abuse (Jessiman 2013; Hultmann 2012); by physical illness or injury (Kramer 2014;Ruggiero 2015;Kassam‐Adams 2016); unspecified traumatic events (Elbert 2009; Narimani 2013); or were violent offenders who had been exposed to traumatic stress (Elbert 2013).
Controls were compared to CBT (Hultmann 2012; Ooi 2010; Mahmoudi‐Gharaei 2006; Narimani 2013); guided narrative technique (Crombach 2012; Elbert 2009; Elbert 2013; Zang 2013); 'Letting the Future in' for children affected by sexual abuse (Jessiman 2013); a debriefing, psychoeducation and coping intervention (Kramer 2014); and expressive group counselling (Shen 2012). Controls were also compared to two web‐based interventions, ‘Coping Coach’ (Kassam‐Adams 2016) and ‘Bounce Back’ (Ruggiero 2015). The other studies compared different psychological therapies: Elbert 2013 compared FORNET, a narrative exposure therapy, to CBT; and Rowe 2013 compared group‐based CBT to family therapy. Mahmoudi‐Gharaei 2006 compared CBT to CBT plus art and sport interventions, and an art and sport intervention alone.
Ongoing studies
We identified five ongoing RCTs (see Characteristics of ongoing studies). These are being conducted in Kenya or Tanzania (Dorsey 2012), Australia (Sansom‐Daly 2012), the Netherlands (Roos 2013) and the United States (Belcher 2009; Toth 2011).
Participants had one or both parents die (Dorsey 2012); were exposed to neglect (Belcher 2009) or maltreatment (Toth 2011); had recently completed cancer treatment (Sansom‐Daly 2012); or had been exposed to a single traumatic event (Roos 2013).
Interventions compared with controls in ongoing trials include trauma‐focused CBT (Dorsey 2012) and family‐based therapy (Belcher 2009). Three ongoing trials are comparing different psychological therapies: 'Recapture Life’, an online group‐based CBT, is being compared with online supportive therapy (Sansom‐Daly 2012); EMDR to cognitive‐behavioural writing therapy (Roos 2013); and interpersonal therapy to enhanced care (Toth 2011).
Risk of bias in included studies
For graphical representations of the overall risk of bias in included trials, see Figure 2 and Figure 3.

Risk of bias summary: review authors' judgements about each risk of bias item for each included study.
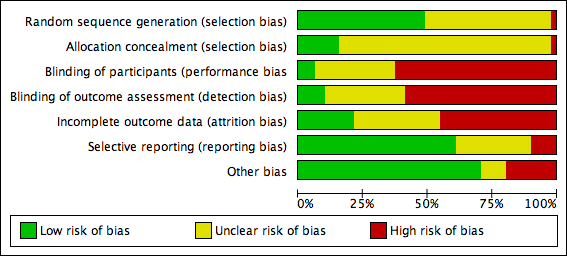
Risk of bias graph: review authors' judgements about each risk of bias item presented as percentages across all included studies.
Allocation
Barron 2013 was considered to have high risk of selection bias because even though counsellors were randomised, they then identified participant classes. The generation of a randomisation sequence was described and was considered to lead to low risk of bias in 25 trials (Baker 1985; Berger 2009; Berger 2012; Berkowitz 2011; Berliner 1996; Betancourt 2014; Chemtob 2002; Cohen 1996; Cohen 2005; Cohen 2011; Cox 2010; Danielson 2012; Deblinger 2001; Diehle 2014; Glodich 2000; Jaberghaderi 2004; McMullen 2013; O'Callaghan 2013; O'Callaghan 2014; Overbeek 2013; Pace 2013; Salloum 2012; Schottelkorb 2012; Stallard 2006; Stein 2003) and to unclear risk in the remainder.
Barron 2013 was also considered at high risk because of allocation concealment based on selection of participant classes. Eight included trials (Berliner 1996; Cohen 2011; Diehle 2014; O'Callaghan 2013; O'Callaghan 2014; Overbeek 2013; Stallard 2006; Stein 2003) were considered to have low risk. Allocation concealment was not described in the remaining 42 trials, which therefore were rated as having unclear risk.
Blinding
Participants were likely to be aware of whether they had been assigned to an intervention group or a control group in 32 trials (Barron 2013; Berger 2009; Berger 2012; Betancourt 2014; Carbonell 1999; Carrion 2013; Chapman 2001; Chemtob 2002; Church 2012; Cox 2010; Damra 2014; Danielson 2012; Deblinger 1996; Farkas 2010; Glodich 2000; Kazak 2004; Kemp 2010; Lieberman 2005; McMullen 2013; O'Callaghan 2013; O'Callaghan 2014; Pace 2013; Qouta 2012; Raider 2008; Shechtman 2010; Stallard 2006; Stein 2003; Taussig 2010; Tol 2008; Tol 2012; Tol 2014; Zehnder 2010); therefore, these were rated as having high risk of performance bias. Participants in both groups received therapy in Diehle 2014, Overbeek 2013 and Shirk 2014, and these studies were rated as having low risk. All other trials were rated as having unclear risk of performance bias.
Primary outcomes were self reported in most studies (30) in which participants were probably aware of whether they received an intervention; these studies were rated as having high risk of detection bias (Barron 2013; Berger 2009; Berger 2012; Betancourt 2014; Carbonell 1999; Carrion 2013; Chapman 2001; Chemtob 2002; Church 2012; Cox 2010; Damra 2014; Danielson 2012; Deblinger 1996; Farkas 2010; Glodich 2000; Kazak 2004; Kemp 2010; McMullen 2013; O'Callaghan 2013; O'Callaghan 2014; Pace 2013; Qouta 2012; Raider 2008; Shechtman 2010; Stein 2003; Taussig 2010; Tol 2008; Tol 2012; Tol 2014; Zehnder 2010). Trials were rated as having low risk of bias when blinded assessment of primary outcomes was described (Lieberman 2005; Shirk 2014; Stallard 2006), and when studies that used self reported primary measures provided therapy to both groups (Diehle 2014; Overbeek 2013). Risk was rated as unclear in the remaining 15 studies.
Incomplete outcome data
Risk of attrition bias was low in 10 studies. Berger 2009, Berger 2012, Church 2012 and Damra 2014 reported no apparent loss to follow‐up, and loss to follow‐up was less than 5% in Tol 2012 and Zehnder 2010. Loss to follow‐up in Betancourt 2014, Danielson 2012, O'Callaghan 2014 and Tol 2008 was between 5% and 15%, but imputed values were used to account for missing data.
Other trials that reported completer data were rated as having unclear risk of bias if loss to follow‐up was between 5% and 15% (Barron 2013; Glodich 2000; Jaberghaderi 2004; Kemp 2010; O'Callaghan 2013; Salloum 2012; Stein 2003; Taussig 2010). If loss to follow‐up was between 15% and 25% but imputed values were used to account for missing data, the risk was considered unclear (Berkowitz 2011; Cohen 2005; Cohen 2011; Cox 2010; Deblinger 2011; Diehle 2014; Overbeek 2013; Shirk 2014; Trowell 2002). In addition, if loss to follow‐up was not reported (Baker 1985; Chapman 2001; Chemtob 2002; Tol 2014), studies were rated as having unclear risk.
We considered 18 trials to have high risk of attrition bias because incomplete outcome data were reported and attrition rates were greater than 15% (i.e. Berliner 1996; Carbonell 1999; Celano 1996; Cohen 1996; Deblinger 1996; Deblinger 2001; Dominguez 2001; Farkas 2010; Layne 2008; Lieberman 2005; McMullen 2013; Pace 2013; Qouta 2012; Raider 2008; Salloum 2008; Schottelkorb 2012; Shechtman 2010; Stallard 2006). We also rated Kazak 2004 as having high risk of attrition bias even though imputed results were reported, because loss to follow‐up was differentially higher in the intervention group than in the control group (38% versus 7%). Studies that used imputed data but reported loss to follow‐up greater than 30% were also considered to have high risk of bias (Berliner 1996; Cohen 2005; Cohen 2011; Cox 2010; Diehle 2014; Farkas 2010).
Selective reporting
The primary outcome of PTSD symptoms were not reported in four trials (Berger 2009; Chapman 2001; Diehle 2014; Shirk 2014), which therefore were rated as having high risk of reporting bias. Studies that did not report secondary outcomes such as Trowell 2002, which did not report depression, anxiety and hyperarousal; Stallard 2006 did not report parent SDQ scores; and O'Callaghan 2014, which did not report function, were rated as having unclear risk of bias. It was not clear whether all outcomes were reported in Barron 2013, Church 2012, Damra 2014, Danielson 2012, Deblinger 1996, Glodich 2000, Lieberman 2005, O'Callaghan 2013, Overbeek 2013, Salloum 2008, Tol 2012 and Tol 2014, which therefore were rated as having unclear risk of bias. All other trials appeared to report all outcomes and were rated as having low risk of reporting bias.
Other potential sources of bias
We rated eight studies as having high risk of other bias because they reported a baseline imbalance in the primary outcome of a PTSD diagnosis, post‐trauma symptoms or exposure to trauma. The baseline diagnosis of PTSD in the usual care group was twice as high as in the intervention group (61% versus 30%) in Shirk 2014, and was 53% higher in Stallard 2006 (35.5% versus 23.2%). Baseline symptom scores were significantly higher in the wait list group in Kemp 2010 (34.6 versus 22.3) and 10% higher in Betancourt 2014. Wait list participants in Tol 2008 were twice as likely to be displaced (75%) compared with those in the intervention group (37%). More participants in the intervention group had a baseline diagnosis of PTSD in Farkas 2010 (37% versus 19%) and clinically significant symptoms in Qouta 2012 (64% versus 43%). Baseline PTSD symptoms were also higher in the treatment group in both Farkas 2010 (6.4 versus 3.7) and Qouta 2012 (32.8 versus 27.8). Participants who had undergone sexual abuse accounted for 19% of those in the intervention group compared with only 4% in the wait list group in Pace 2013, and neglect was 52.0% in the wait list group and 29.6% in the intervention group.
We considered three studies to have unclear risk of other potential bias because they were less likely to have a direct effect on primary outcomes. Participants in the intervention group in Taussig 2010 were more likely to have undergone physical abuse and maternal neglect and to have a mother with a criminal history, although their scores for IQ, coping and social support were higher. Baseline conduct scores were approximately 17% higher in the intervention group in O'Callaghan 2014. In Shirk 2014, therapists in the intervention group had a total of 38 years of clinical experience compared with seven years among those in the usual care group, and intervention therapists received 'more targeted and frequent' case supervision. Raider 2008 referred to five participants who dropped out in the early sessions of group therapy but did not appear to be included among the 23 randomised participants. In Glodich 2000, data from a student who joined the treatment group after randomisation were included. Church 2012 and Damra 2014 were also considered to have unclear risk of additional bias because potential differences between groups were not investigated.
We considered all other trials to have low risk because no other bias was apparent.
Effects of interventions
See: Summary of findings for the main comparison Psychological therapies versus wait list, treatment as usual or no treatment for children and adolescents exposed to trauma (short‐term); Summary of findings 2 CBT versus other psychological therapies for children and adolescents exposed to trauma (short‐term)
Outcomes collected over these trials included diagnosis of PTSD, PTSD symptoms (total scores and subscores for arousal, avoidance and intrusion), anxiety (total, state and trait), depression, behaviour (total, internalising and externalising), function, quality of life, cost and loss to follow‐up.
Comparison 1. All psychological therapies versus controls
Primary outcomes
1. Diagnosis of PTSD
Across all trials that compared a psychological therapy versus a control, a significantly smaller proportion of children and adolescents who received therapy interventions had been diagnosed with PTSD at the end of the study in the short term (odds ratio (OR) 0.51, 95% confidence interval (CI) 0.34 to 0.77; 874 participants; five studies; I2 = 22%; number needed to treat for an additional beneficial outcome (NNTB) 9, 95% CI 6 to 20; Analysis 1.1), but not in the medium (OR 0.66, 95% CI 0.26 to 1.69; 742 participants; four studies; I2 = 70%; Analysis 2.1) or long term (OR 0.56, 95% CI 0.09 to 3.62; 64 participants; one study; Analysis 3.1).
2. PTSD symptoms
Scores for PTSD symptoms were significantly lower in the psychological therapy group in the short term (standardised mean difference (SMD) ‐0.42, 95% CI ‐0.61 to ‐0.24; 2051 participants; 17 studies; high heterogeneity at I2 = 71%; Analysis 1.2) than in the medium (SMD ‐0.17, 95% CI ‐0.38 to 0.05; 2337 participants; 13 studies; I2 = 83%; Analysis 2.2) or long term (SMD 0.17, 95% CI ‐0.28 to 0.62; 141 participants; two studies; I2 = 44%; Analysis 3.2). Church 2012 and Damra 2014 also reported significant improvement in overall trauma symptoms, but because these differences were approximately 20 times greater than in the other included studies, data were included in the meta‐analysis but did not contribute to the overall estimate.
Investigators reported no differences between psychological therapy and control for any of the PTSD domains of avoidance, hyperarousal and intrusion in the short (Analysis 1.3; Analysis 1.4; Analysis 1.5) or medium term (Analysis 2.3; Analysis 2.4; Analysis 2.5). Long‐term PTSD domain data were not reported.
Secondary outcomes
3. Anxiety
Scores for anxiety symptoms were not significantly different in the psychological therapy groups compared with the control groups in the short term (SMD ‐0.13, 95% CI ‐0.26 to 0.00; 959 participants; seven studies; I2 = 3%; Analysis 1.6), medium term (SMD ‐0.10, 95% CI ‐0.20 to 0.00; 1470 participants; seven studies; I2 = 0%; Analysis 2.6) or long term (SMD ‐0.12, 95% CI ‐0.41 to 0.18; 176 participants; two studies; I2 = 0%; Analysis 3.3). State anxiety was significantly less in the therapy groups in the short (SMD ‐0.64, 95% CI ‐1.12 to ‐0.16; 70 participants; two studies; I2 = 0%; Analysis 1.7) and medium term (SMD ‐0.71, 95% CI ‐1.31 to ‐0.12; 46 participants; one study; Analysis 2.7). Trait anxiety was not different in the short term (Analysis 1.8) but was significantly less in the medium term (SMD ‐0.45, 95% CI ‐0.85 to ‐0.05; 101 participants; two studies; I2 = 0%; Analysis 2.8). State anxiety and trait anxiety were not reported in the long term.
4. Depression
Scores for depression symptoms were not significantly lower in the psychological therapy group in the short term (SMD ‐0.13, 95% CI ‐0.30 to 0.04; 1569 participants; 13 studies; I2 = 52%; Analysis 1.9), medium term (SMD ‐0.07, 95% CI ‐0.22 to 0.07; 2191 participants; 13 studies; I2 = 55%; Analysis 2.9) or long term (SMD ‐0.12, 95% CI ‐0.41 to 0.18; 176 participants; two studies; I2 = 0%; Analysis 3.4).
5. Behaviour
Total behaviour scores were not significantly lower in the psychological therapy group in the short (SMD ‐0.04, 95% CI ‐0.51 to 0.42; 166 participants; three studies; I2 = 51%; Analysis 1.10), medium (SMD ‐0.20, 95% CI ‐0.43 to 0.04; 281 participants; three studies; I2 = 0%; Analysis 2.10) or long term (SMD 0.39, 95% CI ‐0.07 to 0.85; 77 participants; one study; Analysis 3.5).
Scores for internalising behaviour were not different in the short (SMD ‐0.04, 95% CI ‐0.20 to 0.13; 719 participants; 10 studies; I2 = 16%; Analysis 1.11), medium (SMD 0.01, 95% CI ‐0.25 to 0.28; 291 participants; four studies; I2 = 16%; Analysis 2.11) or long term (SMD 0.04, 95% CI ‐0.51 to 0.59; 141 participants; two studies; I2 = 63%; Analysis 3.6). Researchers reported no differences between groups in externalising behaviour in the short (SMD ‐0.10, 95% CI ‐0.33 to 0.14; 1174 participants; 12 studies; I2 = 68%; Analysis 1.12), medium (SMD ‐0.11, 95% CI ‐0.38 to 0.17; 206 participants; two studies; I2 = 0%; Analysis 2.12) or long term (SMD 0.28, 95% CI ‐0.05 to 0.60; 298 participants; three studies; I2 = 46%; Analysis 3.7).
6. Functional impairment
Function was significantly improved in the group receiving psychological therapy in the short (SMD ‐0.41, 95% CI ‐0.59 to ‐0.24; 557 participants; two studies; I2 = 0%; Analysis 1.13) and medium term (SMD ‐0.46, 95% CI ‐0.88 to ‐0.05; three studies; I2 = 88%; Analysis 2.13). No study reported long‐term function scores.
7. Quality of life
Investigators reported no differences between groups in quality of life measures in the short (SMD 0.03, 95% CI ‐0.30 to 0.36; 144 participants; one study; Analysis 1.14) and medium term (SMD 0.13, 95% CI ‐0.19 to 0.46; 144 participants; one study; Analysis 2.14). Long‐term quality of life was not reported.
8. Adverse events
Researchers provided no adverse events data.
9. Cost
Researchers provided no cost data.
10. Loss to follow‐up
Among all trials that compared a psychological therapy versus a control, investigators reported no differences in the proportions of children and adolescents lost to follow‐up in the short term (risk ratio (RR) 0.98, 95% CI 0.69 to 1.39; 3872 participants; 26 studies; I2 = 59%; Analysis 1.15), medium term (OR 1.00, 95% CI 0.82 to 1.21; 3663 participants; 20 studies; I2 = 71%; Analysis 2.15) or long term (SMD 0.28, 95% CI ‐0.05 to 0.60; 298 participants; three studies; I2 = 46%; Analysis 3.7).
Subgroup analyses of psychological therapies
Primary outcomes
Diagnosis of PTSD
We noted no significant differences between the therapy subgroups of CBT, EMDR and family therapy in PTSD diagnosis in the short (Analysis 1.1), medium (Analysis 2.1) or long term (Analysis 3.1).
PTSD symptoms
In the short term, we observed significant differences between therapy subgroups in effects on symptoms of PTSD (P value < 0.0001; Analysis 1.2). With CBT (SMD ‐0.37, 95% CI ‐0.55 to ‐0.19; 1329 participants; seven studies; I2 = 55%), family therapy (SMD ‐0.53, 95% CI ‐0.94 to ‐0.12; 95 participants; two studies; I2 = 0%) and CBT plus narrative therapy (SMD ‐1.96, 95% CI ‐2.63 to ‐1.29; 52 participants; one study), all symptom scores were improved compared with control, and we noted no differences in scores when EMDR, psychoeducation and narrative, supportive and exposure therapies were compared with controls. We found no differences between therapy subgroups in the medium term (Analysis 2.2) and observed that none of the therapies (CBT, debriefing, family therapy, narrative therapy, psychoeducation and supportive therapy) were significantly different from controls. We observed no differences between the two single trials that compared exposure therapy versus control and narrative therapy versus control in the long term (Analysis 2.3), and no subgroup differences for any of the PTSD domains of avoidance (Analysis 1.3; Analysis 2.3), hyperarousal (Analysis 1.4; Analysis 2.4) and intrusion (Analysis 1.5; Analysis 2.5) in the short or medium term; we found no long‐term data.
Secondary outcomes
Anxiety
We found no significant differences between therapy groups when comparing anxiety scores with those of a control group in the short (Analysis 1.6), medium (Analysis 2.6) or long term (Analysis 3.3), nor did we note differences between therapy groups in state (Analysis 1.7; Analysis 2.7) or trait anxiety (Analysis 1.8; Analysis 2.8), which was reported in the short and medium term.
Depression
We found no significant differences between therapy subgroups for the outcome of depression in the short (Analysis 1.9), medium (Analysis 2.9) or long term (Analysis 3.4).
Behaviour
Although we noted no differences between therapy subgroups for total (Analysis 1.10; Analysis 2.10) or internalising behaviour (Analysis 1.11; Analysis 2.11; Analysis 3.6) scores, we observed a significant difference for externalising behaviour scores in the short term (P value = 0.004; Analysis 1.12). Externalising behaviours were significantly greater in the therapy groups in the single trials that compared exposure therapy versus control (SMD 0.49, 95% CI 0.03 to 0.95; 77 participants; Analysis 1.12) and fewer in the trial that compared CBT plus narrative therapy versus control (SMD ‐1.06, 95% CI ‐1.64 to ‐0.47; 52 participants; Analysis 1.12).
Function
Function was reported only in trials that compared CBT versus control in the short (Analysis 1.13) and medium term (Analysis 2.13).
Quality of life
Only one trial of supportive therapy compared with control reported quality of life in the short (Analysis 1.14) and medium term (Analysis 2.14).
Adverse events
No data were reported.
Cost
No data were reported.
Loss to follow‐up
We found no differences between therapy subgroups in loss to follow‐up in the short (Analysis 1.15), medium (Analysis 2.15) or long term (Analysis 3.8).
Comparison 2. Psychological therapies versus other psychological therapies
We were able to compare CBT with other pooled therapies for the primary outcomes only. We report these results below; thereafter, we report the results subgrouped by comparator.
CBT versus other psychological therapies
Primary outcomes
1. Diagnosis of PTSD
CBT was found to be no more or less effective than EMDR and supportive therapy in reducing diagnosis of PTSD in the short term (OR 0.74, 95% CI 0.29 to 1.91; 2 studies, 160 participants; Analysis 4.1). The quality of the evidence was very low.
2. PTSD symptoms
For reduction of PTSD symptoms in the short term, there was a small effect favouring CBT over EMDR, play therapy and supportive therapies (SMD ‐0.24, 95% CI ‐0.42 to ‐0.05, 7 studies, 466 participants; Analysis 4.2). The quality of the evidence was moderate.
CBT versus EMDR
One study compared CBT versus EMDR, and all reported outcomes were short term.
Primary outcomes
1. Diagnosis of PTSD
No data were reported.
2. PTSD symptoms
Scores for PTSD symptoms were not significantly different when CBT was compared with EMDR (SMD 0.06, 95% CI ‐0.44 to 0.56; 62 participants; two studies; I2 = 0%; Analysis 4.2).
Secondary outcomes
3. Anxiety
No data were reported.
4. Depression
No data were reported.
5. Behaviour
Total behaviour scores were not significantly different between groups (SMD ‐0.44, 95% CI ‐1.50 to 0.63; 14 participants; one study; Analysis 4.8).
6. Function
No data were reported.
7. Quality of life
No data were reported.
8. Adverse events
No data were reported.
9. Cost
No data were reported.
10. Loss to follow‐up
We observed no differences in loss to follow‐up at the end of the study (OR 0.76, 95% CI 0.23 to 2.52; 64 participants; two studies; I2 = 0%; Analysis 4.12).
CBT versus psychodynamic therapy
The one study that compared CBT versus psychodynamic therapy reported only short‐term outcomes.
Primary outcomes
1. Diagnosis of PTSD
No data were reported.
2. PTSD symptoms
PTSD symptom scores were not significantly different between groups (SMD 0.21, 95% CI ‐0.56 to 0.98; 26 participants; Analysis 5.1).
Secondary outcomes
3. Anxiety
No data were reported.
4. Depression
No data were reported.
5. Behaviour
No data were reported.
6. Function
No data were reported.
7. Quality of life
No data were reported.
8. Adverse events
No data were reported.
9. Cost
No data were reported.
10. Loss to follow‐up
We noted no differences in the proportions of children and adolescents lost to follow‐up at the end of the study (OR 0.08, 95% CI 0.00 to 1.56; 31 participants; Analysis 4.12).
CBT versus supportive therapy
Four trials compared CBT versus supportive therapy.
Primary outcomes
1. Diagnosis of PTSD
We found no differences in the proportions of children and adolescents diagnosed with PTSD in the short term (OR 0.71, 95% CI 0.26 to 1.95; 124 participants; one study; Analysis 4.1) when CBT was compared with supportive therapy. The diagnosis of PTSD was not reported in the medium or long term.
2. PTSD symptoms
Scores for PTSD symptoms were significantly lower in the CBT group in the short term (SMD ‐0.32, 95% CI ‐0.53 to ‐0.12; 378 participants; four studies; I2 = 0%; Analysis 4.2) but not in the medium term (SMD ‐0.16, 95% CI ‐0.43 to 0.11; 223 participants; two studies; I2 = 0%; Analysis 5.1).
Short‐term scores for PTSD avoidance (SMD ‐0.40, 95% CI ‐0.76 to ‐0.05; 124 participants; Analysis 4.3) and hyperarousal (SMD ‐0.52, 95% CI ‐0.87 to ‐0.16; 124 participants; Analysis 4.4) were also significantly lower in the CBT group, although we found no differences in intrusion (Analysis 4.5).
Secondary outcomes
3. Anxiety
Anxiety symptoms were significantly lower in the CBT group in the short (SMD ‐0.48, 95% CI ‐0.74 to ‐0.22; 230 participants; two studies; I2 = 0%) but not the medium term (Analysis 4.6).
4. Depression
We found no differences in depression symptoms in the short or medium term (Analysis 4.7).
5. Behaviour
We noted no differences between CBT and supportive therapy groups in total behaviour scores (Analysis 4.8) nor in scores for internalising (Analysis 4.9) or externalising behaviour (Analysis 4.10) at any interval.
6. Function
Function was reported by only one trial in the short term. We found no differences between groups (Analysis 4.11).
7. Quality of life
No data were reported.
8. Adverse events
No data were reported.
9. Cost
No data were reported.
10. Loss to follow‐up
We noted no differences between trials that compared CBT versus supportive therapy in short‐, medium‐ or long‐term loss to follow‐up (Analysis 4.12).
Comparison 3. Psychological therapies versus pharmacological therapies
We identified no trials that compared psychological therapies versus pharmacological therapies.
Subgroup analyses
Group versus individual therapy
Three trials compared delivery of psychological therapies in group and individual modes.
No data were reported for diagnosis of PTSD.
Total PTSD symptom scores were not different when group therapy was compared with individual therapy (Analysis 7.1). These scores were reported in the short term only.
Child versus child and parent therapy
Deblinger 1996 reported data for CBT therapy for children only and data for CBT for children and mothers.
No data were reported for diagnosis of PTSD.
We did not find any difference in symptoms of PTSD when CBT for children was compared to CBT for children and mothers (Analysis 8.1).
Type of trauma
We compared types of trauma including sexual abuse, maltreatment, physical trauma, life‐threatening illness, domestic violence, community violence and war and natural disaster in subgroup analyses.
Effects of psychological therapies on PTSD diagnosis were significantly different when participants exposed to different types of trauma were compared (P value = 0.007; Analysis 9.1). Intervention effects were significantly better compared with those of controls in children and adolescents exposed to community violence (OR 0.59, 95% CI 0.43 to 0.80; 769 participants; three studies; I2 = 0%), interpersonal violence (OR 0.11, 95% CI 0.02 to 0.56; 65 participants; one study) and natural disaster (OR 0.16, 95% CI 0.06 to 0.45; 166 participants; one study), but not in participants who had undergone physical trauma.
Effects on PTSD symptom scores were also significantly different between subgroups who had undergone different types of trauma (P value < 0.00001; Analysis 9.2). Scores were significantly improved for children and adolescents who had undergone sexual abuse (SMD ‐0.67, 95% CI ‐1.18 to ‐0.16; 76 participants; two studies; I2 = 16%) or were exposed to interpersonal violence (SMD ‐0.61, 95% CI ‐1.11 to ‐0.11; 65 participants; one study), natural disaster (SMD ‐1.27, 95% CI ‐1.60 to ‐0.94; 166 participants; one study) or community violence (SMD ‐0.24, 95% CI ‐0.41 to ‐0.06; 2170 participants; eight studies; I2 = 73%), although the latter subgroup was highly heterogeneous (I2 = 73%). We noted no differences between therapy and control groups among children and adolescents who had been maltreated or had undergone physical trauma or life‐threatening illness.
Types of control
We performed a subgroup analysis of active controls (e.g. treatment as usual, which included elements of psychological therapy, or psychological therapy as control, which is used in combination with another therapy in the intervention group) versus an inactive control (e.g. no treatment, wait list, craft group). We found no differences for diagnosis of PTSD (Analysis 11.1) or PTSD symptom scores (Analysis 11.2) when comparing active and inactive control subgroups.
Symptomatic inclusion criteria
We compared studies that included symptoms of PTSD or anxiety as well as exposure to trauma as the inclusion criteria versus studies in which symptoms were not part of the inclusion criteria. We found no significant differences between these subgroups for outcomes of PTSD diagnosis (Analysis 10.1) or symptoms (Analysis 10.2).
Sensitivity analyses
We performed all sensitivity analyses for the primary outcomes of a diagnosis of PTSD and symptoms of PTSD when a psychological therapy was compared with control.
Best‐case/Worst‐case analysis
We found no significant differences between best‐case and worst‐case analyses (Analysis 12.1).
Selection bias
For the outcome of PTSD diagnosis, we found no significant differences between the four trials rated as having low risk of selection bias compared with the single trials rated as having unclear and high risk of bias (Analysis 17.1). We noted no differences between low and unclear risk trials for PTSD symptoms (Analysis 17.2). We rated no trials reporting PTSD symptoms as having high risk of selection bias.
Performance bias
We found no significant differences in the diagnosis of PTSD when we compared the one trial rated as having unclear risk of performance bias versus the five trials rated as having high risk (Analysis 14.1). However, we noted significant differences between subgroups for symptoms of PTSD (one trial with unclear risk versus 17 trials with high risk; P value = 0.02; Analysis 14.2). We rated no trials as having low risk of performance bias.
Detection bias
We found no significant differences between trials rated as having low, unclear or high risk of detection bias for the diagnosis of PTSD (Analysis 15.1) or for symptoms of PTSD (Analysis 15.2).
Attrition bias
We noted significant differences between trials rated as having low, unclear and high risk of attrition bias for the diagnosis of PTSD (Analysis 16.1); however, both low‐ and high‐risk studies resulted in a significant reduction in the diagnosis or PTSD. We found no differences between studies rated as having low, unclear or high risk of attrition bias for symptoms of PTSD (Analysis 16.2).
Cluster‐randomised versus individually randomised trials
We found no significant differences between cluster‐randomised and individually randomised trials for the outcomes of PTSD diagnosis (Analysis 13.1) and symptoms (Analysis 13.2).
Assessment of reporting bias
We created a funnel plot for the primary outcome of PTSD symptoms using data provided by the 15 trials reporting these data in the short term (Figure 4). We noted no asymmetry in the funnel plot.
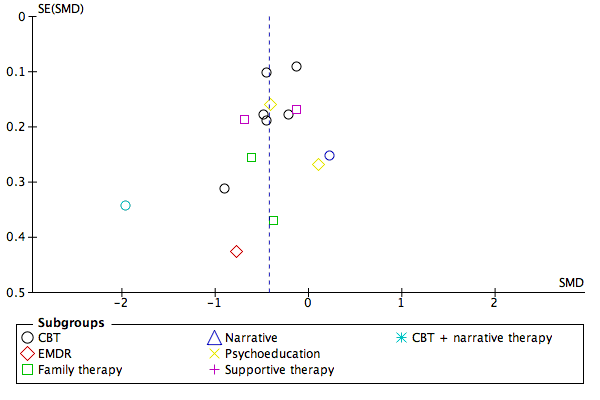
Funnel plot of comparison: 1 All psychotherapies versus control (short‐term), outcome: 1.2 PTSD total symptoms.
Discusión
Resumen de los resultados principales
La probabilidad de ser diagnosticado con trastorno de estrés postraumático (TEPT) y síntomas de TEPT se redujo significativamente en los niños y adolescentes que recibieron una terapia psicológica en comparación con los que recibieron tratamiento habitual, ningún tratamiento, o estuvieron en lista de espera durante hasta un mes luego del tratamiento. La calidad de las pruebas según GRADE para los síntomas de TEPT se calificó como baja debido a que los participantes probablemente eran conscientes de si recibían la intervención y debido a los niveles altos de heterogeneidad entre los estudios (ver Resumen de hallazgos para la comparación principal). Las pruebas para el diagnóstico del TEPT estuvieron aún más limitadas por el tamaño pequeño del estudio y los escasos números de participantes y por lo tanto se consideraron como de calidad muy baja (ver Resumen de los hallazgos para la comparación principal). Los efectos de las terapias psicológicas no fueron evidentes a más largo plazo.
Se encontró que la terapia cognitivoconductual (TCC) fue ni más ni menos efectiva que la desensibilización y reprocesamiento del movimientos ocular y (DRMO) y la terapia de apoyo para reducir el diagnóstico de TEPT a corto plazo, aunque hubo pruebas a favor de la TCC sobre la DRMO, la terapia de juego y las terapias de apoyo en cuanto a la reducción de los síntomas de TEPT durante hasta un mes después del tratamiento. La calidad de las pruebas según GRADE para la función de la TCC en cuanto a la prevención del diagnóstico de TEPT se consideró muy baja debido a la ausencia de cegamiento y la muestra pequeña y los números reducidos de estudios. Las pruebas sobre la mayor efectividad de la TCC en cuanto a la reducción de los síntomas del TEPT se consideraron de calidad moderada (ver Resumen de los hallazgos 2).
No se identificaron estudios que compararan las terapias farmacológicas con las terapias psicológicas.
Compleción y aplicabilidad general de las pruebas
Las pruebas indican que las terapias psicológicas fueron efectivas para prevenir el desarrollo del TEPT y los síntomas relacionados a través de diversos enfoques psicoterapéuticos a corto plazo. Aunque las pruebas sobre la efectividad de la TCC fueron mejores, la ausencia evidente de efecto con otras terapias puede deberse a la falta de datos.
El beneficio significativo de las terapias psicológicas fue evidente sólo durante hasta un mes luego de la finalización del tratamiento. Los datos fueron insuficientes para permitir establecer conclusiones acerca de los efectos de las terapias psicológicas que se prolongan más de un mes después del tratamiento. Sin embargo, la ausencia de efectos a largo plazo puede deberse en parte al número pequeño de estudios que informaron datos luego del mes y las tasas inferiores de seguimiento para los que lo hicieron.
La dificultad se asocia con conclusiones acerca de la aplicabilidad de las pruebas a través de diferentes tipos de trauma, debido que se informaron diferencias significativas entre los ensayos de los niños y adolescentes con diferentes tipos de trauma, y generalmente sólo un estudio presentó los resultados para cada tipo de trauma.
Aunque se observaron diferencias en los criterios de inclusión en cuanto a que algunos estudios incluyeron específicamente síntomas (aunque no un diagnóstico total) del TEPT, no se encontró ninguna diferencia evidente en los hallazgos entre estos estudios y los que no requirieron un nivel predefinido de los síntomas como parte de los criterios de inclusión.
Se había intentado incluir sólo estudios de los niños y adolescentes que habían estado expuestos a un trauma en el año anterior; sin embargo, el tiempo desde el trauma no fue un criterio de inclusión para ningún estudio incluido, y el tiempo desde el trauma se informó con poca frecuencia. Por lo tanto, el tiempo desde el trauma también puede representar heterogeneidad entre los estudios.
Aunque las pruebas indican que las terapias psicológicas fueron efectivas para prevenir la aparición de TEPT y síntomas de TEPT a corto plazo, la calidad de los estudios que compararon las terapias psicológicas versus control fue relativamente baja. Pocos estudios compararon las terapias psicológicas versus otras terapias psicológicas, y ninguno no comparó las terapias psicológicas versus terapias farmacológicas u otros tratamientos.
Calidad de la evidencia
En términos generales, el riesgo de asignación, detección y deserción en los ensayos incluidos fue incierto debido a que los autores de los estudios proporcionaron detalles insuficientes para permitir un juicio. Se consideró que la mayoría de los ensayos presentaba un alto riesgo de sesgo de realización, y que la mayoría tuvo un riesgo bajo de sesgo de informe. La heterogeneidad marcada fue evidente en varios análisis. Se realizaron varios análisis exploratorios para identificar las fuentes de heterogeneidad y se observaron diferencias entre los tipos de tratamiento y los tipos de trauma; se necesitan datos adicionales antes de poder establecer conclusiones acerca de la efectividad de diferentes terapias y los tipos de trauma para los cuales son efectivas. No se identificó ninguna diferencia entre los ensayos que utilizaron controles activos e inactivos, aunque el mismo subgrupo de control inactivo fue sumamente heterogéneo. Aunque se encontraron diferencias significativas entre los ensayos calificados como en riesgo bajo y poco claro de sesgo de selección, se observó que sólo un ensayo se propuso tener bajo riesgo y ninguno se propuso tener alto riesgo. El sesgo de realización debido al predominio de medidas calificadas por los niños o los padres puede haber dado lugar a una sobrestimación de los efectos, aunque estos hallazgos se basan en datos limitados. Aunque se encontraron diferencias entre las categorías del riesgo de sesgo debido a la deserción, no se observó este efecto con los síntomas del TEPT. No se hallaron pruebas de sesgo de publicación al preparar esta revisión. Cuando hubo efectos evidentes de las terapias psicológicas, las calificaciones de GRADE de la calidad de las pruebas fueron muy bajas a moderadas como resultado de las limitaciones de los estudios en la medición de resultado sin cegamiento, la ausencia de consistencia entre los estudios en el tamaño del efecto y la imprecisión debido a los números pequeños de estudios incluidos y los tamaños de la muestra relativamente pequeños.
Sesgos potenciales en el proceso de revisión
Los datos generados a partir de estos ensayos incluidos tuvieron algunas limitaciones. La mayoría de los ensayos fueron muy pequeños, incluyendo a menudo menos de 100 participantes y en algunos casos, menos de 20. Por lo tanto, los hallazgos negativos con muchos de estos análisis bien pueden deberse a la falta de poder estadístico. Además, en su mayoría los ensayos sólo informaron resultados a corto plazo. Otra limitación fue que porciones grandes de los datos continuos informados en estos ensayos estuvieron sesgados, lo cual limitó la posibilidad de usar los datos.
Se utilizó un rango amplio de herramientas para medir los resultados continuos en esta revisión (más de 20 para el TEPT), lo cual dificultó la integración y la interpretación de los datos. Al igual que en la revisión narrativa de Forman‐Hoffman 2013 de las intervenciones para los niños expuestos a eventos traumáticos no relacionales, los ensayos no repitieron las intervenciones, las intervenciones a corto plazo se informaron y la mayoría fueron resultados informados por los participantes.
Acuerdos y desacuerdos con otros estudios o revisiones
Los hallazgos de esta revisión están de acuerdo con los de las revisiones Cochrane que encontraron pruebas convincentes sobre la efectividad del TCC en el tratamiento de los adultos con TEPT (Bisson 2013) y los síntomas de estrés traumático agudo (Roberts 2010) y en la prevención de las consecuencias adversas del abuso sexual en los niños (MacDonald 2012). Además, una revisión sistemática de Leenarts 2013 estableció la conclusión de que la TCC produjo las mejores pruebas de efectividad entre las terapias psicológicas para los niños que habían sido maltratados y Kramer 2011 concluyó, a partir de un metanálisis, que las intervenciones psicológicas dentro del mes posterior al trauma de que las intervenciones deben incluir psicoeducación, aptitudes de afrontamiento y exposición.
PRISMA study flow diagram.
Risk of bias summary: review authors' judgements about each risk of bias item for each included study.
Risk of bias graph: review authors' judgements about each risk of bias item presented as percentages across all included studies.
Funnel plot of comparison: 1 All psychotherapies versus control (short‐term), outcome: 1.2 PTSD total symptoms.

Comparison 1 All psychotherapies versus control (short‐term), Outcome 1 PTSD diagnosis.
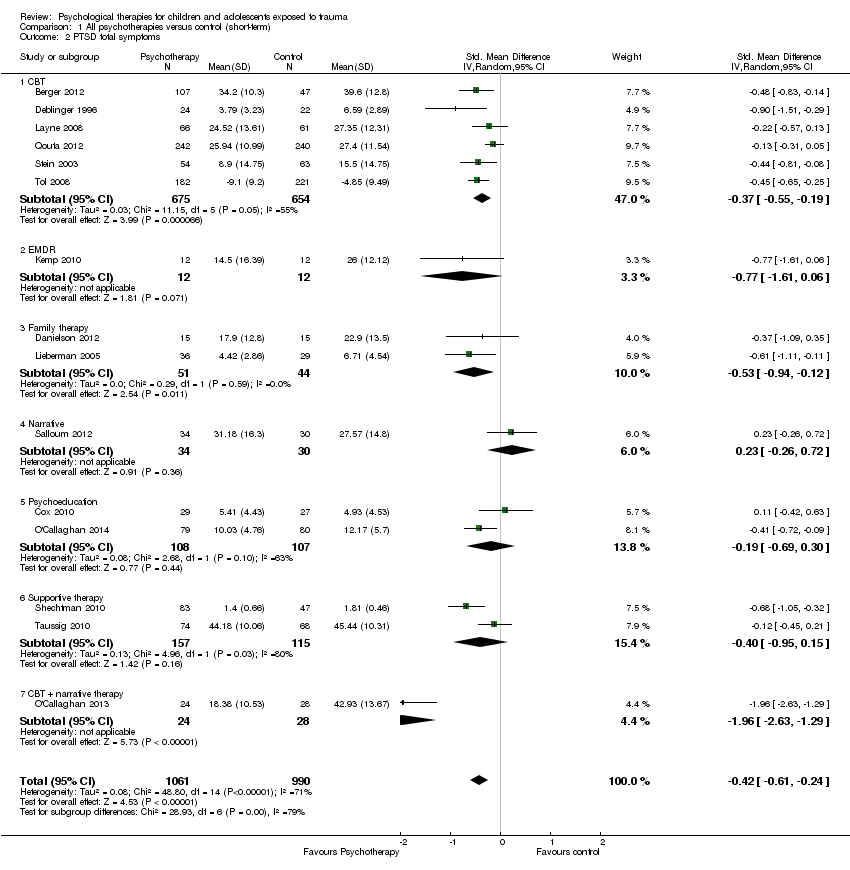
Comparison 1 All psychotherapies versus control (short‐term), Outcome 2 PTSD total symptoms.

Comparison 1 All psychotherapies versus control (short‐term), Outcome 3 PTSD avoidance.

Comparison 1 All psychotherapies versus control (short‐term), Outcome 4 PTSD hyperarousal.

Comparison 1 All psychotherapies versus control (short‐term), Outcome 5 PTSD intrusion.
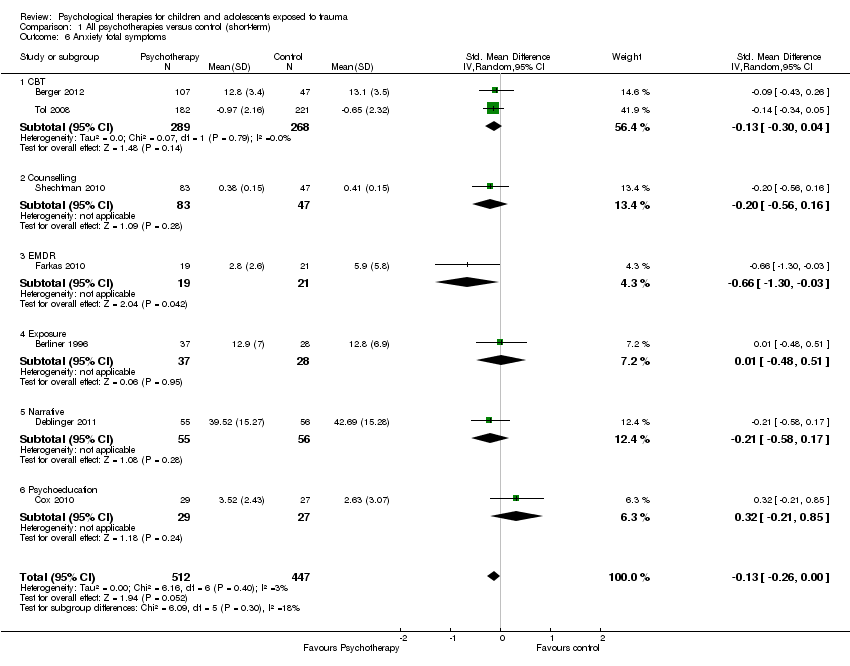
Comparison 1 All psychotherapies versus control (short‐term), Outcome 6 Anxiety total symptoms.
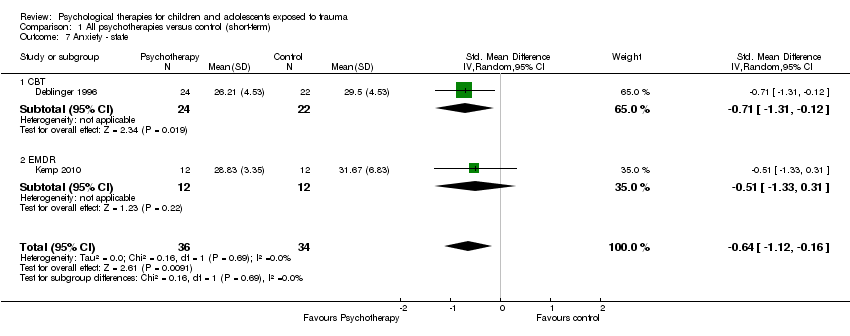
Comparison 1 All psychotherapies versus control (short‐term), Outcome 7 Anxiety ‐ state.
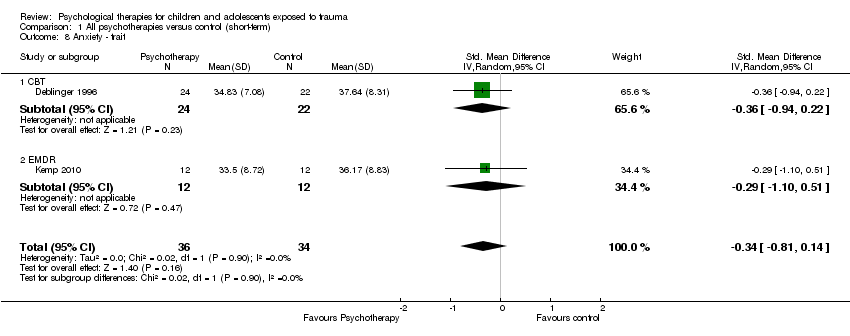
Comparison 1 All psychotherapies versus control (short‐term), Outcome 8 Anxiety ‐ trait.

Comparison 1 All psychotherapies versus control (short‐term), Outcome 9 Depression.
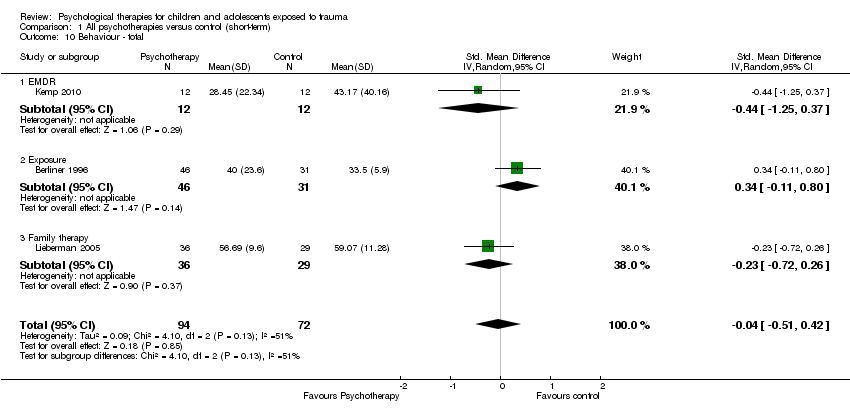
Comparison 1 All psychotherapies versus control (short‐term), Outcome 10 Behaviour ‐ total.
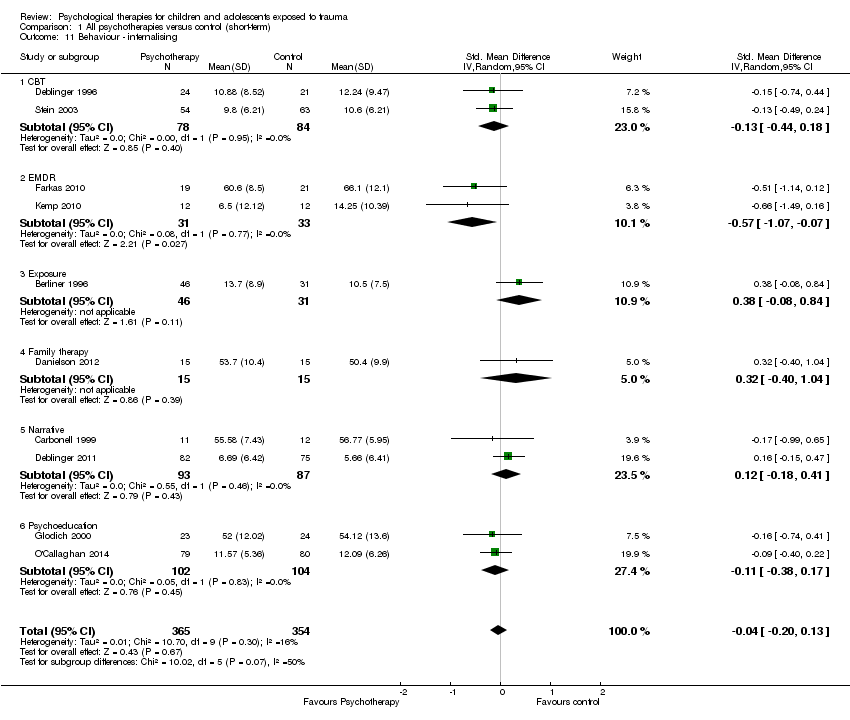
Comparison 1 All psychotherapies versus control (short‐term), Outcome 11 Behaviour ‐ internalising.

Comparison 1 All psychotherapies versus control (short‐term), Outcome 12 Behaviour ‐ externalising.
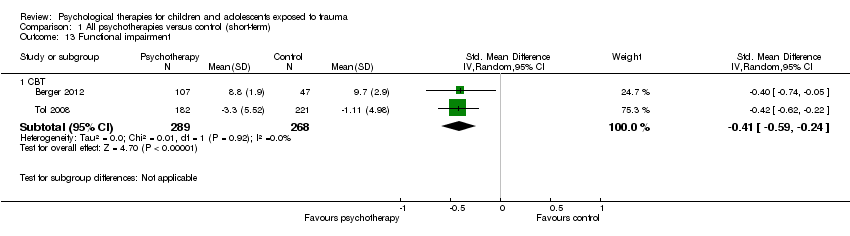
Comparison 1 All psychotherapies versus control (short‐term), Outcome 13 Functional impairment.

Comparison 1 All psychotherapies versus control (short‐term), Outcome 14 Quality of life.

Comparison 1 All psychotherapies versus control (short‐term), Outcome 15 Loss to follow‐up.

Comparison 2 All psychotherapies versus control (medium‐term), Outcome 1 PTSD diagnosis.
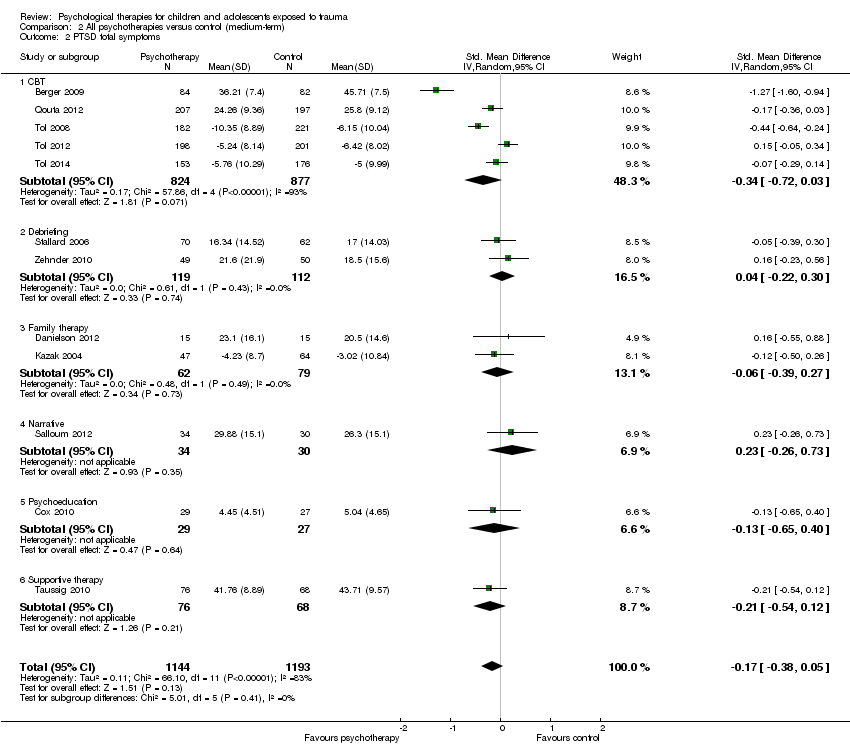
Comparison 2 All psychotherapies versus control (medium‐term), Outcome 2 PTSD total symptoms.
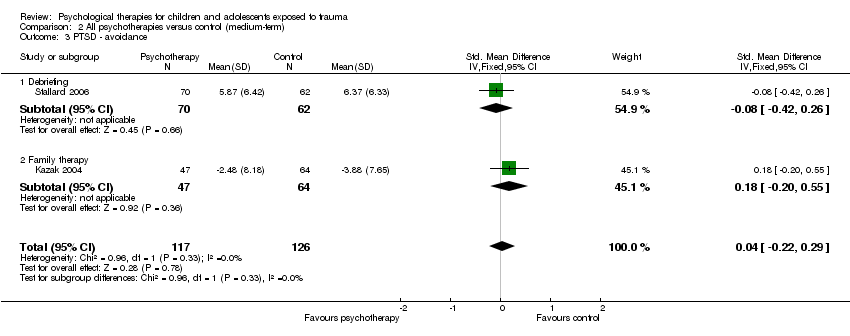
Comparison 2 All psychotherapies versus control (medium‐term), Outcome 3 PTSD ‐ avoidance.

Comparison 2 All psychotherapies versus control (medium‐term), Outcome 4 PTSD ‐ hyperarousal.

Comparison 2 All psychotherapies versus control (medium‐term), Outcome 5 PTSD ‐ intrusion.
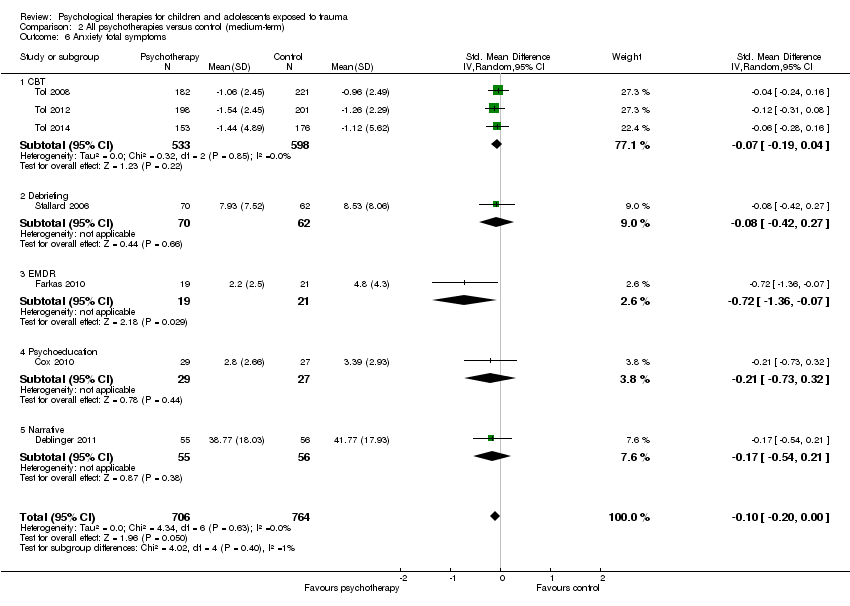
Comparison 2 All psychotherapies versus control (medium‐term), Outcome 6 Anxiety total symptoms.
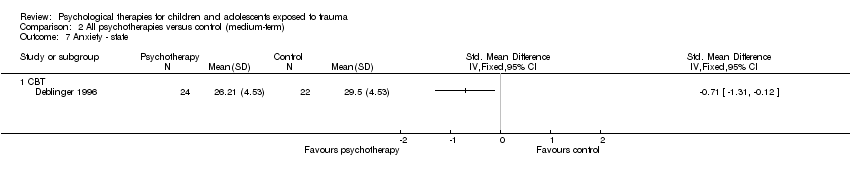
Comparison 2 All psychotherapies versus control (medium‐term), Outcome 7 Anxiety ‐ state.
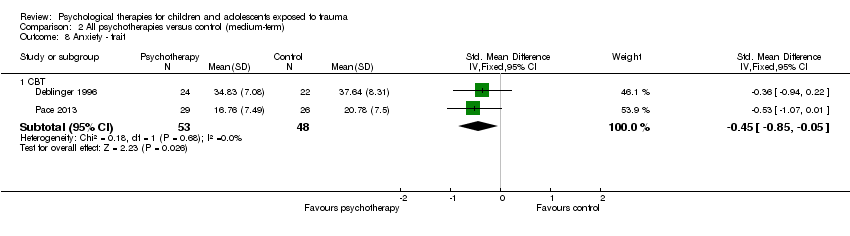
Comparison 2 All psychotherapies versus control (medium‐term), Outcome 8 Anxiety ‐ trait.

Comparison 2 All psychotherapies versus control (medium‐term), Outcome 9 Depression.

Comparison 2 All psychotherapies versus control (medium‐term), Outcome 10 Behaviour ‐ total.
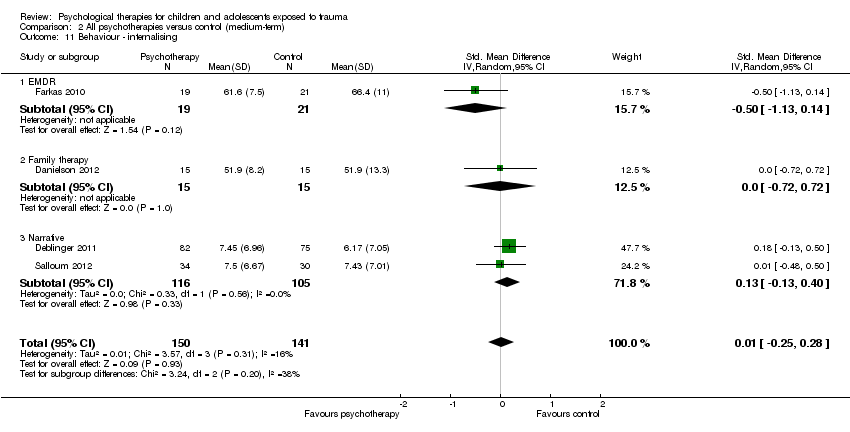
Comparison 2 All psychotherapies versus control (medium‐term), Outcome 11 Behaviour ‐ internalising.

Comparison 2 All psychotherapies versus control (medium‐term), Outcome 12 Behaviour ‐ externalising.

Comparison 2 All psychotherapies versus control (medium‐term), Outcome 13 Function.

Comparison 2 All psychotherapies versus control (medium‐term), Outcome 14 Quality of life.
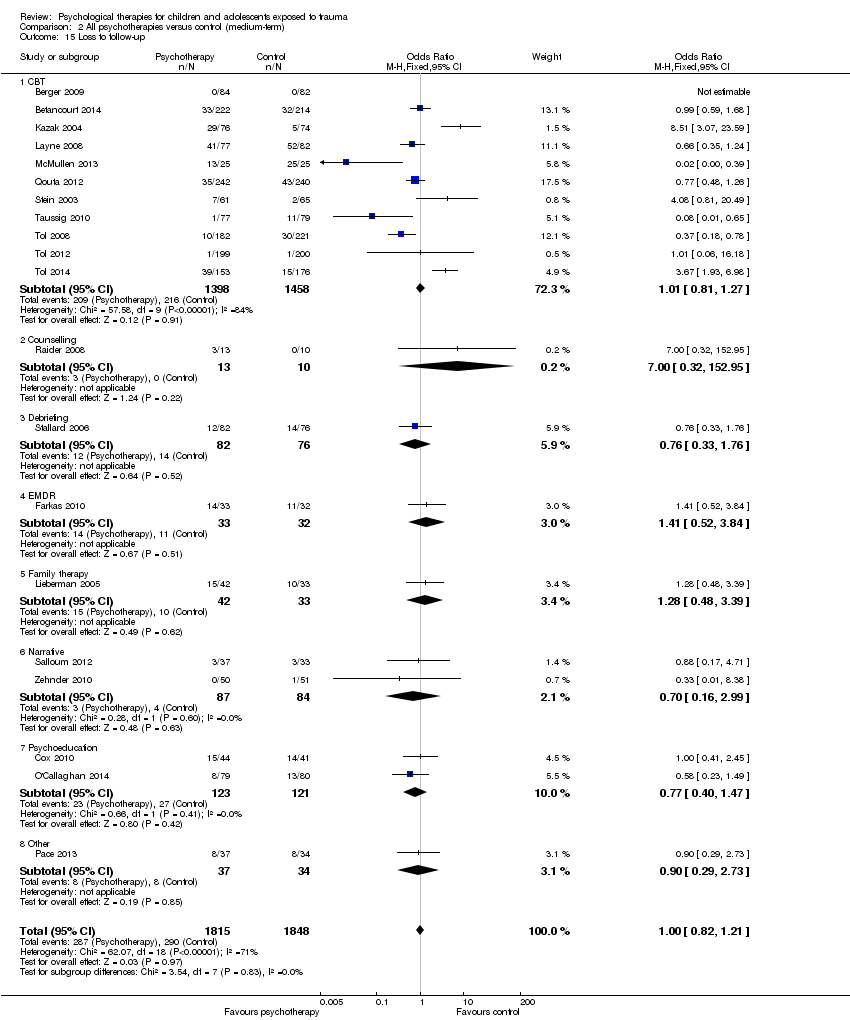
Comparison 2 All psychotherapies versus control (medium‐term), Outcome 15 Loss to follow‐up.
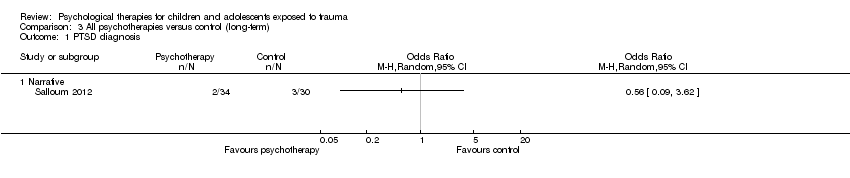
Comparison 3 All psychotherapies versus control (long‐term), Outcome 1 PTSD diagnosis.

Comparison 3 All psychotherapies versus control (long‐term), Outcome 2 PTSD total symptoms.

Comparison 3 All psychotherapies versus control (long‐term), Outcome 3 Anxiety.

Comparison 3 All psychotherapies versus control (long‐term), Outcome 4 Depression.

Comparison 3 All psychotherapies versus control (long‐term), Outcome 5 Behaviour ‐ total.
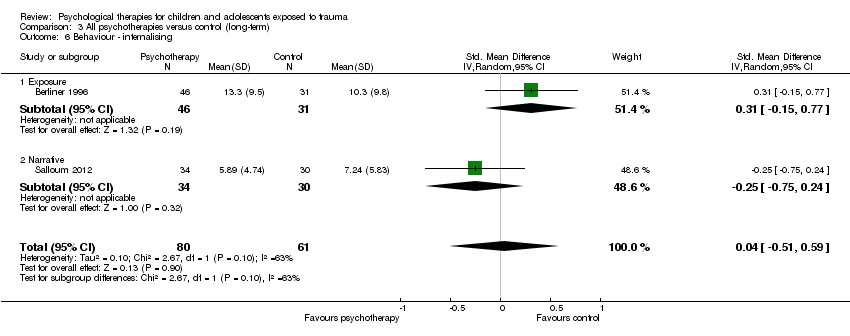
Comparison 3 All psychotherapies versus control (long‐term), Outcome 6 Behaviour ‐ internalising.

Comparison 3 All psychotherapies versus control (long‐term), Outcome 7 Behaviour ‐ externalising.

Comparison 3 All psychotherapies versus control (long‐term), Outcome 8 Loss to follow‐up.

Comparison 4 CBT versus other therapies (short‐term), Outcome 1 PTSD diagnosis.
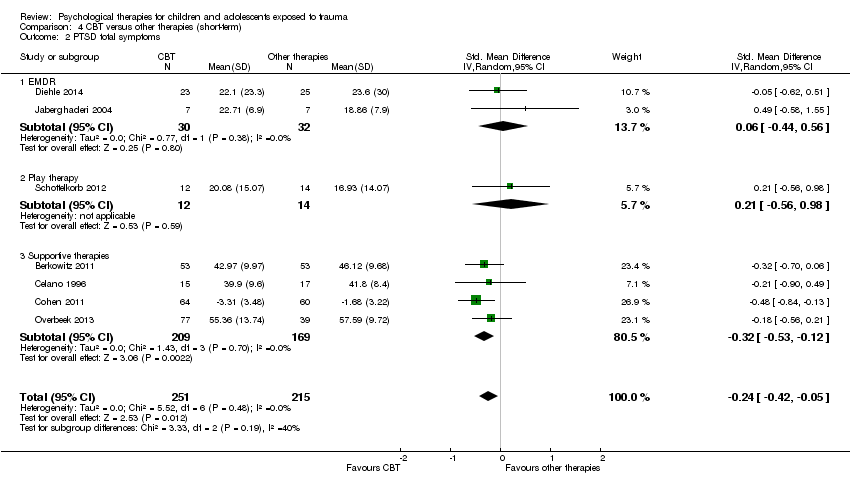
Comparison 4 CBT versus other therapies (short‐term), Outcome 2 PTSD total symptoms.
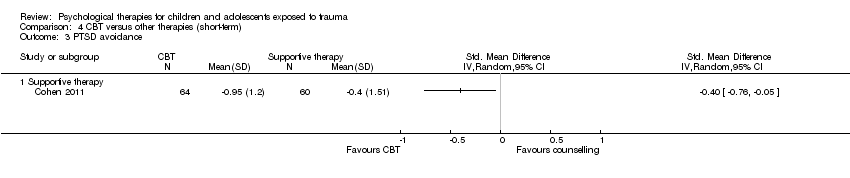
Comparison 4 CBT versus other therapies (short‐term), Outcome 3 PTSD avoidance.
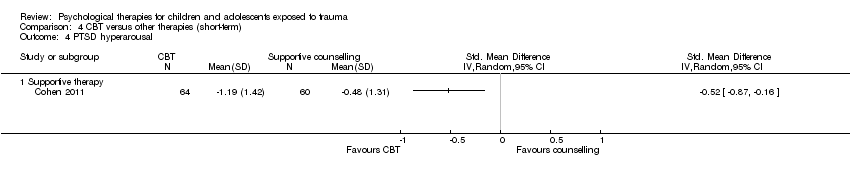
Comparison 4 CBT versus other therapies (short‐term), Outcome 4 PTSD hyperarousal.

Comparison 4 CBT versus other therapies (short‐term), Outcome 5 PTSD intrusion.

Comparison 4 CBT versus other therapies (short‐term), Outcome 6 Anxiety total symptoms.

Comparison 4 CBT versus other therapies (short‐term), Outcome 7 Depression.

Comparison 4 CBT versus other therapies (short‐term), Outcome 8 Behaviour ‐ total.

Comparison 4 CBT versus other therapies (short‐term), Outcome 9 Behaviour ‐ internalising.

Comparison 4 CBT versus other therapies (short‐term), Outcome 10 Behaviour ‐ externalising.
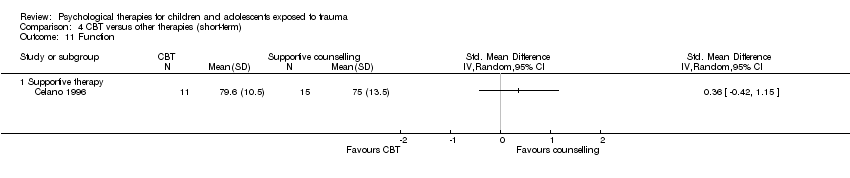
Comparison 4 CBT versus other therapies (short‐term), Outcome 11 Function.

Comparison 4 CBT versus other therapies (short‐term), Outcome 12 Loss to follow‐up.

Comparison 5 CBT versus other therapies (medium‐term), Outcome 1 PTSD total symptoms.

Comparison 5 CBT versus other therapies (medium‐term), Outcome 2 Anxiety total symptoms.

Comparison 5 CBT versus other therapies (medium‐term), Outcome 3 Depression.
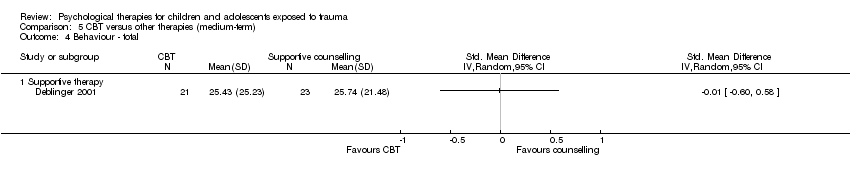
Comparison 5 CBT versus other therapies (medium‐term), Outcome 4 Behaviour ‐ total.

Comparison 5 CBT versus other therapies (medium‐term), Outcome 5 Behaviour ‐ internalising.
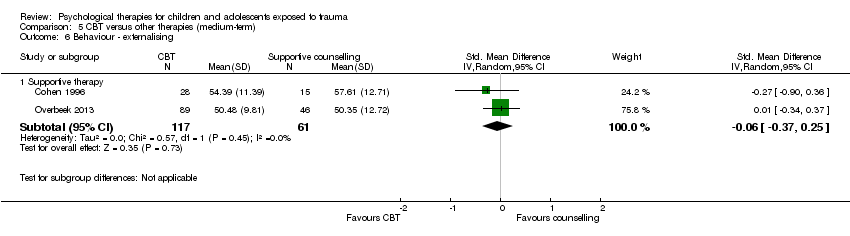
Comparison 5 CBT versus other therapies (medium‐term), Outcome 6 Behaviour ‐ externalising.
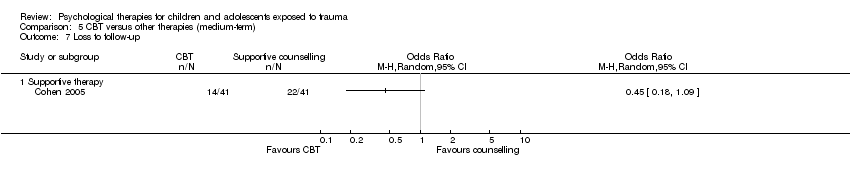
Comparison 5 CBT versus other therapies (medium‐term), Outcome 7 Loss to follow‐up.

Comparison 6 CBT versus other therapies (long‐term), Outcome 1 Behaviour ‐ internalising.

Comparison 6 CBT versus other therapies (long‐term), Outcome 2 Behaviour ‐ externalising.

Comparison 6 CBT versus other therapies (long‐term), Outcome 3 Loss to follow‐up.

Comparison 7 Subgroup analysis: Individual versus group therapy, Outcome 1 PTSD total symptoms.
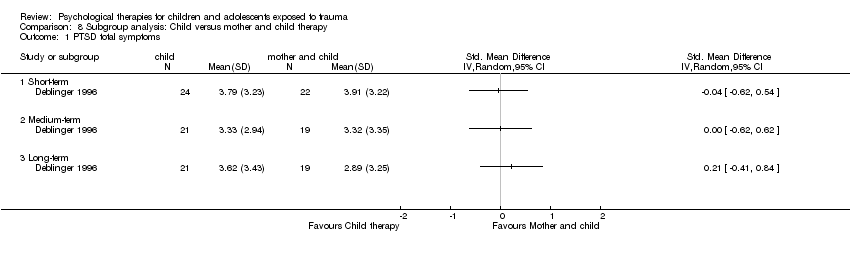
Comparison 8 Subgroup analysis: Child versus mother and child therapy, Outcome 1 PTSD total symptoms.

Comparison 9 Subgroup analysis: type of trauma, Outcome 1 PTSD diagnosis.

Comparison 9 Subgroup analysis: type of trauma, Outcome 2 PTSD total symptoms.
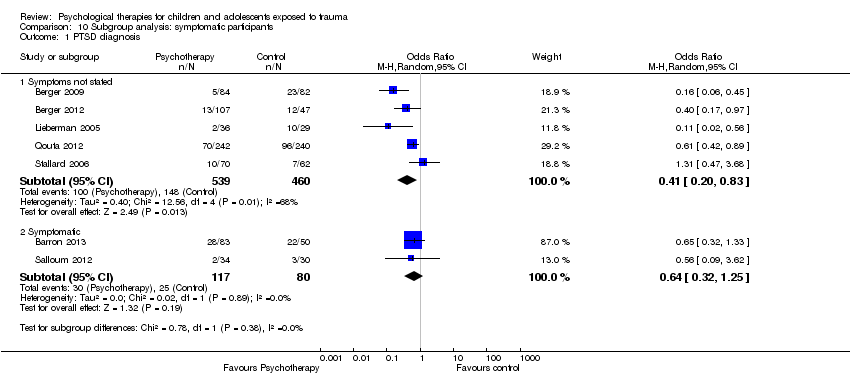
Comparison 10 Subgroup analysis: symptomatic participants, Outcome 1 PTSD diagnosis.
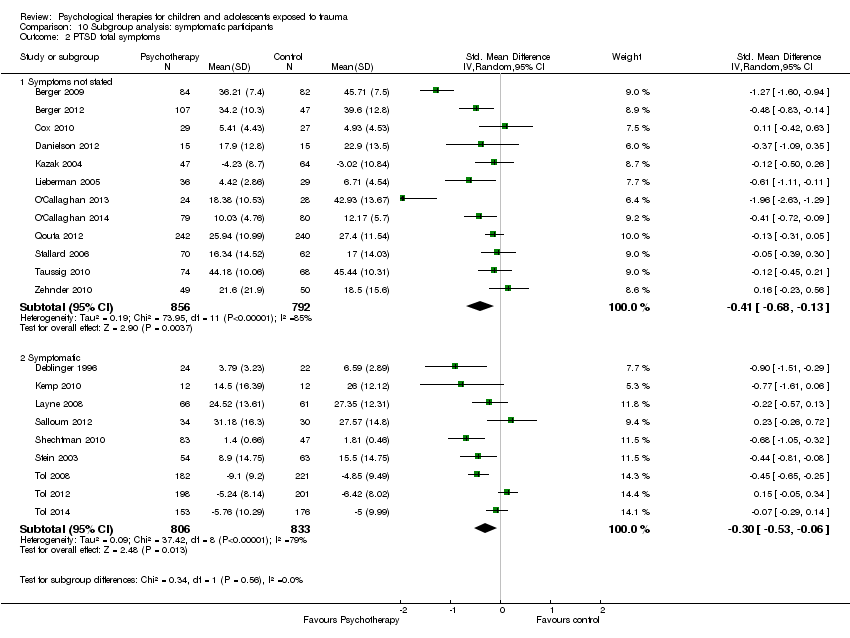
Comparison 10 Subgroup analysis: symptomatic participants, Outcome 2 PTSD total symptoms.

Comparison 11 Sensitivity analysis: type of control, Outcome 1 PTSD diagnosis.

Comparison 11 Sensitivity analysis: type of control, Outcome 2 PTSD total symptoms.

Comparison 12 Sensitivity analysis: best‐/worst‐case analysis, Outcome 1 PTSD diagnosis.

Comparison 13 Sensitivity analysis: cluster‐randomisation, Outcome 1 PTSD diagnosis.

Comparison 13 Sensitivity analysis: cluster‐randomisation, Outcome 2 PTSD total symptoms.
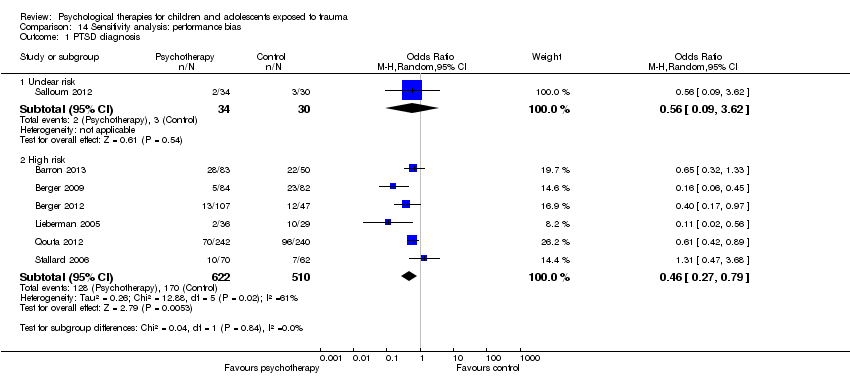
Comparison 14 Sensitivity analysis: performance bias, Outcome 1 PTSD diagnosis.

Comparison 14 Sensitivity analysis: performance bias, Outcome 2 PTSD total symptoms.
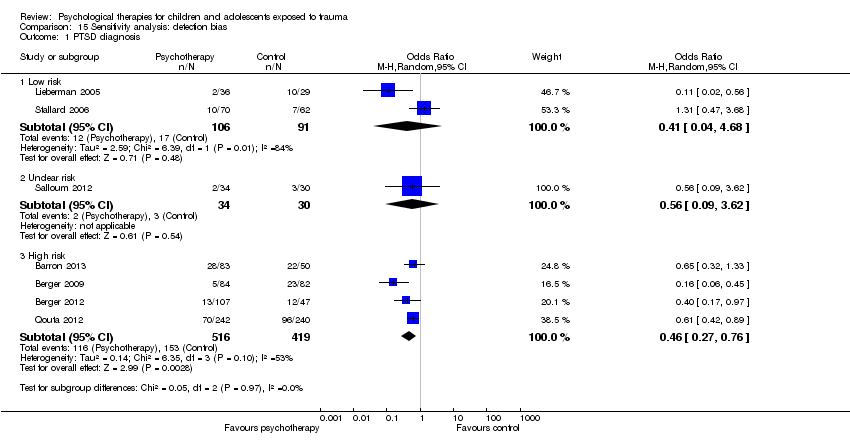
Comparison 15 Sensitivity analysis: detection bias, Outcome 1 PTSD diagnosis.

Comparison 15 Sensitivity analysis: detection bias, Outcome 2 PTSD total symptoms.

Comparison 16 Sensitivity analysis: attrition bias, Outcome 1 PTSD diagnosis.
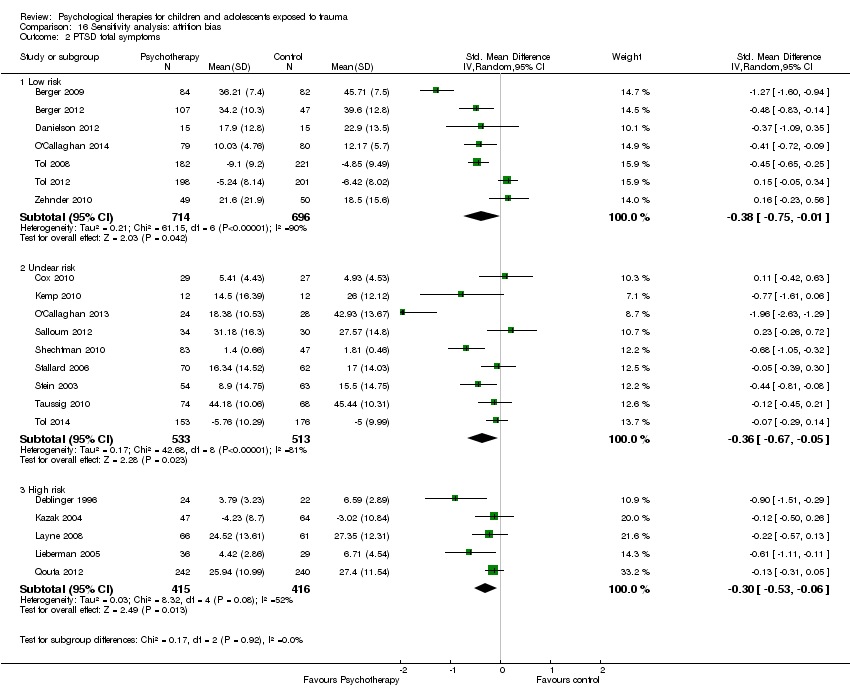
Comparison 16 Sensitivity analysis: attrition bias, Outcome 2 PTSD total symptoms.
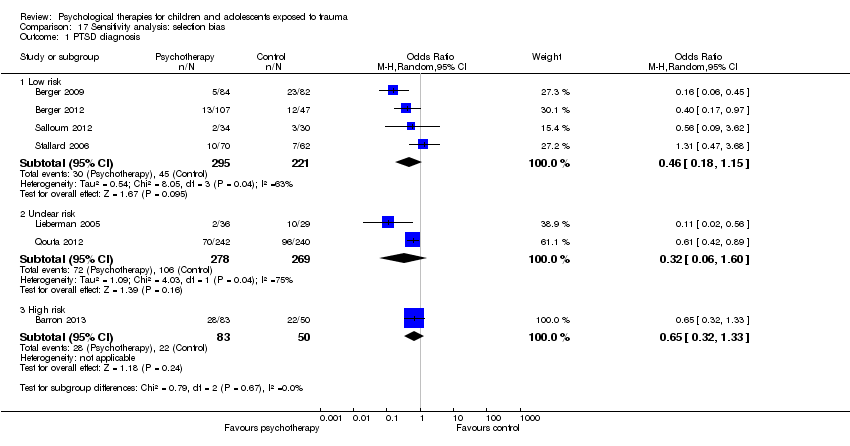
Comparison 17 Sensitivity analysis: selection bias, Outcome 1 PTSD diagnosis.

Comparison 17 Sensitivity analysis: selection bias, Outcome 2 PTSD total symptoms.
| Patient or population: children and adolescents exposed to trauma | ||||||
| Outcomes | Anticipated absolute effects* (95% CI) | Relative effect | Number of participants | Quality of the evidence | Comments | |
| Risk with control (short‐term) | Risk with all psychotherapies | |||||
| PTSD diagnosis | Study population | OR 0.51 | 874 | ⊕⊝⊝⊝ | ||
| 367 per 1000 | 228 per 1000 | |||||
| Moderate | ||||||
| 345 per 1000 | 212 per 1000 | |||||
| PTSD total symptoms | Mean PTSD total symptoms in the intervention group 0.42 standard deviations undefined fewer (0.61 fewer to 0.24 fewer) | Moderate effect size | 2051 | ⊕⊕⊝⊝ | ||
| *The risk in the intervention group (and its 95% confidence interval) is based on assumed risk in the comparison group and relative effect of the intervention (and its 95% CI) | ||||||
| GRADE Working Group grades of evidence | ||||||
| aParticipants are likely to have been aware of whether they received the active or inactive intervention in all studies, and diagnosis was based on self reported measures in 2 studies dParticipants were likely to have been aware of whether they received active or inactive intervention in all but one study, and scores were based on self reported measures in 10 studies eSubstantial heterogeneity between different types of psychological therapy (I2 = 71%) | ||||||
| Patient or population: children and adolescents exposed to trauma | ||||||
| Outcomes | Anticipated absolute effects* (95% CI) | Relative effect | Numer of participants | Quality of the evidence | Comments | |
| Risk with other therapies (short‐term) | Risk with CBT | |||||
| PTSD diagnosis | Study population | OR 0.74 | 160 | ⊕⊝⊝⊝ | ||
| 141 per 1000 | 108 per 1000 | |||||
| Moderate | ||||||
| 111 per 1000 | 85 per 1000 | |||||
| PTSD total symptoms | Mean PTSD total symptoms in the intervention group 0.24 standard deviations undefined fewer (0.42 fewer to 0.05 fewer) | Small effect size | 466 | ⊕⊕⊕⊝ | ||
| *The risk in the intervention group (and its 95% confidence interval) is based on assumed risk in the comparison group and relative effect of the intervention (and its 95% CI) | ||||||
| GRADE Working Group grades of evidence | ||||||
| aParticipants are likely to have been aware of whether they received active or inactive intervention in both studies, and diagnosis was based on self reported measures in both cParticipants are likely to have been aware of whether they received active or inactive intervention in all studies, and scores were based on self reported measures in 4 studies | ||||||
| Outcome | Group | n | Mean | SD |
| PTSD symptoms One month | Exposure therapy | 8 | 3.38 | 2.60 |
| Control | 8 | 31.38 | 3.84 | |
| Avoidance One month | Exposure therapy | 8 | 2.88 | 2.62 |
| Control | 8 | 20.25 | 2.38 | |
| Intrusion One month | Exposure therapy | 8 | 0.50 | 0.50 |
| Control | 8 | 11.13 | 2.93 |
| Outcome | Group | n | Mean | SD |
| PTSD symptoms Post therapy | TF‐CBT | 9 | 13.00 | 1.12 |
| Control | 9 | 24.20 | 1.54 | |
| PTSD symptoms 4 months | TF‐CBT | 9 | 11.88 | 1.96 |
| Control | 9 | 23.98 | 1.47 |
| Outcome | Group | n | Mean | SD |
| PTSD symptoms Post therapy | TF‐CBT | 24 | 10.6 | 4.5 |
| Control | 24 | 34.8 | 11.6 | |
| Conduct Problems Post therapy | TF‐CBT | 24 | 0.7 | 0.9 |
| Control | 24 | 7.1 | 7.0 |
| Outcome or subgroup title | No. of studies | No. of participants | Statistical method | Effect size |
| 1 PTSD diagnosis Show forest plot | 5 | 874 | Odds Ratio (M‐H, Random, 95% CI) | 0.51 [0.34, 0.77] |
| 1.1 CBT | 3 | 769 | Odds Ratio (M‐H, Random, 95% CI) | 0.59 [0.43, 0.80] |
| 1.2 EMDR | 1 | 40 | Odds Ratio (M‐H, Random, 95% CI) | 0.2 [0.01, 4.44] |
| 1.3 Family therapy | 1 | 65 | Odds Ratio (M‐H, Random, 95% CI) | 0.11 [0.02, 0.56] |
| 2 PTSD total symptoms Show forest plot | 15 | 2051 | Std. Mean Difference (IV, Random, 95% CI) | ‐0.42 [‐0.61, ‐0.24] |
| 2.1 CBT | 6 | 1329 | Std. Mean Difference (IV, Random, 95% CI) | ‐0.37 [‐0.55, ‐0.19] |
| 2.2 EMDR | 1 | 24 | Std. Mean Difference (IV, Random, 95% CI) | ‐0.77 [‐1.61, 0.06] |
| 2.3 Family therapy | 2 | 95 | Std. Mean Difference (IV, Random, 95% CI) | ‐0.53 [‐0.94, ‐0.12] |
| 2.4 Narrative | 1 | 64 | Std. Mean Difference (IV, Random, 95% CI) | 0.23 [‐0.26, 0.72] |
| 2.5 Psychoeducation | 2 | 215 | Std. Mean Difference (IV, Random, 95% CI) | ‐0.19 [‐0.69, 0.30] |
| 2.6 Supportive therapy | 2 | 272 | Std. Mean Difference (IV, Random, 95% CI) | ‐0.40 [‐0.95, 0.15] |
| 2.7 CBT + narrative therapy | 1 | 52 | Std. Mean Difference (IV, Random, 95% CI) | ‐1.96 [‐2.63, ‐1.29] |
| 3 PTSD avoidance Show forest plot | 2 | 205 | Std. Mean Difference (IV, Random, 95% CI) | ‐0.02 [‐0.29, 0.26] |
| 3.1 Narrative | 1 | 158 | Std. Mean Difference (IV, Random, 95% CI) | 0.05 [‐0.27, 0.36] |
| 3.2 Psychoeducation | 1 | 47 | Std. Mean Difference (IV, Random, 95% CI) | ‐0.23 [‐0.80, 0.35] |
| 4 PTSD hyperarousal Show forest plot | 2 | 205 | Std. Mean Difference (IV, Random, 95% CI) | 0.05 [‐0.22, 0.32] |
| 4.1 Narrative | 1 | 158 | Std. Mean Difference (IV, Random, 95% CI) | 0.10 [‐0.21, 0.41] |
| 4.2 Psychoeducation | 1 | 47 | Std. Mean Difference (IV, Random, 95% CI) | ‐0.12 [‐0.70, 0.45] |
| 5 PTSD intrusion Show forest plot | 2 | 205 | Std. Mean Difference (IV, Random, 95% CI) | 0.11 [‐0.16, 0.39] |
| 5.1 Narrative | 1 | 158 | Std. Mean Difference (IV, Random, 95% CI) | 0.15 [‐0.16, 0.46] |
| 5.2 Psychoeducation | 1 | 47 | Std. Mean Difference (IV, Random, 95% CI) | ‐0.02 [‐0.59, 0.55] |
| 6 Anxiety total symptoms Show forest plot | 7 | 959 | Std. Mean Difference (IV, Random, 95% CI) | ‐0.13 [‐0.26, 0.00] |
| 6.1 CBT | 2 | 557 | Std. Mean Difference (IV, Random, 95% CI) | ‐0.13 [‐0.30, 0.04] |
| 6.2 Counselling | 1 | 130 | Std. Mean Difference (IV, Random, 95% CI) | ‐0.20 [‐0.56, 0.16] |
| 6.3 EMDR | 1 | 40 | Std. Mean Difference (IV, Random, 95% CI) | ‐0.66 [‐1.30, ‐0.03] |
| 6.4 Exposure | 1 | 65 | Std. Mean Difference (IV, Random, 95% CI) | 0.01 [‐0.48, 0.51] |
| 6.5 Narrative | 1 | 111 | Std. Mean Difference (IV, Random, 95% CI) | ‐0.21 [‐0.58, 0.17] |
| 6.6 Psychoeducation | 1 | 56 | Std. Mean Difference (IV, Random, 95% CI) | 0.32 [‐0.21, 0.85] |
| 7 Anxiety ‐ state Show forest plot | 2 | 70 | Std. Mean Difference (IV, Random, 95% CI) | ‐0.64 [‐1.12, ‐0.16] |
| 7.1 CBT | 1 | 46 | Std. Mean Difference (IV, Random, 95% CI) | ‐0.71 [‐1.31, ‐0.12] |
| 7.2 EMDR | 1 | 24 | Std. Mean Difference (IV, Random, 95% CI) | ‐0.51 [‐1.33, 0.31] |
| 8 Anxiety ‐ trait Show forest plot | 2 | 70 | Std. Mean Difference (IV, Random, 95% CI) | ‐0.34 [‐0.81, 0.14] |
| 8.1 CBT | 1 | 46 | Std. Mean Difference (IV, Random, 95% CI) | ‐0.36 [‐0.94, 0.22] |
| 8.2 EMDR | 1 | 24 | Std. Mean Difference (IV, Random, 95% CI) | ‐0.29 [‐1.10, 0.51] |
| 9 Depression Show forest plot | 13 | 1569 | Std. Mean Difference (IV, Random, 95% CI) | ‐0.13 [‐0.30, 0.04] |
| 9.1 CBT | 6 | 1191 | Std. Mean Difference (IV, Random, 95% CI) | ‐0.21 [‐0.42, ‐0.00] |
| 9.2 EMDR | 2 | 64 | Std. Mean Difference (IV, Random, 95% CI) | ‐0.39 [‐1.41, 0.64] |
| 9.3 Exposure | 1 | 52 | Std. Mean Difference (IV, Random, 95% CI) | 0.10 [‐0.45, 0.65] |
| 9.4 Family therapy | 1 | 30 | Std. Mean Difference (IV, Random, 95% CI) | 0.05 [‐0.66, 0.77] |
| 9.5 Narrative | 2 | 176 | Std. Mean Difference (IV, Random, 95% CI) | 0.13 [‐0.52, 0.77] |
| 9.6 Psychoeducation | 1 | 56 | Std. Mean Difference (IV, Random, 95% CI) | 0.09 [‐0.43, 0.62] |
| 10 Behaviour ‐ total Show forest plot | 3 | 166 | Std. Mean Difference (IV, Random, 95% CI) | ‐0.04 [‐0.51, 0.42] |
| 10.1 EMDR | 1 | 24 | Std. Mean Difference (IV, Random, 95% CI) | ‐0.44 [‐1.25, 0.37] |
| 10.2 Exposure | 1 | 77 | Std. Mean Difference (IV, Random, 95% CI) | 0.34 [‐0.11, 0.80] |
| 10.3 Family therapy | 1 | 65 | Std. Mean Difference (IV, Random, 95% CI) | ‐0.23 [‐0.72, 0.26] |
| 11 Behaviour ‐ internalising Show forest plot | 10 | 719 | Std. Mean Difference (IV, Random, 95% CI) | ‐0.04 [‐0.20, 0.13] |
| 11.1 CBT | 2 | 162 | Std. Mean Difference (IV, Random, 95% CI) | ‐0.13 [‐0.44, 0.18] |
| 11.2 EMDR | 2 | 64 | Std. Mean Difference (IV, Random, 95% CI) | ‐0.57 [‐1.07, ‐0.07] |
| 11.3 Exposure | 1 | 77 | Std. Mean Difference (IV, Random, 95% CI) | 0.38 [‐0.08, 0.84] |
| 11.4 Family therapy | 1 | 30 | Std. Mean Difference (IV, Random, 95% CI) | 0.32 [‐0.40, 1.04] |
| 11.5 Narrative | 2 | 180 | Std. Mean Difference (IV, Random, 95% CI) | 0.12 [‐0.18, 0.41] |
| 11.6 Psychoeducation | 2 | 206 | Std. Mean Difference (IV, Random, 95% CI) | ‐0.11 [‐0.38, 0.17] |
| 12 Behaviour ‐ externalising Show forest plot | 12 | 1174 | Std. Mean Difference (IV, Random, 95% CI) | ‐0.10 [‐0.33, 0.14] |
| 12.1 CBT | 3 | 565 | Std. Mean Difference (IV, Random, 95% CI) | ‐0.11 [‐0.28, 0.06] |
| 12.2 EMDR | 2 | 64 | Std. Mean Difference (IV, Random, 95% CI) | ‐0.55 [‐1.19, 0.10] |
| 12.3 Exposure | 1 | 77 | Std. Mean Difference (IV, Random, 95% CI) | 0.49 [0.03, 0.95] |
| 12.4 Family therapy | 1 | 30 | Std. Mean Difference (IV, Random, 95% CI) | 0.23 [‐0.49, 0.95] |
| 12.5 Narrative | 2 | 180 | Std. Mean Difference (IV, Random, 95% CI) | 0.20 [‐0.41, 0.81] |
| 12.6 Psychoeducation | 2 | 206 | Std. Mean Difference (IV, Random, 95% CI) | ‐0.03 [‐0.52, 0.46] |
| 12.7 CBT + narrative therapy | 1 | 52 | Std. Mean Difference (IV, Random, 95% CI) | ‐1.06 [‐1.64, ‐0.47] |
| 13 Functional impairment Show forest plot | 2 | Std. Mean Difference (IV, Random, 95% CI) | Subtotals only | |
| 13.1 CBT | 2 | 557 | Std. Mean Difference (IV, Random, 95% CI) | ‐0.41 [‐0.59, ‐0.24] |
| 14 Quality of life Show forest plot | 1 | Std. Mean Difference (IV, Random, 95% CI) | Totals not selected | |
| 14.1 Supportive therapy | 1 | Std. Mean Difference (IV, Random, 95% CI) | 0.0 [0.0, 0.0] | |
| 15 Loss to follow‐up Show forest plot | 26 | 3872 | Risk Ratio (M‐H, Random, 95% CI) | 0.98 [0.69, 1.39] |
| 15.1 CBT | 14 | 2913 | Risk Ratio (M‐H, Random, 95% CI) | 0.87 [0.47, 1.62] |
| 15.2 Counselling | 1 | 164 | Risk Ratio (M‐H, Random, 95% CI) | 0.56 [0.30, 1.03] |
| 15.3 EMDR | 2 | 92 | Risk Ratio (M‐H, Random, 95% CI) | 1.64 [0.48, 5.59] |
| 15.4 Exposure | 1 | 16 | Risk Ratio (M‐H, Random, 95% CI) | 0.0 [0.0, 0.0] |
| 15.5 Family therapy | 2 | 105 | Risk Ratio (M‐H, Random, 95% CI) | 1.44 [0.48, 4.30] |
| 15.6 Narrative | 2 | 280 | Risk Ratio (M‐H, Random, 95% CI) | 0.87 [0.32, 2.39] |
| 15.7 Psychoeducation | 3 | 274 | Risk Ratio (M‐H, Random, 95% CI) | 1.21 [0.75, 1.96] |
| 15.8 Psychodrama | 1 | 28 | Risk Ratio (M‐H, Random, 95% CI) | 1.5 [0.29, 7.65] |
| Outcome or subgroup title | No. of studies | No. of participants | Statistical method | Effect size |
| 1 PTSD diagnosis Show forest plot | 4 | 742 | Odds Ratio (M‐H, Random, 95% CI) | 0.66 [0.26, 1.69] |
| 1.1 CBT | 2 | 570 | Odds Ratio (M‐H, Random, 95% CI) | 0.49 [0.09, 2.61] |
| 1.2 Debriefing | 1 | 132 | Odds Ratio (M‐H, Random, 95% CI) | 1.31 [0.47, 3.68] |
| 1.3 EMDR | 1 | 40 | Odds Ratio (M‐H, Random, 95% CI) | 0.35 [0.01, 9.13] |
| 2 PTSD total symptoms Show forest plot | 12 | 2337 | Std. Mean Difference (IV, Random, 95% CI) | ‐0.17 [‐0.38, 0.05] |
| 2.1 CBT | 5 | 1701 | Std. Mean Difference (IV, Random, 95% CI) | ‐0.34 [‐0.72, 0.03] |
| 2.2 Debriefing | 2 | 231 | Std. Mean Difference (IV, Random, 95% CI) | 0.04 [‐0.22, 0.30] |
| 2.3 Family therapy | 2 | 141 | Std. Mean Difference (IV, Random, 95% CI) | ‐0.06 [‐0.39, 0.27] |
| 2.4 Narrative | 1 | 64 | Std. Mean Difference (IV, Random, 95% CI) | 0.23 [‐0.26, 0.73] |
| 2.5 Psychoeducation | 1 | 56 | Std. Mean Difference (IV, Random, 95% CI) | ‐0.13 [‐0.65, 0.40] |
| 2.6 Supportive therapy | 1 | 144 | Std. Mean Difference (IV, Random, 95% CI) | ‐0.21 [‐0.54, 0.12] |
| 3 PTSD ‐ avoidance Show forest plot | 2 | 243 | Std. Mean Difference (IV, Fixed, 95% CI) | 0.04 [‐0.22, 0.29] |
| 3.1 Debriefing | 1 | 132 | Std. Mean Difference (IV, Fixed, 95% CI) | ‐0.08 [‐0.42, 0.26] |
| 3.2 Family therapy | 1 | 111 | Std. Mean Difference (IV, Fixed, 95% CI) | 0.18 [‐0.20, 0.55] |
| 4 PTSD ‐ hyperarousal Show forest plot | 2 | 243 | Std. Mean Difference (IV, Random, 95% CI) | ‐0.13 [‐0.43, 0.17] |
| 4.1 Debriefing | 1 | 132 | Std. Mean Difference (IV, Random, 95% CI) | 0.01 [‐0.33, 0.35] |
| 4.2 Family therapy | 1 | 111 | Std. Mean Difference (IV, Random, 95% CI) | ‐0.29 [‐0.67, 0.09] |
| 5 PTSD ‐ intrusion Show forest plot | 2 | 243 | Std. Mean Difference (IV, Fixed, 95% CI) | ‐0.04 [‐0.29, 0.21] |
| 5.1 Debriefing | 1 | 132 | Std. Mean Difference (IV, Fixed, 95% CI) | ‐0.05 [‐0.39, 0.29] |
| 5.2 Family therapy | 1 | 111 | Std. Mean Difference (IV, Fixed, 95% CI) | ‐0.03 [‐0.40, 0.35] |
| 6 Anxiety total symptoms Show forest plot | 7 | 1470 | Std. Mean Difference (IV, Random, 95% CI) | ‐0.10 [‐0.20, 0.00] |
| 6.1 CBT | 3 | 1131 | Std. Mean Difference (IV, Random, 95% CI) | ‐0.07 [‐0.19, 0.04] |
| 6.2 Debriefing | 1 | 132 | Std. Mean Difference (IV, Random, 95% CI) | ‐0.08 [‐0.42, 0.27] |
| 6.3 EMDR | 1 | 40 | Std. Mean Difference (IV, Random, 95% CI) | ‐0.72 [‐1.36, ‐0.07] |
| 6.4 Psychoeducation | 1 | 56 | Std. Mean Difference (IV, Random, 95% CI) | ‐0.21 [‐0.73, 0.32] |
| 6.5 Narrative | 1 | 111 | Std. Mean Difference (IV, Random, 95% CI) | ‐0.17 [‐0.54, 0.21] |
| 7 Anxiety ‐ state Show forest plot | 1 | Std. Mean Difference (IV, Fixed, 95% CI) | Totals not selected | |
| 7.1 CBT | 1 | Std. Mean Difference (IV, Fixed, 95% CI) | 0.0 [0.0, 0.0] | |
| 8 Anxiety ‐ trait Show forest plot | 2 | Std. Mean Difference (IV, Fixed, 95% CI) | Subtotals only | |
| 8.1 CBT | 2 | 101 | Std. Mean Difference (IV, Fixed, 95% CI) | ‐0.45 [‐0.85, ‐0.05] |
| 9 Depression Show forest plot | 13 | 2191 | Std. Mean Difference (IV, Random, 95% CI) | ‐0.07 [‐0.22, 0.07] |
| 9.1 CBT | 8 | 1810 | Std. Mean Difference (IV, Random, 95% CI) | ‐0.12 [‐0.31, 0.07] |
| 9.2 Debriefing | 2 | 231 | Std. Mean Difference (IV, Random, 95% CI) | ‐0.12 [‐0.38, 0.14] |
| 9.3 Family therapy | 1 | 30 | Std. Mean Difference (IV, Random, 95% CI) | 0.34 [‐0.38, 1.06] |
| 9.4 Narrative | 1 | 64 | Std. Mean Difference (IV, Random, 95% CI) | 0.34 [‐0.15, 0.84] |
| 9.5 Psychoeducation | 1 | 56 | Std. Mean Difference (IV, Random, 95% CI) | ‐0.14 [‐0.67, 0.38] |
| 10 Behaviour ‐ total Show forest plot | 3 | 281 | Std. Mean Difference (IV, Fixed, 95% CI) | ‐0.20 [‐0.43, 0.04] |
| 10.1 Debriefing | 1 | 132 | Std. Mean Difference (IV, Fixed, 95% CI) | ‐0.28 [‐0.62, 0.06] |
| 10.2 Family therapy | 1 | 50 | Std. Mean Difference (IV, Fixed, 95% CI) | ‐0.37 [‐0.93, 0.19] |
| 10.3 Narrative | 1 | 99 | Std. Mean Difference (IV, Fixed, 95% CI) | 0.0 [‐0.39, 0.39] |
| 11 Behaviour ‐ internalising Show forest plot | 4 | 291 | Std. Mean Difference (IV, Random, 95% CI) | 0.01 [‐0.25, 0.28] |
| 11.1 EMDR | 1 | 40 | Std. Mean Difference (IV, Random, 95% CI) | ‐0.50 [‐1.13, 0.14] |
| 11.2 Family therapy | 1 | 30 | Std. Mean Difference (IV, Random, 95% CI) | 0.0 [‐0.72, 0.72] |
| 11.3 Narrative | 2 | 221 | Std. Mean Difference (IV, Random, 95% CI) | 0.13 [‐0.13, 0.40] |
| 12 Behaviour ‐ externalising Show forest plot | 5 | 694 | Std. Mean Difference (IV, Random, 95% CI) | 0.02 [‐0.32, 0.35] |
| 12.1 CBT | 1 | 403 | Std. Mean Difference (IV, Random, 95% CI) | 0.07 [‐0.13, 0.27] |
| 12.2 EMDR | 1 | 40 | Std. Mean Difference (IV, Random, 95% CI) | 1.00 [‐1.66, ‐0.33] |
| 12.3 Family therapy | 1 | 30 | Std. Mean Difference (IV, Random, 95% CI) | ‐0.01 [‐0.72, 0.71] |
| 12.4 Narrative | 2 | 221 | Std. Mean Difference (IV, Random, 95% CI) | 0.31 [0.05, 0.58] |
| 13 Function Show forest plot | 3 | Std. Mean Difference (IV, Random, 95% CI) | Subtotals only | |
| 13.1 CBT | 3 | 814 | Std. Mean Difference (IV, Random, 95% CI) | ‐0.46 [‐0.88, ‐0.05] |
| 14 Quality of life Show forest plot | 1 | Std. Mean Difference (IV, Random, 95% CI) | Totals not selected | |
| 14.1 Supportive therapy | 1 | Std. Mean Difference (IV, Random, 95% CI) | 0.0 [0.0, 0.0] | |
| 15 Loss to follow‐up Show forest plot | 20 | 3663 | Odds Ratio (M‐H, Fixed, 95% CI) | 1.00 [0.82, 1.21] |
| 15.1 CBT | 11 | 2856 | Odds Ratio (M‐H, Fixed, 95% CI) | 1.01 [0.81, 1.27] |
| 15.2 Counselling | 1 | 23 | Odds Ratio (M‐H, Fixed, 95% CI) | 7.0 [0.32, 152.95] |
| 15.3 Debriefing | 1 | 158 | Odds Ratio (M‐H, Fixed, 95% CI) | 0.76 [0.33, 1.76] |
| 15.4 EMDR | 1 | 65 | Odds Ratio (M‐H, Fixed, 95% CI) | 1.41 [0.52, 3.84] |
| 15.5 Family therapy | 1 | 75 | Odds Ratio (M‐H, Fixed, 95% CI) | 1.28 [0.48, 3.39] |
| 15.6 Narrative | 2 | 171 | Odds Ratio (M‐H, Fixed, 95% CI) | 0.70 [0.16, 2.99] |
| 15.7 Psychoeducation | 2 | 244 | Odds Ratio (M‐H, Fixed, 95% CI) | 0.77 [0.40, 1.47] |
| 15.8 Other | 1 | 71 | Odds Ratio (M‐H, Fixed, 95% CI) | 0.90 [0.29, 2.73] |
| Outcome or subgroup title | No. of studies | No. of participants | Statistical method | Effect size |
| 1 PTSD diagnosis Show forest plot | 1 | Odds Ratio (M‐H, Random, 95% CI) | Totals not selected | |
| 1.1 Narrative | 1 | Odds Ratio (M‐H, Random, 95% CI) | 0.0 [0.0, 0.0] | |
| 2 PTSD total symptoms Show forest plot | 2 | 141 | Std. Mean Difference (IV, Random, 95% CI) | 0.17 [‐0.28, 0.62] |
| 2.1 Exposure | 1 | 77 | Std. Mean Difference (IV, Random, 95% CI) | 0.39 [‐0.07, 0.85] |
| 2.2 Narrative | 1 | 64 | Std. Mean Difference (IV, Random, 95% CI) | ‐0.07 [‐0.56, 0.42] |
| 3 Anxiety Show forest plot | 2 | 176 | Std. Mean Difference (IV, Random, 95% CI) | ‐0.12 [‐0.41, 0.18] |
| 3.1 Exposure | 1 | 65 | Std. Mean Difference (IV, Random, 95% CI) | ‐0.30 [‐0.80, 0.19] |
| 3.2 Narrative | 1 | 111 | Std. Mean Difference (IV, Random, 95% CI) | ‐0.01 [‐0.39, 0.36] |
| 4 Depression Show forest plot | 3 | 152 | Std. Mean Difference (IV, Fixed, 95% CI) | ‐0.24 [‐0.56, 0.08] |
| 4.1 CBT | 1 | 36 | Std. Mean Difference (IV, Fixed, 95% CI) | ‐0.59 [‐1.27, 0.09] |
| 4.2 Exposure | 1 | 52 | Std. Mean Difference (IV, Fixed, 95% CI) | ‐0.29 [‐0.84, 0.26] |
| 4.3 Narrative | 1 | 64 | Std. Mean Difference (IV, Fixed, 95% CI) | ‐0.02 [‐0.51, 0.47] |
| 5 Behaviour ‐ total Show forest plot | 1 | Std. Mean Difference (IV, Random, 95% CI) | Totals not selected | |
| 5.1 Exposure | 1 | Std. Mean Difference (IV, Random, 95% CI) | 0.0 [0.0, 0.0] | |
| 6 Behaviour ‐ internalising Show forest plot | 2 | 141 | Std. Mean Difference (IV, Random, 95% CI) | 0.04 [‐0.51, 0.59] |
| 6.1 Exposure | 1 | 77 | Std. Mean Difference (IV, Random, 95% CI) | 0.31 [‐0.15, 0.77] |
| 6.2 Narrative | 1 | 64 | Std. Mean Difference (IV, Random, 95% CI) | ‐0.25 [‐0.75, 0.24] |
| 7 Behaviour ‐ externalising Show forest plot | 3 | 298 | Std. Mean Difference (IV, Random, 95% CI) | 0.28 [‐0.05, 0.60] |
| 7.1 Exposure | 1 | 77 | Std. Mean Difference (IV, Random, 95% CI) | 0.51 [0.04, 0.97] |
| 7.2 Narrative | 2 | 221 | Std. Mean Difference (IV, Random, 95% CI) | 0.17 [‐0.30, 0.64] |
| 8 Loss to follow‐up Show forest plot | 2 | 120 | Odds Ratio (M‐H, Random, 95% CI) | 0.45 [0.15, 1.32] |
| 8.1 CBT | 1 | 50 | Odds Ratio (M‐H, Random, 95% CI) | 0.29 [0.08, 1.09] |
| 8.2 Narrative | 1 | 70 | Odds Ratio (M‐H, Random, 95% CI) | 0.88 [0.17, 4.71] |
| Outcome or subgroup title | No. of studies | No. of participants | Statistical method | Effect size |
| 1 PTSD diagnosis Show forest plot | 2 | 160 | Odds Ratio (M‐H, Random, 95% CI) | 0.74 [0.29, 1.91] |
| 1.1 EMDR | 1 | 36 | Odds Ratio (M‐H, Random, 95% CI) | 1.0 [0.06, 17.33] |
| 1.2 Supportive therapy | 1 | 124 | Odds Ratio (M‐H, Random, 95% CI) | 0.71 [0.26, 1.95] |
| 2 PTSD total symptoms Show forest plot | 7 | 466 | Std. Mean Difference (IV, Random, 95% CI) | ‐0.24 [‐0.42, ‐0.05] |
| 2.1 EMDR | 2 | 62 | Std. Mean Difference (IV, Random, 95% CI) | 0.06 [‐0.44, 0.56] |
| 2.2 Play therapy | 1 | 26 | Std. Mean Difference (IV, Random, 95% CI) | 0.21 [‐0.56, 0.98] |
| 2.3 Supportive therapies | 4 | 378 | Std. Mean Difference (IV, Random, 95% CI) | ‐0.32 [‐0.53, ‐0.12] |
| 3 PTSD avoidance Show forest plot | 1 | Std. Mean Difference (IV, Random, 95% CI) | Totals not selected | |
| 3.1 Supportive therapy | 1 | Std. Mean Difference (IV, Random, 95% CI) | 0.0 [0.0, 0.0] | |
| 4 PTSD hyperarousal Show forest plot | 1 | Std. Mean Difference (IV, Random, 95% CI) | Totals not selected | |
| 4.1 Supportive therapy | 1 | Std. Mean Difference (IV, Random, 95% CI) | 0.0 [0.0, 0.0] | |
| 5 PTSD intrusion Show forest plot | 1 | Std. Mean Difference (IV, Random, 95% CI) | Totals not selected | |
| 5.1 Supportive therapy | 1 | Std. Mean Difference (IV, Random, 95% CI) | 0.0 [0.0, 0.0] | |
| 6 Anxiety total symptoms Show forest plot | 2 | Std. Mean Difference (IV, Random, 95% CI) | Subtotals only | |
| 6.1 Supportive therapy | 2 | 230 | Std. Mean Difference (IV, Random, 95% CI) | ‐0.48 [‐0.74, ‐0.22] |
| 7 Depression Show forest plot | 2 | Std. Mean Difference (IV, Random, 95% CI) | Subtotals only | |
| 7.1 Supportive therapy | 2 | 237 | Std. Mean Difference (IV, Random, 95% CI) | ‐0.14 [‐0.42, 0.14] |
| 8 Behaviour ‐ total Show forest plot | 3 | 182 | Std. Mean Difference (IV, Random, 95% CI) | 0.02 [‐0.27, 0.31] |
| 8.1 EMDR | 1 | 14 | Std. Mean Difference (IV, Random, 95% CI) | ‐0.44 [‐1.50, 0.63] |
| 8.2 Supportive therapy | 2 | 168 | Std. Mean Difference (IV, Random, 95% CI) | 0.05 [‐0.25, 0.36] |
| 9 Behaviour ‐ internalising Show forest plot | 3 | Std. Mean Difference (IV, Random, 95% CI) | Subtotals only | |
| 9.1 Supportive therapy | 3 | 235 | Std. Mean Difference (IV, Random, 95% CI) | ‐0.25 [‐0.79, 0.28] |
| 10 Behaviour ‐ externalising Show forest plot | 3 | Std. Mean Difference (IV, Random, 95% CI) | Subtotals only | |
| 10.1 Supportive therapy | 3 | 235 | Std. Mean Difference (IV, Random, 95% CI) | ‐0.31 [‐0.58, ‐0.05] |
| 11 Function Show forest plot | 1 | Std. Mean Difference (IV, Random, 95% CI) | Totals not selected | |
| 11.1 Supportive therapy | 1 | Std. Mean Difference (IV, Random, 95% CI) | 0.0 [0.0, 0.0] | |
| 12 Loss to follow‐up Show forest plot | 8 | 544 | Odds Ratio (M‐H, Random, 95% CI) | 0.69 [0.41, 1.18] |
| 12.1 EMDR | 2 | 64 | Odds Ratio (M‐H, Random, 95% CI) | 0.76 [0.23, 2.52] |
| 12.2 Play therapy | 1 | 31 | Odds Ratio (M‐H, Random, 95% CI) | 0.08 [0.00, 1.56] |
| 12.3 Supportive therapy | 5 | 449 | Odds Ratio (M‐H, Random, 95% CI) | 0.74 [0.38, 1.43] |
| Outcome or subgroup title | No. of studies | No. of participants | Statistical method | Effect size |
| 1 PTSD total symptoms Show forest plot | 2 | Std. Mean Difference (IV, Random, 95% CI) | Subtotals only | |
| 1.1 Supportive therapy | 2 | 223 | Std. Mean Difference (IV, Random, 95% CI) | ‐0.16 [‐0.43, 0.11] |
| 2 Anxiety total symptoms Show forest plot | 1 | Std. Mean Difference (IV, Random, 95% CI) | Totals not selected | |
| 2.1 Supportive therapy | 1 | Std. Mean Difference (IV, Random, 95% CI) | 0.0 [0.0, 0.0] | |
| 3 Depression Show forest plot | 1 | Std. Mean Difference (IV, Random, 95% CI) | Totals not selected | |
| 3.1 Supportive therapy | 1 | Std. Mean Difference (IV, Random, 95% CI) | 0.0 [0.0, 0.0] | |
| 4 Behaviour ‐ total Show forest plot | 1 | Std. Mean Difference (IV, Random, 95% CI) | Totals not selected | |
| 4.1 Supportive therapy | 1 | Std. Mean Difference (IV, Random, 95% CI) | 0.0 [0.0, 0.0] | |
| 5 Behaviour ‐ internalising Show forest plot | 2 | Std. Mean Difference (IV, Random, 95% CI) | Subtotals only | |
| 5.1 Supportive therapy | 2 | 178 | Std. Mean Difference (IV, Random, 95% CI) | ‐0.05 [‐0.36, 0.26] |
| 6 Behaviour ‐ externalising Show forest plot | 2 | Std. Mean Difference (IV, Random, 95% CI) | Subtotals only | |
| 6.1 Supportive therapy | 2 | 178 | Std. Mean Difference (IV, Random, 95% CI) | ‐0.06 [‐0.37, 0.25] |
| 7 Loss to follow‐up Show forest plot | 1 | Odds Ratio (M‐H, Random, 95% CI) | Totals not selected | |
| 7.1 Supportive therapy | 1 | Odds Ratio (M‐H, Random, 95% CI) | 0.0 [0.0, 0.0] | |
| Outcome or subgroup title | No. of studies | No. of participants | Statistical method | Effect size |
| 1 Behaviour ‐ internalising Show forest plot | 1 | Std. Mean Difference (IV, Random, 95% CI) | Totals not selected | |
| 1.1 Supportive therapy | 1 | Std. Mean Difference (IV, Random, 95% CI) | 0.0 [0.0, 0.0] | |
| 2 Behaviour ‐ externalising Show forest plot | 1 | Std. Mean Difference (IV, Random, 95% CI) | Totals not selected | |
| 2.1 Supportive therapy | 1 | Std. Mean Difference (IV, Random, 95% CI) | 0.0 [0.0, 0.0] | |
| 3 Loss to follow‐up Show forest plot | 1 | Odds Ratio (M‐H, Random, 95% CI) | Totals not selected | |
| 3.1 Supportive therapy | 1 | Odds Ratio (M‐H, Random, 95% CI) | 0.0 [0.0, 0.0] | |
| Outcome or subgroup title | No. of studies | No. of participants | Statistical method | Effect size |
| 1 PTSD total symptoms Show forest plot | 1 | Std. Mean Difference (IV, Random, 95% CI) | Totals not selected | |
| 1.1 Short‐term | 1 | Std. Mean Difference (IV, Random, 95% CI) | 0.0 [0.0, 0.0] | |
| 1.2 Medium‐term | 1 | Std. Mean Difference (IV, Random, 95% CI) | 0.0 [0.0, 0.0] | |
| 1.3 Long‐term | 1 | Std. Mean Difference (IV, Random, 95% CI) | 0.0 [0.0, 0.0] | |
| Outcome or subgroup title | No. of studies | No. of participants | Statistical method | Effect size |
| 1 PTSD diagnosis Show forest plot | 6 | Odds Ratio (M‐H, Random, 95% CI) | Subtotals only | |
| 1.1 Community violence | 3 | 769 | Odds Ratio (M‐H, Random, 95% CI) | 0.59 [0.43, 0.80] |
| 1.2 Interpersonal violence | 1 | 65 | Odds Ratio (M‐H, Random, 95% CI) | 0.11 [0.02, 0.56] |
| 1.3 Natural disaster | 1 | 166 | Odds Ratio (M‐H, Random, 95% CI) | 0.16 [0.06, 0.45] |
| 1.4 Physical trauma | 1 | 132 | Odds Ratio (M‐H, Random, 95% CI) | 1.31 [0.47, 3.68] |
| 2 PTSD total symptoms Show forest plot | 18 | Std. Mean Difference (IV, Random, 95% CI) | Subtotals only | |
| 2.1 Community violence | 8 | 2170 | Std. Mean Difference (IV, Random, 95% CI) | ‐0.24 [‐0.41, ‐0.06] |
| 2.2 Interpersonal violence | 1 | 65 | Std. Mean Difference (IV, Random, 95% CI) | ‐0.61 [‐1.11, ‐0.11] |
| 2.3 Life‐threatening illness | 1 | 111 | Std. Mean Difference (IV, Random, 95% CI) | ‐0.12 [‐0.50, 0.26] |
| 2.4 Maltreatment | 1 | 142 | Std. Mean Difference (IV, Random, 95% CI) | ‐0.12 [‐0.45, 0.21] |
| 2.5 Natural disaster | 1 | 166 | Std. Mean Difference (IV, Random, 95% CI) | ‐1.27 [‐1.60, ‐0.94] |
| 2.6 Physical trauma | 4 | 311 | Std. Mean Difference (IV, Random, 95% CI) | ‐0.02 [‐0.29, 0.26] |
| 2.7 Sexual abuse | 2 | 76 | Std. Mean Difference (IV, Random, 95% CI) | ‐0.67 [‐1.18, ‐0.16] |
| Outcome or subgroup title | No. of studies | No. of participants | Statistical method | Effect size |
| 1 PTSD diagnosis Show forest plot | 7 | Odds Ratio (M‐H, Random, 95% CI) | Subtotals only | |
| 1.1 Symptoms not stated | 5 | 999 | Odds Ratio (M‐H, Random, 95% CI) | 0.41 [0.20, 0.83] |
| 1.2 Symptomatic | 2 | 197 | Odds Ratio (M‐H, Random, 95% CI) | 0.64 [0.32, 1.25] |
| 2 PTSD total symptoms Show forest plot | 21 | Std. Mean Difference (IV, Random, 95% CI) | Subtotals only | |
| 2.1 Symptoms not stated | 12 | 1648 | Std. Mean Difference (IV, Random, 95% CI) | ‐0.41 [‐0.68, ‐0.13] |
| 2.2 Symptomatic | 9 | 1639 | Std. Mean Difference (IV, Random, 95% CI) | ‐0.30 [‐0.53, ‐0.06] |
| Outcome or subgroup title | No. of studies | No. of participants | Statistical method | Effect size |
| 1 PTSD diagnosis Show forest plot | 7 | Odds Ratio (M‐H, Random, 95% CI) | Subtotals only | |
| 1.1 Inactive control | 5 | 1067 | Odds Ratio (M‐H, Random, 95% CI) | 0.53 [0.32, 0.88] |
| 1.2 Active control | 2 | 129 | Odds Ratio (M‐H, Random, 95% CI) | 0.23 [0.05, 1.14] |
| 2 PTSD total symptoms Show forest plot | 21 | Std. Mean Difference (IV, Random, 95% CI) | Subtotals only | |
| 2.1 Inactive control | 15 | 2856 | Std. Mean Difference (IV, Random, 95% CI) | ‐0.40 [‐0.61, ‐0.19] |
| 2.2 Active control | 6 | 431 | Std. Mean Difference (IV, Random, 95% CI) | ‐0.25 [‐0.58, 0.09] |
| Outcome or subgroup title | No. of studies | No. of participants | Statistical method | Effect size |
| 1 PTSD diagnosis Show forest plot | 7 | Odds Ratio (M‐H, Random, 95% CI) | Subtotals only | |
| 1.1 Best case | 7 | 1282 | Odds Ratio (M‐H, Random, 95% CI) | 0.52 [0.28, 0.99] |
| 1.2 Worst case | 7 | 1252 | Odds Ratio (M‐H, Random, 95% CI) | 0.64 [0.42, 0.98] |
| Outcome or subgroup title | No. of studies | No. of participants | Statistical method | Effect size |
| 1 PTSD diagnosis Show forest plot | 7 | Odds Ratio (M‐H, Random, 95% CI) | Subtotals only | |
| 1.1 Cluster‐randomised | 4 | 935 | Odds Ratio (M‐H, Random, 95% CI) | 0.46 [0.27, 0.76] |
| 1.2 Individuals randomised | 3 | 261 | Odds Ratio (M‐H, Random, 95% CI) | 0.47 [0.10, 2.19] |
| 2 PTSD total symptoms Show forest plot | 20 | Std. Mean Difference (IV, Random, 95% CI) | Subtotals only | |
| 2.1 Cluster‐randomised | 7 | 2063 | Std. Mean Difference (IV, Random, 95% CI) | ‐0.40 [‐0.71, ‐0.10] |
| 2.2 Individuals randomised | 13 | 1172 | Std. Mean Difference (IV, Random, 95% CI) | ‐0.22 [‐0.38, ‐0.06] |
| Outcome or subgroup title | No. of studies | No. of participants | Statistical method | Effect size |
| 1 PTSD diagnosis Show forest plot | 7 | Odds Ratio (M‐H, Random, 95% CI) | Subtotals only | |
| 1.1 Unclear risk | 1 | 64 | Odds Ratio (M‐H, Random, 95% CI) | 0.56 [0.09, 3.62] |
| 1.2 High risk | 6 | 1132 | Odds Ratio (M‐H, Random, 95% CI) | 0.46 [0.27, 0.79] |
| 2 PTSD total symptoms Show forest plot | 21 | Std. Mean Difference (IV, Random, 95% CI) | Subtotals only | |
| 2.1 Unclear risk | 1 | 64 | Std. Mean Difference (IV, Random, 95% CI) | 0.23 [‐0.26, 0.72] |
| 2.2 High risk | 20 | 3223 | Std. Mean Difference (IV, Random, 95% CI) | ‐0.39 [‐0.57, ‐0.20] |
| Outcome or subgroup title | No. of studies | No. of participants | Statistical method | Effect size |
| 1 PTSD diagnosis Show forest plot | 7 | Odds Ratio (M‐H, Random, 95% CI) | Subtotals only | |
| 1.1 Low risk | 2 | 197 | Odds Ratio (M‐H, Random, 95% CI) | 0.41 [0.04, 4.68] |
| 1.2 Unclear risk | 1 | 64 | Odds Ratio (M‐H, Random, 95% CI) | 0.56 [0.09, 3.62] |
| 1.3 High risk | 4 | 935 | Odds Ratio (M‐H, Random, 95% CI) | 0.46 [0.27, 0.76] |
| 2 PTSD total symptoms Show forest plot | 21 | Std. Mean Difference (IV, Random, 95% CI) | Subtotals only | |
| 2.1 Low risk | 1 | 132 | Std. Mean Difference (IV, Random, 95% CI) | ‐0.05 [‐0.39, 0.30] |
| 2.2 Unclear risk | 2 | 191 | Std. Mean Difference (IV, Random, 95% CI) | ‐0.03 [‐0.46, 0.40] |
| 2.3 High risk | 18 | 2964 | Std. Mean Difference (IV, Random, 95% CI) | ‐0.42 [‐0.62, ‐0.22] |
| Outcome or subgroup title | No. of studies | No. of participants | Statistical method | Effect size |
| 1 PTSD diagnosis Show forest plot | 7 | Odds Ratio (M‐H, Random, 95% CI) | Subtotals only | |
| 1.1 Low risk | 2 | 320 | Odds Ratio (M‐H, Random, 95% CI) | 0.27 [0.11, 0.65] |
| 1.2 Unclear risk | 3 | 329 | Odds Ratio (M‐H, Random, 95% CI) | 0.79 [0.45, 1.38] |
| 1.3 High risk | 2 | 547 | Odds Ratio (M‐H, Random, 95% CI) | 0.32 [0.06, 1.60] |
| 2 PTSD total symptoms Show forest plot | 21 | Std. Mean Difference (IV, Random, 95% CI) | Subtotals only | |
| 2.1 Low risk | 7 | 1410 | Std. Mean Difference (IV, Random, 95% CI) | ‐0.38 [‐0.75, ‐0.01] |
| 2.2 Unclear risk | 9 | 1046 | Std. Mean Difference (IV, Random, 95% CI) | ‐0.36 [‐0.67, ‐0.05] |
| 2.3 High risk | 5 | 831 | Std. Mean Difference (IV, Random, 95% CI) | ‐0.30 [‐0.53, ‐0.06] |
| Outcome or subgroup title | No. of studies | No. of participants | Statistical method | Effect size |
| 1 PTSD diagnosis Show forest plot | 7 | Odds Ratio (M‐H, Random, 95% CI) | Subtotals only | |
| 1.1 Low risk | 4 | 516 | Odds Ratio (M‐H, Random, 95% CI) | 0.46 [0.18, 1.15] |
| 1.2 Unclear risk | 2 | 547 | Odds Ratio (M‐H, Random, 95% CI) | 0.32 [0.06, 1.60] |
| 1.3 High risk | 1 | 133 | Odds Ratio (M‐H, Random, 95% CI) | 0.65 [0.32, 1.33] |
| 2 PTSD total symptoms Show forest plot | 21 | Std. Mean Difference (IV, Random, 95% CI) | Subtotals only | |
| 2.1 Low risk | 8 | 874 | Std. Mean Difference (IV, Random, 95% CI) | ‐0.57 [‐0.97, ‐0.17] |
| 2.2 Unclear risk | 13 | 2413 | Std. Mean Difference (IV, Random, 95% CI) | ‐0.22 [‐0.39, ‐0.06] |