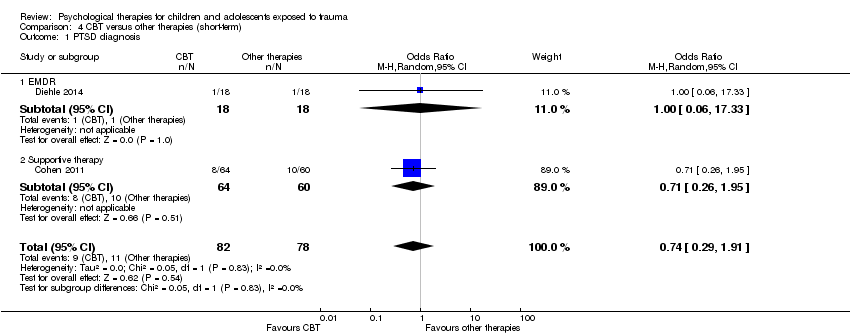
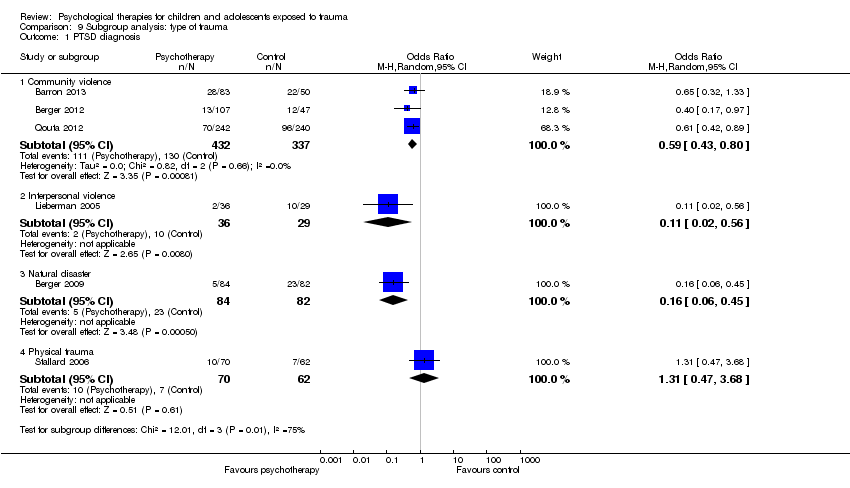
| 1 PTSD diagnosis Show forest plot | 5 | 874 | Odds Ratio (M‐H, Random, 95% CI) | 0.51 [0.34, 0.77] |
|
| 1.1 CBT | 3 | 769 | Odds Ratio (M‐H, Random, 95% CI) | 0.59 [0.43, 0.80] |
| 1.2 EMDR | 1 | 40 | Odds Ratio (M‐H, Random, 95% CI) | 0.2 [0.01, 4.44] |
| 1.3 Family therapy | 1 | 65 | Odds Ratio (M‐H, Random, 95% CI) | 0.11 [0.02, 0.56] |
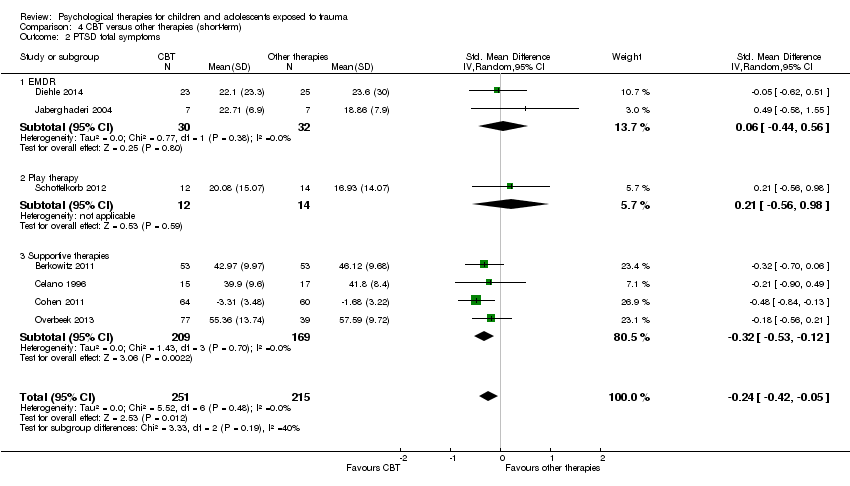
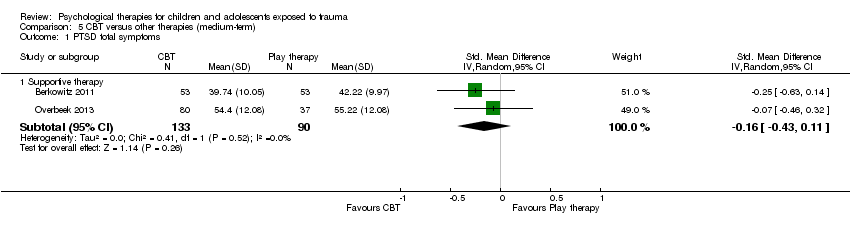
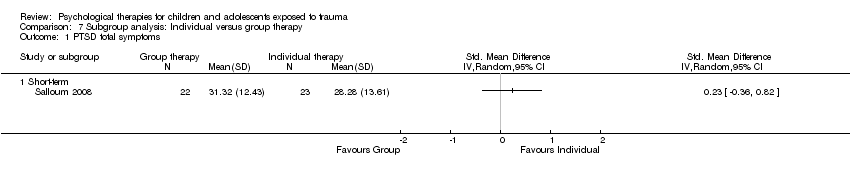
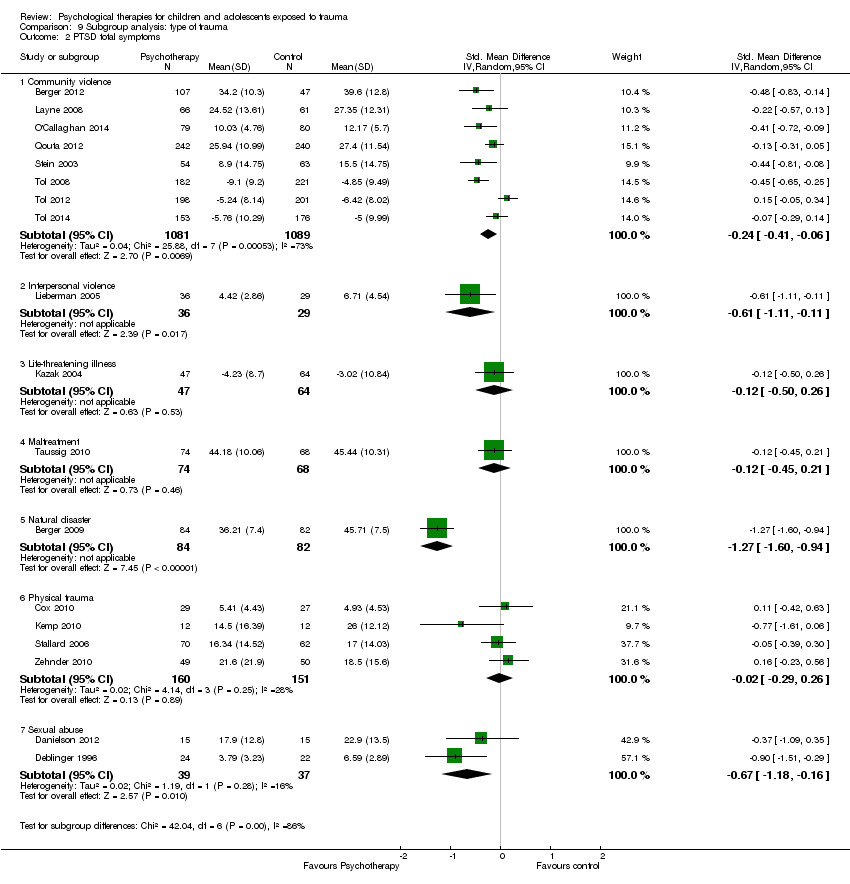
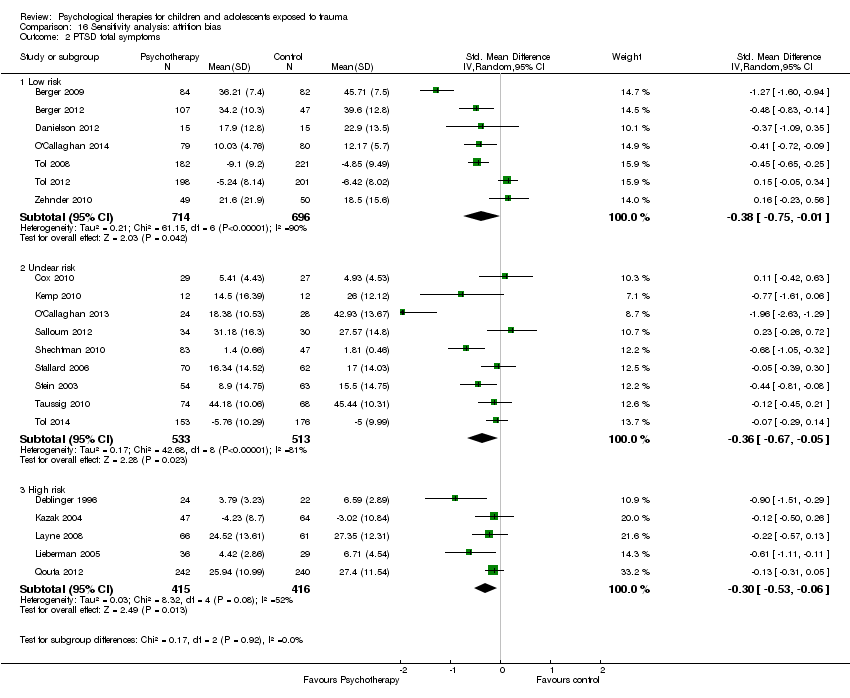
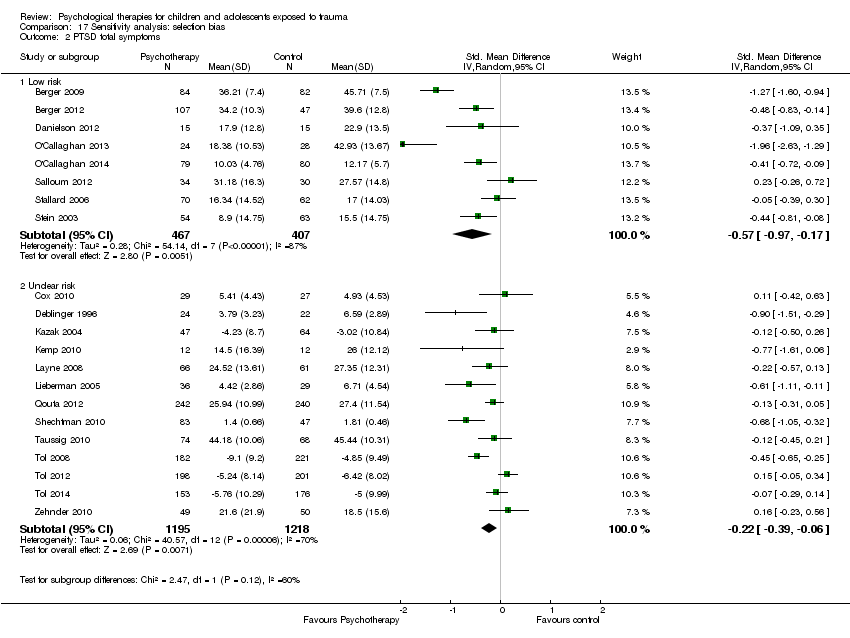
| 2 PTSD total symptoms Show forest plot | 15 | 2051 | Std. Mean Difference (IV, Random, 95% CI) | ‐0.42 [‐0.61, ‐0.24] |
|
| 2.1 CBT | 6 | 1329 | Std. Mean Difference (IV, Random, 95% CI) | ‐0.37 [‐0.55, ‐0.19] |
| 2.2 EMDR | 1 | 24 | Std. Mean Difference (IV, Random, 95% CI) | ‐0.77 [‐1.61, 0.06] |
| 2.3 Family therapy | 2 | 95 | Std. Mean Difference (IV, Random, 95% CI) | ‐0.53 [‐0.94, ‐0.12] |
| 2.4 Narrative | 1 | 64 | Std. Mean Difference (IV, Random, 95% CI) | 0.23 [‐0.26, 0.72] |
| 2.5 Psychoeducation | 2 | 215 | Std. Mean Difference (IV, Random, 95% CI) | ‐0.19 [‐0.69, 0.30] |
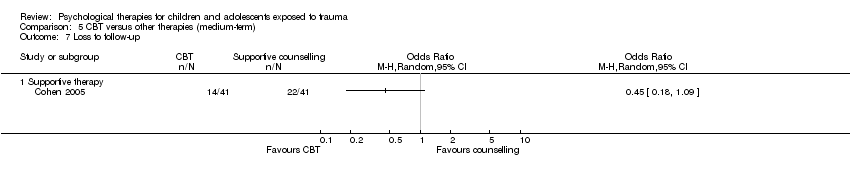
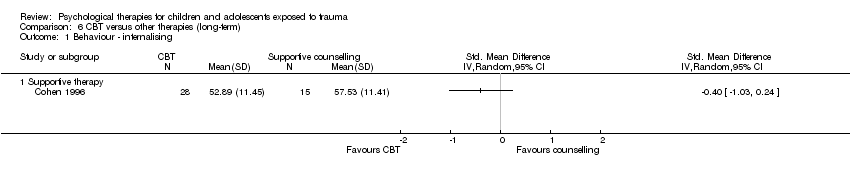
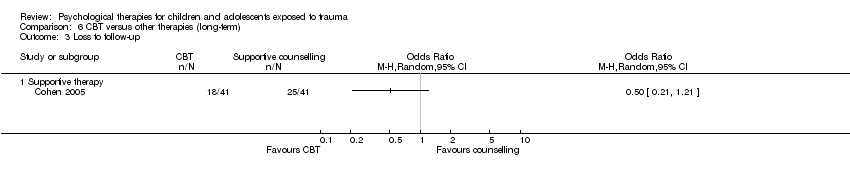
| 2.6 Supportive therapy | 2 | 272 | Std. Mean Difference (IV, Random, 95% CI) | ‐0.40 [‐0.95, 0.15] |
| 2.7 CBT + narrative therapy | 1 | 52 | Std. Mean Difference (IV, Random, 95% CI) | ‐1.96 [‐2.63, ‐1.29] |
| 3 PTSD avoidance Show forest plot | 2 | 205 | Std. Mean Difference (IV, Random, 95% CI) | ‐0.02 [‐0.29, 0.26] |
|
| 3.1 Narrative | 1 | 158 | Std. Mean Difference (IV, Random, 95% CI) | 0.05 [‐0.27, 0.36] |
| 3.2 Psychoeducation | 1 | 47 | Std. Mean Difference (IV, Random, 95% CI) | ‐0.23 [‐0.80, 0.35] |
| 4 PTSD hyperarousal Show forest plot | 2 | 205 | Std. Mean Difference (IV, Random, 95% CI) | 0.05 [‐0.22, 0.32] |
|
| 4.1 Narrative | 1 | 158 | Std. Mean Difference (IV, Random, 95% CI) | 0.10 [‐0.21, 0.41] |
| 4.2 Psychoeducation | 1 | 47 | Std. Mean Difference (IV, Random, 95% CI) | ‐0.12 [‐0.70, 0.45] |
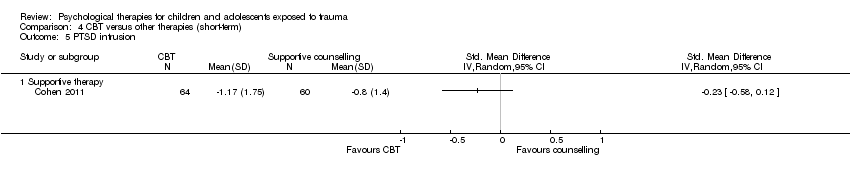
| 5 PTSD intrusion Show forest plot | 2 | 205 | Std. Mean Difference (IV, Random, 95% CI) | 0.11 [‐0.16, 0.39] |
|
| 5.1 Narrative | 1 | 158 | Std. Mean Difference (IV, Random, 95% CI) | 0.15 [‐0.16, 0.46] |
| 5.2 Psychoeducation | 1 | 47 | Std. Mean Difference (IV, Random, 95% CI) | ‐0.02 [‐0.59, 0.55] |
| 6 Anxiety total symptoms Show forest plot | 7 | 959 | Std. Mean Difference (IV, Random, 95% CI) | ‐0.13 [‐0.26, 0.00] |
|
| 6.1 CBT | 2 | 557 | Std. Mean Difference (IV, Random, 95% CI) | ‐0.13 [‐0.30, 0.04] |
| 6.2 Counselling | 1 | 130 | Std. Mean Difference (IV, Random, 95% CI) | ‐0.20 [‐0.56, 0.16] |
| 6.3 EMDR | 1 | 40 | Std. Mean Difference (IV, Random, 95% CI) | ‐0.66 [‐1.30, ‐0.03] |
| 6.4 Exposure | 1 | 65 | Std. Mean Difference (IV, Random, 95% CI) | 0.01 [‐0.48, 0.51] |
| 6.5 Narrative | 1 | 111 | Std. Mean Difference (IV, Random, 95% CI) | ‐0.21 [‐0.58, 0.17] |
| 6.6 Psychoeducation | 1 | 56 | Std. Mean Difference (IV, Random, 95% CI) | 0.32 [‐0.21, 0.85] |
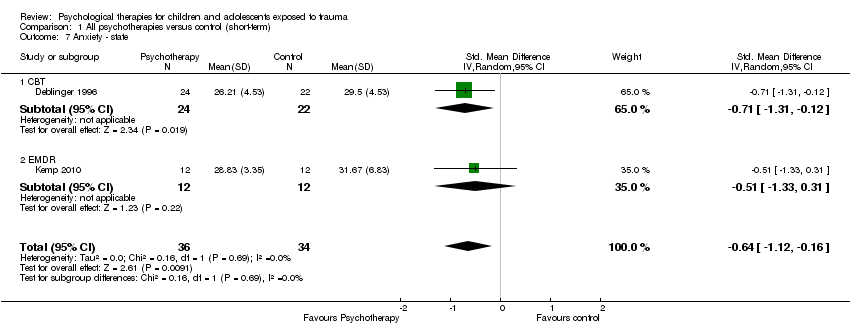
| 7 Anxiety ‐ state Show forest plot | 2 | 70 | Std. Mean Difference (IV, Random, 95% CI) | ‐0.64 [‐1.12, ‐0.16] |
|
| 7.1 CBT | 1 | 46 | Std. Mean Difference (IV, Random, 95% CI) | ‐0.71 [‐1.31, ‐0.12] |
| 7.2 EMDR | 1 | 24 | Std. Mean Difference (IV, Random, 95% CI) | ‐0.51 [‐1.33, 0.31] |
| 8 Anxiety ‐ trait Show forest plot | 2 | 70 | Std. Mean Difference (IV, Random, 95% CI) | ‐0.34 [‐0.81, 0.14] |
|
| 8.1 CBT | 1 | 46 | Std. Mean Difference (IV, Random, 95% CI) | ‐0.36 [‐0.94, 0.22] |
| 8.2 EMDR | 1 | 24 | Std. Mean Difference (IV, Random, 95% CI) | ‐0.29 [‐1.10, 0.51] |
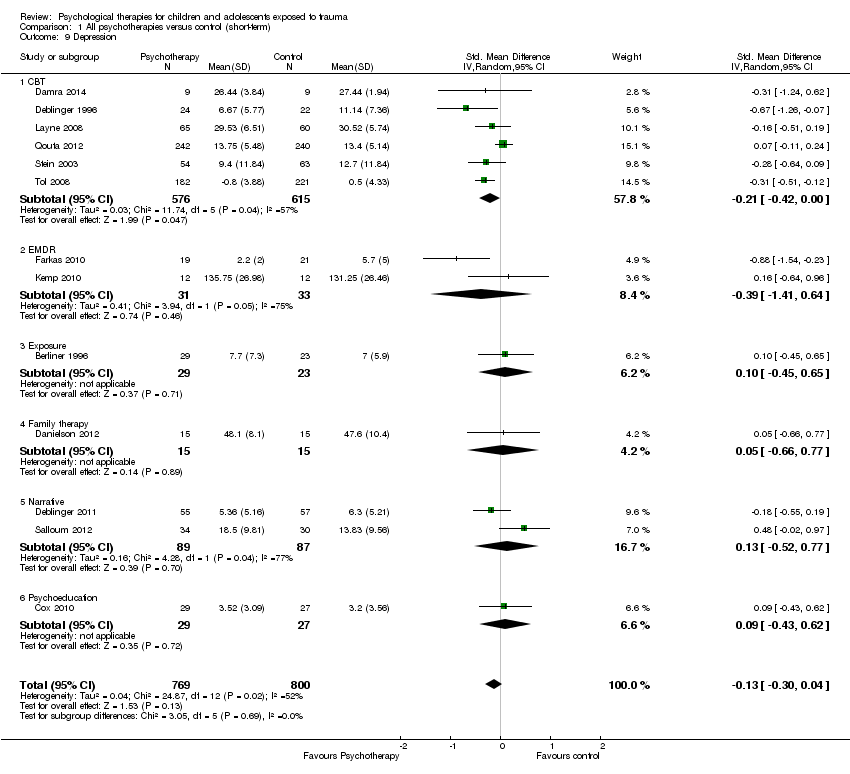
| 9 Depression Show forest plot | 13 | 1569 | Std. Mean Difference (IV, Random, 95% CI) | ‐0.13 [‐0.30, 0.04] |
|
| 9.1 CBT | 6 | 1191 | Std. Mean Difference (IV, Random, 95% CI) | ‐0.21 [‐0.42, ‐0.00] |
| 9.2 EMDR | 2 | 64 | Std. Mean Difference (IV, Random, 95% CI) | ‐0.39 [‐1.41, 0.64] |
| 9.3 Exposure | 1 | 52 | Std. Mean Difference (IV, Random, 95% CI) | 0.10 [‐0.45, 0.65] |
| 9.4 Family therapy | 1 | 30 | Std. Mean Difference (IV, Random, 95% CI) | 0.05 [‐0.66, 0.77] |
| 9.5 Narrative | 2 | 176 | Std. Mean Difference (IV, Random, 95% CI) | 0.13 [‐0.52, 0.77] |
| 9.6 Psychoeducation | 1 | 56 | Std. Mean Difference (IV, Random, 95% CI) | 0.09 [‐0.43, 0.62] |
| 10 Behaviour ‐ total Show forest plot | 3 | 166 | Std. Mean Difference (IV, Random, 95% CI) | ‐0.04 [‐0.51, 0.42] |
|
| 10.1 EMDR | 1 | 24 | Std. Mean Difference (IV, Random, 95% CI) | ‐0.44 [‐1.25, 0.37] |
| 10.2 Exposure | 1 | 77 | Std. Mean Difference (IV, Random, 95% CI) | 0.34 [‐0.11, 0.80] |
| 10.3 Family therapy | 1 | 65 | Std. Mean Difference (IV, Random, 95% CI) | ‐0.23 [‐0.72, 0.26] |
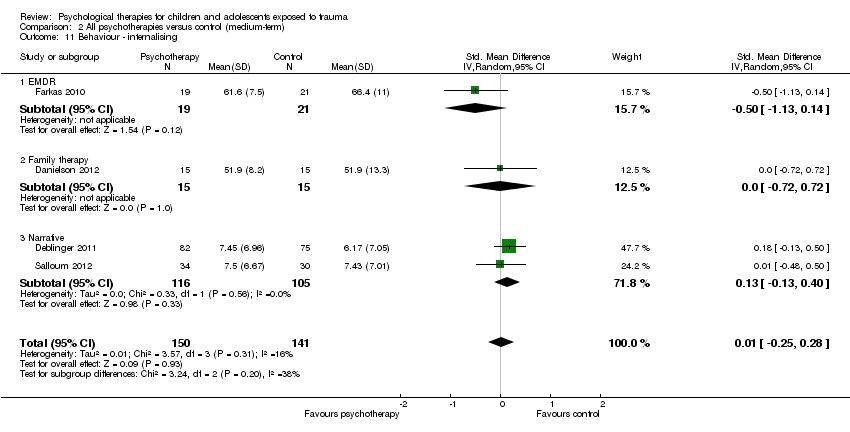
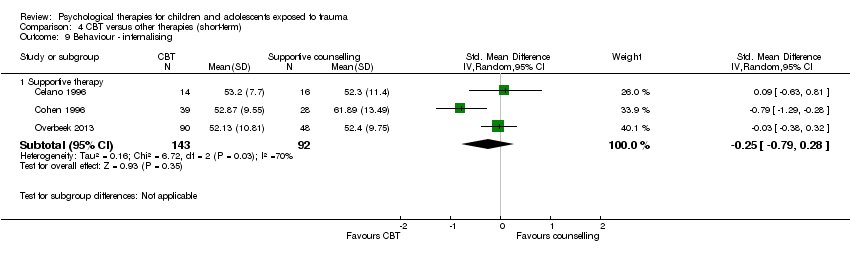
| 11 Behaviour ‐ internalising Show forest plot | 10 | 719 | Std. Mean Difference (IV, Random, 95% CI) | ‐0.04 [‐0.20, 0.13] |
|
| 11.1 CBT | 2 | 162 | Std. Mean Difference (IV, Random, 95% CI) | ‐0.13 [‐0.44, 0.18] |
| 11.2 EMDR | 2 | 64 | Std. Mean Difference (IV, Random, 95% CI) | ‐0.57 [‐1.07, ‐0.07] |
| 11.3 Exposure | 1 | 77 | Std. Mean Difference (IV, Random, 95% CI) | 0.38 [‐0.08, 0.84] |
| 11.4 Family therapy | 1 | 30 | Std. Mean Difference (IV, Random, 95% CI) | 0.32 [‐0.40, 1.04] |
| 11.5 Narrative | 2 | 180 | Std. Mean Difference (IV, Random, 95% CI) | 0.12 [‐0.18, 0.41] |
| 11.6 Psychoeducation | 2 | 206 | Std. Mean Difference (IV, Random, 95% CI) | ‐0.11 [‐0.38, 0.17] |
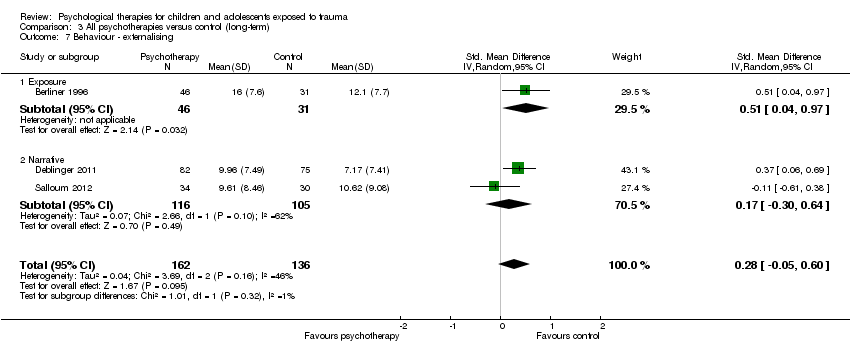
| 12 Behaviour ‐ externalising Show forest plot | 12 | 1174 | Std. Mean Difference (IV, Random, 95% CI) | ‐0.10 [‐0.33, 0.14] |
|
| 12.1 CBT | 3 | 565 | Std. Mean Difference (IV, Random, 95% CI) | ‐0.11 [‐0.28, 0.06] |
| 12.2 EMDR | 2 | 64 | Std. Mean Difference (IV, Random, 95% CI) | ‐0.55 [‐1.19, 0.10] |
| 12.3 Exposure | 1 | 77 | Std. Mean Difference (IV, Random, 95% CI) | 0.49 [0.03, 0.95] |
| 12.4 Family therapy | 1 | 30 | Std. Mean Difference (IV, Random, 95% CI) | 0.23 [‐0.49, 0.95] |
| 12.5 Narrative | 2 | 180 | Std. Mean Difference (IV, Random, 95% CI) | 0.20 [‐0.41, 0.81] |
| 12.6 Psychoeducation | 2 | 206 | Std. Mean Difference (IV, Random, 95% CI) | ‐0.03 [‐0.52, 0.46] |
| 12.7 CBT + narrative therapy | 1 | 52 | Std. Mean Difference (IV, Random, 95% CI) | ‐1.06 [‐1.64, ‐0.47] |
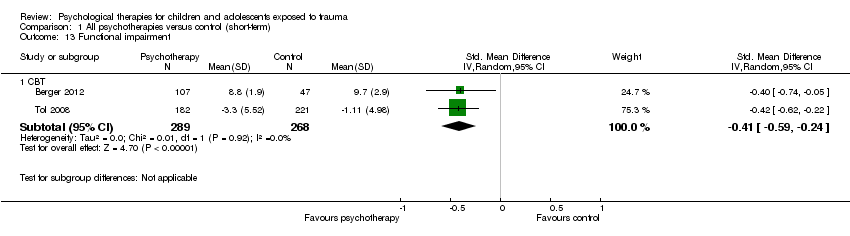
| 13 Functional impairment Show forest plot | 2 | | Std. Mean Difference (IV, Random, 95% CI) | Subtotals only |
|
| 13.1 CBT | 2 | 557 | Std. Mean Difference (IV, Random, 95% CI) | ‐0.41 [‐0.59, ‐0.24] |
| 14 Quality of life Show forest plot | 1 | | Std. Mean Difference (IV, Random, 95% CI) | Totals not selected |
|
| 14.1 Supportive therapy | 1 | | Std. Mean Difference (IV, Random, 95% CI) | 0.0 [0.0, 0.0] |
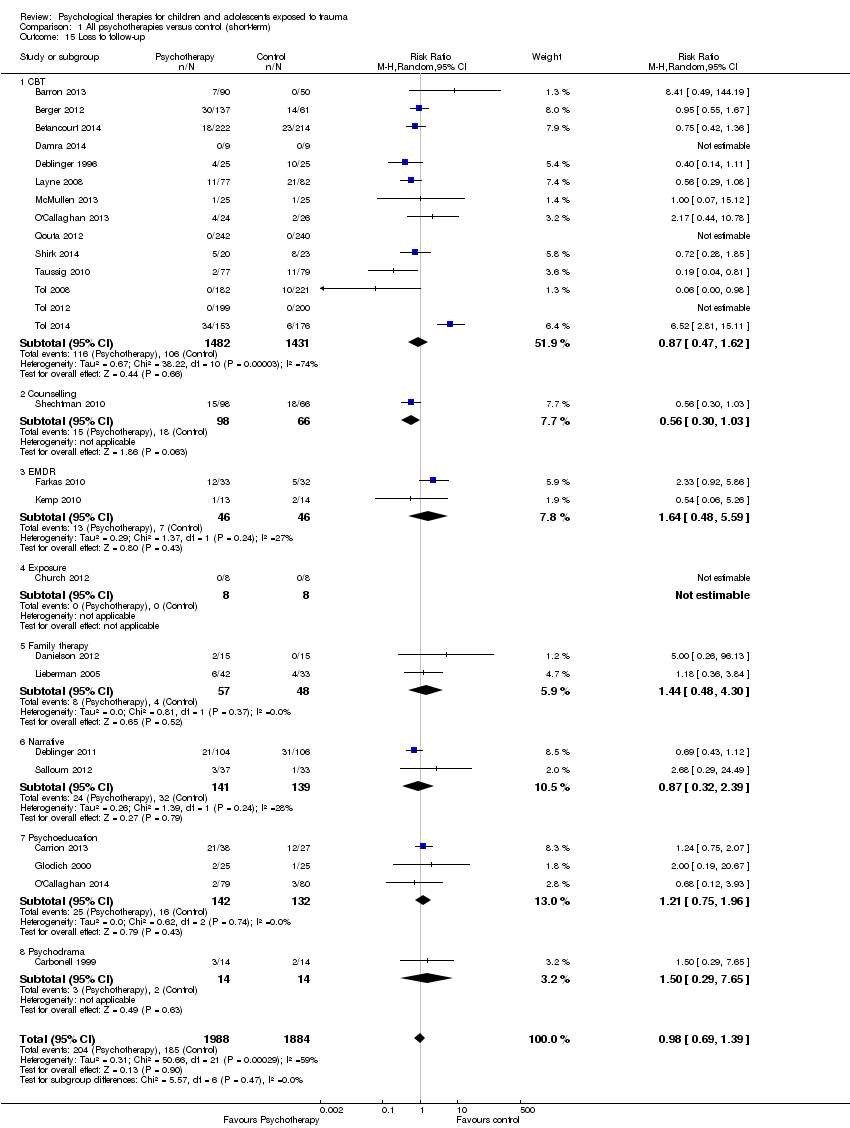
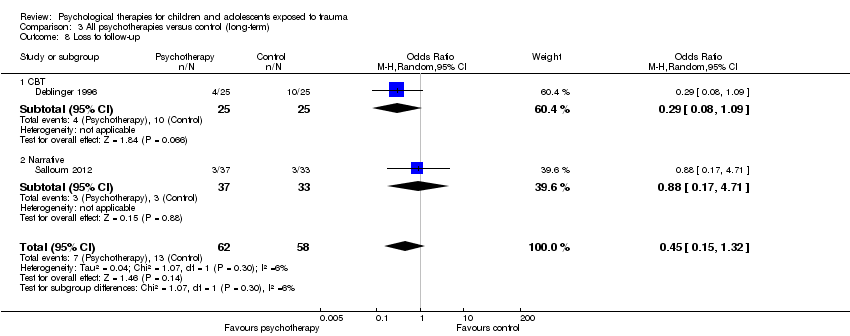
| 15 Loss to follow‐up Show forest plot | 26 | 3872 | Risk Ratio (M‐H, Random, 95% CI) | 0.98 [0.69, 1.39] |
|
| 15.1 CBT | 14 | 2913 | Risk Ratio (M‐H, Random, 95% CI) | 0.87 [0.47, 1.62] |
| 15.2 Counselling | 1 | 164 | Risk Ratio (M‐H, Random, 95% CI) | 0.56 [0.30, 1.03] |
| 15.3 EMDR | 2 | 92 | Risk Ratio (M‐H, Random, 95% CI) | 1.64 [0.48, 5.59] |
| 15.4 Exposure | 1 | 16 | Risk Ratio (M‐H, Random, 95% CI) | 0.0 [0.0, 0.0] |
| 15.5 Family therapy | 2 | 105 | Risk Ratio (M‐H, Random, 95% CI) | 1.44 [0.48, 4.30] |
| 15.6 Narrative | 2 | 280 | Risk Ratio (M‐H, Random, 95% CI) | 0.87 [0.32, 2.39] |
| 15.7 Psychoeducation | 3 | 274 | Risk Ratio (M‐H, Random, 95% CI) | 1.21 [0.75, 1.96] |
| 15.8 Psychodrama | 1 | 28 | Risk Ratio (M‐H, Random, 95% CI) | 1.5 [0.29, 7.65] |