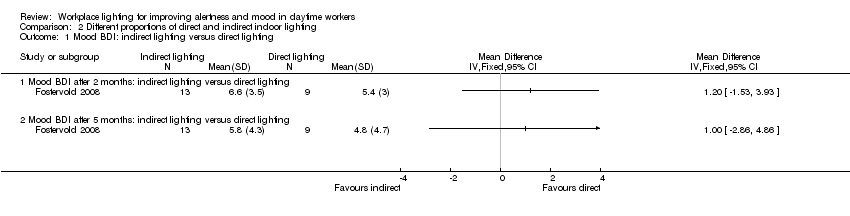
| 1 Mood BDI: indirect lighting versus direct lighting Show forest plot | 1 | | Mean Difference (IV, Fixed, 95% CI) | Totals not selected |
|
| 1.1 Mood BDI after 2 months: indirect lighting versus direct lighting | 1 | | Mean Difference (IV, Fixed, 95% CI) | 0.0 [0.0, 0.0] |
| 1.2 Mood BDI after 5 months: indirect lighting versus direct lighting | 1 | | Mean Difference (IV, Fixed, 95% CI) | 0.0 [0.0, 0.0] |
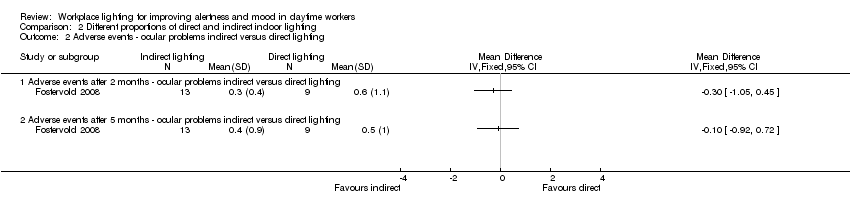
| 2 Adverse events ‐ ocular problems indirect versus direct lighting Show forest plot | 1 | | Mean Difference (IV, Fixed, 95% CI) | Totals not selected |
|
| 2.1 Adverse events after 2 months ‐ ocular problems indirect versus direct lighting | 1 | | Mean Difference (IV, Fixed, 95% CI) | 0.0 [0.0, 0.0] |
| 2.2 Adverse events after 5 months ‐ ocular problems indirect versus direct lighting | 1 | | Mean Difference (IV, Fixed, 95% CI) | 0.0 [0.0, 0.0] |
| 3 Mood Beck Depression Inventory (BDI): indirect lighting versus 70% indirect lighting Show forest plot | 1 | | Mean Difference (IV, Fixed, 95% CI) | Totals not selected |
|
| 3.1 Mood BDI after 2 months: indirect lighting versus 70% indirect lighting | 1 | | Mean Difference (IV, Fixed, 95% CI) | 0.0 [0.0, 0.0] |
| 3.2 Mood BDI after 5 months: indirect lighting versus 70% indirect lighting | 1 | | Mean Difference (IV, Fixed, 95% CI) | 0.0 [0.0, 0.0] |
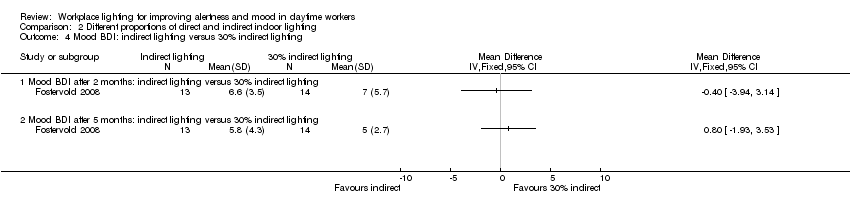
| 4 Mood BDI: indirect lighting versus 30% indirect lighting Show forest plot | 1 | | Mean Difference (IV, Fixed, 95% CI) | Totals not selected |
|
| 4.1 Mood BDI after 2 months: indirect lighting versus 30% indirect lighting | 1 | | Mean Difference (IV, Fixed, 95% CI) | 0.0 [0.0, 0.0] |
| 4.2 Mood BDI after 5 months: indirect lighting versus 30% indirect lighting | 1 | | Mean Difference (IV, Fixed, 95% CI) | 0.0 [0.0, 0.0] |
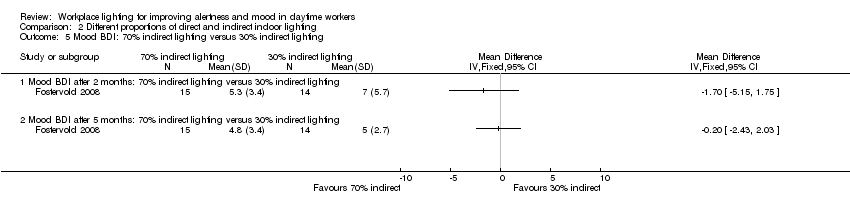
| 5 Mood BDI: 70% indirect lighting versus 30% indirect lighting Show forest plot | 1 | | Mean Difference (IV, Fixed, 95% CI) | Totals not selected |
|
| 5.1 Mood BDI after 2 months: 70% indirect lighting versus 30% indirect lighting | 1 | | Mean Difference (IV, Fixed, 95% CI) | 0.0 [0.0, 0.0] |
| 5.2 Mood BDI after 5 months: 70% indirect lighting versus 30% indirect lighting | 1 | | Mean Difference (IV, Fixed, 95% CI) | 0.0 [0.0, 0.0] |
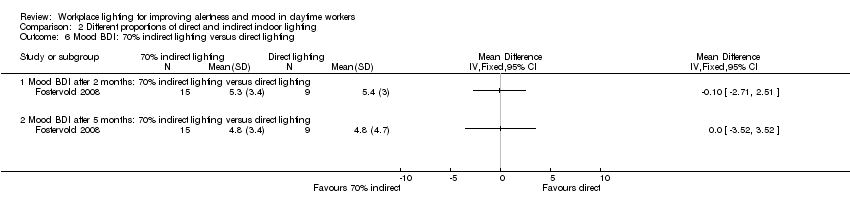
| 6 Mood BDI: 70% indirect lighting versus direct lighting Show forest plot | 1 | | Mean Difference (IV, Fixed, 95% CI) | Totals not selected |
|
| 6.1 Mood BDI after 2 months: 70% indirect lighting versus direct lighting | 1 | | Mean Difference (IV, Fixed, 95% CI) | 0.0 [0.0, 0.0] |
| 6.2 Mood BDI after 5 months: 70% indirect lighting versus direct lighting | 1 | | Mean Difference (IV, Fixed, 95% CI) | 0.0 [0.0, 0.0] |
| 7 Mood BDI: 30% indirect lighting versus direct lighting Show forest plot | 1 | | Mean Difference (IV, Fixed, 95% CI) | Totals not selected |
|
| 7.1 Mood BDI after 2 months: 30% indirect lighting versus direct lighting | 1 | | Mean Difference (IV, Fixed, 95% CI) | 0.0 [0.0, 0.0] |
| 7.2 Mood BDI after 5 months: 30% indirect lighting versus direct lighting | 1 | | Mean Difference (IV, Fixed, 95% CI) | 0.0 [0.0, 0.0] |
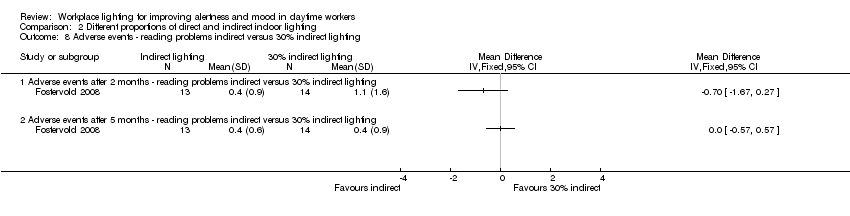
| 8 Adverse events ‐ reading problems indirect versus 30% indirect lighting Show forest plot | 1 | | Mean Difference (IV, Fixed, 95% CI) | Totals not selected |
|
| 8.1 Adverse events after 2 months ‐ reading problems indirect versus 30% indirect lighting | 1 | | Mean Difference (IV, Fixed, 95% CI) | 0.0 [0.0, 0.0] |
| 8.2 Adverse events after 5 months ‐ reading problems indirect versus 30% indirect lighting | 1 | | Mean Difference (IV, Fixed, 95% CI) | 0.0 [0.0, 0.0] |
| 9 Adverse events ‐ ocular problems indirect versus 70% indirect lighting Show forest plot | 1 | | Mean Difference (IV, Fixed, 95% CI) | Totals not selected |
|
| 9.1 Adverse events after 2 months ‐ ocular problems indirect versus 70% indirect lighting | 1 | | Mean Difference (IV, Fixed, 95% CI) | 0.0 [0.0, 0.0] |
| 9.2 Adverse events after 5 months ‐ ocular problems indirect versus 70% indirect lighting | 1 | | Mean Difference (IV, Fixed, 95% CI) | 0.0 [0.0, 0.0] |
| 10 Adverse events ‐ ocular problems indirect versus 30% indirect lighting Show forest plot | 1 | | Mean Difference (IV, Fixed, 95% CI) | Totals not selected |
|
| 10.1 Adverse events after 2 months ‐ ocular problems indirect versus 30% indirect lighting | 1 | | Mean Difference (IV, Fixed, 95% CI) | 0.0 [0.0, 0.0] |
| 10.2 Adverse events after 5 months ‐ ocular problems indirect versus 30% indirect lighting | 1 | | Mean Difference (IV, Fixed, 95% CI) | 0.0 [0.0, 0.0] |
| 11 Adverse events ‐ ocular problems 70% indirect versus 30% indirect lighting Show forest plot | 1 | | Mean Difference (IV, Fixed, 95% CI) | Totals not selected |
|
| 11.1 Adverse events after 2 months ‐ ocular problems 70% indirect versus 30% indirect lighting | 1 | | Mean Difference (IV, Fixed, 95% CI) | 0.0 [0.0, 0.0] |
| 11.2 Adverse events after 5 months ‐ ocular problems 70% indirect versus 30% indirect lighting | 1 | | Mean Difference (IV, Fixed, 95% CI) | 0.0 [0.0, 0.0] |
| 12 Adverse events ‐ ocular problems 70% indirect versus direct lighting Show forest plot | 1 | | Mean Difference (IV, Fixed, 95% CI) | Totals not selected |
|
| 12.1 Adverse events after 2 months ‐ ocular problems 70% indirect versus direct lighting | 1 | | Mean Difference (IV, Fixed, 95% CI) | 0.0 [0.0, 0.0] |
| 12.2 Adverse events after 5 months ‐ ocular problems 70% indirect versus direct lighting | 1 | | Mean Difference (IV, Fixed, 95% CI) | 0.0 [0.0, 0.0] |
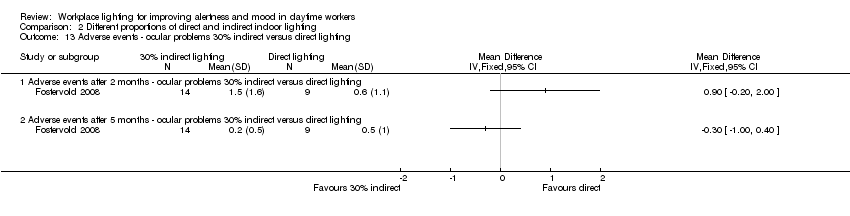
| 13 Adverse events ‐ ocular problems 30% indirect versus direct lighting Show forest plot | 1 | | Mean Difference (IV, Fixed, 95% CI) | Totals not selected |
|
| 13.1 Adverse events after 2 months ‐ ocular problems 30% indirect versus direct lighting | 1 | | Mean Difference (IV, Fixed, 95% CI) | 0.0 [0.0, 0.0] |
| 13.2 Adverse events after 5 months ‐ ocular problems 30% indirect versus direct lighting | 1 | | Mean Difference (IV, Fixed, 95% CI) | 0.0 [0.0, 0.0] |
| 14 Adverse events ‐ reading problems indirect versus 70% indirect lighting Show forest plot | 1 | | Mean Difference (IV, Fixed, 95% CI) | Totals not selected |
|
| 14.1 Adverse events after 2 months ‐ reading problems indirect versus 70% indirect lightning | 1 | | Mean Difference (IV, Fixed, 95% CI) | 0.0 [0.0, 0.0] |
| 14.2 Adverse events after 5 months ‐ reading problems indirect versus 70% indirect lightning | 1 | | Mean Difference (IV, Fixed, 95% CI) | 0.0 [0.0, 0.0] |
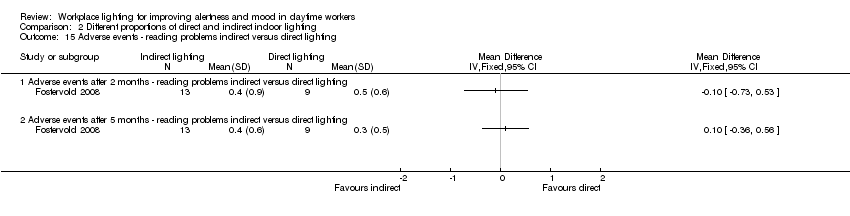
| 15 Adverse events ‐ reading problems indirect versus direct lighting Show forest plot | 1 | | Mean Difference (IV, Fixed, 95% CI) | Totals not selected |
|
| 15.1 Adverse events after 2 months ‐ reading problems indirect versus direct lighting | 1 | | Mean Difference (IV, Fixed, 95% CI) | 0.0 [0.0, 0.0] |
| 15.2 Adverse events after 5 months ‐ reading problems indirect versus direct lighting | 1 | | Mean Difference (IV, Fixed, 95% CI) | 0.0 [0.0, 0.0] |
| 16 Adverse events ‐ reading problems 70% indirect versus 30% indirect lighting Show forest plot | 1 | | Mean Difference (IV, Fixed, 95% CI) | Totals not selected |
|
| 16.1 Adverse events after 2 months ‐ reading problems 70% indirect versus 30% indirect lighting | 1 | | Mean Difference (IV, Fixed, 95% CI) | 0.0 [0.0, 0.0] |
| 16.2 Adverse events after 5 months ‐ reading problems 70% indirect versus 30% indirect lighting | 1 | | Mean Difference (IV, Fixed, 95% CI) | 0.0 [0.0, 0.0] |
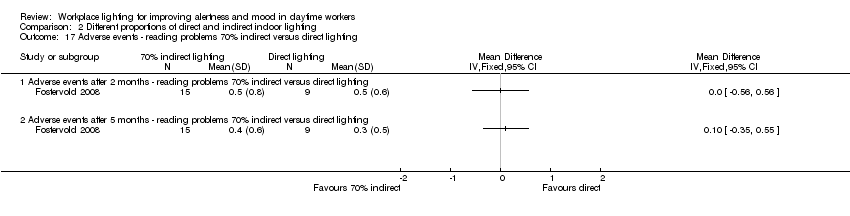
| 17 Adverse events ‐ reading problems 70% indirect versus direct lighting Show forest plot | 1 | | Mean Difference (IV, Fixed, 95% CI) | Totals not selected |
|
| 17.1 Adverse events after 2 months ‐ reading problems 70% indirect versus direct lighting | 1 | | Mean Difference (IV, Fixed, 95% CI) | 0.0 [0.0, 0.0] |
| 17.2 Adverse events after 5 months ‐ reading problems 70% indirect versus direct lighting | 1 | | Mean Difference (IV, Fixed, 95% CI) | 0.0 [0.0, 0.0] |
| 18 Adverse events ‐ reading problems 30% indirect versus direct lighting Show forest plot | 1 | | Mean Difference (IV, Fixed, 95% CI) | Totals not selected |
|
| 18.1 Adverse events after 2 months ‐ reading problems 30% indirect versus direct lighting | 1 | | Mean Difference (IV, Fixed, 95% CI) | 0.0 [0.0, 0.0] |
| 18.2 Adverse events after 5 months ‐ reading problems 30% indirect versus direct lighting | 1 | | Mean Difference (IV, Fixed, 95% CI) | 0.0 [0.0, 0.0] |
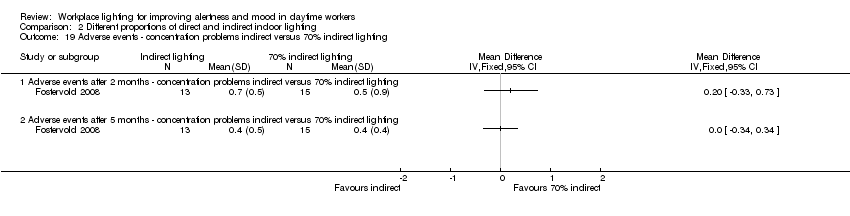
| 19 Adverse events ‐ concentration problems indirect versus 70% indirect lighting Show forest plot | 1 | | Mean Difference (IV, Fixed, 95% CI) | Totals not selected |
|
| 19.1 Adverse events after 2 months ‐ concentration problems indirect versus 70% indirect lighting | 1 | | Mean Difference (IV, Fixed, 95% CI) | 0.0 [0.0, 0.0] |
| 19.2 Adverse events after 5 months ‐ concentration problems indirect versus 70% indirect lighting | 1 | | Mean Difference (IV, Fixed, 95% CI) | 0.0 [0.0, 0.0] |
| 20 Adverse events ‐ concentration problems indirect versus 30% indirect lighting Show forest plot | 1 | | Mean Difference (IV, Fixed, 95% CI) | Totals not selected |
|
| 20.1 Adverse events after 2 months ‐ concentration problems indirect versus 30% indirect lighting | 1 | | Mean Difference (IV, Fixed, 95% CI) | 0.0 [0.0, 0.0] |
| 20.2 Adverse events after 5 months ‐ concentration problems indirect versus 30% indirect lighting | 1 | | Mean Difference (IV, Fixed, 95% CI) | 0.0 [0.0, 0.0] |
| 21 Adverse events ‐ concentration problems indirect versus direct lighting Show forest plot | 1 | | Mean Difference (IV, Fixed, 95% CI) | Totals not selected |
|
| 21.1 Adverse events after 2 months ‐ concentration problems indirect versus direct lighting | 1 | | Mean Difference (IV, Fixed, 95% CI) | 0.0 [0.0, 0.0] |
| 21.2 Adverse events after 5 months ‐ concentration problems indirect versus direct lighting | 1 | | Mean Difference (IV, Fixed, 95% CI) | 0.0 [0.0, 0.0] |
| 22 Adverse events ‐ concentration problems 70% indirect versus 30% indirect lighting Show forest plot | 1 | | Mean Difference (IV, Fixed, 95% CI) | Totals not selected |
|
| 22.1 Adverse events after 2 months ‐ concentration problems 70% indirect versus 30% indirect lighting | 1 | | Mean Difference (IV, Fixed, 95% CI) | 0.0 [0.0, 0.0] |
| 22.2 Adverse events after 5 months ‐ concentration problems 70% indirect versus 30% indirect lighting | 1 | | Mean Difference (IV, Fixed, 95% CI) | 0.0 [0.0, 0.0] |
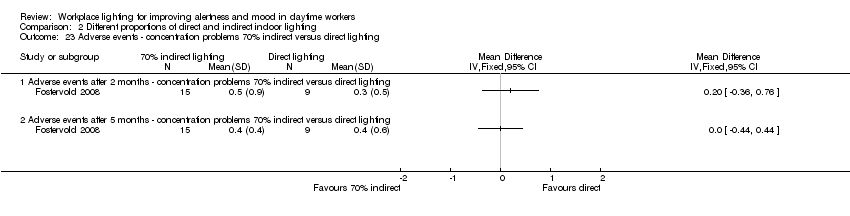
| 23 Adverse events ‐ concentration problems 70% indirect versus direct lighting Show forest plot | 1 | | Mean Difference (IV, Fixed, 95% CI) | Totals not selected |
|
| 23.1 Adverse events after 2 months ‐ concentration problems 70% indirect versus direct lighting | 1 | | Mean Difference (IV, Fixed, 95% CI) | 0.0 [0.0, 0.0] |
| 23.2 Adverse events after 5 months ‐ concentration problems 70% indirect versus direct lighting | 1 | | Mean Difference (IV, Fixed, 95% CI) | 0.0 [0.0, 0.0] |
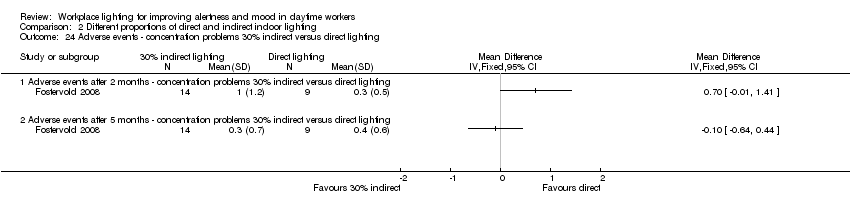
| 24 Adverse events ‐ concentration problems 30% indirect versus direct lighting Show forest plot | 1 | | Mean Difference (IV, Fixed, 95% CI) | Totals not selected |
|
| 24.1 Adverse events after 2 months ‐ concentration problems 30% indirect versus direct lighting | 1 | | Mean Difference (IV, Fixed, 95% CI) | 0.0 [0.0, 0.0] |
| 24.2 Adverse events after 5 months ‐ concentration problems 30% indirect versus direct lighting | 1 | | Mean Difference (IV, Fixed, 95% CI) | 0.0 [0.0, 0.0] |
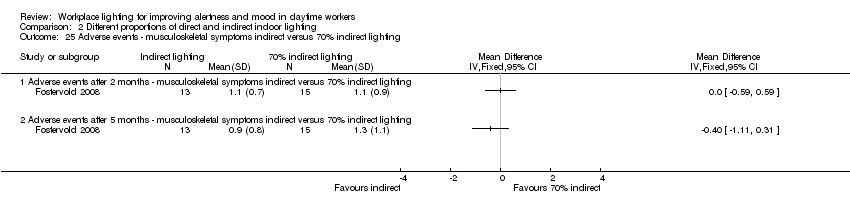
| 25 Adverse events ‐ musculoskeletal symptoms indirect versus 70% indirect lighting Show forest plot | 1 | | Mean Difference (IV, Fixed, 95% CI) | Totals not selected |
|
| 25.1 Adverse events after 2 months ‐ musculoskeletal symptoms indirect versus 70% indirect lighting | 1 | | Mean Difference (IV, Fixed, 95% CI) | 0.0 [0.0, 0.0] |
| 25.2 Adverse events after 5 months ‐ musculoskeletal symptoms indirect versus 70% indirect lighting | 1 | | Mean Difference (IV, Fixed, 95% CI) | 0.0 [0.0, 0.0] |
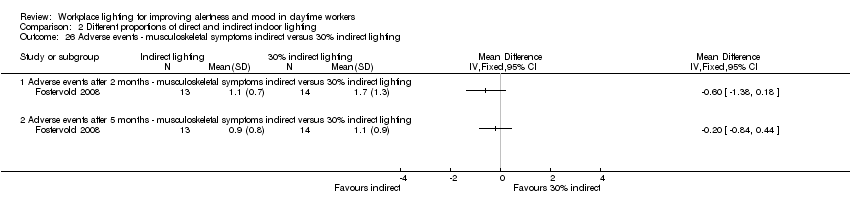
| 26 Adverse events ‐ musculoskeletal symptoms indirect versus 30% indirect lighting Show forest plot | 1 | | Mean Difference (IV, Fixed, 95% CI) | Totals not selected |
|
| 26.1 Adverse events after 2 months ‐ musculoskeletal symptoms indirect versus 30% indirect lighting | 1 | | Mean Difference (IV, Fixed, 95% CI) | 0.0 [0.0, 0.0] |
| 26.2 Adverse events after 5 months ‐ musculoskeletal symptoms indirect versus 30% indirect lighting | 1 | | Mean Difference (IV, Fixed, 95% CI) | 0.0 [0.0, 0.0] |
| 27 Adverse events ‐ musculoskeletal symptoms indirect versus direct lighting Show forest plot | 1 | | Mean Difference (IV, Fixed, 95% CI) | Totals not selected |
|
| 27.1 Adverse events after 2 months ‐ musculoskeletal symptoms indirect versus direct lighting | 1 | | Mean Difference (IV, Fixed, 95% CI) | 0.0 [0.0, 0.0] |
| 27.2 Adverse events after 5 months ‐ musculoskeletal symptoms indirect versus direct lighting | 1 | | Mean Difference (IV, Fixed, 95% CI) | 0.0 [0.0, 0.0] |
| 28 Adverse events ‐ musculoskeletal symptoms 70% indirect versus 30% indirect lighting Show forest plot | 1 | | Mean Difference (IV, Fixed, 95% CI) | Totals not selected |
|
| 28.1 Adverse events after 2 months ‐ musculoskeletal symptoms 70% indirect versus 30% indirect lighting | 1 | | Mean Difference (IV, Fixed, 95% CI) | 0.0 [0.0, 0.0] |
| 28.2 Adverse events after 5 months ‐ musculoskeletal symptoms 70% indirect versus 30% indirect lighting | 1 | | Mean Difference (IV, Fixed, 95% CI) | 0.0 [0.0, 0.0] |
| 29 Adverse events ‐ musculoskeletal symptoms 70% indirect versus direct lighting Show forest plot | 1 | | Mean Difference (IV, Fixed, 95% CI) | Totals not selected |
|
| 29.1 Adverse events after 2 months ‐ musculoskeletal symptoms 70% indirect versus direct lighting | 1 | | Mean Difference (IV, Fixed, 95% CI) | 0.0 [0.0, 0.0] |
| 29.2 Adverse events after 5 months ‐ musculoskeletal symptoms 70% indirect versus direct lighting | 1 | | Mean Difference (IV, Fixed, 95% CI) | 0.0 [0.0, 0.0] |
| 30 Adverse events ‐ musculoskeletal symptoms 30% indirect versus direct lighting Show forest plot | 1 | | Mean Difference (IV, Fixed, 95% CI) | Totals not selected |
|
| 30.1 Adverse events after 2 months ‐ musculoskeletal symptoms 30% indirect versus direct lighting | 1 | | Mean Difference (IV, Fixed, 95% CI) | 0.0 [0.0, 0.0] |
| 30.2 Adverse events after 5 months ‐ musculoskeletal symptoms 30% indirect versus direct lighting | 1 | | Mean Difference (IV, Fixed, 95% CI) | 0.0 [0.0, 0.0] |