Iluminación del lugar de trabajo para mejorar el estado de alerta y el estado de ánimo en los trabajadores diurnos
Resumen
Antecedentes
La exposición a la luz desempeña una función crucial en los procesos biológicos, e influye en el estado de ánimo y el estado de alerta. Los trabajadores diurnos pueden estar expuestos a luz insuficiente o inapropiada durante el día, lo cual da lugar a trastornos del estado de ánimo y a disminuciones en los niveles de alerta.
Objetivos
Evaluar la efectividad y la seguridad de las intervenciones con iluminación para mejorar el estado de alerta y el estado de ánimo en los trabajadores diurnos.
Métodos de búsqueda
Se hicieron búsquedas en el Registro Cochrane Central de Ensayos Controlados (Cochrane Central Register of Controlled Trials) (CENTRAL), MEDLINE, Embase y en otras siete bases de datos; en ClinicalTrials.gov y en el World Health Organization trials portal hasta enero 2018.
Criterios de selección
Se incluyeron ensayos controlados aleatorios (ECA), y ensayos controlados de antes y después (CAD) no aleatorios que emplearon un diseño cruzado o de grupo paralelos, centrados en cualquier tipo de intervenciones de iluminación aplicadas para los trabajadores diurnos.
Obtención y análisis de los datos
Dos autores de la revisión seleccionaron las referencias de forma independiente en dos estadios, extrajeron los datos de resultado y evaluaron el riesgo de sesgo. Se utilizaron las diferencias de medias estandarizadas (DME) y los intervalos de confianza (IC) del 95% para agrupar los datos de diferentes cuestionarios y escalas que evaluaban el mismo resultado a través de diferentes estudios. Se combinaron los estudios clínicamente homogéneos en un metanálisis. Se utilizó el sistema GRADE para evaluar la calidad de la evidencia.
Resultados principales
La búsqueda arrojó 2844 referencias. Después de examinar los títulos y los resúmenes, se consideraron 34 artículos de texto completo para la inclusión. Se escrutaron los informes en cuanto a los criterios de elegibilidad, lo cual resultó en la inclusión de cinco estudios (tres ECA y dos CAD) con 282 participantes en total. Estos estudios evaluaron cuatro tipos de comparaciones: luz blanca fría, técnicamente conocida como luz de temperatura de color correlacionada (TCC) alta versus iluminación estándar; diferentes proporciones de luz indirecta y directa; luz azul enriquecida aplicada individualmente versus ningún tratamiento; y luz brillante de la mañana aplicada individualmente versus luz brillante vespertina para el trastorno afectivo estacional subsindromal.
No se encontró ningún estudio que comparara un nivel de iluminancia versus otro.
Se encontraron dos estudios CAD (163 participantes) que comparaban luz de TCC alta con iluminación estándar. Al agrupar los resultados mediante el metanálisis se encontró que la luz de TCC alta puede mejorar el estado de alerta (DME ‐0,69; IC del 95%: ‐1,28 a ‐0,10; Columbia Jet Lag Scale y Karolinska Sleepiness Scale) en comparación con la iluminación estándar. En uno de los dos estudios CAD con 94 participantes no hubo diferencias en el estado de ánimo positivo (diferencia de medias [DM] 2,08; IC del 95%: ‐0,1 a 4,26) o el estado de ánimo negativo (DM ‐0,45; IC del 95%: ‐1,84 a 0,94) evaluado mediante la escala Positive and Negative Affect Schedule (PANAS). La luz de TCC alta puede dar lugar a menos eventos adversos que la iluminación estándar (un CAD; 94 participantes). Ambos estudios fueron patrocinados por la industria. La calidad de la evidencia se calificó como muy baja.
No se encontró ningún estudio que comparara la luz de una iluminancia y espectro de luz o TCC particular versus otra combinación de iluminancia y espectro de luz o TCC.
No se encontró ningún estudio que comparara la luz del día versus luz artificial.
Se encontró un ECA (64 participantes) que comparó los efectos de diferentes proporciones de luz directa e indirecta: 100% iluminación directa, 70% iluminación directa más 30% iluminación indirecta, 30% iluminación directa más 70% iluminación indirecta y 100% iluminación indirecta. No hubo diferencias apreciables en el estado de ánimo, según lo evaluado por el Beck Depression Inventory, ni en los eventos adversos, como los problemas oculares, de lectura o de concentración, a corto plazo o a plazo medio. La calidad de la evidencia se calificó como baja.
Se encontraron dos ECA que comparaban la luz administrada individualmente versus ningún tratamiento. Según un ECA con 25 participantes, la luz azul enriquecida aplicada individualmente durante 30 minutos por día puede mejorar el estado de alerta (DM ‐3,30; IC del 95%: ‐6,28 a ‐0,32; Epworth Sleepiness Scale) y puede mejorar el estado de ánimo (DM ‐4,8; IC del 95%: ‐9,46 a ‐0,14; Beck Depression Inventory). La calidad de la evidencia se calificó como muy baja. Un ECA con 30 participantes comparó la luz brillante de la mañana aplicada individualmente versus luz brillante vespertina para el trastorno afectivo estacional subsindromal. No hubo diferencias apreciables en los niveles de alerta (DM 7,00; IC del 95%: ‐10,18 a 24,18), los síntomas del trastorno afectivo estacional (CR 1,60; IC del 95%: 0,81; 3,20; número de participantes que se presentaron a la consulta con una disminución de al menos un 50% en las puntuaciones SIGH‐SAD) o la frecuencia de los eventos adversos (CR 0,53; IC del 95%: 0,26 a 1,07). Entre todos los participantes, un 57% tuvo una reducción de al menos un 50% en la puntuación SIGH‐SAD. La calidad de la evidencia se calificó como baja.
No fue posible evaluar el sesgo de publicación para ninguna de estas comparaciones.
Conclusiones de los autores
Hay evidencia de muy baja calidad basada en dos estudios CAD de que la luz de TCC alta puede mejorar el estado de alerta, pero no el estado de ánimo, en los trabajadores diurnos. Hay evidencia de muy baja calidad basada en un estudio CAD de que la luz de TCC alta también puede causar menos irritabilidad, malestar ocular y cefalea que la iluminación estándar. Hay evidencia de baja calidad basada en un ECA de que las diferentes proporciones de luz directa e indirecta en el lugar de trabajo no afectan el estado de alerta ni el estado de ánimo. Hay evidencia de muy baja calidad basada en un ECA de que la luz azul enriquecida, aplicada individualmente, mejora tanto el estado de alerta como el estado de ánimo. Hay evidencia de baja calidad basada en un ECA de que la luz brillante administrada individualmente durante la tarde presenta la misma efectividad que la exposición durante la mañana para mejorar el estado de alerta y el estado de ánimo en el trastorno afectivo estacional subsindromal.
PICO
Resumen en términos sencillos
Iluminación del lugar de trabajo para mejorar el estado de alerta y el estado de ánimo en los trabajadores diurnos
¿Cuál es el objetivo de esta revisión?
El objetivo de esta revisión Cochrane fue determinar si hay tipos específicos de iluminación que pueden cambiar los niveles de alerta y el estado de ánimo en los trabajadores diurnos.
Se recopilaron y analizaron cinco estudios que abordaron esta cuestión.
Mensajes clave
La luz blanca fría, conocida técnicamente como luz de temperatura de color correlacionada alta, puede mejorar el estado de alerta, pero no el estado de ánimo, en los trabajadores diurnos. La luz blanca fría también puede causar menos irritación, malestar ocular y cefalea. El cambio en las proporciones de la luz directa e indirecta en el lugar de trabajo puede no afectar el estado de alerta o el estado de ánimo. Los vidrios con LED montados (que significa diodos que emiten luz) que proporcionan luz azul enriquecida pueden mejorar el estado de alerta y el estado de ánimo en los trabajadores. La exposición personal a la luz brillante durante la tarde mejora el estado de alerta y el estado de ánimo al igual que la exposición personal a la luz brillante en la mañana en los pacientes que presentan síntomas que no son tan graves como para un diagnóstico de depresión estacional. Todos los resultados se basan en evidencia de baja calidad o de muy baja calidad, por lo tanto, todavía se necesitan estudios adicionales.
¿Qué se estudió en la revisión?
La luz es importante en muchas funciones biológicas, como la regulación del sueño, y puede influir en el estado de ánimo y en el nivel de alerta de la persona. Los trabajadores diurnos que pasan la mayor parte del tiempo en espacios cerrados pueden estar expuestos a niveles bajos de luz durante el día. Este hecho puede dar lugar a niveles reducidos de alerta y trastornos del estado de ánimo.
Se analizaron los datos de los estudios que investigaban los efectos de cualquier tipo de iluminación en el estado de alerta y el estado de ánimo de los trabajadores diurnos que realizan un trabajo en espacios cerrados. Los diferentes tipos de iluminación incluyen luz blanca fría comparada con luz cálida, diferentes niveles de intensidad de la luz, luz aplicada individualmente o exposición a la luz del día.
¿Cuáles son los principales resultados de la revisión?
Se incluyeron cinco estudios con 282 participantes. Los participantes eran trabajadores de oficinas y del hospital. Dos estudios investigaron el efecto de la luz blanca fría y un estudio se enfocó en fuentes de iluminación indirectas. Dos estudios investigaron el efecto de la luz administrada individualmente mediante vidrios especiales o una caja de luz (una caja chata con un lado de vidrio o plástico translúcido que contiene una luz).
La luz blanca fría puede mejorar el estado de alerta, pero no el estado de ánimo, y puede causar menos irritabilidad, malestar ocular y cefalea. Estos resultados se basan en dos estudios patrocinados por la industria.
El cambio en la proporción de luz directa e indirecta en el lugar de trabajo puede no afectar de manera significativa el estado de alerta o el estado de ánimo.
La luz azul enriquecida proporcionada mediante vidrios con LED montados puede mejorar el estado de alerta y el estado de ánimo.
La exposición individual a la luz brillante mediante una caja de luz durante la tarde puede mejorar el estado de alerta y el estado de ánimo de la misma manera que la exposición individual a la luz brillante en la mañana en los pacientes que presentan síntomas que no son tan graves como para un diagnóstico de depresión estacional.
Todos los resultados se basan en evidencia de calidad baja o muy baja (debido al número pequeño de estudios y participantes y a los problemas en cuanto a cómo se realizaron los estudios), por lo tanto, todavía se necesitan estudios adicionales.
No se encontró ningún estudio que investigara los efectos de: la intensidad de la luz, la intensidad de la luz combinada con el color de la luz, o la exposición a la luz del día.
¿Cuál es el grado de actualización de esta revisión?
Se buscaron estudios hasta el 17 enero 2018.
Conclusiones de los autores
Summary of findings
| High correlated colour temperature light versus standard illumination for improving mood and alertness in daytime workers | ||||
| Patient or population: daytime workers | ||||
| Outcomes | Anticipated absolute effects (95% CI) | № of participants (studies) | Quality of the evidence | |
| Risk with standard illumination | Risk with CCT light | |||
| Alertness KS range 1 to 9 (worst) | ‐‐ | SMD** 0.69 lower | 163 Effective sample size = 50 | ⊕⊝⊝⊝ |
| Mood (positive) | Mean standard positive mood 25.9 | MD 2.08 higher | 94 Effective sample size = 34 | ⊕⊝⊝⊝ |
| Mood (negative) | Mean standard negative mood 13.7 | MD 0.45 lower | 94 Effective sample size = 34 | ⊕⊝⊝⊝ |
| Adverse events ‐ eye discomfort | Mean standard adverse events 1.7 | MD 0.23 lower | 94 Effective sample size = 34 | ⊕⊝⊝⊝ |
| * Effective sample sizes applied to correct for the unit‐of‐analysis error. ** As a rule of thumb, 0.2 Standard Deviations represents a small difference, 0.5 a moderate difference, and 0.8 a large difference. CI: confidence interval; CCT: correlated colour temperature; MD: mean difference; PANAS: Positive and Negative Affect Schedule; SMD: standardised mean difference. | ||||
| GRADE Working Group grades of evidence | ||||
| 1 The assessment of risk of bias for non‐randomised studies starts at low‐quality evidence. We downgraded the level of evidence with one level, i.e. to very low quality, due to imprecision caused by a small sample size. 2 We would have downgraded the level of evidence with one more level due to imprecision caused by wide confidence intervals that include a null effect but we had already reached a judgment of very low‐quality evidence. | ||||
| Indirect light versus direct light for improving mood and alertness in daytime workers | ||||
| Patient or population: daytime workers | ||||
| Outcomes | Anticipated absolute effects (95% CI) | № of participants | Quality of the evidence | |
| Risk with direct light | Risk with indirect light | |||
| Alertness | Not assessed | Not assessed | Not assessed | Not assessed |
| Mood | Mean mood 5.8 | MD 1 higher | 22 | ⊕⊕⊝⊝ |
| Adverse events (ocular problems) | Mean adverse events 0.4 | MD 0.1 lower | 22 | ⊕⊕⊝⊝ |
| CI: confidence interval; MD: mean difference; RCT: randomised controlled trial. | ||||
| GRADE Working Group grades of evidence | ||||
| 1 We downgraded the level of evidence with one level, i.e. from high to moderate quality, due to risk of bias (the authors did not fully describe how or if they employed allocation concealment, outcome assessors were not blinded and there was a high and unbalanced attrition rate). 2 We downgraded the level of evidence with one level, i.e. from moderate to low quality, due to imprecision (a small sample size and a wide confidence interval including a null effect). | ||||
| Individually applied blue‐enriched light versus no treatment for improving mood and alertness in daytime workers | ||||
| Patient or population: daytime workers | ||||
| Outcomes | Anticipated absolute effects (95% CI) | № of participants | Quality of the evidence | |
| Risk with light as usual | Risk with blue‐enriched light | |||
| Alertness | Mean alertness | MD 3.3 lower | 25 | ⊕⊝⊝⊝ |
| Mood | Mean mood | MD 4.8 lower | 25 | ⊕⊝⊝⊝ |
| Adverse events | Not assessed | Not assessed | Not assessed | Not assessed |
| CI: confidence interval; MD: mean difference; RCT: randomised controlled trial. | ||||
| GRADE Working Group grades of evidence | ||||
| 1 We downgraded the level of evidence with two levels, i.e. from high to low quality, due to risk of bias (the authors did not fully describe how or if they employed allocation concealment, outcome assessors were not blinded, results for SIGH‐HDRS were not reported and there was a high attrition rate). 2 We downgraded the level of evidence with one level, i.e. from low to very low quality, due to imprecision (a small sample size and a wide confidence interval). | ||||
| Morning bright light versus afternoon bright light for improving mood and alertness in daytime workers | |||||
| Patient or population: daytime workers | |||||
| Outcomes | Anticipated absolute effects* (95% CI) | Relative effect with morning bright light | № of participants | Quality of the evidence | |
| Risk with afternoon bright light | Risk with morning bright light | ||||
| Alertness | Mean 59 (SD 23) | Mean 66 (SD 25) | MD 7 higher | 30 | ⊕⊕⊝⊝ |
| Mood | 426 per 1000 | 688 per 1000 | RR 1.60 | 30 | ⊕⊕⊝⊝ |
| Adverse events (frequency) | 712 per 1000 | 375 per 1000 | RR 0.53 | 30 | ⊕⊕⊝⊝ |
| *The risk in the intervention group (and its 95% confidence interval) is based on the assumed risk in the comparison group and the relative effect of the intervention (and its 95% CI). CI: confidence interval; MD: mean difference; RCT: randomised controlled trial; RR: risk ratio; SIGH‐SAD: Structured Interview Guide for the Hamilton Depression Rating Scale‐Seasonal Affective Disorders Version. | |||||
| GRADE Working Group grades of evidence | |||||
| 1 We downgraded the level of evidence with one level, i.e. from high to moderate quality, due to risk of bias (the authors did not fully describe their randomisation method nor how or if they employed allocation concealment). 2 We downgraded the level of evidence with one level, i.e. from moderate to low quality, due to imprecision (a small sample size and a wide confidence interval including a null effect). | |||||
Antecedentes
Descripción de la afección
La exposición a la luz desempeña una función crucial en una diversidad de procesos biológicos. La luz es no sólo fundamental para el proceso de formación de imágenes que genera la visión, sino que también ejerce efectos no visuales; promueve la regulación del reloj circadiano (Bonmati‐Carrion 2014); e influye en el estado de alerta, la cognición (Chellappa 2011) y el estado de ánimo (Sahin 2013).
El estado de alerta es un estado conductual y fisiológico de respuesta adecuada a los estímulos tanto internos como externos. La comprensión del estado de alerta abarca dimensiones múltiples además de la vigilancia, como la atención, el control de los impulsos y la motivación (Shapiro 2006). Sin embargo, por razones prácticas, el estado de alerta se ha considerado y evaluado como lo contrario de la somnolencia y la fatiga (Kaida 2006a; Samn 1982). Desde la perspectiva epidemiológica, la mayoría de los datos se centran en la presencia de los síntomas de somnolencia en lugar de en la construcción más subjetiva del estado de alerta. Hasta un 25% de la población en general informa somnolencia excesiva durante el día (Drake 2010; Ohayon 1997). La prevalencia de la somnolencia diurna también es considerable entre los trabajadores diurnos, y afecta a un 12% de las trabajadoras mujeres y a un 7% de los trabajadores hombres (Doi 2003). La somnolencia diurna en los recursos humanos se atribuye a las actividades relacionadas con el trabajo, los traslados largos y la privación del sueño (Doi 2002). Además, comúnmente se encuentran otras causas de somnolencia excesiva en la población en general, como los trastornos del sueño, la desalineación circadiana y el uso de fármacos sedantes. El deterioro en el estado de alerta repercute en la calidad de vida a nivel individual, y en la productividad, el ausentismo y el riesgo de accidente laboral a nivel institucional (Liu 2000; Mullins 2014).
La luz también influye en el estado de ánimo, definido como el estado transitorio de emociones generalizadas no orientadas a un objeto o persona particular (Clark 1982), que, en consecuencia, repercute en el bienestar, el comportamiento y el rendimiento (Seibert 1991). Esta comprensión ha surgido parcialmente a través del reconocimiento de la efectividad del tratamiento con luz brillante en el trastorno afectivo estacional y en los síndromes afectivos no estacionales. Los adultos expuestos a niveles bajos de iluminación son más propensos a exhibir síntomas de depresión atípica (Espiritu 1994). Los pacientes con depresión muestran una disminución en la amplitud de los ritmos fisiológicos, como los de la melatonina, el cortisol y la temperatura corporal (Lanfumey 2013), que ha sido implicada en la fisiopatología de los trastornos afectivos.
En ambientes cerrados, los niveles de iluminancia varían generalmente de 100 Lux a 200 Lux, y rara vez sobrepasan los 500 Lux. Estos niveles de iluminancia se consideran subóptimos para los efectos no visuales biológicos de la luz (Hébert 1998; Mills 2007), lo cual puede dar lugar a consecuencias negativas en los trabajadores diurnos que pasan la mayoría del día en espacios cerrados. Esta comprensión ha apoyado la elaboración de estrategias de iluminación que se centran en el estado de alerta y otros tipos de efectos no visuales. El cuerpo de investigación con respecto a las intervenciones de iluminación en el lugar de trabajo ha evolucionado significativamente durante los dos últimos decenios a través de la realización de estudios en el laboratorio (Borisuit 2015; Hoffmann 2008) y en el área (Boubekri 2014; Iskra‐Golec 2012; Kort 2010; Viola 2008). No obstante, todavía hay una falta de conocimiento claro acerca de qué tipos de intervención de iluminación deben recomendarse para mejorar de forma efectiva el estado de alerta y el estado de ánimo.
Descripción de la intervención
Hay muchos tipos diferentes de intervenciones de iluminación, que varían desde enfoques naturalistas de exposición a la luz del día en un lugar de trabajo bien diseñado hasta la modificación de la luz en su iluminancia y espectro. Los ejemplos de las intervenciones de iluminación son:
-
diferentes niveles de iluminancia;
-
manipulación del espectro de luz o de la temperatura de color correlacionada (TCC);
-
intervenciones combinadas (tanto iluminancia como espectro de luz o TCC);
-
exposición a la luz del día;
-
exposición a fuentes de iluminación directas versus indirectas;
-
administración de luz individual.
Además del rango de tipos de intervenciones, hay una considerable variabilidad en las intervenciones de iluminación en cuanto a la intensidad (dosificación), la duración y el momento adecuado de la administración de la luz y en cuanto al comparador. Debido a que es prácticamente imposible usar un control inactivo (ausencia total de luz), los comparadores son algún tipo de intervención de control activo. La luz blanca policromática y la luz con diferentes niveles de iluminancia o TCC son algunos de los comparadores más frecuentes.
De qué manera podría funcionar la intervención
Un grupo vasto de evidencia apoya la existencia de efectos no visuales de la luz. La exposición a niveles altos de iluminancia reduce las ondas delta cerebrales (Kuller 1993), lo cual indica la promoción del estado de alerta. La luz brillante reduce los niveles de somnolencia cuando se aplica de noche (Cajochen 2000) y durante el día (Phipps‐Nelson 2003). La luz brillante activa las áreas que promueven la vigilia en el tronco encefálico, el hipotálamo y el tálamo (Vandewalle 2006; Vandewalle 2007), lo cual mejora el rendimiento neuroconductual (Boyce 1997).
La formación de las imágenes visuales depende básicamente de los conos y bastones localizados en la retina, aunque el efecto no visual de la luz también se ha atribuido a las células del ganglio retiniano intrínsecamente fotosensibles (CGRif), otro tipo de célula retiniana que contiene el fotopigmento melanopsina. La sensibilidad de la melanopsina alcanza su punto máximo al espectro de luz azul (Berson 2002), que es diferente de la sensibilidad de otras opsinas encontradas en los conos y bastones. Los conos y bastones también están involucrados en los efectos no visuales de la luz, aunque en menor grado (Hubbard 2013). La modificación de la luz en su espectro para obtener luz azul enriquecida se dirige a la máxima estimulación de las CGRif para potenciar el efecto no visual de la luz y promover el estado de alerta. Sin embargo, el efecto de alerta de la luz no parece ser exclusivo del espectro de luz azul. La exposición a la luz roja también aumenta los niveles subjetivos de alerta y el poder en la frecuencia beta en el electroencefalograma (Plitnick 2010) y mejora el rendimiento (Sahin 2014), posiblemente a través de mecanismos independientes del sistema circadiano que involucran la activación de los conos y bastones
Por lo tanto, se ha formulado la hipótesis de que existen dos mecanismos de acción en la generación de los efectos no visuales de la luz: una vía circadiana a través de la estimulación del núcleo supraquiasmático del sistema circadiano que da lugar a la inhibición posterior de la secreción de melatonina, que es mediada en gran parte por las CGRif; y un efecto directo, independiente del sistema circadiano (Cajochen 2007; Chang 2013). El grado en que se ejerce el efecto directo de la luz a través de las CGRif o mediante la participación de los conos y bastones no está del todo claro. Este debate teórico crea implicaciones prácticas con respecto a los diferentes puntos máximos de la sensibilidad de la melanopsina y otras opsinas. Sin embargo, una limitación importante a este enfoque dicotómico es la imposibilidad de separar el efecto circadiano completamente del efecto directo de la luz. La mayoría de los estudios que apuntan hacia la aclaración de los efectos directos de la luz emplea protocolos de exposición a la luz que se presentan durante el día, cuando la influencia circadiana es menos importante, pero aún posible.
Por qué es importante realizar esta revisión
La exposición deficiente a la luz durante el día se ha asociado con niveles inferiores de alerta y una repercusión negativa sobre el estado de ánimo. Sin embargo, muchos ensayos que evalúan la eficacia de las intervenciones de iluminación en cuanto a la mejoría del estado de alerta y el estado de ánimo se realizan dentro del laboratorio, en lugar de en ámbitos reales, lo cual puede no ser representativo de la efectividad en la vida real. Una revisión sistemática de las intervenciones de iluminación centradas en la mejoría del estado de alerta y el estado de ánimo ayudará a aclarar qué tipos de intervención son efectivos y seguros en el ámbito de la vida real.
Objetivos
Evaluar la efectividad y la seguridad de las intervenciones con iluminación para mejorar el estado de alerta y el estado de ánimo en los trabajadores diurnos.
Métodos
Criterios de inclusión de estudios para esta revisión
Tipos de estudios
Se consideraron para la inclusión tanto los ensayos controlados aleatorios (ECA) con asignación al azar individual como los ECA con asignación al azar grupal, y los ensayos controlados no aleatorios de antes y después (CAD) que emplearon un diseño cruzado o de grupos paralelos o series de tiempo interrumpido que informaban al menos tres mediciones antes de la intervención y tres mediciones después de la misma. La decisión de incluir estudios no aleatorios se basó en el hecho de que las intervenciones de iluminación generalmente se realizan en oficinas y pisos completos, en lugar de aplicarse a nivel individual.
Se incluyeron sólo estudios realizados en lugares de trabajo reales, por lo tanto, se excluyeron los estudios realizados en condiciones de laboratorio.
Tipos de participantes
Se incluyeron estudios realizados con adultos a partir de los 18 años de edad que trabajaban exclusivamente en lugares cerrados, en el período restringido desde las 7:00 a.m. a las 10:00 p.m., de forma independiente del tipo de trabajo, la industria y las comorbilidades.
Se excluyeron los estudios realizados con participantes en otros tipos de esquemas de trabajo como turnos de medianoche u horarios rotativos, para disminuir la influencia de los efectos de desalineación circadiana.
Tipos de intervenciones
Se consideraron para la inclusión los ensayos que habían comparado la efectividad de diferentes tipos de intervenciones de iluminación del siguiente modo:
-
un nivel de iluminancia versus otro;
-
luz de un espectro o TCC particular versus otro; como la luz azul enriquecida versus iluminación estándar, o luz “blanca fría” (mayor que 5000 K) versus luz “blanca cálida” (menor que 5000 K);
-
luz de una iluminancia y espectro de luz o TCC particular versus otra combinación de iluminancia y espectro de luz o TCC;
-
luz del día versus luz artificial;
-
fuentes de iluminación indirectas versus directas; y
-
luz administrada individualmente versus ningún tratamiento.
Tipos de medida de resultado
El alcance de esta revisión fue evaluar la eficacia de las intervenciones de iluminación sobre el estado de alerta y el estado de ánimo debido a que hay evidencia irrefutable de que la exposición a la luz durante el día desempeña una función fundamental en la regulación del ciclo vigilia‐sueño y en la influencia en el estado de ánimo. Se incluyeron los estudios que evaluaron al menos uno de los resultados primarios.
Resultados primarios
-
Estado de alerta.
Se consideraron para la inclusión los estudios que medían la autopercepción del estado de alerta, la somnolencia y la fatiga mediante escalas validadas como la Karolinska Sleepiness Scale (Kaida 2006a), la Stanford Sleepiness Scale (Hoddes 1973), la Epworth Sleepiness Scale (ESS; Johns 1991), la lista de verificación de la fatiga Samn‐Perelli (Samn 1982), y las escalas analógicas visuales (EAV), o los estudios que evaluaban parámetros objetivos, como la duración del parpadeo, la pupilometría y el electroencefalograma.
-
Estado de ánimo.
Se incluyeron estudios que evaluaban el estado de ánimo mediante escalas validadas y cuestionarios que contenían preguntas acerca de diferentes sentimientos y emociones, como el Profile of Mood States (Morfeld 2007) y el Positive and Negative Affect Schedule (PANAS) (Watson 1988). También se incluyeron estudios que utilizaron EAV.
Resultados secundarios
-
Eventos adversos.
Número de participantes que presentaban algún tipo de efectos adversos causados por las intervenciones de iluminación como irritación ocular, fotosensibilidad, migraña, irritabilidad e insomnio.
Métodos de búsqueda para la identificación de los estudios
Búsquedas electrónicas
We conducted a systematic literature search to identify all published and unpublished trials that could be considered eligible for inclusion in this review. We adapted the search strategy we developed for PubMed for use in the other electronic databases. The literature search identified potential studies in all languages.
We searched the following electronic databases from inception to January 2018 for identifying potential studies:
-
Cochrane Central Register of Controlled Trials (CENTRAL) (Wiley Online Library) (Appendix 1);
-
MEDLINE (PubMed) (Appendix 2);
-
Embase (Embase.com) (Appendix 3);
-
PsycINFO (EBSCOhost) (Appendix 4);
-
NIOSHTIC (OSH‐UPDATE) (Appendix 5);
-
NIOSHTIC‐2 (OSH‐UPDATE) (Appendix 5);
-
HSELINE (OSH‐UPDATE) (Appendix 5);
-
CISDOC (OSH‐UPDATE) (Appendix 5);
-
LILACS (BVS) (Appendix 6);
-
SCOPUS (EBSCOhost) (Appendix 7).
We conducted a search for unpublished trials in ClinicalTrials.gov (www.ClinicalTrials.gov) (Appendix 8) and the World Health Organization (WHO) trials portal (www.who.int/ictrp/en/) (Appendix 9). We imposed no restriction on language of publication.
Búsqueda de otros recursos
We performed handsearching of the reference lists of all primary studies to find additional references.
Obtención y análisis de los datos
Selección de los estudios
We conducted the selection of eligible studies in two stages. First, two review authors (DVP, RR) independently screened titles and abstracts of all potentially relevant studies found by the systematic search to identify studies for inclusion. The same review authors coded them as 'include' (eligible or potentially eligible/unclear) or 'exclude.' At this stage, we excluded all references that clearly did not fulfil the inclusion criteria or that fulfilled the exclusion criteria. At the second stage, we retrieved the full‐text reports/publications and two review authors (DVP, RR) independently assessed the full text and identified studies for inclusion. We included all references that fulfilled the inclusion criteria. We recorded reasons for exclusion of the ineligible studies assessed as full‐texts and reported these in the Characteristics of excluded studies table. We resolved disagreements through discussion. We identified and excluded duplicates. We recorded the selection process in sufficient detail to complete a PRISMA study flow diagram (Figure 1).
If studies had had multiple publications, we planned to collate the reports of the same study so that each study, rather than each report, was the unit of interest for the review, and such studies had a single identifier with multiple references.
Extracción y manejo de los datos
We used a data collection form for study characteristics and outcome adapted from EPOC 2013 and previously piloted on one study. One review author (DVP) extracted the following study characteristics from included studies. A second review author (RR) spot‐checked study characteristics for accuracy against the trial report.
-
Methods: study design, total duration of study, study location, study setting, withdrawals and date of study.
-
Participants: number (n), mean age or age range, sex/gender, severity of condition, inclusion criteria and exclusion criteria.
-
Interventions: description of intervention, comparison, duration, intensity, content of both intervention and control condition, and co‐interventions.
-
Outcomes: description of primary and secondary outcomes specified and collected, and at which time points reported.
-
Notes: funding for trial and notable conflicts of interest of trial authors.
Two review authors (DVP, RR) independently extracted outcome data from included studies. We resolved disagreements by consensus. One review author (DVP) transferred data into Review Manager 5 (RevMan 2014). We double‐checked that data were entered correctly by comparing the data presented in the systematic review with those of the study reports.
Evaluación del riesgo de sesgo de los estudios incluidos
Two review authors (DVP, RR) independently assessed risk of bias for each study using the criteria outlined in the Cochrane Handbook for Systematic Reviews of Interventions (Higgins 2011). We resolved disagreements by discussion.
We assessed the risk of bias of all studies included in the review according to the following domains.
-
Random sequence generation.
-
Allocation concealment.
-
Blinding of participants and personnel.
-
Blinding of outcome assessment.
-
Incomplete outcome data.
-
Selective outcome reporting.
-
Other bias (non‐controlled co‐interventions or other potential source of bias).
When assessing the risk of bias of cluster trials, we added the domains of recruitment bias, baseline imbalance, loss of clusters, incorrect analysis and comparability with individually randomised trials. For cross‐over trials, we added the domains of carry‐over effect, availability of two‐periods of data, incorrect analysis and comparability of results with those from parallel‐group trials.
For CBA trials, we used the validated instrument for appraising the risk of bias of CBA studies by Downs 1998. The instrument has good reliability and internal consistency and validity and consists of five sub‐scales: reporting, external validity, bias, confounding and power). We used only the combined score on the two internal validity sub‐scales (bias and confounding) to judge the quality of the included controlled before‐after studies. We used an arbitrary cut‐off score of 50% of the maximum attainable score of the internal validity scale to discern low risk of bias from high risk of bias.
We also checked for relevant and considerable baseline differences between control and intervention groups based on age and gender.
We graded each potential risk of bias as high, low or unclear, and, whenever possible, we provided a quote from the study report together with a justification for our judgement in the 'Risk of bias' table. We summarised the risk of bias judgements across different studies for each of the domains listed.
When considering treatment effects, we took into account the risk of bias for the studies that had contributed to that outcome.
We judged a study to have a high risk of bias overall when we judged one or more domains to have a high risk of bias. Conversely, we judged a study to have a low risk of bias when we judged low risk of bias for all domains.
Assessment of bias in conducting the systematic review
We conducted this review according to the published protocol (Pachito 2016) and report deviations from it in the 'Differences between protocol and review' section.
Medidas del efecto del tratamiento
We entered the outcome data for each study into the data tables in Review Manager 5 to calculate treatment effects (RevMan 2014). For dichotomous outcomes, we used risk ratios (RR) with 95% confidence intervals (CI). For continuous outcome, we planned to use mean difference (MD) and 95% CI for studies that assessed the same outcome measured the same way and standardised mean differences (SMD) and 95% CI for studies that assessed the same outcome measured in different ways (e.g. different scale or questionnaires). When only effect estimates and their 95% CI or standard errors were reported in studies, we entered these data into Review Manager 5 using the generic inverse variance method (RevMan 2014). We ensured that higher scores for continuous outcomes had the same meaning for a particular outcome.
Cuestiones relativas a la unidad de análisis
For studies that employed a cluster‐randomised design and that had not made an allowance for the design effect, we calculated the design effect based on a fairly large assumed intracluster correlation coefficient (ICC) of 0.10. We based this assumption of 0.10 being a realistic estimate by analogy on studies about implementation research (Campbell 2001). We followed the methods stated in the Cochrane Handbook for Systematic Reviews of Interventions for the calculations (Higgins 2011).
Manejo de los datos faltantes
We contacted one investigator to verify key study characteristics and obtain missing numerical outcome data (Fostervold 2008).
When numerical outcome data were missing, such as standard deviations or correlation coefficients, we calculated them from other available statistics such as P values according to the methods described in the Cochrane Handbook for Systematic Reviews of Interventions (Higgins 2011).
Evaluación de la heterogeneidad
We assessed the clinical homogeneity of the results of included studies based on similarity of intervention, outcome and follow‐up (Verbeek 2012).
Since the inclusion criteria for participant populations were well‐defined and somewhat restricted, we considered all populations as being sufficiently homogeneous to be compared, and Interventions similar when they represented the same mechanism of provision or modification of the light source (e.g. different illuminance levels, modification of light spectrum, exposure to daylight).
-
One level of illuminance versus another.
-
Light of a particular spectrum or CCT versus another; such as blue‐enriched light versus standard illumination, or 'cool white' light (greater than 5000 K) versus 'warm white' light (less than 5000 K).
-
Light of a particular illuminance and light spectrum or CCT versus another combination of illuminance and light spectrum or CCT.
-
Daylight versus artificial light.
-
Indirect versus direct light source.
-
Individually administered light versus no treatment.
We considered validated subjective scales and questionnaires and VAS that evaluated alertness or mood as being similar enough to be compared.
We used the I² statistic to measure heterogeneity across trials in each analysis. We considered substantial heterogeneity for I² values of 50% or greater (Higgins 2011), although we recognise that there is uncertainty in the I² measurement when there are few studies in a meta‐analysis. We used a significance level of P < 0.1 to assess heterogeneity.
Evaluación de los sesgos de notificación
If we can include a sufficient number of studies in future updates of this review, we will explore reporting biases, according to the following domains (Higgins 2011).
-
Publication bias.
-
Multiple publication bias.
-
Location bias.
-
Citation bias.
-
Outcome reporting bias.
Síntesis de los datos
We pooled data from studies judged to be clinically homogeneous using Review Manager 5 (RevMan 2014). When more than one study provided usable data in any single comparison, we performed a meta‐analysis. We previously defined that for meta‐analyses with an I² statistic lower than 50%, we would use a fixed‐effect model, and for an I² statistic of 50% or greater, we would use a random‐effects model. We planned not to pool results of studies in meta‐analysis when the I² statistic was higher than 75%.
For meta‐analysis, we planned to consider two distinct groups of controlled trials: randomised, and non‐randomised or quasi‐randomised.
For studies with multiple trial arms, we included all relevant arms. We had planned to describe study arms irrelevant to this review in detail in the Characteristics of included studies table. However, all study arms were relevant to this review.
'Summary of findings' table
We created 'Summary of findings' tables using both primary outcomes and the secondary outcome, namely alertness, mood and adverse events. When multiple measurements were reported for the same outcome, we elected the most representative measurement from the clinical perspective, and provided reasons for that. We used the five GRADE domains (study limitations, consistency of effect, imprecision, indirectness and publication bias) to assess the quality of the body of evidence as it relates to the studies that had contributed data to the meta‐analyses for the prespecified outcomes. We used methods and recommendations described in Section 8.5 and Chapter 12 of the Cochrane Handbook for Systematic Reviews of Interventions (Higgins 2011), and we used GRADEpro software. We justified all decisions to downgrade or upgrade the quality of studies in the footnotes.
Análisis de subgrupos e investigación de la heterogeneidad
If we can include a sufficient number of studies in future updates of this review, we will carry out subgroup analyses. We will conduct separate analyses based on the type of workers (blue‐collar (people who perform manual labour) versus white‐collar (people who perform professional jobs) workers) and the intensity, duration, timing and length of intervention. We will also compare intensity (dosage) of light using the criteria of photopic illuminance and melanopic illuminance, whenever possible.
We will also compare light interventions of different lengths: short term (up to three months), medium term (from three months up to one year) and long term (longer than one year) separately.
We found too few studies to perform subgroup analyses in this version of our review.
Análisis de sensibilidad
If we can include a sufficient number of studies in future updates of this review, we will perform sensitivity analyses defined a priori to assess the robustness of our conclusions. This will involve excluding studies with:
-
high risk of bias; or
-
industry sponsorship, respectively.
Bias in industry‐sponsored studies may exist in multiple levels and, therefore, may affect confidence in the results (Chopra 2003).
We found too few studies to perform sensitivity analyses in this version of our review.
Reaching conclusions
We based our conclusions only on the findings from the quantitative or narrative synthesis of the included studies, and we considered the quality of evidence for each outcome. We avoided making recommendations for practice based on more than just the evidence, such as values and available resources. Our implications for research suggest priorities for future research and outline what the remaining uncertainties are in the area.
Results
Description of studies
Results of the search
Our systematic search conducted in January 2018 yielded 2844 references, after the removal of 533 duplicates. After the screening of titles and abstracts, 34 full‐text articles were considered for inclusion. We scrutinised these study reports against our eligibility criteria, reaching the final inclusion of five studies. Studies excluded at this point are listed in the Characteristics of excluded studies table. Reasons for exclusion were design, setting and population different from the scope of this review. We found no ongoing studies that could fulfil our inclusion criteria and we identified no potential studies from other sources. The PRISMA study flow diagram is depicted in Figure 1.
Included studies
Study designs
Of the five included studies, three were RCTs (Avery 2001; Bragard 2013; Fostervold 2008) and two were CBA studies (Mills 2007; Viola 2008). All RCTs employed individual allocations, two with a parallel design (Avery 2001; Fostervold 2008), and one with a cross‐over design (Bragard 2013). Both CBA studies employed cluster allocation, one with a parallel design (Mills 2007), and one with a cross‐over design (Viola 2008).
Neither of the studies employing cluster allocation took into account the unity of analysis error, which meant we had to correct the effect estimates. We also performed the necessary adjustments for the cross‐over study by Bragard 2013.
Study location and time of the year
All studies were conducted in the Northern hemisphere, between latitudes of 47º 60' (Avery 2001) and 59º 91' (Fostervold 2008). Four studies were conducted in Europe and one study was conducted in North America (Avery 2001). All studies were conducted during wintertime, sometimes starting in the previous autumn or ending in the beginning of next spring, with the exception of the study by Fostervold 2008, which was conducted over a one‐year period.
Type of settings and participants
Four studies recruited participants irrespective of the presence of symptoms or complaints related to mood disorders or to difficulty in maintaining satisfactory levels of alertness during daytime (Bragard 2013; Fostervold 2008; Mills 2007; Viola 2008). Avery 2001 recruited participants presenting subsyndromal seasonal affective disorder.
Four studies recruited participants using advertisements (Avery 2001; Fostervold 2008; Mills 2007; Viola 2008), and one study used direct invitations in the workplace (Bragard 2013). In this last case, participation rate was either not reported or as low as 25% (Bragard 2013).
Four studies recruited office workers, working either in private offices or in open‐plan offices (Avery 2001; Fostervold 2008; Mills 2007; Viola 2008). Only one study focused on health workers performing activities in a windowless hospital department (Bragard 2013).
Sample sizes
The number of participants in the included studies ranged from 25 to 94 (mean 56). Studies with the lowest number of participants were the ones by Avery 2001 (n = 30), and Bragard 2013 (n = 25), in which the authors assessed individually applied light.
Interventions
One level of illuminance versus another
We found no studies employing this comparison.
Light of a particular spectrum or CCT versus another
We found two studies employing this comparison (Mills 2007; Viola 2008).
Mills 2007 and Viola 2008 assessed lamp changes to entire floors, comparing high CCT office lighting (17,000 K) versus standard lighting systems (2900 K for Mills 2007, and 4000 K for Viola 2008). Both types of fluorescent tubes were 18 W with a similar spectral power distribution in the medium and long wavelength ranges, but with more output between 420 nm to 480 nm for the 17,000 K light source. Both studies deployed the ActiViva Active, Philips as the 17,000 K light source.
Light of a particular illuminance and light spectrum or CCT versus another combination of illuminance and light spectrum or CCT
We found no studies employing this comparison.
Daylight versus artificial light
We found no studies employing this comparison.
Indirect versus direct light sources
We found one study employing this comparison (Fostervold 2008).
Fostervold 2008 evaluated four types of lighting systems, with different proportions of indirect and direct light sources. Lighting scheme 1 provided 100% indirect lighting; lighting scheme 2 provided 70% indirect lighting and 30% direct lighting; lighting scheme 3 provided 30% indirect lighting and 70% direct lighting; and lighting scheme 4 provided 100% direct lighting.
Individually administered light versus no treatment
We found two studies employing this comparison. The study by Avery 2001 evaluated using light boxes and the one by Bragard 2013 evaluated using glasses with mounted light emitting diodes (LEDs).
Avery 2001 assessed two hours of bright light in the morning, during the first two hours available between 07:00 a.m. and 12:00 a.m., versus two hours of bright light during the afternoon, during the last two hours available between 12:00 a.m. and 17:00 p.m. The bright light source was a light box, positioned 60 cm from the participant, capable of emitting 2500 Lux (Philips Bright Light). The study by Bragard 2013 assessed the use of glasses equipped with eight LEDs generating blue‐enriched light. Participants wore glasses at work in the morning between 07:00 and 09:00 a.m. for a maximum of 30 minutes daily at least five days a week.
Multiple intervention arms
The study by Fostervold 2008 employed multiple interventions arms that assessed four different types of lighting systems (lighting schemes 1 to 4; see Characteristics of included studies table). All the other studies restricted interventions to one arm. None of the included studies had cointerventions, the effects of which could have affected those of the lighting interventions.
Outcomes
Alertness
Avery 2001 assessed alertness using a VAS with a 100‐mm line. Other studies employed validated scales, such as the Epworth Sleepiness Scale (Bragard 2013); the Columbia Jet Lag Scale, specifically its items 'Decreased Daytime Alertness' and 'Sleepiness in Day' (Mills 2007); or the Karolinska Sleepiness Scale (Viola 2008). One included study did not assess alertness (Fostervold 2008).
Mood
Included studies employed validated scales and subscales for measuring mood, such as the Structured Interview Guide for the Hamilton Depression Rating Scale‐Seasonal Affective Disorders Version (SIGH‐SAD) and its subscales (Avery 2001; Bragard 2013) (Williams 1994); the Beck Depression Inventory (BDI; Bragard 2013; Fostervold 2008); or the PANAS scale for positive and negative mood (Viola 2008). In addition, Avery 2001 evaluated mood using a VAS 100‐mm line. One included study did not assess mood (Mills 2007).
Adverse events
Bragard 2013 and Mills 2007 did not evaluate adverse events related to light exposure. Avery 2001 used a questionnaire focusing on mild adverse events that were reported as one outcome. Fostervold 2008 evaluated ocular problems (pain or itching in the eyes, tired eyes, photophobia, redness of the eyes); reading problems (focusing problems, problems with line tracking, foggy letters or words, doubling of letters or words, shivering text); concentration problems; and musculoskeletal problems (pain in the neck, shoulder, back, forearm, or leg). Viola 2008 used a study questionnaire evaluating the incidence of irritability, eye strain, eye discomfort, eye fatigue, difficulty focusing and difficulty concentrating and blurred vision.
Follow‐up
The lengths of follow‐up were: two weeks (Avery 2001), four weeks (Viola 2008), three months (Mills 2007), 16 weeks (roughly 3.7 months) (Bragard 2013), and five months (Fostervold 2008).
Excluded studies
We excluded 29 studies (Characteristics of excluded studies table). The majority of these studies were conducted in laboratory settings or they employed cross‐sectional designs. Reasons for exclusion were as follows.
-
Setting: 10 studies were conducted in a laboratory, rather than at the workplace (Chen 2004; Hawes 2012; Huiberts 2016; Kaida 2006b; Kraneburg 2017; Leichtfried 2015; Lerchl 2009; Münch 2012; Vimalanathan 2014; Vossen 2016). One study applied the lighting intervention purely in a residential setting (Buffoli 2007), and one combined light exposure in residential and occupational settings (Partonen 2000). One study did not specify the setting and attempts to contact the primary researcher failed (NCT02858765).
-
Design: 10 were cross‐sectional studies or narrative reviews (Axarli 2008; Hadi 2015; Hegde 1991; Noell‐Waggoner 2008; Pathak 2014; Robertson 1989; Singh 2010; Stammerjohn 1981; van Bommel 2006; Weiss 2013). One study was uncontrolled with the participation of adults attending a lecture within a University facility (Lehrl 2007).
-
Outcome: neither alertness nor mood was evaluated (Aarås 1998; Haans 2014).
-
Population: one study assessed lighting interventions in undergraduate and graduate students (Gray 2012).
-
Intervention: in one study, the intervention of interest was different colours of walls (Janardana 2010) and in another study, the intervention was ventilation systems (Robertson 1985).
Risk of bias in included studies
Allocation
Randomisation
Three studies allocated participants to groups using randomisation (Avery 2001; Bragard 2013; Fostervold 2008). Bragard 2013 performed randomisation by random draw and we judged this to result in a low risk of bias. However, Avery 2001 and Fostervold 2008 did not describe the methods used to conduct randomisation. After contacting the authors for clarification, we considered the stratified randomisation procedure used for randomisation in Fostervold 2008, to be appropriate and thus of low risk of bias. Because we did not receive clarification on how randomisation was performed in Avery 2001, we judged it to have an unclear risk of bias. The studies by Mills 2007 and Viola 2008 employed cluster allocation, but did not mention randomising clusters into the study arms. Therefore we judged the two studies to have a high risk of bias.
Allocation concealment
None of the RCTs reported how allocation concealment was guaranteed (Avery 2001; Bragard 2013; Fostervold 2008), leading to the judgement of unclear risk of bias in this domain. We considered CBA studies to have a high risk of bias in this domain by design (Mills 2007; Viola 2008).
Blinding
Blinding of participants and personnel
Studies individually applying interventions, using light boxes (Avery 2001) and glasses equipped with LEDs (Bragard 2013), did not employ any type of sham intervention. Blinding was not feasible in studies in which the intervention was ambient lighting (Fostervold 2008; Mills 2007; Viola 2008). Therefore, we judged all studies to have a high risk of bias in this domain.
Blinding of outcome assessment
In the study by Avery 2001, a psychiatrist blindly evaluated participants for outcome assessment. This was the only study we judged to be at low risk of bias in this domain. All other studies assessed outcomes using self‐assessed questionnaires (Bragard 2013; Fostervold 2008; Mills 2007; Viola 2008). As participants were not blinded, we judged this modality of outcome assessment to lead to a high risk of bias.
Incomplete outcome data
Two studies presented no attrition (Mills 2007) or very limited attrition (Avery 2001) during the entire follow‐up period and thereby we judged both to have a low risk of bias. Reasons for a judgment of high risk of bias in this domain were imbalance in attrition distribution between study arms (Fostervold 2008), and lack of information on attrition with respective to study arms (Viola 2008), or with respective to reasons of attrition (Bragard 2013).
Selective reporting
The study by Bragard 2013 did not report data obtained for the SIGH‐HDRS scale, reporting only results of the Beck Depression Inventory. Consequently we judged the study to have a high risk of bias . All other studies reported full data for each of the prespecified outcomes and therefore we judged them to have a low risk of reporting bias (Avery 2001; Fostervold 2008; Mills 2007; Viola 2008).
Other potential sources of bias
We could not rule out the possibility of baseline imbalance in the Avery 2001 study, due to missing data for baseline values of VAS for two participants in the a.m. group and five in the p.m. group. Consequently we judged the study to have an unclear risk of bias.
The risk of bias assessment of studies that employed cluster allocation or a cross‐over design included specific additional risk of bias domains. We assessed the risk of bias of CBA studies using a combined score of the two internal validity subscales (bias and confounding) of the Downs and Black Checklist (Downs 1998).
Risk of bias of studies employing cluster allocation
Two studies allocated participants in clusters rather than at the individual level (Mills 2007; Viola 2008). Specific risk of bias domains for CBA studies with cluster allocation include: recruitment bias, baseline imbalance, loss of clusters, incorrect analysis and comparability with individually randomised trials.
We judged Mills 2007 to have a high risk of recruitment bias, due to the low participation rate (49%). We judged Viola 2008 to have an unclear risk of recruitment bias since the authors did not report participation rate.
We judged both Mills 2007 and Viola 2008 to have a low risk of bias due to baseline imbalance. There were no differences between study arms regarding baseline values for the Columbia Jet Lag Scale in Mills 2007, and Viola 2008 employed a crossover design.
Both Mills 2007 and Viola 2008 reported data for all clusters included in the study and therefore we judged them to be at low risk of bias for loss of clusters.
We judged both Mills 2007 and Viola 2008 to have a high risk of bias for the incorrect analysis domain because in both cases the authors did not account for the design effect in their statistical analyses.
We judged both Mills 2007 and Viola 2008 to have an unclear risk of bias due to comparability with individually randomised trials since we found no individually randomised trials employing the same intervention.
Risk of bias of cross‐over studies
Two studies employed a cross‐over design (Bragard 2013; Viola 2008). Specific risk of bias domains for this category include: carry‐over effect, availability of data for the two time periods, incorrect analysis and comparability of results with those from parallel‐group trials.
We could not discard the possibility of carry‐over effect in either study, considering that neither employed a washout period. Therefore we judged both Bragard 2013 and Viola 2008 to have an unclear risk of bias in this domain.
Regarding availability of data for the two time periods and incorrect analysis domains, we judged both Bragard 2013 and Viola 2008 to have a low risk of bias, as they presented paired analyses from both periods.
For comparability of results with those from parallel‐group trials, we judged Bragard 2013 to be at unclear risk of bias and Viola 2008 to be at low risk of bias when we compared them with parallel‐group trials that had employed the same comparisons.
We present the results of our judgment of the risk of bias of included studies for the above domains in Figure 2 and Figure 3.
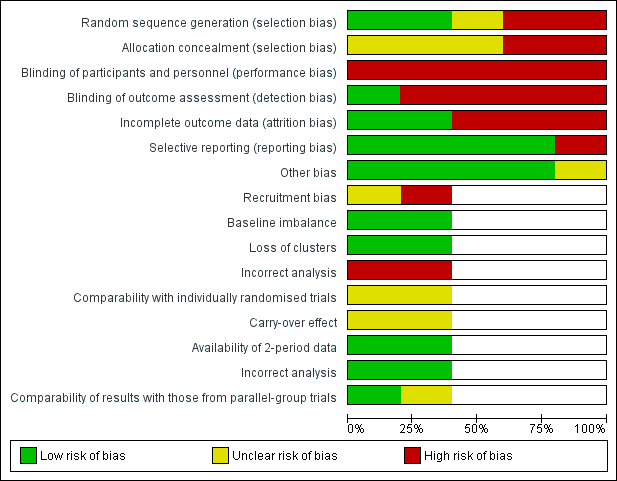
Risk of bias graph: review authors' judgements about each risk of bias item presented as percentages across all included studies.

Risk of bias summary: review authors' judgements about each risk of bias item for each included study.
Risk of bias of controlled before‐after studies
Two studies employed a CBA design (Mills 2007; Viola 2008). For these studies, we assessed risk of bias also by using the Downs and Black Scale (Downs 1998).
The study by Mills 2007 scored 9/13 points, and we judged it to be at low risk of bias according to our prespecified cut‐off score of 50% of the maximum attainable score of the internal validity scale. Our judgements were as follows.
-
Items 16, 17, 18, 19, 20, 21, 22, 25, 26: low risk.
-
Items 14, 15, 23, 24: high or unclear risk.
The study by Viola 2008 scored 7/13 points, and we judged it to be at low risk of bias, according to the same criterion. Our judgements were as follows.
-
Items 16, 17, 18, 19, 20, 21, 22: low risk.
-
Items 14, 15, 23, 24, 25, 26: high or unclear risk.
Reporting biases
Overall, we considered there to be a low risk for reporting biases influencing conclusions in this review. Publication bias could not be assessed as the single meta‐analysis in this review included only two studies. We did not locate redundant or multiple publications for any of the included studies, leading us to conclude that there was a low risk for multiple publication bias. All the included studies were published in peer‐reviewed journals and they were indexed in at least one of the searched databases. Therefore, we considered location bias as low risk. We found no additional studies after searching the reference lists of included studies, leading to the judgement of a low risk of citation bias. Only one study did not report some of the prespecified outcomes. The remaining four studies reported all outcomes described in their methods sections. For this reason, we considered there to be a low risk of outcome reporting bias.
Effects of interventions
See: Summary of findings for the main comparison High correlated colour temperature light versus standard illumination for improving mood and alertness in daytime workers; Summary of findings 2 Indirect light versus direct light for improving mood and alertness in daytime workers; Summary of findings 3 Individually applied blue‐enriched light versus no treatment for improving mood and alertness in daytime workers; Summary of findings 4 Morning bright light versus afternoon bright light for improving mood and alertness in daytime workers
Comparison 1: One level of illuminance versus another
We found no studies.
Comparison 2: Light of a particular CCT versus another
We found two cluster‐CBA studies comparing high CCT versus standard illumination that did not make the necessary adjustments for the unit‐of‐analysis error (Mills 2007; Viola 2008). We corrected for this using a prespecified ICC of 0.1. We calculated the effective sample size using the following formula. Effective sample size = 1 + (M − 1) ICC, where M was the mean cluster size.
All analyses reported below were adjusted according to this method.
Primary outcomes
Alertness
The studies comparing high CCT versus standard illumination assessed alertness using the Columbia Jet Lag Scale (Mills 2007), and the Karolinska Sleepiness Scale (Viola 2008).
For the study by Mills 2007, we based our conclusions on the results reported for the item 'Decreased Daytime Alertness,' because we considered this item as the better representative of alertness among all items that compose the multidimensional Columbia Jet Lag Scale. After adjusting for the design effect, there was no statistically significant difference for the item 'Decreased Daytime Alertness' (MD −0.30, 95% CI −1.15 to 0.55; participants = 69; effective sample size = 16; Analysis 1.1). The results presented for the item 'Sleepiness in Day' also supported this finding (MD −0.70, 95% CI −1.67 to 0.27; participants = 69; effective sample size = 16; Analysis 1.2).
Contrary to these findings, in the study by Viola 2008, participants exposed to high CCT light reported better levels of alertness using the Karolinska Sleepiness Scale (MD −0.44, 95% CI −0.79 to −0.09; participants = 94; effective sample size = 34; Analysis 1.3).
By pooling the results of Mills 2007 and Viola 2008 via meta‐analysis we found that high CCT lighting improved alertness (SMD −0.69, 95% CI −1.28 to −0.10; participants = 163; effective sample size = 50; I² = 0%; very low‐quality evidence; Analysis 1.4; Figure 4).
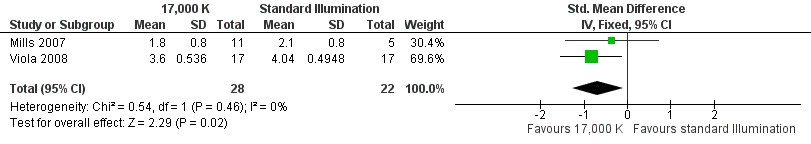
Forest plot of comparison: 4 High correlated colour temperature light versus standard illumination, outcome: alertness.
Mood
The study by Viola 2008 compared the effects of high CCT versus standard illumination on mood , using the PANAS scale (Watson 1988). There was no difference between high CCT and standard illumination for both positive (MD 2.08, 95% CI −0.10 to 4.26; participants = 94; effective sample size = 34; very low‐quality evidence) (Analysis 1.5) and negative feelings and emotions (MD −0.45, 95% CI −1.84 to 0.94; participants = 94; effective sample size = 34; very low‐quality evidence; Analysis 1.6).
Secondary outcome
Adverse events
The study by Viola 2008 assessed several adverse events, including irritability, headache, eye strain, eye discomfort, eye fatigue, difficulties in focusing, difficulties in concentration and blurred vision. We considered eye discomfort the most relevant adverse event from the clinical perspective and based our conclusions on this result. The high CCT light group presented fewer adverse events than standard illumination (mean of all time points; MD −0.23, 95% CI −0.37 to −0.09; participants = 94; effective sample size = 34; very low‐quality evidence; Analysis 1.7).
Comparison 3: Light of a particular illuminance and light spectrum or CCT versus another combination of illuminance and light spectrum or CCT
We found no studies.
Comparison 4: Daylight versus artificial light
We found no studies.
Comparison 5: Indirect versus direct light sources
The RCT study by Fostervold 2008 compared different proportions of direct and indirect indoor lighting according to the following four schemes: 100% indirect lighting; 70% indirect lighting combined with 30% direct lighting; 30% indirect lighting combined with 70% direct lighting; and 100% direct lighting. The authors measured intervention effects on their chosen outcomes in the medium term (two to five months). Our conclusions are based on the comparison of indirect versus direct lighting for the five‐month period. We selected the measurements carried out at the five‐month period to account for effects in a longer period of follow‐up.
Primary outcomes
Alertness
The Fostervold 2008 study did not assess alertness.
Mood
The Fostervold 2008 study assessed mood using the BDI Scale. There was no statistically significant difference between participants exposed to indirect lighting and those exposed to direct lighting (MD 1.00, 95% CI −2.86 to 4.86; participants = 22; low‐quality evidence; Analysis 2.1).
Secondary outcome
Adverse events
The Fostervold 2008 study measured ocular, reading and concentration problems, and musculoskeletal symptoms. The authors assessed each one of these symptoms at both time points (two and five months). We based our conclusions on the measurements of ocular problems, because we considered this group of symptoms as the most clinically relevant.
There was no statistically significant difference between indirect and direct lighting in regards to ocular problems after five months (MD −0.10, 95% CI −0.92 to 0.72; participants = 22; low‐quality evidence; Analysis 2.2).
Comparison 6: Individually administered light versus no treatment
The cross‐over RCT by Bragard 2013 compared individually applied blue‐enriched light versus no treatment. The authors presented results for baseline, after one month of intervention, after one month without treatment and after the second period receiving intervention. Results below refer to paired analyses between baseline and first period of intervention.
Primary outcomes
Alertness
The Bragard 2013 study assessed alertness using the ESS. After one month of exposure to blue‐enriched light, participants reported higher levels of alertness in relation to baseline levels (MD −3.30, 95% CI −6.28 to −0.32, participants = 25; cross‐over design; very low‐quality evidence; Analysis 3.1).
Mood
The Bragard 2013 study assessed mood using the Structured Interview Guide for the Hamilton Depressive Rating Scale, seasonal affective disorders version (SIGH‐HDRS) and the BDI‐II. The investigators reported only results for BDI‐II. Participants exposed to blue‐enriched light reported lower scores for the BDI‐II, which indicated improvement in the mood state, when compared to baseline levels (MD −4.80, 95% CI −9.46 to −0.14; participants = 25; cross‐over design; very low‐quality evidence; Analysis 3.2).
Secondary outcome
Adverse events
The Bragard 2013 study did not report adverse events.
Comparison 7: morning bright light versus afternoon bright light
The RCT study by Avery 2001 compared exposure to morning bright light versus afternoon bright light. The authors measured effects on outcomes after two weeks of intervention.
Primary outcomes
Alertness
The Avery 2001 study assessed alertness using a VAS. There was no statistically significant difference between the two groups (MD 7.00, 95% CI −10.18 to 24.18; participants = 30; low‐quality evidence; Analysis 4.1).
Mood
The Avery 2001 study assessed mood using six different measurements, namely frequency of participants showing a reduction of at least 50% in SIGH‐SAD scores from baseline; SIGH‐SAD score; HDRS‐21; HDRS‐17; SAD‐subscale and VAS. We considered the reduction of at least 50% in SIGH‐SAD scores from baseline the most relevant outcome from the clinical perspective, considering that the study participants were people with subsyndromal mood disorder and that the SIGH‐SAD encompasses specific items for seasonal affective disorder. Therefore, we based our conclusions on this measurement.
There was no statistically significant difference in respective to the number of participants reporting a reduction of at least 50% in SIGH‐SAD scores from baseline in the group exposed to bright light in the afternoon compared with exposure in the morning (RR 1.60, 95% CI 0.81 to 3.20; participants = 30; low‐quality evidence; Analysis 4.2).
Secondary outcomes
Adverse events
The Avery 2001 study reported that there were no major adverse events. The authors reported minor adverse events, such as glare from the bright light, eyestrain, headache and agitation as one outcome. There was no difference between groups regarding minor side effects (RR 0.53, 95% CI 0.26 to 1.07; participants = 30; low‐quality evidence; Analysis 4.8).
Discusión
Resumen de los resultados principales
Hay evidencia de muy baja calidad basada en dos estudios CAD con asignación al azar grupal realizados con 163 participantes de que la luz de temperatura de color correlacionada alta puede mejorar el estado de alerta medido con una versión modificada de la Columbia Jet Lag Scale y la Karolinska Sleepiness Scale (DME de 0,69 menos; IC del 95%: ‐1,28 a ‐0,1) en comparación con la iluminación estándar.
Hay evidencia de muy baja calidad basada en un estudio CAD con asignación al azar grupal con errores en la unidad de análisis realizado con 94 participantes de que no hay ninguna diferencia en el estado de ánimo positivo (DM 2,08; IC del 95%: ‐0,1 a 4,26) o el estado de ánimo negativo (DM ‐0,45; IC del 95%: ‐1,84 a 0,94) entre la luz de TCC alta y la iluminación estándar, según lo evaluado mediante la escala PANAS.
Hay evidencia de muy baja calidad basada en un estudio CAD con asignación al azar grupal, realizado con 94 participantes, de que la luz de TCC alta puede causar menos irritabilidad, malestar ocular y cefalea que la iluminación estándar, lo cual sugiere que la luz de TCC alta presenta buena tolerabilidad y seguridad.
Hay evidencia de baja calidad basada en un ECA realizado con 64 participantes de que las diferentes proporciones de luz directa e indirecta en el lugar de trabajo no afectan el estado de alerta, el estado de ánimo ni los efectos adversos.
Hay evidencia de muy baja calidad basada en un ECA cruzado realizado con 25 participantes de que la luz azul enriquecida aplicada individualmente y administrada durante 30 minutos por día durante al menos cinco días a la semana aumentó el estado de alerta, según lo evaluado con la ESS (DM ‐3,30; IC del 95%: ‐6,28 a ‐0,32) y mejoró el estado de ánimo, según lo evaluado mediante el BDI (DM ‐4,80; IC del 95%: ‐9,46 a ‐0,14).
Hay evidencia de baja calidad basada en un ECA realizado con 30 participantes de que la luz brillante individualmente administrada durante la tarde presenta la misma efectividad que la exposición en la mañana para mejorar el estado de alerta y el estado de ánimo en el trastorno afectivo estacional subsindromal. No hubo diferencias en el número de participantes que se presentaron con un cambio en los niveles de alerta (DM 7,00; IC del 95%: ‐10,18 a 24,18), una disminución de al menos un 50% en las puntuaciones SIGH‐SAD (CR 1,60; IC del 95%: 0,81 a 3,20) o en la frecuencia de los eventos adversos (CR 0,53; IC del 95%: 0,26 a 1,07).
Compleción y aplicabilidad general de las pruebas
Todos los estudios incluidos se realizaron en el hemisferio norte, entre las latitudes 47º 60' y 59º 91'. No fue posible calcular si los hallazgos de estos estudios podrían extrapolarse a las regiones tropicales o subtropicales, donde la luz natural es intensa incluso en el invierno.
Con la excepción del estudio Bragard 2013 que se realizó dentro de un establecimiento hospitalario, todos los otros estudios aplicaron intervenciones de iluminación en oficinas de ocupación individual o de plano abierto. No se encontró ningún estudio que incluyera a obreros y parece lógico suponer que los efectos de la iluminación podrían ser significativamente diferentes para esta población.
En todos los estudios incluidos los participantes evaluaron su propio estado de alerta y su propio estado de ánimo de forma subjetiva. Ninguno de los estudios utilizó medidas objetivas del estado de alerta, como la pupilometría o la reflectancia ocular, posiblemente debido a su naturaleza intrusiva.
No se encontró ningún estudio que evaluara niveles diferentes de iluminancia, la luz de una iluminancia particular y el espectro de luz o la TCC versus otra combinación de iluminancia y espectro de luz o TCC; o la exposición a la luz del día.
Calidad de la evidencia
Todos los resultados de esta revisión se basan en evidencia de baja calidad o de muy baja calidad. Ninguno de los tres ECA incluidos declaró los métodos usados para asegurar la ocultación de la asignación. La naturaleza de la intervención en sí impuso limitaciones al cegamiento del personal y los participantes. En cuatro de cada cinco estudios incluidos, los participantes evaluaron los resultados de interés con cuestionarios o escalas informadas por el participante y, por lo tanto, se los consideró en alto riesgo de sesgo en cuanto al dominio del cegamiento de los evaluadores de resultado. El estudio de Avery 2001 fue una excepción en cuanto a que empleó a un evaluador de resultado cegado y por lo tanto se consideró en riesgo bajo de sesgo en este dominio.
Dos estudios CAD emplearon una asignación por grupos. Sin embargo, ninguno de ellos corrigió los errores de la unidad de análisis mediante el cálculo del tamaño de la muestra efectivo. En consecuencia se realizó esta corrección y los tamaños de la muestra calculados resultantes fueron apreciablemente inferiores que los tamaños de la muestra originales debido al número reducido de grupos en cada estudio. Este hecho dio lugar a grandes intervalos de confianza que causaron resultados sumamente imprecisos.
Los dos estudios que evaluaron los efectos de la luz de TCC alta (Mills 2007; Viola 2008) fueron patrocinados por la industria, lo cual planteó inquietudes en cuanto al sesgo de financiamiento. El potencial de sesgo en los estudios patrocinados por la industria puede existir en niveles múltiples, e idealmente, los resultados deben ser repetidos por la investigación independiente para una mayor confianza en los resultados.
Sesgos potenciales en el proceso de revisión
Se eligió incluir estudios CAD no aleatorios basados en la presuposición de que las intervenciones de iluminación del ambiente darían lugar a que la asignación al azar fuese más engorrosa, sin embargo, no imposible. En efecto, dos de los cinco estudios incluidos fueron estudios controlados no aleatorios de antes y después con asignación al azar por grupos. La inclusión de los estudios no aleatorios tuvo implicaciones en la evaluación de la calidad de la evidencia de tal manera que, para empezar, la evidencia producida por los estudios CAD comenzó como de baja calidad.
Se supuso que los diferentes tipos de escalas validadas fueron equivalentes entre los estudios. Sin embargo, las diferentes escalas pueden reflejar una construcción algo diferente del resultado de interés. Por ejemplo, un estudio evaluó la somnolencia mediante la ESS, que se considera un instrumento para evaluar los aspectos del rasgo de la somnolencia. Otro estudio evaluó el estado de alerta mediante la Karolinska Sleepiness Scale, que principalmente considera los estados transitorios. De forma independiente de estas diferencias, se consideró que ambos instrumentos proporcionaron mediciones fiables del estado de alerta.
Para los estudios que emplearon mediciones diferentes para el mismo resultado, se seleccionó el más relevante desde la perspectiva clínica, para basar las conclusiones en el mismo.
Para los estudios que asignaron a los participantes en grupos, se representó el efecto del diseño al emplear un coeficiente intraclase que se había definido a priori como 0,1. Luego se calculó el tamaño de la muestra efectivo. Este ajuste podría haber subestimado los tamaños del efecto y haberle otorgado poco poder estadístico a los resultados.
No fue posible descartar el sesgo de publicación, debido a que fue posible incluir sólo dos estudios en el único metanálisis.
Acuerdos y desacuerdos con otros estudios o revisiones
Hasta donde se sabe, este es el primer intento por realizar una revisión sistemática de la efectividad de las intervenciones de iluminación del lugar de trabajo para mejorar el estado de alerta y el estado de ánimo en los trabajadores diurnos. Por lo tanto, no fue posible comparar los resultados con los de las revisiones anteriores.
Los estudios de laboratorio han apoyado la presuposición de que la luz azul enriquecida en particular puede mejorar el estado de alerta. Según Chellappa 2011 la exposición a la luz a 6500 K mejora el estado de alerta subjetivo, la atención sostenida, el bienestar y el confort visual, además de reducir los niveles de melatonina, incluso para los niveles de iluminancia de sólo 40 Lux. Un estudio de laboratorio que utilizó diferentes sistemas de iluminación reveló que la luz de TCC alta reduce los niveles de fatiga y mejora el tiempo de reacción y el estado de ánimo (Hawes 2012).
En este sentido, los resultados se alinean parcialmente con la evidencia derivada de los estudios de laboratorio. Se encontró evidencia de muy baja calidad de que la luz de TCC alta mejora el estado de alerta subjetivo, y evidencia de muy baja calidad de que la luz azul enriquecida aplicada individualmente mejora el estado de alerta y el estado de ánimo.

PRISMA study flow diagram.

Risk of bias graph: review authors' judgements about each risk of bias item presented as percentages across all included studies.
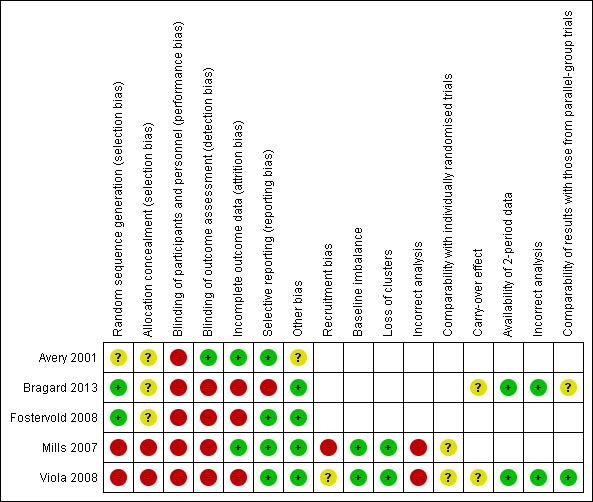
Risk of bias summary: review authors' judgements about each risk of bias item for each included study.

Forest plot of comparison: 4 High correlated colour temperature light versus standard illumination, outcome: alertness.

Comparison 1 High correlated colour temperature light versus standard illumination, Outcome 1 Alertness ‐ Item Decreased Daytime Alertness from Columbia Jet Lag Scale 14 weeks.

Comparison 1 High correlated colour temperature light versus standard illumination, Outcome 2 Alertness ‐ Item Sleepiness in Day from Columbia Jet Lag Scale 14 weeks.

Comparison 1 High correlated colour temperature light versus standard illumination, Outcome 3 Alertness ‐ Karolinska Sleepiness Scale: mean of all time points.

Comparison 1 High correlated colour temperature light versus standard illumination, Outcome 4 Alertness ‐ meta‐analysis.

Comparison 1 High correlated colour temperature light versus standard illumination, Outcome 5 Mood ‐ Positive Mood PANAS Scale: mean of all time points.

Comparison 1 High correlated colour temperature light versus standard illumination, Outcome 6 Mood ‐ Negative Mood PANAS Scale: mean of all time points.
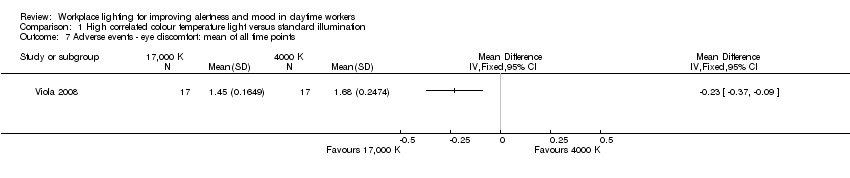
Comparison 1 High correlated colour temperature light versus standard illumination, Outcome 7 Adverse events ‐ eye discomfort: mean of all time points.
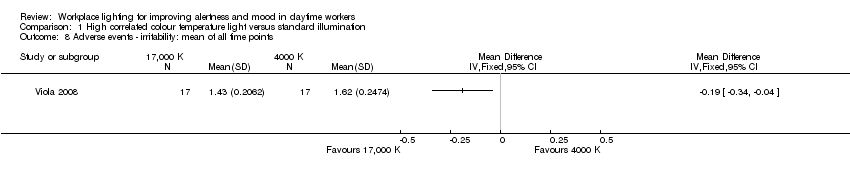
Comparison 1 High correlated colour temperature light versus standard illumination, Outcome 8 Adverse events ‐ irritability: mean of all time points.
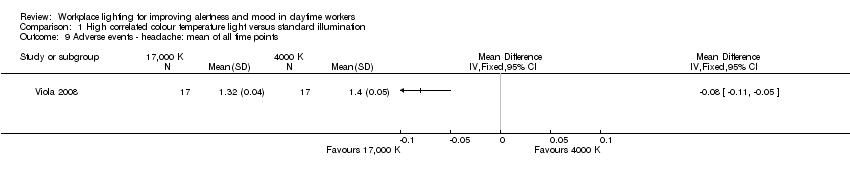
Comparison 1 High correlated colour temperature light versus standard illumination, Outcome 9 Adverse events ‐ headache: mean of all time points.

Comparison 1 High correlated colour temperature light versus standard illumination, Outcome 10 Adverse events ‐ eye strain: mean of all time points.
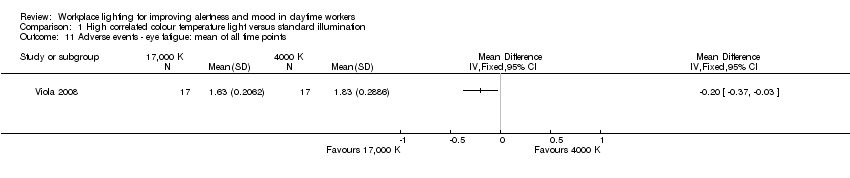
Comparison 1 High correlated colour temperature light versus standard illumination, Outcome 11 Adverse events ‐ eye fatigue: mean of all time points.

Comparison 1 High correlated colour temperature light versus standard illumination, Outcome 12 Adverse events ‐ difficult focusing: mean of all time points.

Comparison 1 High correlated colour temperature light versus standard illumination, Outcome 13 Adverse events ‐ difficulty concentrating: mean of all time points.

Comparison 1 High correlated colour temperature light versus standard illumination, Outcome 14 Adverse events ‐ blurred vision: mean of all time points.
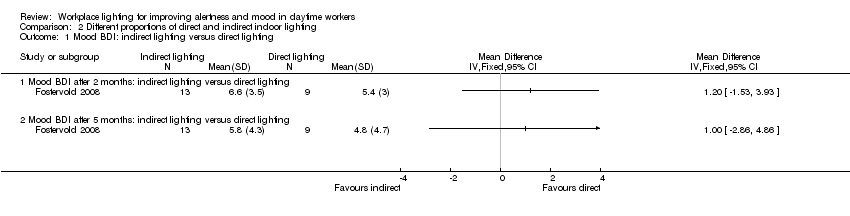
Comparison 2 Different proportions of direct and indirect indoor lighting, Outcome 1 Mood BDI: indirect lighting versus direct lighting.
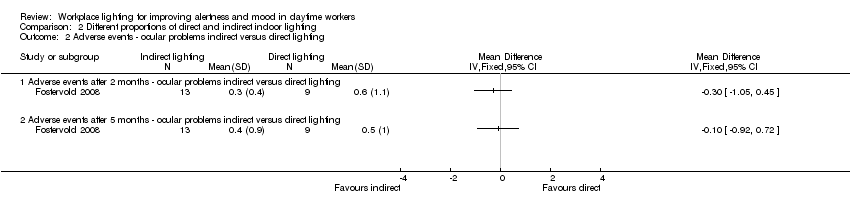
Comparison 2 Different proportions of direct and indirect indoor lighting, Outcome 2 Adverse events ‐ ocular problems indirect versus direct lighting.

Comparison 2 Different proportions of direct and indirect indoor lighting, Outcome 3 Mood Beck Depression Inventory (BDI): indirect lighting versus 70% indirect lighting.
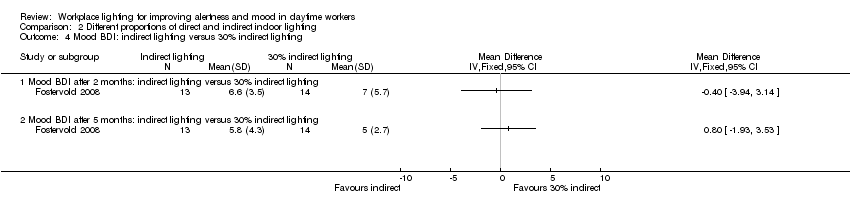
Comparison 2 Different proportions of direct and indirect indoor lighting, Outcome 4 Mood BDI: indirect lighting versus 30% indirect lighting.
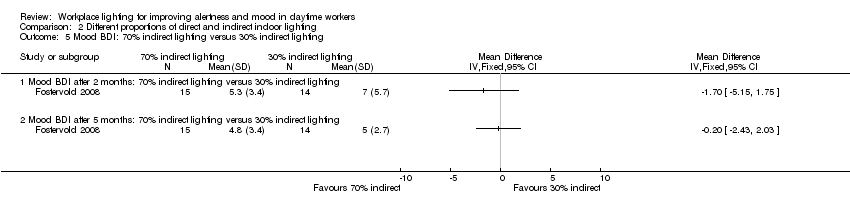
Comparison 2 Different proportions of direct and indirect indoor lighting, Outcome 5 Mood BDI: 70% indirect lighting versus 30% indirect lighting.
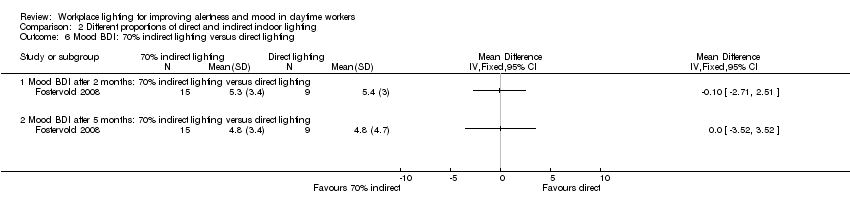
Comparison 2 Different proportions of direct and indirect indoor lighting, Outcome 6 Mood BDI: 70% indirect lighting versus direct lighting.

Comparison 2 Different proportions of direct and indirect indoor lighting, Outcome 7 Mood BDI: 30% indirect lighting versus direct lighting.
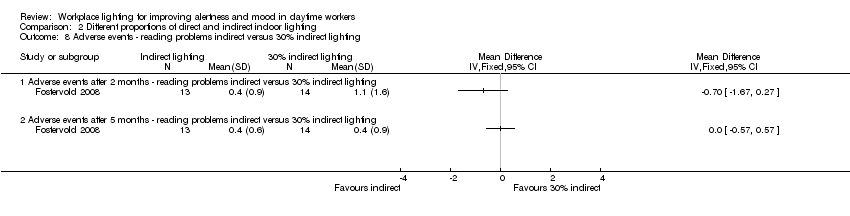
Comparison 2 Different proportions of direct and indirect indoor lighting, Outcome 8 Adverse events ‐ reading problems indirect versus 30% indirect lighting.

Comparison 2 Different proportions of direct and indirect indoor lighting, Outcome 9 Adverse events ‐ ocular problems indirect versus 70% indirect lighting.

Comparison 2 Different proportions of direct and indirect indoor lighting, Outcome 10 Adverse events ‐ ocular problems indirect versus 30% indirect lighting.

Comparison 2 Different proportions of direct and indirect indoor lighting, Outcome 11 Adverse events ‐ ocular problems 70% indirect versus 30% indirect lighting.

Comparison 2 Different proportions of direct and indirect indoor lighting, Outcome 12 Adverse events ‐ ocular problems 70% indirect versus direct lighting.
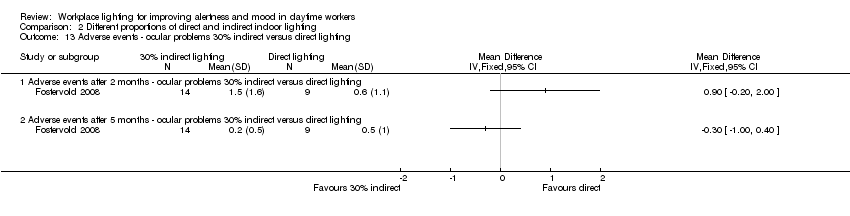
Comparison 2 Different proportions of direct and indirect indoor lighting, Outcome 13 Adverse events ‐ ocular problems 30% indirect versus direct lighting.

Comparison 2 Different proportions of direct and indirect indoor lighting, Outcome 14 Adverse events ‐ reading problems indirect versus 70% indirect lighting.
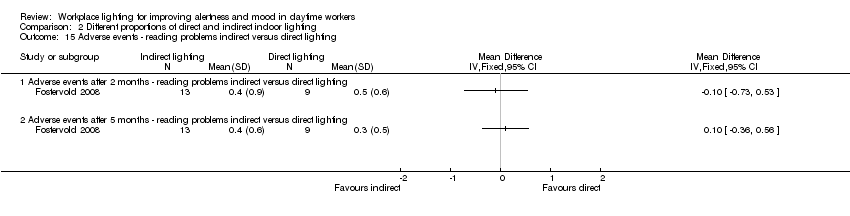
Comparison 2 Different proportions of direct and indirect indoor lighting, Outcome 15 Adverse events ‐ reading problems indirect versus direct lighting.

Comparison 2 Different proportions of direct and indirect indoor lighting, Outcome 16 Adverse events ‐ reading problems 70% indirect versus 30% indirect lighting.
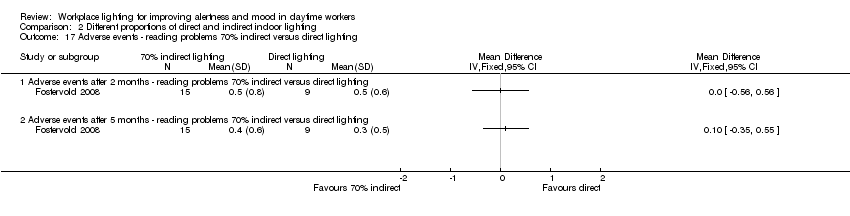
Comparison 2 Different proportions of direct and indirect indoor lighting, Outcome 17 Adverse events ‐ reading problems 70% indirect versus direct lighting.

Comparison 2 Different proportions of direct and indirect indoor lighting, Outcome 18 Adverse events ‐ reading problems 30% indirect versus direct lighting.
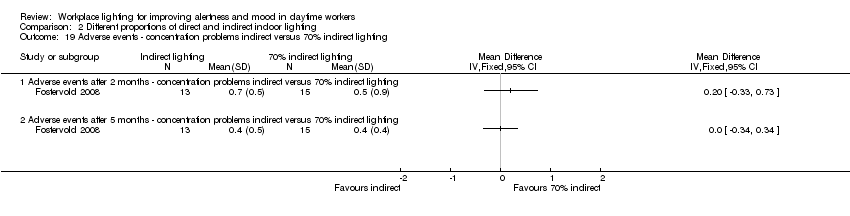
Comparison 2 Different proportions of direct and indirect indoor lighting, Outcome 19 Adverse events ‐ concentration problems indirect versus 70% indirect lighting.

Comparison 2 Different proportions of direct and indirect indoor lighting, Outcome 20 Adverse events ‐ concentration problems indirect versus 30% indirect lighting.

Comparison 2 Different proportions of direct and indirect indoor lighting, Outcome 21 Adverse events ‐ concentration problems indirect versus direct lighting.

Comparison 2 Different proportions of direct and indirect indoor lighting, Outcome 22 Adverse events ‐ concentration problems 70% indirect versus 30% indirect lighting.
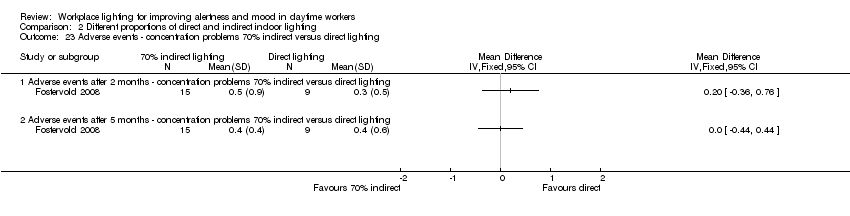
Comparison 2 Different proportions of direct and indirect indoor lighting, Outcome 23 Adverse events ‐ concentration problems 70% indirect versus direct lighting.
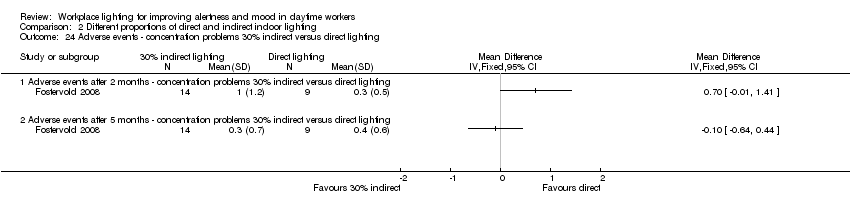
Comparison 2 Different proportions of direct and indirect indoor lighting, Outcome 24 Adverse events ‐ concentration problems 30% indirect versus direct lighting.
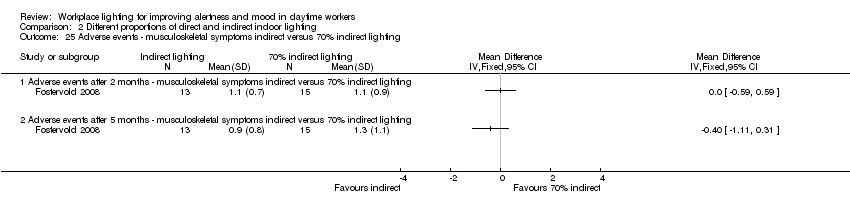
Comparison 2 Different proportions of direct and indirect indoor lighting, Outcome 25 Adverse events ‐ musculoskeletal symptoms indirect versus 70% indirect lighting.
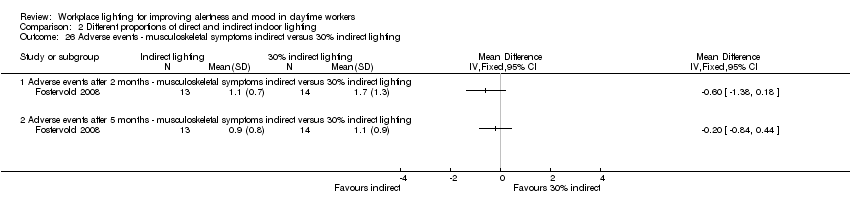
Comparison 2 Different proportions of direct and indirect indoor lighting, Outcome 26 Adverse events ‐ musculoskeletal symptoms indirect versus 30% indirect lighting.

Comparison 2 Different proportions of direct and indirect indoor lighting, Outcome 27 Adverse events ‐ musculoskeletal symptoms indirect versus direct lighting.

Comparison 2 Different proportions of direct and indirect indoor lighting, Outcome 28 Adverse events ‐ musculoskeletal symptoms 70% indirect versus 30% indirect lighting.

Comparison 2 Different proportions of direct and indirect indoor lighting, Outcome 29 Adverse events ‐ musculoskeletal symptoms 70% indirect versus direct lighting.

Comparison 2 Different proportions of direct and indirect indoor lighting, Outcome 30 Adverse events ‐ musculoskeletal symptoms 30% indirect versus direct lighting.

Comparison 3 Individually applied blue‐enriched light versus no treatment, Outcome 1 Alertness ‐ Epworth Sleepiness Scale.

Comparison 3 Individually applied blue‐enriched light versus no treatment, Outcome 2 Mood Beck Depression Inventory‐II.

Comparison 4 Morning bright light versus afternoon bright light, Outcome 1 Alertness (visual analogue scale (VAS)) after 2 weeks of intervention.

Comparison 4 Morning bright light versus afternoon bright light, Outcome 2 Mood (≥ 50% of reduction of Structured Interview Guide for the Hamilton Depression Rating Scale‐Seasonal Affective Disorders Version (SIGH‐SAD) scores from baseline after 2 weeks of treatment)).
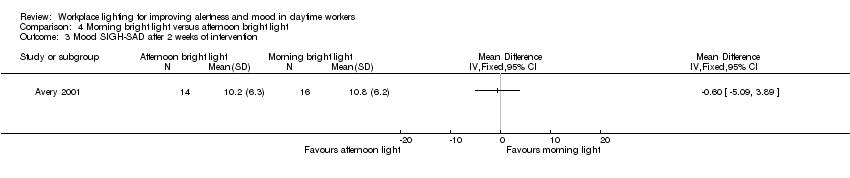
Comparison 4 Morning bright light versus afternoon bright light, Outcome 3 Mood SIGH‐SAD after 2 weeks of intervention.
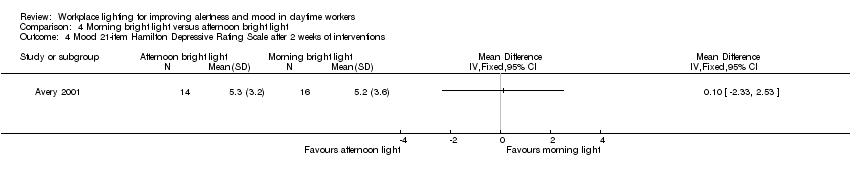
Comparison 4 Morning bright light versus afternoon bright light, Outcome 4 Mood 21‐item Hamilton Depressive Rating Scale after 2 weeks of interventions.

Comparison 4 Morning bright light versus afternoon bright light, Outcome 5 Mood 17‐item Hamilton Depressive Rating Scale after 2 weeks of intervention.

Comparison 4 Morning bright light versus afternoon bright light, Outcome 6 Mood Seasonal Affective Disorders subscale after 2 weeks of intervention.

Comparison 4 Morning bright light versus afternoon bright light, Outcome 7 Mood VAS after 2 weeks of intervention.
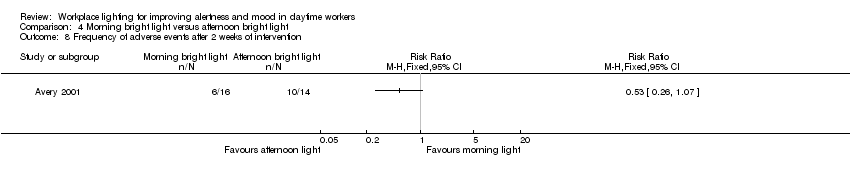
Comparison 4 Morning bright light versus afternoon bright light, Outcome 8 Frequency of adverse events after 2 weeks of intervention.
| High correlated colour temperature light versus standard illumination for improving mood and alertness in daytime workers | ||||
| Patient or population: daytime workers | ||||
| Outcomes | Anticipated absolute effects (95% CI) | № of participants (studies) | Quality of the evidence | |
| Risk with standard illumination | Risk with CCT light | |||
| Alertness KS range 1 to 9 (worst) | ‐‐ | SMD** 0.69 lower | 163 Effective sample size = 50 | ⊕⊝⊝⊝ |
| Mood (positive) | Mean standard positive mood 25.9 | MD 2.08 higher | 94 Effective sample size = 34 | ⊕⊝⊝⊝ |
| Mood (negative) | Mean standard negative mood 13.7 | MD 0.45 lower | 94 Effective sample size = 34 | ⊕⊝⊝⊝ |
| Adverse events ‐ eye discomfort | Mean standard adverse events 1.7 | MD 0.23 lower | 94 Effective sample size = 34 | ⊕⊝⊝⊝ |
| * Effective sample sizes applied to correct for the unit‐of‐analysis error. ** As a rule of thumb, 0.2 Standard Deviations represents a small difference, 0.5 a moderate difference, and 0.8 a large difference. CI: confidence interval; CCT: correlated colour temperature; MD: mean difference; PANAS: Positive and Negative Affect Schedule; SMD: standardised mean difference. | ||||
| GRADE Working Group grades of evidence | ||||
| 1 The assessment of risk of bias for non‐randomised studies starts at low‐quality evidence. We downgraded the level of evidence with one level, i.e. to very low quality, due to imprecision caused by a small sample size. 2 We would have downgraded the level of evidence with one more level due to imprecision caused by wide confidence intervals that include a null effect but we had already reached a judgment of very low‐quality evidence. | ||||
| Indirect light versus direct light for improving mood and alertness in daytime workers | ||||
| Patient or population: daytime workers | ||||
| Outcomes | Anticipated absolute effects (95% CI) | № of participants | Quality of the evidence | |
| Risk with direct light | Risk with indirect light | |||
| Alertness | Not assessed | Not assessed | Not assessed | Not assessed |
| Mood | Mean mood 5.8 | MD 1 higher | 22 | ⊕⊕⊝⊝ |
| Adverse events (ocular problems) | Mean adverse events 0.4 | MD 0.1 lower | 22 | ⊕⊕⊝⊝ |
| CI: confidence interval; MD: mean difference; RCT: randomised controlled trial. | ||||
| GRADE Working Group grades of evidence | ||||
| 1 We downgraded the level of evidence with one level, i.e. from high to moderate quality, due to risk of bias (the authors did not fully describe how or if they employed allocation concealment, outcome assessors were not blinded and there was a high and unbalanced attrition rate). 2 We downgraded the level of evidence with one level, i.e. from moderate to low quality, due to imprecision (a small sample size and a wide confidence interval including a null effect). | ||||
| Individually applied blue‐enriched light versus no treatment for improving mood and alertness in daytime workers | ||||
| Patient or population: daytime workers | ||||
| Outcomes | Anticipated absolute effects (95% CI) | № of participants | Quality of the evidence | |
| Risk with light as usual | Risk with blue‐enriched light | |||
| Alertness | Mean alertness | MD 3.3 lower | 25 | ⊕⊝⊝⊝ |
| Mood | Mean mood | MD 4.8 lower | 25 | ⊕⊝⊝⊝ |
| Adverse events | Not assessed | Not assessed | Not assessed | Not assessed |
| CI: confidence interval; MD: mean difference; RCT: randomised controlled trial. | ||||
| GRADE Working Group grades of evidence | ||||
| 1 We downgraded the level of evidence with two levels, i.e. from high to low quality, due to risk of bias (the authors did not fully describe how or if they employed allocation concealment, outcome assessors were not blinded, results for SIGH‐HDRS were not reported and there was a high attrition rate). 2 We downgraded the level of evidence with one level, i.e. from low to very low quality, due to imprecision (a small sample size and a wide confidence interval). | ||||
| Morning bright light versus afternoon bright light for improving mood and alertness in daytime workers | |||||
| Patient or population: daytime workers | |||||
| Outcomes | Anticipated absolute effects* (95% CI) | Relative effect with morning bright light | № of participants | Quality of the evidence | |
| Risk with afternoon bright light | Risk with morning bright light | ||||
| Alertness | Mean 59 (SD 23) | Mean 66 (SD 25) | MD 7 higher | 30 | ⊕⊕⊝⊝ |
| Mood | 426 per 1000 | 688 per 1000 | RR 1.60 | 30 | ⊕⊕⊝⊝ |
| Adverse events (frequency) | 712 per 1000 | 375 per 1000 | RR 0.53 | 30 | ⊕⊕⊝⊝ |
| *The risk in the intervention group (and its 95% confidence interval) is based on the assumed risk in the comparison group and the relative effect of the intervention (and its 95% CI). CI: confidence interval; MD: mean difference; RCT: randomised controlled trial; RR: risk ratio; SIGH‐SAD: Structured Interview Guide for the Hamilton Depression Rating Scale‐Seasonal Affective Disorders Version. | |||||
| GRADE Working Group grades of evidence | |||||
| 1 We downgraded the level of evidence with one level, i.e. from high to moderate quality, due to risk of bias (the authors did not fully describe their randomisation method nor how or if they employed allocation concealment). 2 We downgraded the level of evidence with one level, i.e. from moderate to low quality, due to imprecision (a small sample size and a wide confidence interval including a null effect). | |||||
| Outcome or subgroup title | No. of studies | No. of participants | Statistical method | Effect size |
| 1 Alertness ‐ Item Decreased Daytime Alertness from Columbia Jet Lag Scale 14 weeks Show forest plot | 1 | Mean Difference (IV, Fixed, 95% CI) | Totals not selected | |
| 2 Alertness ‐ Item Sleepiness in Day from Columbia Jet Lag Scale 14 weeks Show forest plot | 1 | Mean Difference (IV, Fixed, 95% CI) | Totals not selected | |
| 3 Alertness ‐ Karolinska Sleepiness Scale: mean of all time points Show forest plot | 1 | Mean Difference (IV, Fixed, 95% CI) | Totals not selected | |
| 4 Alertness ‐ meta‐analysis Show forest plot | 2 | 50 | Std. Mean Difference (IV, Fixed, 95% CI) | ‐0.69 [‐1.28, ‐0.10] |
| 5 Mood ‐ Positive Mood PANAS Scale: mean of all time points Show forest plot | 1 | Mean Difference (IV, Fixed, 95% CI) | Totals not selected | |
| 6 Mood ‐ Negative Mood PANAS Scale: mean of all time points Show forest plot | 1 | Mean Difference (IV, Fixed, 95% CI) | Totals not selected | |
| 7 Adverse events ‐ eye discomfort: mean of all time points Show forest plot | 1 | Mean Difference (IV, Fixed, 95% CI) | Totals not selected | |
| 8 Adverse events ‐ irritability: mean of all time points Show forest plot | 1 | Mean Difference (IV, Fixed, 95% CI) | Totals not selected | |
| 9 Adverse events ‐ headache: mean of all time points Show forest plot | 1 | Mean Difference (IV, Fixed, 95% CI) | Totals not selected | |
| 10 Adverse events ‐ eye strain: mean of all time points Show forest plot | 1 | Mean Difference (IV, Fixed, 95% CI) | Totals not selected | |
| 11 Adverse events ‐ eye fatigue: mean of all time points Show forest plot | 1 | Mean Difference (IV, Fixed, 95% CI) | Totals not selected | |
| 12 Adverse events ‐ difficult focusing: mean of all time points Show forest plot | 1 | Mean Difference (IV, Fixed, 95% CI) | Totals not selected | |
| 13 Adverse events ‐ difficulty concentrating: mean of all time points Show forest plot | 1 | Mean Difference (IV, Fixed, 95% CI) | Totals not selected | |
| 14 Adverse events ‐ blurred vision: mean of all time points Show forest plot | 1 | Mean Difference (IV, Fixed, 95% CI) | Totals not selected | |
| Outcome or subgroup title | No. of studies | No. of participants | Statistical method | Effect size |
| 1 Mood BDI: indirect lighting versus direct lighting Show forest plot | 1 | Mean Difference (IV, Fixed, 95% CI) | Totals not selected | |
| 1.1 Mood BDI after 2 months: indirect lighting versus direct lighting | 1 | Mean Difference (IV, Fixed, 95% CI) | 0.0 [0.0, 0.0] | |
| 1.2 Mood BDI after 5 months: indirect lighting versus direct lighting | 1 | Mean Difference (IV, Fixed, 95% CI) | 0.0 [0.0, 0.0] | |
| 2 Adverse events ‐ ocular problems indirect versus direct lighting Show forest plot | 1 | Mean Difference (IV, Fixed, 95% CI) | Totals not selected | |
| 2.1 Adverse events after 2 months ‐ ocular problems indirect versus direct lighting | 1 | Mean Difference (IV, Fixed, 95% CI) | 0.0 [0.0, 0.0] | |
| 2.2 Adverse events after 5 months ‐ ocular problems indirect versus direct lighting | 1 | Mean Difference (IV, Fixed, 95% CI) | 0.0 [0.0, 0.0] | |
| 3 Mood Beck Depression Inventory (BDI): indirect lighting versus 70% indirect lighting Show forest plot | 1 | Mean Difference (IV, Fixed, 95% CI) | Totals not selected | |
| 3.1 Mood BDI after 2 months: indirect lighting versus 70% indirect lighting | 1 | Mean Difference (IV, Fixed, 95% CI) | 0.0 [0.0, 0.0] | |
| 3.2 Mood BDI after 5 months: indirect lighting versus 70% indirect lighting | 1 | Mean Difference (IV, Fixed, 95% CI) | 0.0 [0.0, 0.0] | |
| 4 Mood BDI: indirect lighting versus 30% indirect lighting Show forest plot | 1 | Mean Difference (IV, Fixed, 95% CI) | Totals not selected | |
| 4.1 Mood BDI after 2 months: indirect lighting versus 30% indirect lighting | 1 | Mean Difference (IV, Fixed, 95% CI) | 0.0 [0.0, 0.0] | |
| 4.2 Mood BDI after 5 months: indirect lighting versus 30% indirect lighting | 1 | Mean Difference (IV, Fixed, 95% CI) | 0.0 [0.0, 0.0] | |
| 5 Mood BDI: 70% indirect lighting versus 30% indirect lighting Show forest plot | 1 | Mean Difference (IV, Fixed, 95% CI) | Totals not selected | |
| 5.1 Mood BDI after 2 months: 70% indirect lighting versus 30% indirect lighting | 1 | Mean Difference (IV, Fixed, 95% CI) | 0.0 [0.0, 0.0] | |
| 5.2 Mood BDI after 5 months: 70% indirect lighting versus 30% indirect lighting | 1 | Mean Difference (IV, Fixed, 95% CI) | 0.0 [0.0, 0.0] | |
| 6 Mood BDI: 70% indirect lighting versus direct lighting Show forest plot | 1 | Mean Difference (IV, Fixed, 95% CI) | Totals not selected | |
| 6.1 Mood BDI after 2 months: 70% indirect lighting versus direct lighting | 1 | Mean Difference (IV, Fixed, 95% CI) | 0.0 [0.0, 0.0] | |
| 6.2 Mood BDI after 5 months: 70% indirect lighting versus direct lighting | 1 | Mean Difference (IV, Fixed, 95% CI) | 0.0 [0.0, 0.0] | |
| 7 Mood BDI: 30% indirect lighting versus direct lighting Show forest plot | 1 | Mean Difference (IV, Fixed, 95% CI) | Totals not selected | |
| 7.1 Mood BDI after 2 months: 30% indirect lighting versus direct lighting | 1 | Mean Difference (IV, Fixed, 95% CI) | 0.0 [0.0, 0.0] | |
| 7.2 Mood BDI after 5 months: 30% indirect lighting versus direct lighting | 1 | Mean Difference (IV, Fixed, 95% CI) | 0.0 [0.0, 0.0] | |
| 8 Adverse events ‐ reading problems indirect versus 30% indirect lighting Show forest plot | 1 | Mean Difference (IV, Fixed, 95% CI) | Totals not selected | |
| 8.1 Adverse events after 2 months ‐ reading problems indirect versus 30% indirect lighting | 1 | Mean Difference (IV, Fixed, 95% CI) | 0.0 [0.0, 0.0] | |
| 8.2 Adverse events after 5 months ‐ reading problems indirect versus 30% indirect lighting | 1 | Mean Difference (IV, Fixed, 95% CI) | 0.0 [0.0, 0.0] | |
| 9 Adverse events ‐ ocular problems indirect versus 70% indirect lighting Show forest plot | 1 | Mean Difference (IV, Fixed, 95% CI) | Totals not selected | |
| 9.1 Adverse events after 2 months ‐ ocular problems indirect versus 70% indirect lighting | 1 | Mean Difference (IV, Fixed, 95% CI) | 0.0 [0.0, 0.0] | |
| 9.2 Adverse events after 5 months ‐ ocular problems indirect versus 70% indirect lighting | 1 | Mean Difference (IV, Fixed, 95% CI) | 0.0 [0.0, 0.0] | |
| 10 Adverse events ‐ ocular problems indirect versus 30% indirect lighting Show forest plot | 1 | Mean Difference (IV, Fixed, 95% CI) | Totals not selected | |
| 10.1 Adverse events after 2 months ‐ ocular problems indirect versus 30% indirect lighting | 1 | Mean Difference (IV, Fixed, 95% CI) | 0.0 [0.0, 0.0] | |
| 10.2 Adverse events after 5 months ‐ ocular problems indirect versus 30% indirect lighting | 1 | Mean Difference (IV, Fixed, 95% CI) | 0.0 [0.0, 0.0] | |
| 11 Adverse events ‐ ocular problems 70% indirect versus 30% indirect lighting Show forest plot | 1 | Mean Difference (IV, Fixed, 95% CI) | Totals not selected | |
| 11.1 Adverse events after 2 months ‐ ocular problems 70% indirect versus 30% indirect lighting | 1 | Mean Difference (IV, Fixed, 95% CI) | 0.0 [0.0, 0.0] | |
| 11.2 Adverse events after 5 months ‐ ocular problems 70% indirect versus 30% indirect lighting | 1 | Mean Difference (IV, Fixed, 95% CI) | 0.0 [0.0, 0.0] | |
| 12 Adverse events ‐ ocular problems 70% indirect versus direct lighting Show forest plot | 1 | Mean Difference (IV, Fixed, 95% CI) | Totals not selected | |
| 12.1 Adverse events after 2 months ‐ ocular problems 70% indirect versus direct lighting | 1 | Mean Difference (IV, Fixed, 95% CI) | 0.0 [0.0, 0.0] | |
| 12.2 Adverse events after 5 months ‐ ocular problems 70% indirect versus direct lighting | 1 | Mean Difference (IV, Fixed, 95% CI) | 0.0 [0.0, 0.0] | |
| 13 Adverse events ‐ ocular problems 30% indirect versus direct lighting Show forest plot | 1 | Mean Difference (IV, Fixed, 95% CI) | Totals not selected | |
| 13.1 Adverse events after 2 months ‐ ocular problems 30% indirect versus direct lighting | 1 | Mean Difference (IV, Fixed, 95% CI) | 0.0 [0.0, 0.0] | |
| 13.2 Adverse events after 5 months ‐ ocular problems 30% indirect versus direct lighting | 1 | Mean Difference (IV, Fixed, 95% CI) | 0.0 [0.0, 0.0] | |
| 14 Adverse events ‐ reading problems indirect versus 70% indirect lighting Show forest plot | 1 | Mean Difference (IV, Fixed, 95% CI) | Totals not selected | |
| 14.1 Adverse events after 2 months ‐ reading problems indirect versus 70% indirect lightning | 1 | Mean Difference (IV, Fixed, 95% CI) | 0.0 [0.0, 0.0] | |
| 14.2 Adverse events after 5 months ‐ reading problems indirect versus 70% indirect lightning | 1 | Mean Difference (IV, Fixed, 95% CI) | 0.0 [0.0, 0.0] | |
| 15 Adverse events ‐ reading problems indirect versus direct lighting Show forest plot | 1 | Mean Difference (IV, Fixed, 95% CI) | Totals not selected | |
| 15.1 Adverse events after 2 months ‐ reading problems indirect versus direct lighting | 1 | Mean Difference (IV, Fixed, 95% CI) | 0.0 [0.0, 0.0] | |
| 15.2 Adverse events after 5 months ‐ reading problems indirect versus direct lighting | 1 | Mean Difference (IV, Fixed, 95% CI) | 0.0 [0.0, 0.0] | |
| 16 Adverse events ‐ reading problems 70% indirect versus 30% indirect lighting Show forest plot | 1 | Mean Difference (IV, Fixed, 95% CI) | Totals not selected | |
| 16.1 Adverse events after 2 months ‐ reading problems 70% indirect versus 30% indirect lighting | 1 | Mean Difference (IV, Fixed, 95% CI) | 0.0 [0.0, 0.0] | |
| 16.2 Adverse events after 5 months ‐ reading problems 70% indirect versus 30% indirect lighting | 1 | Mean Difference (IV, Fixed, 95% CI) | 0.0 [0.0, 0.0] | |
| 17 Adverse events ‐ reading problems 70% indirect versus direct lighting Show forest plot | 1 | Mean Difference (IV, Fixed, 95% CI) | Totals not selected | |
| 17.1 Adverse events after 2 months ‐ reading problems 70% indirect versus direct lighting | 1 | Mean Difference (IV, Fixed, 95% CI) | 0.0 [0.0, 0.0] | |
| 17.2 Adverse events after 5 months ‐ reading problems 70% indirect versus direct lighting | 1 | Mean Difference (IV, Fixed, 95% CI) | 0.0 [0.0, 0.0] | |
| 18 Adverse events ‐ reading problems 30% indirect versus direct lighting Show forest plot | 1 | Mean Difference (IV, Fixed, 95% CI) | Totals not selected | |
| 18.1 Adverse events after 2 months ‐ reading problems 30% indirect versus direct lighting | 1 | Mean Difference (IV, Fixed, 95% CI) | 0.0 [0.0, 0.0] | |
| 18.2 Adverse events after 5 months ‐ reading problems 30% indirect versus direct lighting | 1 | Mean Difference (IV, Fixed, 95% CI) | 0.0 [0.0, 0.0] | |
| 19 Adverse events ‐ concentration problems indirect versus 70% indirect lighting Show forest plot | 1 | Mean Difference (IV, Fixed, 95% CI) | Totals not selected | |
| 19.1 Adverse events after 2 months ‐ concentration problems indirect versus 70% indirect lighting | 1 | Mean Difference (IV, Fixed, 95% CI) | 0.0 [0.0, 0.0] | |
| 19.2 Adverse events after 5 months ‐ concentration problems indirect versus 70% indirect lighting | 1 | Mean Difference (IV, Fixed, 95% CI) | 0.0 [0.0, 0.0] | |
| 20 Adverse events ‐ concentration problems indirect versus 30% indirect lighting Show forest plot | 1 | Mean Difference (IV, Fixed, 95% CI) | Totals not selected | |
| 20.1 Adverse events after 2 months ‐ concentration problems indirect versus 30% indirect lighting | 1 | Mean Difference (IV, Fixed, 95% CI) | 0.0 [0.0, 0.0] | |
| 20.2 Adverse events after 5 months ‐ concentration problems indirect versus 30% indirect lighting | 1 | Mean Difference (IV, Fixed, 95% CI) | 0.0 [0.0, 0.0] | |
| 21 Adverse events ‐ concentration problems indirect versus direct lighting Show forest plot | 1 | Mean Difference (IV, Fixed, 95% CI) | Totals not selected | |
| 21.1 Adverse events after 2 months ‐ concentration problems indirect versus direct lighting | 1 | Mean Difference (IV, Fixed, 95% CI) | 0.0 [0.0, 0.0] | |
| 21.2 Adverse events after 5 months ‐ concentration problems indirect versus direct lighting | 1 | Mean Difference (IV, Fixed, 95% CI) | 0.0 [0.0, 0.0] | |
| 22 Adverse events ‐ concentration problems 70% indirect versus 30% indirect lighting Show forest plot | 1 | Mean Difference (IV, Fixed, 95% CI) | Totals not selected | |
| 22.1 Adverse events after 2 months ‐ concentration problems 70% indirect versus 30% indirect lighting | 1 | Mean Difference (IV, Fixed, 95% CI) | 0.0 [0.0, 0.0] | |
| 22.2 Adverse events after 5 months ‐ concentration problems 70% indirect versus 30% indirect lighting | 1 | Mean Difference (IV, Fixed, 95% CI) | 0.0 [0.0, 0.0] | |
| 23 Adverse events ‐ concentration problems 70% indirect versus direct lighting Show forest plot | 1 | Mean Difference (IV, Fixed, 95% CI) | Totals not selected | |
| 23.1 Adverse events after 2 months ‐ concentration problems 70% indirect versus direct lighting | 1 | Mean Difference (IV, Fixed, 95% CI) | 0.0 [0.0, 0.0] | |
| 23.2 Adverse events after 5 months ‐ concentration problems 70% indirect versus direct lighting | 1 | Mean Difference (IV, Fixed, 95% CI) | 0.0 [0.0, 0.0] | |
| 24 Adverse events ‐ concentration problems 30% indirect versus direct lighting Show forest plot | 1 | Mean Difference (IV, Fixed, 95% CI) | Totals not selected | |
| 24.1 Adverse events after 2 months ‐ concentration problems 30% indirect versus direct lighting | 1 | Mean Difference (IV, Fixed, 95% CI) | 0.0 [0.0, 0.0] | |
| 24.2 Adverse events after 5 months ‐ concentration problems 30% indirect versus direct lighting | 1 | Mean Difference (IV, Fixed, 95% CI) | 0.0 [0.0, 0.0] | |
| 25 Adverse events ‐ musculoskeletal symptoms indirect versus 70% indirect lighting Show forest plot | 1 | Mean Difference (IV, Fixed, 95% CI) | Totals not selected | |
| 25.1 Adverse events after 2 months ‐ musculoskeletal symptoms indirect versus 70% indirect lighting | 1 | Mean Difference (IV, Fixed, 95% CI) | 0.0 [0.0, 0.0] | |
| 25.2 Adverse events after 5 months ‐ musculoskeletal symptoms indirect versus 70% indirect lighting | 1 | Mean Difference (IV, Fixed, 95% CI) | 0.0 [0.0, 0.0] | |
| 26 Adverse events ‐ musculoskeletal symptoms indirect versus 30% indirect lighting Show forest plot | 1 | Mean Difference (IV, Fixed, 95% CI) | Totals not selected | |
| 26.1 Adverse events after 2 months ‐ musculoskeletal symptoms indirect versus 30% indirect lighting | 1 | Mean Difference (IV, Fixed, 95% CI) | 0.0 [0.0, 0.0] | |
| 26.2 Adverse events after 5 months ‐ musculoskeletal symptoms indirect versus 30% indirect lighting | 1 | Mean Difference (IV, Fixed, 95% CI) | 0.0 [0.0, 0.0] | |
| 27 Adverse events ‐ musculoskeletal symptoms indirect versus direct lighting Show forest plot | 1 | Mean Difference (IV, Fixed, 95% CI) | Totals not selected | |
| 27.1 Adverse events after 2 months ‐ musculoskeletal symptoms indirect versus direct lighting | 1 | Mean Difference (IV, Fixed, 95% CI) | 0.0 [0.0, 0.0] | |
| 27.2 Adverse events after 5 months ‐ musculoskeletal symptoms indirect versus direct lighting | 1 | Mean Difference (IV, Fixed, 95% CI) | 0.0 [0.0, 0.0] | |
| 28 Adverse events ‐ musculoskeletal symptoms 70% indirect versus 30% indirect lighting Show forest plot | 1 | Mean Difference (IV, Fixed, 95% CI) | Totals not selected | |
| 28.1 Adverse events after 2 months ‐ musculoskeletal symptoms 70% indirect versus 30% indirect lighting | 1 | Mean Difference (IV, Fixed, 95% CI) | 0.0 [0.0, 0.0] | |
| 28.2 Adverse events after 5 months ‐ musculoskeletal symptoms 70% indirect versus 30% indirect lighting | 1 | Mean Difference (IV, Fixed, 95% CI) | 0.0 [0.0, 0.0] | |
| 29 Adverse events ‐ musculoskeletal symptoms 70% indirect versus direct lighting Show forest plot | 1 | Mean Difference (IV, Fixed, 95% CI) | Totals not selected | |
| 29.1 Adverse events after 2 months ‐ musculoskeletal symptoms 70% indirect versus direct lighting | 1 | Mean Difference (IV, Fixed, 95% CI) | 0.0 [0.0, 0.0] | |
| 29.2 Adverse events after 5 months ‐ musculoskeletal symptoms 70% indirect versus direct lighting | 1 | Mean Difference (IV, Fixed, 95% CI) | 0.0 [0.0, 0.0] | |
| 30 Adverse events ‐ musculoskeletal symptoms 30% indirect versus direct lighting Show forest plot | 1 | Mean Difference (IV, Fixed, 95% CI) | Totals not selected | |
| 30.1 Adverse events after 2 months ‐ musculoskeletal symptoms 30% indirect versus direct lighting | 1 | Mean Difference (IV, Fixed, 95% CI) | 0.0 [0.0, 0.0] | |
| 30.2 Adverse events after 5 months ‐ musculoskeletal symptoms 30% indirect versus direct lighting | 1 | Mean Difference (IV, Fixed, 95% CI) | 0.0 [0.0, 0.0] | |
| Outcome or subgroup title | No. of studies | No. of participants | Statistical method | Effect size |
| 1 Alertness ‐ Epworth Sleepiness Scale Show forest plot | 1 | Mean Difference (Fixed, 95% CI) | Totals not selected | |
| 2 Mood Beck Depression Inventory‐II Show forest plot | 1 | Mean Difference (Fixed, 95% CI) | Totals not selected | |
| Outcome or subgroup title | No. of studies | No. of participants | Statistical method | Effect size |
| 1 Alertness (visual analogue scale (VAS)) after 2 weeks of intervention Show forest plot | 1 | Mean Difference (IV, Fixed, 95% CI) | Totals not selected | |
| 2 Mood (≥ 50% of reduction of Structured Interview Guide for the Hamilton Depression Rating Scale‐Seasonal Affective Disorders Version (SIGH‐SAD) scores from baseline after 2 weeks of treatment)) Show forest plot | 1 | Risk Ratio (M‐H, Fixed, 95% CI) | Totals not selected | |
| 3 Mood SIGH‐SAD after 2 weeks of intervention Show forest plot | 1 | Mean Difference (IV, Fixed, 95% CI) | Totals not selected | |
| 4 Mood 21‐item Hamilton Depressive Rating Scale after 2 weeks of interventions Show forest plot | 1 | Mean Difference (IV, Fixed, 95% CI) | Totals not selected | |
| 5 Mood 17‐item Hamilton Depressive Rating Scale after 2 weeks of intervention Show forest plot | 1 | Mean Difference (IV, Fixed, 95% CI) | Totals not selected | |
| 6 Mood Seasonal Affective Disorders subscale after 2 weeks of intervention Show forest plot | 1 | Mean Difference (IV, Fixed, 95% CI) | Totals not selected | |
| 7 Mood VAS after 2 weeks of intervention Show forest plot | 1 | Mean Difference (IV, Fixed, 95% CI) | Totals not selected | |
| 8 Frequency of adverse events after 2 weeks of intervention Show forest plot | 1 | Risk Ratio (M‐H, Fixed, 95% CI) | Totals not selected | |