Iluminación del lugar de trabajo para mejorar el estado de alerta y el estado de ánimo en los trabajadores diurnos
Información
- DOI:
- https://doi.org/10.1002/14651858.CD012243.pub2Copiar DOI

- Base de datos:
-
- Cochrane Database of Systematic Reviews
- Versión publicada:
-
- 02 marzo 2018see what's new
- Tipo:
-
- Intervention
- Etapa:
-
- Review
- Grupo Editorial Cochrane:
-
Grupo Cochrane de Salud laboral
- Copyright:
-
- Copyright © 2018 The Cochrane Collaboration. Published by John Wiley & Sons, Ltd.
Cifras del artículo
Altmetric:
Citado por:
Autores
Contributions of authors
Conceiving the protocol: DVP, RR.
Designing the protocol: DVP, ALE, ASD, MAC, TP, SMWR, RR.
Co‐ordinating the protocol: DVP, RR.
Designing search strategies: DVP, RR.
Writing the protocol: DVP, RR.
Providing general advice on the protocol: DVP, ALE, ASD, MAC, TP, SMWR, RR.
Screening references: DVP, RR.
Data extraction: DVP, RR.
Data synthesis: DVP, RR.
Writing the review: DVP.
Providing general advice on the review: DVP, TP, RR.
Sources of support
Internal sources
-
National Institute for Health and Welfare, Finland.
Institutional affiliation of author Timo Partonen
-
Universidade de São Paulo, Brazil.
Institutional affiliation of author Alan Eckeli
-
Monash University, Australia.
Institutional affiliation of author Shanthakumar Wilson Rajaratnam
External sources
-
Brazilian Cochrane Centre, Brazil.
Training for preparing Cochrane protocols and reviews for author Daniela Pachito
-
Central Queensland University, Australia.
Access to databases through institutional electronic library.
Declarations of interest
DVP: None known.
ALE: None known.
ASD: None known.
MAC: None known.
TP: Received lecture fees (Dila, Finnair, Helen, Helsinki Fair, Lundbeck, MCD‐Team, MERCURIA, Servier Finland, Speakers Forum Finland, YTHS). Royalties (Kustannus Oy Duodecim, Oxford University Press, Terve Media).
SMWR: Received grant/research support from Philips Respironics, Cephalon, Philips, Vanda Pharmaceuticals, consultancy fees from Edan Safe, Alertness CRC, corporate benefit/equipment donation from Compumedics, Tyco Healthcare, Philips Lighting, Optalert.
RR: None known.
Acknowledgements
We thank Jani Ruotsalainen, Managing Editor and Jos Verbeek, Co‐ordinating Editor from the Cochrane Work Group for their help in all stages of the current review. We thank Heikki Laitinen, Kaisa Hartikainen and Cristiane Rufino for their valuable assistance in developing the search strategies. We also thank Cochrane Work Editor Carel Hulshof and external peer referees Mikko Härmä, Steven Lockley, and an anonymous peer referee for their comments and Anne Lawson for copy editing the text.
Version history
| Published | Title | Stage | Authors | Version |
| 2018 Mar 02 | Workplace lighting for improving alertness and mood in daytime workers | Review | Daniela V Pachito, Alan L Eckeli, Ahmed S Desouky, Mark A Corbett, Timo Partonen, Shantha MW Rajaratnam, Rachel Riera | |
| 2016 Jun 14 | Workplace lighting for improving mood and alertness in daytime workers | Protocol | Daniela V Pachito, Alan L Eckeli, Ahmed S Desouky, Mark A Corbett, Timo Partonen, Shanthakumar M Wilson Rajaratnam, Rachel Riera | |
Differences between protocol and review
We followed the methods that we specified in our protocol (Pachito 2016), with the following minor adjustments.
We did not foresee the category of indirect versus direct lighting sources. We included this category at the review stage because the study by Fostervold 2008 met all the eligibility criteria. We redefined the category 'light administered in sequences with particular interstimulus intervals' into 'individually administered light versus no treatment,' to assemble all types of individually applied lighting interventions under the same topic.
We planned to calculate photopic and melanopic illuminance using the method described by Lucas 2014 for each meta‐analysis. However, considering that the two studies included in the single meta‐analysis in this review employed the same light source from the same manufacturer, we considered the studies as being similar regarding photopic and melanopic illuminance.
At the protocol stage, We did not explicitly specify how we would judge the overall risk of bias of the included studies. We judged a study to have a high risk of bias overall when we judged one or more domains to have a high risk of bias. Conversely, we judged a study to have a low risk of bias when we judged low risk of bias for all domains.
Notes
Parts of the methods section and Appendix 2 of this protocol were based on a standard template established by the Cochrane Work Group.
Keywords
MeSH
Medical Subject Headings (MeSH) Keywords
Medical Subject Headings Check Words
Humans;
PICO

PRISMA study flow diagram.

Risk of bias graph: review authors' judgements about each risk of bias item presented as percentages across all included studies.
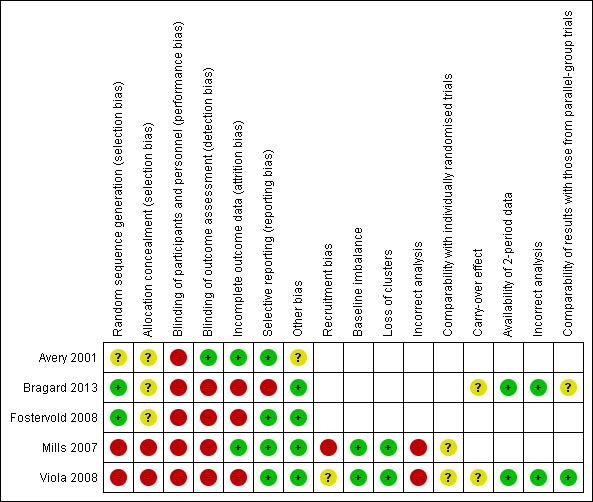
Risk of bias summary: review authors' judgements about each risk of bias item for each included study.

Forest plot of comparison: 4 High correlated colour temperature light versus standard illumination, outcome: alertness.

Comparison 1 High correlated colour temperature light versus standard illumination, Outcome 1 Alertness ‐ Item Decreased Daytime Alertness from Columbia Jet Lag Scale 14 weeks.

Comparison 1 High correlated colour temperature light versus standard illumination, Outcome 2 Alertness ‐ Item Sleepiness in Day from Columbia Jet Lag Scale 14 weeks.

Comparison 1 High correlated colour temperature light versus standard illumination, Outcome 3 Alertness ‐ Karolinska Sleepiness Scale: mean of all time points.

Comparison 1 High correlated colour temperature light versus standard illumination, Outcome 4 Alertness ‐ meta‐analysis.

Comparison 1 High correlated colour temperature light versus standard illumination, Outcome 5 Mood ‐ Positive Mood PANAS Scale: mean of all time points.

Comparison 1 High correlated colour temperature light versus standard illumination, Outcome 6 Mood ‐ Negative Mood PANAS Scale: mean of all time points.
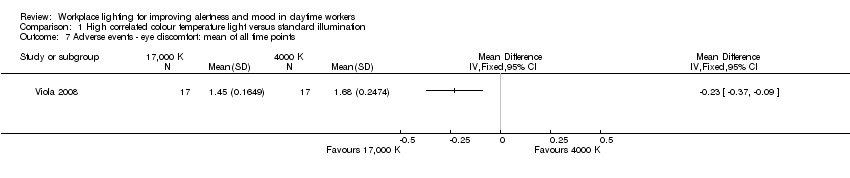
Comparison 1 High correlated colour temperature light versus standard illumination, Outcome 7 Adverse events ‐ eye discomfort: mean of all time points.
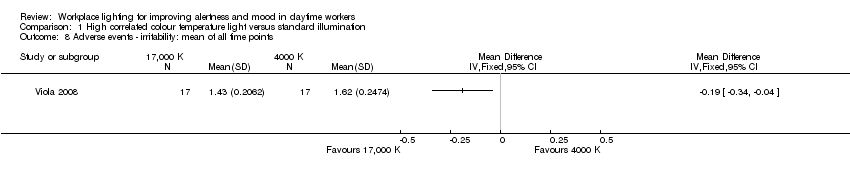
Comparison 1 High correlated colour temperature light versus standard illumination, Outcome 8 Adverse events ‐ irritability: mean of all time points.
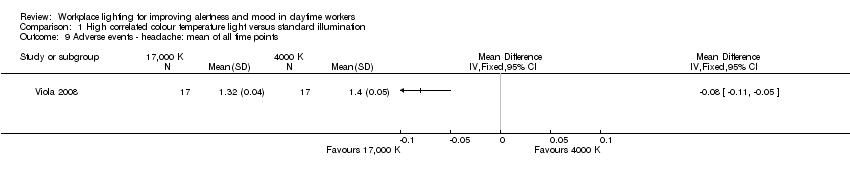
Comparison 1 High correlated colour temperature light versus standard illumination, Outcome 9 Adverse events ‐ headache: mean of all time points.

Comparison 1 High correlated colour temperature light versus standard illumination, Outcome 10 Adverse events ‐ eye strain: mean of all time points.
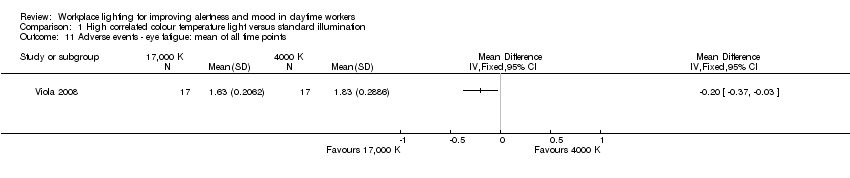
Comparison 1 High correlated colour temperature light versus standard illumination, Outcome 11 Adverse events ‐ eye fatigue: mean of all time points.

Comparison 1 High correlated colour temperature light versus standard illumination, Outcome 12 Adverse events ‐ difficult focusing: mean of all time points.

Comparison 1 High correlated colour temperature light versus standard illumination, Outcome 13 Adverse events ‐ difficulty concentrating: mean of all time points.

Comparison 1 High correlated colour temperature light versus standard illumination, Outcome 14 Adverse events ‐ blurred vision: mean of all time points.
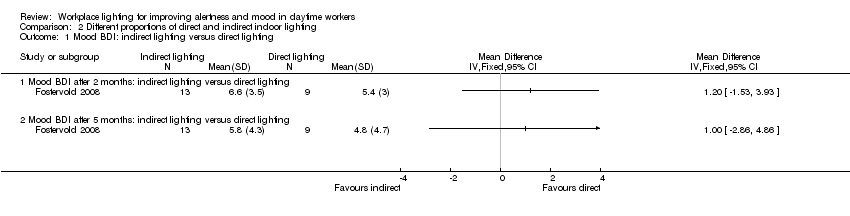
Comparison 2 Different proportions of direct and indirect indoor lighting, Outcome 1 Mood BDI: indirect lighting versus direct lighting.
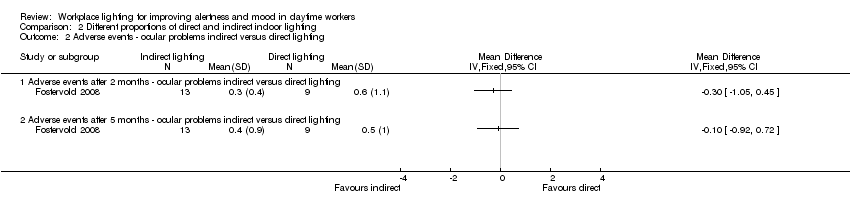
Comparison 2 Different proportions of direct and indirect indoor lighting, Outcome 2 Adverse events ‐ ocular problems indirect versus direct lighting.

Comparison 2 Different proportions of direct and indirect indoor lighting, Outcome 3 Mood Beck Depression Inventory (BDI): indirect lighting versus 70% indirect lighting.
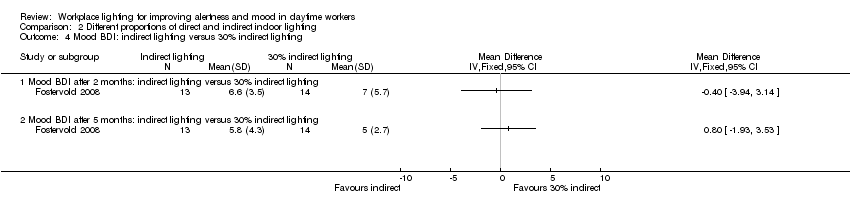
Comparison 2 Different proportions of direct and indirect indoor lighting, Outcome 4 Mood BDI: indirect lighting versus 30% indirect lighting.
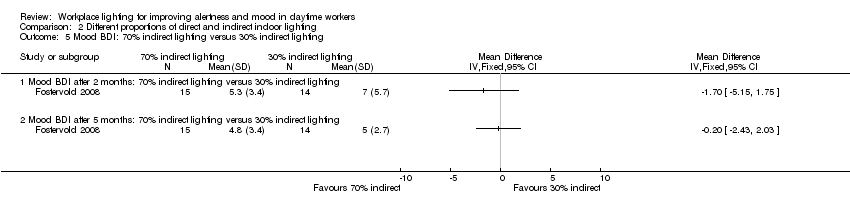
Comparison 2 Different proportions of direct and indirect indoor lighting, Outcome 5 Mood BDI: 70% indirect lighting versus 30% indirect lighting.
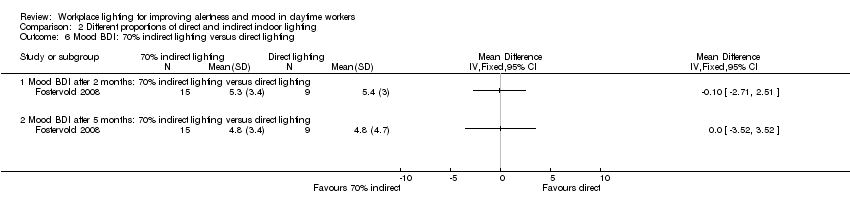
Comparison 2 Different proportions of direct and indirect indoor lighting, Outcome 6 Mood BDI: 70% indirect lighting versus direct lighting.

Comparison 2 Different proportions of direct and indirect indoor lighting, Outcome 7 Mood BDI: 30% indirect lighting versus direct lighting.
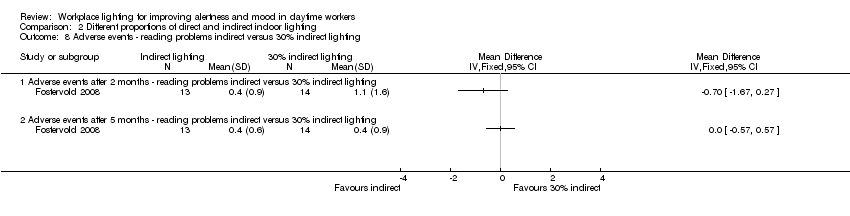
Comparison 2 Different proportions of direct and indirect indoor lighting, Outcome 8 Adverse events ‐ reading problems indirect versus 30% indirect lighting.

Comparison 2 Different proportions of direct and indirect indoor lighting, Outcome 9 Adverse events ‐ ocular problems indirect versus 70% indirect lighting.

Comparison 2 Different proportions of direct and indirect indoor lighting, Outcome 10 Adverse events ‐ ocular problems indirect versus 30% indirect lighting.

Comparison 2 Different proportions of direct and indirect indoor lighting, Outcome 11 Adverse events ‐ ocular problems 70% indirect versus 30% indirect lighting.

Comparison 2 Different proportions of direct and indirect indoor lighting, Outcome 12 Adverse events ‐ ocular problems 70% indirect versus direct lighting.
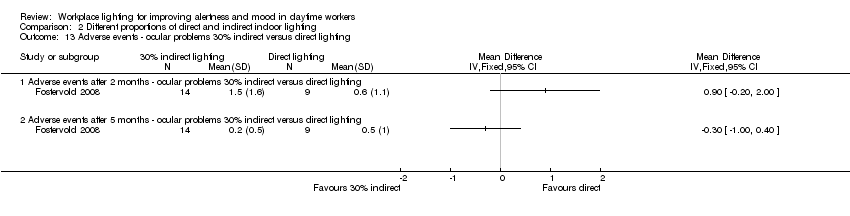
Comparison 2 Different proportions of direct and indirect indoor lighting, Outcome 13 Adverse events ‐ ocular problems 30% indirect versus direct lighting.

Comparison 2 Different proportions of direct and indirect indoor lighting, Outcome 14 Adverse events ‐ reading problems indirect versus 70% indirect lighting.
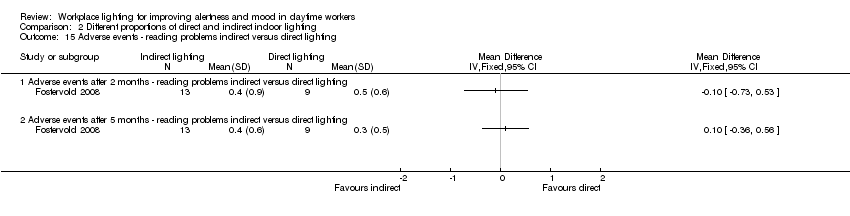
Comparison 2 Different proportions of direct and indirect indoor lighting, Outcome 15 Adverse events ‐ reading problems indirect versus direct lighting.

Comparison 2 Different proportions of direct and indirect indoor lighting, Outcome 16 Adverse events ‐ reading problems 70% indirect versus 30% indirect lighting.
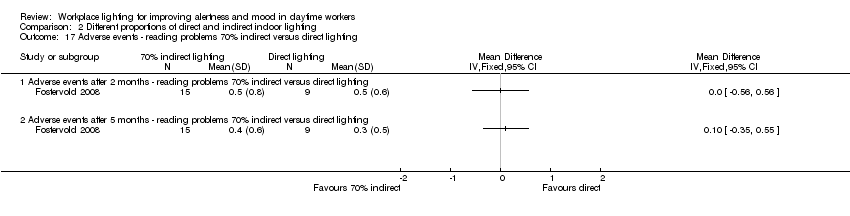
Comparison 2 Different proportions of direct and indirect indoor lighting, Outcome 17 Adverse events ‐ reading problems 70% indirect versus direct lighting.

Comparison 2 Different proportions of direct and indirect indoor lighting, Outcome 18 Adverse events ‐ reading problems 30% indirect versus direct lighting.
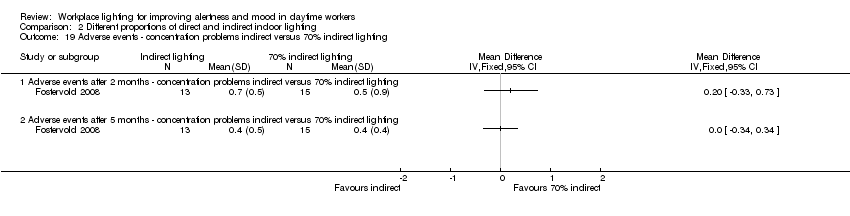
Comparison 2 Different proportions of direct and indirect indoor lighting, Outcome 19 Adverse events ‐ concentration problems indirect versus 70% indirect lighting.

Comparison 2 Different proportions of direct and indirect indoor lighting, Outcome 20 Adverse events ‐ concentration problems indirect versus 30% indirect lighting.

Comparison 2 Different proportions of direct and indirect indoor lighting, Outcome 21 Adverse events ‐ concentration problems indirect versus direct lighting.

Comparison 2 Different proportions of direct and indirect indoor lighting, Outcome 22 Adverse events ‐ concentration problems 70% indirect versus 30% indirect lighting.
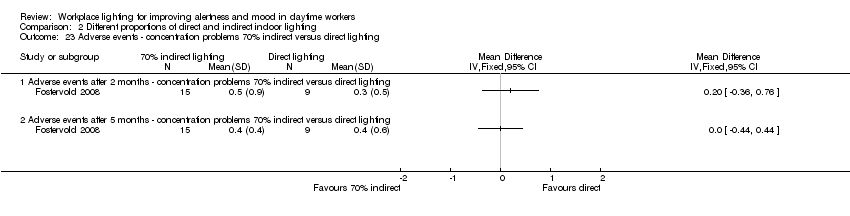
Comparison 2 Different proportions of direct and indirect indoor lighting, Outcome 23 Adverse events ‐ concentration problems 70% indirect versus direct lighting.
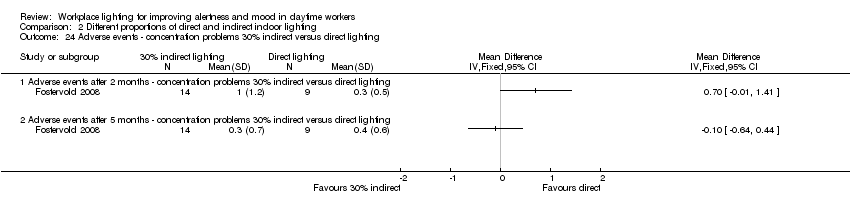
Comparison 2 Different proportions of direct and indirect indoor lighting, Outcome 24 Adverse events ‐ concentration problems 30% indirect versus direct lighting.
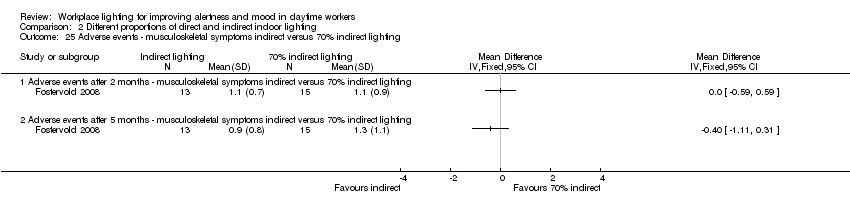
Comparison 2 Different proportions of direct and indirect indoor lighting, Outcome 25 Adverse events ‐ musculoskeletal symptoms indirect versus 70% indirect lighting.
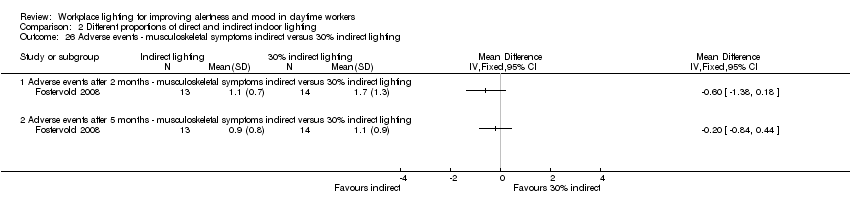
Comparison 2 Different proportions of direct and indirect indoor lighting, Outcome 26 Adverse events ‐ musculoskeletal symptoms indirect versus 30% indirect lighting.

Comparison 2 Different proportions of direct and indirect indoor lighting, Outcome 27 Adverse events ‐ musculoskeletal symptoms indirect versus direct lighting.

Comparison 2 Different proportions of direct and indirect indoor lighting, Outcome 28 Adverse events ‐ musculoskeletal symptoms 70% indirect versus 30% indirect lighting.

Comparison 2 Different proportions of direct and indirect indoor lighting, Outcome 29 Adverse events ‐ musculoskeletal symptoms 70% indirect versus direct lighting.

Comparison 2 Different proportions of direct and indirect indoor lighting, Outcome 30 Adverse events ‐ musculoskeletal symptoms 30% indirect versus direct lighting.

Comparison 3 Individually applied blue‐enriched light versus no treatment, Outcome 1 Alertness ‐ Epworth Sleepiness Scale.

Comparison 3 Individually applied blue‐enriched light versus no treatment, Outcome 2 Mood Beck Depression Inventory‐II.

Comparison 4 Morning bright light versus afternoon bright light, Outcome 1 Alertness (visual analogue scale (VAS)) after 2 weeks of intervention.

Comparison 4 Morning bright light versus afternoon bright light, Outcome 2 Mood (≥ 50% of reduction of Structured Interview Guide for the Hamilton Depression Rating Scale‐Seasonal Affective Disorders Version (SIGH‐SAD) scores from baseline after 2 weeks of treatment)).
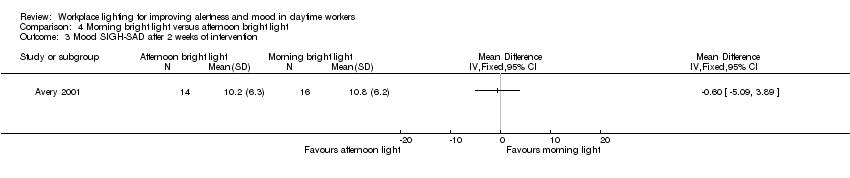
Comparison 4 Morning bright light versus afternoon bright light, Outcome 3 Mood SIGH‐SAD after 2 weeks of intervention.
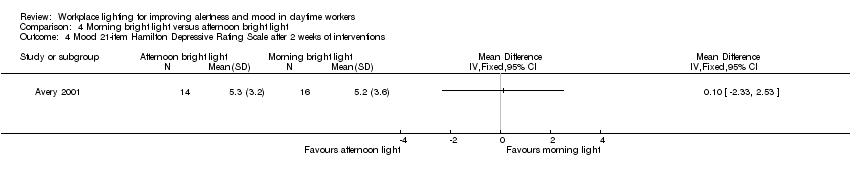
Comparison 4 Morning bright light versus afternoon bright light, Outcome 4 Mood 21‐item Hamilton Depressive Rating Scale after 2 weeks of interventions.

Comparison 4 Morning bright light versus afternoon bright light, Outcome 5 Mood 17‐item Hamilton Depressive Rating Scale after 2 weeks of intervention.

Comparison 4 Morning bright light versus afternoon bright light, Outcome 6 Mood Seasonal Affective Disorders subscale after 2 weeks of intervention.

Comparison 4 Morning bright light versus afternoon bright light, Outcome 7 Mood VAS after 2 weeks of intervention.
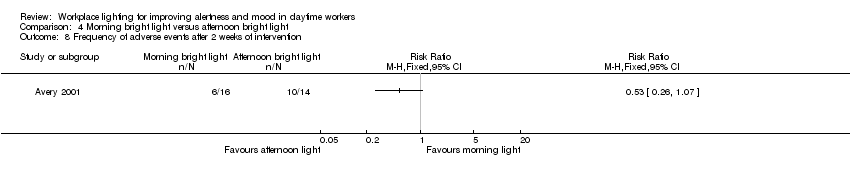
Comparison 4 Morning bright light versus afternoon bright light, Outcome 8 Frequency of adverse events after 2 weeks of intervention.
| High correlated colour temperature light versus standard illumination for improving mood and alertness in daytime workers | ||||
| Patient or population: daytime workers | ||||
| Outcomes | Anticipated absolute effects (95% CI) | № of participants (studies) | Quality of the evidence | |
| Risk with standard illumination | Risk with CCT light | |||
| Alertness KS range 1 to 9 (worst) | ‐‐ | SMD** 0.69 lower | 163 Effective sample size = 50 | ⊕⊝⊝⊝ |
| Mood (positive) | Mean standard positive mood 25.9 | MD 2.08 higher | 94 Effective sample size = 34 | ⊕⊝⊝⊝ |
| Mood (negative) | Mean standard negative mood 13.7 | MD 0.45 lower | 94 Effective sample size = 34 | ⊕⊝⊝⊝ |
| Adverse events ‐ eye discomfort | Mean standard adverse events 1.7 | MD 0.23 lower | 94 Effective sample size = 34 | ⊕⊝⊝⊝ |
| * Effective sample sizes applied to correct for the unit‐of‐analysis error. ** As a rule of thumb, 0.2 Standard Deviations represents a small difference, 0.5 a moderate difference, and 0.8 a large difference. CI: confidence interval; CCT: correlated colour temperature; MD: mean difference; PANAS: Positive and Negative Affect Schedule; SMD: standardised mean difference. | ||||
| GRADE Working Group grades of evidence | ||||
| 1 The assessment of risk of bias for non‐randomised studies starts at low‐quality evidence. We downgraded the level of evidence with one level, i.e. to very low quality, due to imprecision caused by a small sample size. 2 We would have downgraded the level of evidence with one more level due to imprecision caused by wide confidence intervals that include a null effect but we had already reached a judgment of very low‐quality evidence. | ||||
| Indirect light versus direct light for improving mood and alertness in daytime workers | ||||
| Patient or population: daytime workers | ||||
| Outcomes | Anticipated absolute effects (95% CI) | № of participants | Quality of the evidence | |
| Risk with direct light | Risk with indirect light | |||
| Alertness | Not assessed | Not assessed | Not assessed | Not assessed |
| Mood | Mean mood 5.8 | MD 1 higher | 22 | ⊕⊕⊝⊝ |
| Adverse events (ocular problems) | Mean adverse events 0.4 | MD 0.1 lower | 22 | ⊕⊕⊝⊝ |
| CI: confidence interval; MD: mean difference; RCT: randomised controlled trial. | ||||
| GRADE Working Group grades of evidence | ||||
| 1 We downgraded the level of evidence with one level, i.e. from high to moderate quality, due to risk of bias (the authors did not fully describe how or if they employed allocation concealment, outcome assessors were not blinded and there was a high and unbalanced attrition rate). 2 We downgraded the level of evidence with one level, i.e. from moderate to low quality, due to imprecision (a small sample size and a wide confidence interval including a null effect). | ||||
| Individually applied blue‐enriched light versus no treatment for improving mood and alertness in daytime workers | ||||
| Patient or population: daytime workers | ||||
| Outcomes | Anticipated absolute effects (95% CI) | № of participants | Quality of the evidence | |
| Risk with light as usual | Risk with blue‐enriched light | |||
| Alertness | Mean alertness | MD 3.3 lower | 25 | ⊕⊝⊝⊝ |
| Mood | Mean mood | MD 4.8 lower | 25 | ⊕⊝⊝⊝ |
| Adverse events | Not assessed | Not assessed | Not assessed | Not assessed |
| CI: confidence interval; MD: mean difference; RCT: randomised controlled trial. | ||||
| GRADE Working Group grades of evidence | ||||
| 1 We downgraded the level of evidence with two levels, i.e. from high to low quality, due to risk of bias (the authors did not fully describe how or if they employed allocation concealment, outcome assessors were not blinded, results for SIGH‐HDRS were not reported and there was a high attrition rate). 2 We downgraded the level of evidence with one level, i.e. from low to very low quality, due to imprecision (a small sample size and a wide confidence interval). | ||||
| Morning bright light versus afternoon bright light for improving mood and alertness in daytime workers | |||||
| Patient or population: daytime workers | |||||
| Outcomes | Anticipated absolute effects* (95% CI) | Relative effect with morning bright light | № of participants | Quality of the evidence | |
| Risk with afternoon bright light | Risk with morning bright light | ||||
| Alertness | Mean 59 (SD 23) | Mean 66 (SD 25) | MD 7 higher | 30 | ⊕⊕⊝⊝ |
| Mood | 426 per 1000 | 688 per 1000 | RR 1.60 | 30 | ⊕⊕⊝⊝ |
| Adverse events (frequency) | 712 per 1000 | 375 per 1000 | RR 0.53 | 30 | ⊕⊕⊝⊝ |
| *The risk in the intervention group (and its 95% confidence interval) is based on the assumed risk in the comparison group and the relative effect of the intervention (and its 95% CI). CI: confidence interval; MD: mean difference; RCT: randomised controlled trial; RR: risk ratio; SIGH‐SAD: Structured Interview Guide for the Hamilton Depression Rating Scale‐Seasonal Affective Disorders Version. | |||||
| GRADE Working Group grades of evidence | |||||
| 1 We downgraded the level of evidence with one level, i.e. from high to moderate quality, due to risk of bias (the authors did not fully describe their randomisation method nor how or if they employed allocation concealment). 2 We downgraded the level of evidence with one level, i.e. from moderate to low quality, due to imprecision (a small sample size and a wide confidence interval including a null effect). | |||||
| Outcome or subgroup title | No. of studies | No. of participants | Statistical method | Effect size |
| 1 Alertness ‐ Item Decreased Daytime Alertness from Columbia Jet Lag Scale 14 weeks Show forest plot | 1 | Mean Difference (IV, Fixed, 95% CI) | Totals not selected | |
| 2 Alertness ‐ Item Sleepiness in Day from Columbia Jet Lag Scale 14 weeks Show forest plot | 1 | Mean Difference (IV, Fixed, 95% CI) | Totals not selected | |
| 3 Alertness ‐ Karolinska Sleepiness Scale: mean of all time points Show forest plot | 1 | Mean Difference (IV, Fixed, 95% CI) | Totals not selected | |
| 4 Alertness ‐ meta‐analysis Show forest plot | 2 | 50 | Std. Mean Difference (IV, Fixed, 95% CI) | ‐0.69 [‐1.28, ‐0.10] |
| 5 Mood ‐ Positive Mood PANAS Scale: mean of all time points Show forest plot | 1 | Mean Difference (IV, Fixed, 95% CI) | Totals not selected | |
| 6 Mood ‐ Negative Mood PANAS Scale: mean of all time points Show forest plot | 1 | Mean Difference (IV, Fixed, 95% CI) | Totals not selected | |
| 7 Adverse events ‐ eye discomfort: mean of all time points Show forest plot | 1 | Mean Difference (IV, Fixed, 95% CI) | Totals not selected | |
| 8 Adverse events ‐ irritability: mean of all time points Show forest plot | 1 | Mean Difference (IV, Fixed, 95% CI) | Totals not selected | |
| 9 Adverse events ‐ headache: mean of all time points Show forest plot | 1 | Mean Difference (IV, Fixed, 95% CI) | Totals not selected | |
| 10 Adverse events ‐ eye strain: mean of all time points Show forest plot | 1 | Mean Difference (IV, Fixed, 95% CI) | Totals not selected | |
| 11 Adverse events ‐ eye fatigue: mean of all time points Show forest plot | 1 | Mean Difference (IV, Fixed, 95% CI) | Totals not selected | |
| 12 Adverse events ‐ difficult focusing: mean of all time points Show forest plot | 1 | Mean Difference (IV, Fixed, 95% CI) | Totals not selected | |
| 13 Adverse events ‐ difficulty concentrating: mean of all time points Show forest plot | 1 | Mean Difference (IV, Fixed, 95% CI) | Totals not selected | |
| 14 Adverse events ‐ blurred vision: mean of all time points Show forest plot | 1 | Mean Difference (IV, Fixed, 95% CI) | Totals not selected | |
| Outcome or subgroup title | No. of studies | No. of participants | Statistical method | Effect size |
| 1 Mood BDI: indirect lighting versus direct lighting Show forest plot | 1 | Mean Difference (IV, Fixed, 95% CI) | Totals not selected | |
| 1.1 Mood BDI after 2 months: indirect lighting versus direct lighting | 1 | Mean Difference (IV, Fixed, 95% CI) | 0.0 [0.0, 0.0] | |
| 1.2 Mood BDI after 5 months: indirect lighting versus direct lighting | 1 | Mean Difference (IV, Fixed, 95% CI) | 0.0 [0.0, 0.0] | |
| 2 Adverse events ‐ ocular problems indirect versus direct lighting Show forest plot | 1 | Mean Difference (IV, Fixed, 95% CI) | Totals not selected | |
| 2.1 Adverse events after 2 months ‐ ocular problems indirect versus direct lighting | 1 | Mean Difference (IV, Fixed, 95% CI) | 0.0 [0.0, 0.0] | |
| 2.2 Adverse events after 5 months ‐ ocular problems indirect versus direct lighting | 1 | Mean Difference (IV, Fixed, 95% CI) | 0.0 [0.0, 0.0] | |
| 3 Mood Beck Depression Inventory (BDI): indirect lighting versus 70% indirect lighting Show forest plot | 1 | Mean Difference (IV, Fixed, 95% CI) | Totals not selected | |
| 3.1 Mood BDI after 2 months: indirect lighting versus 70% indirect lighting | 1 | Mean Difference (IV, Fixed, 95% CI) | 0.0 [0.0, 0.0] | |
| 3.2 Mood BDI after 5 months: indirect lighting versus 70% indirect lighting | 1 | Mean Difference (IV, Fixed, 95% CI) | 0.0 [0.0, 0.0] | |
| 4 Mood BDI: indirect lighting versus 30% indirect lighting Show forest plot | 1 | Mean Difference (IV, Fixed, 95% CI) | Totals not selected | |
| 4.1 Mood BDI after 2 months: indirect lighting versus 30% indirect lighting | 1 | Mean Difference (IV, Fixed, 95% CI) | 0.0 [0.0, 0.0] | |
| 4.2 Mood BDI after 5 months: indirect lighting versus 30% indirect lighting | 1 | Mean Difference (IV, Fixed, 95% CI) | 0.0 [0.0, 0.0] | |
| 5 Mood BDI: 70% indirect lighting versus 30% indirect lighting Show forest plot | 1 | Mean Difference (IV, Fixed, 95% CI) | Totals not selected | |
| 5.1 Mood BDI after 2 months: 70% indirect lighting versus 30% indirect lighting | 1 | Mean Difference (IV, Fixed, 95% CI) | 0.0 [0.0, 0.0] | |
| 5.2 Mood BDI after 5 months: 70% indirect lighting versus 30% indirect lighting | 1 | Mean Difference (IV, Fixed, 95% CI) | 0.0 [0.0, 0.0] | |
| 6 Mood BDI: 70% indirect lighting versus direct lighting Show forest plot | 1 | Mean Difference (IV, Fixed, 95% CI) | Totals not selected | |
| 6.1 Mood BDI after 2 months: 70% indirect lighting versus direct lighting | 1 | Mean Difference (IV, Fixed, 95% CI) | 0.0 [0.0, 0.0] | |
| 6.2 Mood BDI after 5 months: 70% indirect lighting versus direct lighting | 1 | Mean Difference (IV, Fixed, 95% CI) | 0.0 [0.0, 0.0] | |
| 7 Mood BDI: 30% indirect lighting versus direct lighting Show forest plot | 1 | Mean Difference (IV, Fixed, 95% CI) | Totals not selected | |
| 7.1 Mood BDI after 2 months: 30% indirect lighting versus direct lighting | 1 | Mean Difference (IV, Fixed, 95% CI) | 0.0 [0.0, 0.0] | |
| 7.2 Mood BDI after 5 months: 30% indirect lighting versus direct lighting | 1 | Mean Difference (IV, Fixed, 95% CI) | 0.0 [0.0, 0.0] | |
| 8 Adverse events ‐ reading problems indirect versus 30% indirect lighting Show forest plot | 1 | Mean Difference (IV, Fixed, 95% CI) | Totals not selected | |
| 8.1 Adverse events after 2 months ‐ reading problems indirect versus 30% indirect lighting | 1 | Mean Difference (IV, Fixed, 95% CI) | 0.0 [0.0, 0.0] | |
| 8.2 Adverse events after 5 months ‐ reading problems indirect versus 30% indirect lighting | 1 | Mean Difference (IV, Fixed, 95% CI) | 0.0 [0.0, 0.0] | |
| 9 Adverse events ‐ ocular problems indirect versus 70% indirect lighting Show forest plot | 1 | Mean Difference (IV, Fixed, 95% CI) | Totals not selected | |
| 9.1 Adverse events after 2 months ‐ ocular problems indirect versus 70% indirect lighting | 1 | Mean Difference (IV, Fixed, 95% CI) | 0.0 [0.0, 0.0] | |
| 9.2 Adverse events after 5 months ‐ ocular problems indirect versus 70% indirect lighting | 1 | Mean Difference (IV, Fixed, 95% CI) | 0.0 [0.0, 0.0] | |
| 10 Adverse events ‐ ocular problems indirect versus 30% indirect lighting Show forest plot | 1 | Mean Difference (IV, Fixed, 95% CI) | Totals not selected | |
| 10.1 Adverse events after 2 months ‐ ocular problems indirect versus 30% indirect lighting | 1 | Mean Difference (IV, Fixed, 95% CI) | 0.0 [0.0, 0.0] | |
| 10.2 Adverse events after 5 months ‐ ocular problems indirect versus 30% indirect lighting | 1 | Mean Difference (IV, Fixed, 95% CI) | 0.0 [0.0, 0.0] | |
| 11 Adverse events ‐ ocular problems 70% indirect versus 30% indirect lighting Show forest plot | 1 | Mean Difference (IV, Fixed, 95% CI) | Totals not selected | |
| 11.1 Adverse events after 2 months ‐ ocular problems 70% indirect versus 30% indirect lighting | 1 | Mean Difference (IV, Fixed, 95% CI) | 0.0 [0.0, 0.0] | |
| 11.2 Adverse events after 5 months ‐ ocular problems 70% indirect versus 30% indirect lighting | 1 | Mean Difference (IV, Fixed, 95% CI) | 0.0 [0.0, 0.0] | |
| 12 Adverse events ‐ ocular problems 70% indirect versus direct lighting Show forest plot | 1 | Mean Difference (IV, Fixed, 95% CI) | Totals not selected | |
| 12.1 Adverse events after 2 months ‐ ocular problems 70% indirect versus direct lighting | 1 | Mean Difference (IV, Fixed, 95% CI) | 0.0 [0.0, 0.0] | |
| 12.2 Adverse events after 5 months ‐ ocular problems 70% indirect versus direct lighting | 1 | Mean Difference (IV, Fixed, 95% CI) | 0.0 [0.0, 0.0] | |
| 13 Adverse events ‐ ocular problems 30% indirect versus direct lighting Show forest plot | 1 | Mean Difference (IV, Fixed, 95% CI) | Totals not selected | |
| 13.1 Adverse events after 2 months ‐ ocular problems 30% indirect versus direct lighting | 1 | Mean Difference (IV, Fixed, 95% CI) | 0.0 [0.0, 0.0] | |
| 13.2 Adverse events after 5 months ‐ ocular problems 30% indirect versus direct lighting | 1 | Mean Difference (IV, Fixed, 95% CI) | 0.0 [0.0, 0.0] | |
| 14 Adverse events ‐ reading problems indirect versus 70% indirect lighting Show forest plot | 1 | Mean Difference (IV, Fixed, 95% CI) | Totals not selected | |
| 14.1 Adverse events after 2 months ‐ reading problems indirect versus 70% indirect lightning | 1 | Mean Difference (IV, Fixed, 95% CI) | 0.0 [0.0, 0.0] | |
| 14.2 Adverse events after 5 months ‐ reading problems indirect versus 70% indirect lightning | 1 | Mean Difference (IV, Fixed, 95% CI) | 0.0 [0.0, 0.0] | |
| 15 Adverse events ‐ reading problems indirect versus direct lighting Show forest plot | 1 | Mean Difference (IV, Fixed, 95% CI) | Totals not selected | |
| 15.1 Adverse events after 2 months ‐ reading problems indirect versus direct lighting | 1 | Mean Difference (IV, Fixed, 95% CI) | 0.0 [0.0, 0.0] | |
| 15.2 Adverse events after 5 months ‐ reading problems indirect versus direct lighting | 1 | Mean Difference (IV, Fixed, 95% CI) | 0.0 [0.0, 0.0] | |
| 16 Adverse events ‐ reading problems 70% indirect versus 30% indirect lighting Show forest plot | 1 | Mean Difference (IV, Fixed, 95% CI) | Totals not selected | |
| 16.1 Adverse events after 2 months ‐ reading problems 70% indirect versus 30% indirect lighting | 1 | Mean Difference (IV, Fixed, 95% CI) | 0.0 [0.0, 0.0] | |
| 16.2 Adverse events after 5 months ‐ reading problems 70% indirect versus 30% indirect lighting | 1 | Mean Difference (IV, Fixed, 95% CI) | 0.0 [0.0, 0.0] | |
| 17 Adverse events ‐ reading problems 70% indirect versus direct lighting Show forest plot | 1 | Mean Difference (IV, Fixed, 95% CI) | Totals not selected | |
| 17.1 Adverse events after 2 months ‐ reading problems 70% indirect versus direct lighting | 1 | Mean Difference (IV, Fixed, 95% CI) | 0.0 [0.0, 0.0] | |
| 17.2 Adverse events after 5 months ‐ reading problems 70% indirect versus direct lighting | 1 | Mean Difference (IV, Fixed, 95% CI) | 0.0 [0.0, 0.0] | |
| 18 Adverse events ‐ reading problems 30% indirect versus direct lighting Show forest plot | 1 | Mean Difference (IV, Fixed, 95% CI) | Totals not selected | |
| 18.1 Adverse events after 2 months ‐ reading problems 30% indirect versus direct lighting | 1 | Mean Difference (IV, Fixed, 95% CI) | 0.0 [0.0, 0.0] | |
| 18.2 Adverse events after 5 months ‐ reading problems 30% indirect versus direct lighting | 1 | Mean Difference (IV, Fixed, 95% CI) | 0.0 [0.0, 0.0] | |
| 19 Adverse events ‐ concentration problems indirect versus 70% indirect lighting Show forest plot | 1 | Mean Difference (IV, Fixed, 95% CI) | Totals not selected | |
| 19.1 Adverse events after 2 months ‐ concentration problems indirect versus 70% indirect lighting | 1 | Mean Difference (IV, Fixed, 95% CI) | 0.0 [0.0, 0.0] | |
| 19.2 Adverse events after 5 months ‐ concentration problems indirect versus 70% indirect lighting | 1 | Mean Difference (IV, Fixed, 95% CI) | 0.0 [0.0, 0.0] | |
| 20 Adverse events ‐ concentration problems indirect versus 30% indirect lighting Show forest plot | 1 | Mean Difference (IV, Fixed, 95% CI) | Totals not selected | |
| 20.1 Adverse events after 2 months ‐ concentration problems indirect versus 30% indirect lighting | 1 | Mean Difference (IV, Fixed, 95% CI) | 0.0 [0.0, 0.0] | |
| 20.2 Adverse events after 5 months ‐ concentration problems indirect versus 30% indirect lighting | 1 | Mean Difference (IV, Fixed, 95% CI) | 0.0 [0.0, 0.0] | |
| 21 Adverse events ‐ concentration problems indirect versus direct lighting Show forest plot | 1 | Mean Difference (IV, Fixed, 95% CI) | Totals not selected | |
| 21.1 Adverse events after 2 months ‐ concentration problems indirect versus direct lighting | 1 | Mean Difference (IV, Fixed, 95% CI) | 0.0 [0.0, 0.0] | |
| 21.2 Adverse events after 5 months ‐ concentration problems indirect versus direct lighting | 1 | Mean Difference (IV, Fixed, 95% CI) | 0.0 [0.0, 0.0] | |
| 22 Adverse events ‐ concentration problems 70% indirect versus 30% indirect lighting Show forest plot | 1 | Mean Difference (IV, Fixed, 95% CI) | Totals not selected | |
| 22.1 Adverse events after 2 months ‐ concentration problems 70% indirect versus 30% indirect lighting | 1 | Mean Difference (IV, Fixed, 95% CI) | 0.0 [0.0, 0.0] | |
| 22.2 Adverse events after 5 months ‐ concentration problems 70% indirect versus 30% indirect lighting | 1 | Mean Difference (IV, Fixed, 95% CI) | 0.0 [0.0, 0.0] | |
| 23 Adverse events ‐ concentration problems 70% indirect versus direct lighting Show forest plot | 1 | Mean Difference (IV, Fixed, 95% CI) | Totals not selected | |
| 23.1 Adverse events after 2 months ‐ concentration problems 70% indirect versus direct lighting | 1 | Mean Difference (IV, Fixed, 95% CI) | 0.0 [0.0, 0.0] | |
| 23.2 Adverse events after 5 months ‐ concentration problems 70% indirect versus direct lighting | 1 | Mean Difference (IV, Fixed, 95% CI) | 0.0 [0.0, 0.0] | |
| 24 Adverse events ‐ concentration problems 30% indirect versus direct lighting Show forest plot | 1 | Mean Difference (IV, Fixed, 95% CI) | Totals not selected | |
| 24.1 Adverse events after 2 months ‐ concentration problems 30% indirect versus direct lighting | 1 | Mean Difference (IV, Fixed, 95% CI) | 0.0 [0.0, 0.0] | |
| 24.2 Adverse events after 5 months ‐ concentration problems 30% indirect versus direct lighting | 1 | Mean Difference (IV, Fixed, 95% CI) | 0.0 [0.0, 0.0] | |
| 25 Adverse events ‐ musculoskeletal symptoms indirect versus 70% indirect lighting Show forest plot | 1 | Mean Difference (IV, Fixed, 95% CI) | Totals not selected | |
| 25.1 Adverse events after 2 months ‐ musculoskeletal symptoms indirect versus 70% indirect lighting | 1 | Mean Difference (IV, Fixed, 95% CI) | 0.0 [0.0, 0.0] | |
| 25.2 Adverse events after 5 months ‐ musculoskeletal symptoms indirect versus 70% indirect lighting | 1 | Mean Difference (IV, Fixed, 95% CI) | 0.0 [0.0, 0.0] | |
| 26 Adverse events ‐ musculoskeletal symptoms indirect versus 30% indirect lighting Show forest plot | 1 | Mean Difference (IV, Fixed, 95% CI) | Totals not selected | |
| 26.1 Adverse events after 2 months ‐ musculoskeletal symptoms indirect versus 30% indirect lighting | 1 | Mean Difference (IV, Fixed, 95% CI) | 0.0 [0.0, 0.0] | |
| 26.2 Adverse events after 5 months ‐ musculoskeletal symptoms indirect versus 30% indirect lighting | 1 | Mean Difference (IV, Fixed, 95% CI) | 0.0 [0.0, 0.0] | |
| 27 Adverse events ‐ musculoskeletal symptoms indirect versus direct lighting Show forest plot | 1 | Mean Difference (IV, Fixed, 95% CI) | Totals not selected | |
| 27.1 Adverse events after 2 months ‐ musculoskeletal symptoms indirect versus direct lighting | 1 | Mean Difference (IV, Fixed, 95% CI) | 0.0 [0.0, 0.0] | |
| 27.2 Adverse events after 5 months ‐ musculoskeletal symptoms indirect versus direct lighting | 1 | Mean Difference (IV, Fixed, 95% CI) | 0.0 [0.0, 0.0] | |
| 28 Adverse events ‐ musculoskeletal symptoms 70% indirect versus 30% indirect lighting Show forest plot | 1 | Mean Difference (IV, Fixed, 95% CI) | Totals not selected | |
| 28.1 Adverse events after 2 months ‐ musculoskeletal symptoms 70% indirect versus 30% indirect lighting | 1 | Mean Difference (IV, Fixed, 95% CI) | 0.0 [0.0, 0.0] | |
| 28.2 Adverse events after 5 months ‐ musculoskeletal symptoms 70% indirect versus 30% indirect lighting | 1 | Mean Difference (IV, Fixed, 95% CI) | 0.0 [0.0, 0.0] | |
| 29 Adverse events ‐ musculoskeletal symptoms 70% indirect versus direct lighting Show forest plot | 1 | Mean Difference (IV, Fixed, 95% CI) | Totals not selected | |
| 29.1 Adverse events after 2 months ‐ musculoskeletal symptoms 70% indirect versus direct lighting | 1 | Mean Difference (IV, Fixed, 95% CI) | 0.0 [0.0, 0.0] | |
| 29.2 Adverse events after 5 months ‐ musculoskeletal symptoms 70% indirect versus direct lighting | 1 | Mean Difference (IV, Fixed, 95% CI) | 0.0 [0.0, 0.0] | |
| 30 Adverse events ‐ musculoskeletal symptoms 30% indirect versus direct lighting Show forest plot | 1 | Mean Difference (IV, Fixed, 95% CI) | Totals not selected | |
| 30.1 Adverse events after 2 months ‐ musculoskeletal symptoms 30% indirect versus direct lighting | 1 | Mean Difference (IV, Fixed, 95% CI) | 0.0 [0.0, 0.0] | |
| 30.2 Adverse events after 5 months ‐ musculoskeletal symptoms 30% indirect versus direct lighting | 1 | Mean Difference (IV, Fixed, 95% CI) | 0.0 [0.0, 0.0] | |
| Outcome or subgroup title | No. of studies | No. of participants | Statistical method | Effect size |
| 1 Alertness ‐ Epworth Sleepiness Scale Show forest plot | 1 | Mean Difference (Fixed, 95% CI) | Totals not selected | |
| 2 Mood Beck Depression Inventory‐II Show forest plot | 1 | Mean Difference (Fixed, 95% CI) | Totals not selected | |
| Outcome or subgroup title | No. of studies | No. of participants | Statistical method | Effect size |
| 1 Alertness (visual analogue scale (VAS)) after 2 weeks of intervention Show forest plot | 1 | Mean Difference (IV, Fixed, 95% CI) | Totals not selected | |
| 2 Mood (≥ 50% of reduction of Structured Interview Guide for the Hamilton Depression Rating Scale‐Seasonal Affective Disorders Version (SIGH‐SAD) scores from baseline after 2 weeks of treatment)) Show forest plot | 1 | Risk Ratio (M‐H, Fixed, 95% CI) | Totals not selected | |
| 3 Mood SIGH‐SAD after 2 weeks of intervention Show forest plot | 1 | Mean Difference (IV, Fixed, 95% CI) | Totals not selected | |
| 4 Mood 21‐item Hamilton Depressive Rating Scale after 2 weeks of interventions Show forest plot | 1 | Mean Difference (IV, Fixed, 95% CI) | Totals not selected | |
| 5 Mood 17‐item Hamilton Depressive Rating Scale after 2 weeks of intervention Show forest plot | 1 | Mean Difference (IV, Fixed, 95% CI) | Totals not selected | |
| 6 Mood Seasonal Affective Disorders subscale after 2 weeks of intervention Show forest plot | 1 | Mean Difference (IV, Fixed, 95% CI) | Totals not selected | |
| 7 Mood VAS after 2 weeks of intervention Show forest plot | 1 | Mean Difference (IV, Fixed, 95% CI) | Totals not selected | |
| 8 Frequency of adverse events after 2 weeks of intervention Show forest plot | 1 | Risk Ratio (M‐H, Fixed, 95% CI) | Totals not selected | |