Bacilo de Calmette‐Guérin intravesical con interferón‐alfa versus bacilo de Calmette‐Guérin para el tratamiento del cáncer de vejiga sin invasión de la muscular
Resumen
Antecedentes
El cáncer de vejiga sin invasión de la muscular (CVSIM) tiene una alta tasa de recidiva y progresión a pesar de los tratamientos locales, habitualmente resección transuretral (RTU) seguida de tratamientos coadyuvantes. Se ha mostrado que el bacilo de Calmette‐Guérin (BCG) intravesical reduce la recidiva y la progresión en los pacientes con CVSIM después de la RTU; sin embargo, muchos pacientes no responden al tratamiento, presentan recidiva poco después o no pueden tolerar el tratamiento a las dosis estándar. La posibilidad de actividad antitumoral sinérgica del interferón (IFN)‐alfa (α) y el BCG proporciona cierta justificación para el tratamiento de combinación en los pacientes que no toleran o no responden al tratamiento con BCG a dosis estándar.
Objetivos
Evaluar los efectos del BCG administrado intravesicalmente más IFN‐α en comparación con BCG solo para tratar el cáncer de vejiga sin invasión de la muscular.
Métodos de búsqueda
Se hicieron búsquedas en el Registro Cochrane Central de Ensayos Controlados (Cochrane Central Register of Controlled Trials) (CENTRAL) (número 8, 2016), MEDLINE (OvidSP) (1946 hasta 2016), Embase (OvidSP) (1974 hasta 2016), ClinicalTrials.gov, en la World Health Organization International Clinical Trials Registry Platform (WHO ICTRP), así como en listas de referencias de artículos recuperados y se hicieron búsquedas manuales de actas de congresos de congresos relevantes de los últimos tres años. No se aplicaron restricciones de idiomas. La fecha de la última búsqueda en todas las bases de datos fue 25 agosto 2016.
Criterios de selección
Se incluyeron los ensayos controlados aleatorios (ECA) y los ensayos pseudaleatorios que evaluaron el BCG administrado intravesicalmente más IFN‐α versus BCG solo en adultos de cualquier sexo con cáncer de vejiga superficial Ta y T1 confirmado histológicamente, con o sin carcinoma in situ, tratado con RTU.
Obtención y análisis de los datos
Dos autores de la revisión, de forma independiente, evaluaron la elegibilidad de los estudios, extrajeron los datos y evaluaron el riesgo de sesgo de los estudios incluidos. Se utilizó Review Manager 5 para la síntesis de los datos y el modelo de efectos aleatorios para los metanálisis. En los resultados predeterminados, cuando no fue posible obtener la información del tiempo hasta el evento (p.ej. tiempo hasta la recidiva), en su lugar se evaluaron resultados dicotómicos (p.ej. recidiva). Se evaluó la calidad de la evidencia para las comparaciones principales utilizando el enfoque GRADE.
Resultados principales
En esta revisión se incluyeron cinco ECA con un total de 1231 participantes con CVSIM. Debido a la deficiente información, muchas veces el riesgo de sesgo en los estudios incluidos fue poco claro. Los estudios se evaluaron en dos comparaciones principales: BCG intravesical más IFN‐α versus BCG intravesical solo (cuatro ECA) y BCG intravesical alternado con IFN‐α versus BCG intravesical solo (un ECA).
BCG intravesical más IFN‐α versus BCG intravesical solo (cuatro ECA): No se observaron diferencias claras entre BCG más IFN‐α y BCG solo en cuanto a la recidiva (cociente de riesgos [CR] promedio 0,76; intervalo de confianza [IC] del 95%: 0,44 a 1,32; cuatro ECA; 925 participantes; evidencia de muy baja calidad) ni la progresión (CR promedio 0,26; IC del 95%: 0,04 a 1,87; dos ECA; 219 participantes; evidencia de baja calidad). Los ECA incluidos no informaron el otro resultado primario de esta revisión, interrupción del tratamiento debido a eventos adversos. Con respecto a los resultados secundarios, no se observaron diferencias claras en cuanto a la mortalidad asociada a la enfermedad (CR 0,38; IC del 95%: 0,05 a 3,05; un ECA; 99 participantes; evidencia de muy baja calidad). No fue posible agrupar dos ECA que informaron resultados contradictorios para los eventos adversos debido a la variación en las definiciones. No hubo datos de los ECA incluidos sobre el tiempo hasta la muerte ni la calidad de vida asociada a la enfermedad.
BCG intravesical alternado con IFN‐α versus BCG intravesical solo (un ECA): Se observó un tiempo hasta la recidiva más corto en los participantes del grupo BCG alternado con IFN‐α en comparación con el grupo BCG solo (cociente de riesgos instantáneos [CRI] 2,86; IC del 95%: 1,98 a 4,13; un ECA; 205 participantes; evidencia de baja calidad), pero no hubo diferencias claras en el tiempo hasta la progresión (CRI 2,39; IC del 95%: 0,92 a 6,21; un ECA; 205 participantes; evidencia de baja calidad) ni en la interrupción del tratamiento debido a eventos adversos (CR 2,97; IC del 95%: 0,31 a 28,09; un ECA; 205 participantes; evidencia de baja calidad). Con respecto a los resultados secundarios, no hubo diferencias claras entre los grupos de BCG alternado con IFN‐α y BCG solo en cuanto a la mortalidad asociada a la enfermedad (CRI 2,74; IC del 95%: 0,73 a 10,28; un ECA; 205 participantes; evidencia de baja calidad), el tiempo hasta la muerte (supervivencia general) (CRI 1,00; IC del 95%: 0,68 a 1,47; un ECA; 205 participantes; evidencia de baja calidad), ni los eventos adversos sistémicos o locales (CR 1,65; IC del 95%: 0,41 a 6,73; un ECA; 205 participantes; evidencia de baja calidad). No hubo datos sobre la calidad de vida asociada a la enfermedad.
Conclusiones de los autores
Se encontró evidencia de calidad baja a muy baja que no indicó diferencias claras en la recidiva ni la progresión con BCG más IFN‐α en comparación con BCG solo en los pacientes con CVSIM; no hubo información para determinar el efecto sobre la interrupción del tratamiento debido a eventos adversos. Existe evidencia de baja calidad que indica que el BCG alternado con IFN‐α en comparación con el BCG solo puede aumentar el tiempo hasta la recidiva; sin embargo, otra evidencia de baja calidad también indica que no hubo diferencias claras en cuanto al tiempo hasta la progresión ni en la interrupción del tratamiento debido a eventos adversos.
Ensayos adicionales de alta calidad con un poder estadístico suficiente y que utilicen regímenes de instilación y dosis estandarizados de BCG e IFN‐α, informen resultados en subgrupos estratificados según las características de los pacientes y el tumor, así como resultados a largo plazo relacionados no sólo con la recidiva sino también con la progresión, la interrupción debido a eventos adversos y la mortalidad, pueden ayudar a aclarar la estrategia de tratamiento ideal y proporcionar un resultado más definitivo.
PICO
Resumen en términos sencillos
Tratamiento local del cáncer de vejiga sin invasión de la muscular con bacilo de Calmette‐Guérin con o sin interferón‐alfa
Pregunta de la revisión
Se examinó la evidencia sobre los efectos del tratamiento local de la vejiga con bacilo de Calmette‐Guérin (BCG) e interferón (IFN)‐ alfa (α) para el cáncer de las capas superficiales de la vejiga (conocido como cáncer de vejiga sin invasión de la muscular).
Antecedentes
El cáncer de vejiga es un cáncer frecuente en todo el mundo. El cáncer de vejiga sin invasión de la muscular se trata habitualmente con resección (extracción mediante cirugía), pero tiene un alto riesgo de recidiva y progresión hacia una enfermedad más invasiva con este tratamiento solo. El bacilo de Calmette‐Guérin es un tratamiento que se administra con frecuencia en la vejiga después de la resección para reducir el riesgo de recidiva y progresión. Algunos estudios no aleatorios han mostrado que agregar IFN‐α al BCG puede reducir aún más estos riesgos. El objetivo fue comparar los efectos del BCG con IFN‐α versus BCG solo administrado en la vejiga para el tratamiento de los pacientes con cáncer de vejiga sin invasión de la muscular.
Características de los estudios
La evidencia está actualizada hasta el 25 de agosto de 2016. Se incluyeron cinco estudios con 1231 participantes con cáncer de vejiga sin invasión de la muscular. Cuatro estudios compararon BCG administrado junto con IFN‐α versus BCG solo. Un estudio comparó BCG alternado con IFN‐α versus BCG solo. El período de seguimiento de los estudios varió de dos meses a casi 20 años.
Resultados clave
BCG combinado con IFN‐α (cuatro estudios):se encontró evidencia de muy baja calidad que no mostró diferencias claras en la recidiva (cuatro estudios con 925 participantes) ni en la progresión (dos estudios con 219 participantes) en los participantes que recibieron BCG combinado con IFN‐α y los que recibieron BCG solo. Ninguno de los estudios informó el resultado importante interrupción del tratamiento debido a eventos adversos. También hubo evidencia de muy baja calidad que no mostró diferencias claras entre los grupos en cuanto a la mortalidad específica por cáncer (un estudio, 99 participantes). Hubo resultados mixtos para los eventos adversos (dos estudios, 120 y 670 participantes, respectivamente).
BCG alternado con IFN‐α (un estudio):se encontró evidencia de baja calidad que mostró una probabilidad mayor de recidiva cuando el BCG se alternó con IFN‐α en comparación con BCG solo (estudio con 205 participantes). También se encontró evidencia de baja calidad que mostró que no hubo diferencias claras en la probabilidad de progresión, el riesgo de interrupción del tratamiento debido a eventos adversos, ni en la mortalidad específica por cáncer entre los participantes que recibieron BCG alternado con IFN‐α y los que recibieron BCG solo (un estudio con 205 participantes). Tampoco hubo diferencias claras entre los grupos en cuanto a la supervivencia ni los eventos adversos generales (un estudio con 205 participantes).
Ninguno de los cinco estudios informó sobre la calidad de vida de los participantes.
Calidad de la evidencia
Como los estudios incluidos a menudo se realizaron o se informaron de manera deficiente, la calidad de la evidencia se calificó en general como baja. Los estudios de investigación adicionales probablemente tengan un impacto importante sobre la confianza en la exactitud de los resultados.
Authors' conclusions
Summary of findings
| Intravesically administered BCG combined with IFN‐α compared to intravesically administered BCG alone for treating non‐muscle‐invasive bladder cancer Patient or population: patients with non‐muscle invasive bladder cancer Intervention: BCG combined with IFN‐α Comparison: BCG alone | |||||
| Outcomes | № of participants | Quality of the evidence | Relative effect | Anticipated absolute effects* (95% CI) | |
| Risk with intravesically administered BCG alone | Risk difference with intravesically administered BCG combined with IFN‐α | ||||
| Recurrence Follow‐up: median 38.3 to 60 months | 925 | ⊕⊕⊝⊝ | RR 0.76 | Study population | |
| 342 per 1000 | 82 fewer per 1000 | ||||
| Progression Follow‐up: median 38.3 to 60 months | 219 | ⊕⊕⊝⊝ | RR 0.26 | Study population | |
| 124 per 1000 | 92 fewer per 1000 | ||||
| Discontinuation of therapy due to adverse events ‐ not measured | ‐ | ‐ | ‐ | ‐ | ‐ |
| Disease‐specific mortality Follow‐up: median 60 months | 99 | ⊕⊝⊝⊝ | RR 0.38 | Study population | |
| 87 per 1000 | 54 fewer per 1000 | ||||
| Disease‐specific quality of life ‐ not measured | ‐ | ‐ | ‐ | ‐ | ‐ |
| *The risk in the intervention group (and its 95% confidence interval) is based on the assumed risk in the comparison group and the relative effect of the intervention (and its 95% CI). BCG: Bacillus Calmette‐Guérin; CI: confidence interval; IFN‐α: interferon‐alpha; RCT: randomised controlled trial; RR: risk ratio | |||||
| GRADE Working Group grades of evidence | |||||
| 1Downgraded for study limitations (‐1): high risk of bias: 'blinding of participants and personnel' (Nepple 2010); 'blinding of outcome assessment' (Nepple 2010); 'selective reporting' (Bercovich 1995; Minich 2009; Nepple 2010); 'other bias' (Bercovich 1995). | |||||
| Intravesically administered BCG alternating with IFN‐α compared to intravesically administered BCG alone for treating non‐muscle‐invasive bladder cancer Patient or population: patients with non‐muscle invasive bladder cancer Intervention: BCG alternating with IFN‐α Comparison: BCG alone | |||||
| Outcomes | № of participants | Quality of the evidence | Relative effect | Anticipated absolute effects* (95% CI) | |
| Risk with intravesically administered BCG alone | Risk difference with intravesically administered BCG alternating with IFN‐α | ||||
| Time‐to‐recurrence Follow‐up: median 8.6 to 10.3 years | 205 | ⊕⊕⊕⊝ | HR 2.86 | Study population | |
| 431 per 1000 | 370 more per 1000 | ||||
| Time‐to‐progression Follow‐up: median 8.6 to 10.3 years | 205 | ⊕⊕⊝⊝ | HR 2.39 | Study population | |
| 59 per 1000 | 76 more per 1000 | ||||
| Discontinuation of therapy due to adverse events Follow‐up: median 8.6 to 10.3 years | 205 | ⊕⊕⊝⊝ | RR 2.97 | Study population | |
| 10 per 1000 | 19 more per 1000 | ||||
| Disease‐specific mortality Follow‐up: median 8.6 to 10.3 years | 205 | ⊕⊕⊝⊝ | HR 2.74 | Study population | |
| 29 per 1000 | 49 more per 1000 | ||||
| Disease‐specific quality of life ‐ not measured | ‐ | ‐ | ‐ | ‐ | ‐ |
| *The risk in the intervention group (and its 95% confidence interval) is based on the assumed risk in the comparison group and the relative effect of the intervention (and its 95% CI). | |||||
| GRADE Working Group grades of evidence | |||||
| 1Downgraded for study limitations (‐1): high risk of bias: 'blinding of participants and personnel', 'blinding of outcome assessment' (Jarvinen 2015). | |||||
Background
Description of the condition
Urothelial carcinoma of the bladder is the 11th most common cancer worldwide, the seventh most common cancer in men, and the 17th most common cancer in women (Burger 2013; Ferlay 2013). It is the most common cancer of the urinary system, accounting for more than 90% of newly diagnosed bladder cancer cases. In 2012, there were over 429,000 new cases of bladder cancer diagnosed and more than 165,000 deaths due to bladder cancer across the globe (Cancer Research UK 2014; Ferlay 2013); the median age at diagnosis is 65 to 70 years (Kirkali 2005). The incidence and mortality rates of urothelial bladder cancer vary across countries, being more common in high‐income regions, such as Northern America and Western Europe; in 2012, global incidence and mortality rates were 5.3 per 100,000 and 1.9 per 100,000, respectively (Ferlay 2013). The worldwide prevalence of bladder cancer is estimated at 2.7 million; due to its high frequency and relapsing nature, bladder cancer places a large burden on healthcare systems, particularly in high‐income communities, however, with global changes in exposure to risk factors, and with growing and ageing populations, this burden is also increasing in low‐ and middle‐income regions (Ploeg 2009).
At presentation, most people with bladder cancer (75% to 85%) are found to have non‐muscle‐invasive bladder cancer (NMIBC), in which disease is confined to the superficial layers of the bladder (the mucosa and lamina propria) (Burger 2013). According to the tumour, node, metastasis (TNM) classification system, defined by the Union for International Cancer Control, disease of the mucosa is classified as stage Ta, while disease invading the lamina propria is classified as stage T1; flat high‐grade tumours confined to the muscosa are classified as carcinoma in situ (CIS) (Kirkali 2005; Lopez‐Beltran 2004; Sobin 2009).
Approximately 70%, 20%, and 10% of people with NMIBC present with Ta, T1, and CIS lesions, respectively (Kirkali 2005; van Rhijn 2009). Although described as non‐invasive, NMIBC lesions have a high rate of recurrence and progression despite local therapies. For 15% to 25% of people presenting with newly diagnosed bladder cancer, muscle invasion is present (involving the muscular layer of the bladder; known as stage T2), and despite radical therapy, such as radiotherapy or surgery, outcomes can be poor (Burger 2013). Progression from NMIBC to muscle‐invasive disease is associated with the risk of metastatic spread, and accordingly, a worse prognosis.
Risk factors for urothelial bladder cancer can be differentiated into environmental and inherited genetic predispositions, with each risk factor influencing incidence and pathophysiology differently (Burger 2013). Cigarette smoking and occupational exposure to chemical carcinogens have been strongly linked with environmental risks of bladder cancer (Brennan 2000; Freedman 2011). Smoking is recognised as the most important risk factor, estimated to account for 50% of tumours (Freedman 2011), while occupational exposure to aromatic amines, polycyclic aromatic hydrocarbons, and chlorinated hydrocarbons (often in industrial areas processing paint, dye, metal, and petroleum products), is estimated to account for a further 20% of cases (Burger 2013; Vineis 1991). Other risk factors are less consistently reported, and some remain controversial, including dietary factors (i.e. consumption of alcohol, coffee, and tea), and some medical conditions (Burger 2013; Chu 2013); gender, race, and socioeconomic status have been implicated in the genesis of bladder cancer (Burger 2013). Evidence increasingly highlights the importance of genetic factors in influencing bladder cancer risk; for example, family history of bladder cancer has been shown to be a potential risk factor for offspring bladder cancer (Plna 2001).
Description of the intervention
While the management of NMIBC varies internationally , transurethral bladder tumour resection (TUR) is used for the initial diagnosis and treatment (Babjuk 2017; Brausi 2011). Following initial diagnosis and TUR management, prognosis depends on a number of pathological and clinical factors; recurrence at three months for people with multifocal tumours is estimated to range from 7% to 46% (Brausi 2002). The European Organisation for Research and Treatment of Cancer (EORTC) has summarised what are believed to be six of the most important prognostic factors, including: the number of tumours; prior recurrence rate; tumour size; tumour stage; tumour grade; and the presence of concomitant CIS. Based on these factors, 'risk scores' can be calculated, and patients classified as at low, intermediate, and high risk of recurrence and progression, with risks of recurrence at five years ranging from 31% to 78%, and risks of progression ranging from 0.8% to 45% (Babjuk 2017; Sylvester 2006).
To overcome the problems of tumour recurrence, progression in NMIBC, or both, intravesical antitumour agents (chemotherapy or immunotherapy) may be given as adjunct treatment after TUR (Whelan 2007). In people with Ta or T1 bladder cancer, an immediate postoperative chemotherapeutic instillation following TUR may be recommended (Babjuk 2017; Brausi 2011), and has been associated with a 12% absolute reduction in tumour recurrence (Sylvester 2004). No agent has been shown to be of superior efficacy; mitomycin C, epirubicin, and doxorubicin have all shown beneficial effects (Sylvester 2004). The benefit from immediate postoperative chemotherapeutic instillation is less clear for intermediate‐ or high‐risk disease (Brausi 2011).
A commonly used intravesical immunotherapeutic agent for NMIBC, first described by Morales et al in 1976, is Bacillus Calmette‐Guérin (BCG) (Morales 1976). A Cochrane review (that is currently being updated) assessing intravesical BCG for Ta and T1 bladder cancer found that BCG instillation after TUR reduced disease recurrence at 12 months compared with TUR alone (Shelley 2000). The review concluded that in people with medium‐ to high‐risk Ta or T1 bladder cancer, intravesical BCG following TUR has a significant advantage over TUR alone in delaying tumour recurrence (Shelley 2000). Intravesical BCG is now commonly used in the treatment of NMIBC; in people with intermediate‐risk disease, BCG induction (e.g. a course of six weekly instillations) and BCG maintenance (of up to three years), or intravesical chemotherapy (particularly mitomycin C), is recommended; BCG induction and maintenance is recommended for people with high‐risk disease (Babjuk 2017; Brausi 2011; Shelley 2010).
Intravesical BCG causes a significant reduction in the incidence of tumour recurrence and disease progression in people with NMIBC, but a large proportion of patients do not respond to treatment, have recurrence shortly after, or cannot tolerate standard‐dose therapy, as BCG immunotherapy may be associated with both local and systemic toxicities (Shelley 2000). In the Shelley 2000 Cochrane review, toxicities included cystitis (67% of participants), haematuria (23%), fever (25%), and urinary frequency (71%); no BCG‐induced deaths were reported across the six included randomised trials. A recent randomised trial reported that of 1316 participants treated with BCG, 70% experienced local or systemic adverse events, and 8% stopped treatment due to such adverse events (Brausi 2014). Due to these limitations, other agents, including interferon (IFN)‐alpha (α) to be used concomitantly with BCG, have been evaluated.
Interferon‐alpha is a type I IFN cytokine that includes at least 13 subtypes that share the same receptor system and have similar function (Ferrantini 2007; Rizza 2010). Interferon‐alpha was first described for its antiviral activity, and has a long history of use in viral diseases (such as hepatitis C), and in clinical oncology, as a treatment for a variety of malignancies (including chronic myeloid leukaemia, some B‐ and T‐cell lymphomas, renal cell carcinoma, and malignant melanoma) (Ferrantini 2007; Rizza 2010). The antitumour effects of IFN‐α are attributed to its ability to induce multiple biological effects, which include: inducing or promoting apoptosis, or both; inhibiting cell growth; and promoting the differentiation and activity of host immune cells (Ferrantini 2007; Rizza 2010).
How the intervention might work
The efficacy of intravesical BCG in NMIBC is due to a non‐specific immune response, including the local infiltration of macrophages, T lymphocytes (including T helper (Th) cells), and natural killer cells, and the subsequent production of Th1 cytokines (such as IFN‐gamma (γ), interleukin (IL)‐2, IL‐12, and tumour necrosis factor (TNF)‐α) (Schenkman 2004). Helper T1 cells ultimately lead to the destruction, and thus treatment of urothelial carcinoma of the bladder (Schenkman 2004). A small animal study demonstrated that a single instillation of intravesical BCG could disseminate to the para‐aortic lymph nodes, causing the priming of IFN‐γ, producing T cells in mice (Biot 2012). Repeated instillations of BCG were shown to elicit a more robust T‐cell response in bladder cells (Biot 2012).
Helper T2 cytokines counteract the effects of Th1 cytokines. Interferon‐alpha has been shown to increase production of IFN‐γ, IL‐12, and TNF‐α in BCG‐stimulated cells of people with bladder cancer in vitro, while decreasing BCG‐mediated production of Th2 cytokines (Luo 1999). This observation and other similar ones, such as in vitro studies with human bladder cancer cells (Zhang 1999), suggest that IFN‐α may act synergistically to enhance local antitumour activity of BCG by changing the balance between Th1 and Th2 cytokine production, in favour of Th1 cytokines.
The potential for synergistic antitumour activity of IFN‐α and BCG provides some rationale for combination therapy for patients who do not tolerate or respond to standard‐dose BCG monotherapy. Some non‐randomised studies have shown promise (Joudi 2006; Lam 2003; O'Donnell 2001; Punnen 2003). In a small retrospective study of reduced doses of BCG plus IFN‐α in 12 participants with urothelial carcinoma with BCG failure, six (50%) were disease‐free at 12 months (Punnen 2003). In a further uncontrolled multicentre trial of over 1000 people with NMIBC, participants who were BCG naive and who received standard‐dose BCG plus IFN‐α had a 24‐month recurrence‐free rate of 59%; those participants with BCG failure who received one‐third of the standard BCG dose plus IFN‐α had a 24‐month recurrence‐free rate of 45% (Joudi 2006).
Why it is important to do this review
Non‐randomised studies have provided some support for the use of dual therapy of IFN‐α with BCG for the treatment of NMIBC (Joudi 2006; Lam 2003; O'Donnell 2001; Punnen 2003). Three previous Cochrane reviews have demonstrated some benefit with BCG instillation following TUR compared with epirubicin (though the review authors judged the overall quality of the evidence to be low), mitomycin C (though the significant difference in this review was found in a subgroup of participants at "high‐risk" of tumour recurrence), and TUR alone in preventing recurrence of NMIBC (Shang 2011; Shelley 2000; Shelley 2003). However, the combination of intravesical BCG plus IFN‐α in NMIBC has not been systematically evaluated.
It was therefore important to systematically review the best‐available randomised controlled trial evidence to determine the effectiveness of intravesical BCG plus IFN‐α in NMIBC. We used the GRADE approach to rate the quality of evidence (Guyatt 2008), and focused on patient‐important outcomes. We considered this information to be of value to people with NMIBC and their families, clinicians, and policymakers, when making decisions concerning treatment.
Objectives
To assess the effects of intravesically administered BCG plus IFN‐α compared with BCG alone for treating non‐muscle‐invasive bladder cancer.
We conducted this review according to a predefined published protocol (Shepherd 2016).
Methods
Criteria for considering studies for this review
Types of studies
We included randomised and quasi‐randomised trials. We planned to consider individually randomised trials and cluster‐randomised trials, as well as cross‐over trials (providing separate data were available from the period prior to cross‐over). We excluded non‐randomised trials.
We included studies irrespective of language of publication and publication status.
Types of participants
We included studies of adults (over 18 years of age) of either gender with histologically confirmed Ta and T1 superficial bladder cancer, with or without CIS, treated with TUR.
Participants with NMIBC were categorised as low, intermediate, or high risk in accordance with the EORTC and the European Association of Urology (EAU) classification (Babjuk 2017).
We planned to include studies that evaluated only a subset of relevant participants if separate data were available for the relevant subsets.
Types of interventions
We investigated the following comparisons of experimental versus comparator interventions.
Experimental interventions
-
Intravesically administered BCG plus IFN‐α
We included studies of BCG of any strain, dose, and schedule, and studies of any dose or schedule of IFN‐α. All participants had undergone TUR prior to receiving the intervention.
Comparator interventions
-
Intravesically administered BCG alone
We included studies of BCG of any strain, dose, and schedule. All participants had undergone TUR prior to receiving the intervention.
Comparisons
-
Intravesically administered BCG plus IFN‐α versus intravesically administered BCG alone
-
Intravesically administered BCG alternating with IFN‐α versus intravesically administered BCG alone
Although we did not specify the second comparison in our protocol, we considered it important to include in the review (see Differences between protocol and review).
Concomitant interventions were the same in the experimental and comparator groups to establish fair comparisons.
If we included a study with more than two intervention arms, we only included experimental and comparator intervention groups that met the eligibility criteria of the review.
Types of outcome measures
We did not use the measurement of the outcomes included in this review as an eligibility criterion for considering studies.
If we were unable to derive time‐to‐event information, we attempted to assess a dichotomous outcome (e.g. recurrence, mortality) instead. We considered outcomes measured up to and including six months after randomisation as short term, later than six months up to and including 24 months as mid term, and later than 24 months as long term.
Primary outcomes
-
Time‐to‐recurrence, as measured from the date of randomisation to the date of biopsy or resection, with confirmation of tumour of any grade or stage
-
Time‐to‐progression, as measured from the date of randomisation to the date of biopsy or resection, with confirmation of muscle‐invasive bladder cancer
-
Discontinuation of therapy due to adverse events
Secondary outcomes
-
Disease‐specific survival, as measured from the date of randomisation to the date of death from bladder cancer
-
Time‐to‐death, as measured from the date of randomisation to date of death from any cause
-
Systemic or local adverse events (e.g. local: drug‐induced cystitis, haematuria, urinary frequency; systemic: fever, nausea, vomiting, anorexia, systemic BCG infection, skin rash, general malaise)
-
Disease‐specific quality of life, using validated instruments
Main outcomes for 'Summary of findings' table
We presented 'Summary of findings' tables reporting the following outcomes, listed according to priority.
-
Time‐to‐recurrence or recurrence
-
Time‐to‐progression or progression
-
Discontinuation of therapy due to adverse events
-
Disease‐specific mortality
-
Disease‐specific quality of life
Where we were unable to derive time‐to‐event information for the outcomes time‐to‐recurrence and time‐to‐progression, and assessed the dichotomous outcomes recurrence and progression instead, we included these outcomes in the 'Summary of findings' table. Additionally, where we were unable to obtain information for the outcome disease‐specific survival, and assessed the outcome disease‐specific mortality instead, we included that outcome in the 'Summary of findings' tables (see Differences between protocol and review).
Search methods for identification of studies
We performed comprehensive searches, applying no restrictions on the language of publication or publication status. We re‐ran the searches within three months of the anticipated publication of the full review.
Electronic searches
We searched the following sources from their respective inceptions to the current date on 14 March 2016. The date of last search of all databases was 25 August 2016.
-
Cochrane Central Register of Controlled Trials (CENTRAL) (Issue 8, 2016) (for the search strategy, see Appendix 1)
-
MEDLINE (OvidSP) (1946 to 2016) (Appendix 2)
-
Embase (OvidSP) (1974 to 2016) (Appendix 3)
We also searched the following trials registers on 14 March 2016 and again on 25 August 2016.
-
ClinicalTrials.gov (www.clinicaltrials.gov/; Appendix 4)
-
World Health Organization International Clinical Trials Registry Platform (WHO ICTRP) (apps.who.int/trialsearch/; Appendix 5)
If we detected additional relevant keywords during any of the electronic or other searches, we modified the electronic search strategies to incorporate these terms and documented the changes.
Searching other resources
We attempted to identify other potentially eligible trials or ancillary publications by searching the reference lists of retrieved included studies, reviews, meta‐analyses, and health technology assessment reports. We also contacted study authors of included trials in order to identify any further studies that we may have missed. We contacted intervention manufacturers for ongoing or unpublished trials.
We handsearched abstract proceedings of relevant meetings from the last three years, including: the International Bladder Cancer Network, the American Urological Association, the European Association of Urology, the American Society of Clinical Oncology, and the European Society for Radiotherapy & Oncology.
Data collection and analysis
Selection of studies
We used reference management software to identify and remove potentially duplicate records (EndNote). Two review authors (ARHS, ES) independently scanned the abstracts, titles, or both, of the remaining records retrieved to determine which studies should be assessed further. Two review authors (ARHS, ES) independently investigated all potentially relevant records as full text, mapped records to studies, and classified studies as included, excluded, awaiting classification, or ongoing, in accordance with the criteria for each provided in the Cochrane Handbook for Systematic Reviews of Interventions (Higgins 2011a). We resolved any discrepancies through consensus or recourse to the third review author (NRB). Where resolution of a disagreement was not possible, we designated the study as 'awaiting classification' and contacted the study authors for clarification. We documented reasons for the exclusion of studies that may have reasonably been expected to be included in the review in the Characteristics of excluded studies table. We presented a PRISMA flow diagram showing the process of study selection (Liberati 2009).
Data extraction and management
We developed a dedicated data extraction form that we pilot tested ahead of time.
Two review authors (ARHS, ES) independently abstracted the following information for studies that fulfilled the inclusion criteria.
-
Study design
-
Study dates (if dates were not available, then that was reported as such)
-
Study settings and country
-
Participant inclusion and exclusion criteria
-
Participant details, baseline demographics
-
The number of participants by study and by study arm
-
Details of relevant experimental and comparator interventions, such as dose, route, frequency, and duration
-
Definitions of relevant outcomes, and method and timing of outcome measurement as well as any relevant subgroups
-
Study funding sources
-
Declarations of interest by primary investigators
-
Study characteristics relevant to 'Risk of bias' assessment
We extracted outcome data relevant to this review as needed for calculation of summary statistics and measures of variance. For dichotomous outcomes, we obtained number of events in each group, total number of participants in each group, summary statistic, and 95% confidence intervals (CI). We attempted to obtain log hazard ratios (HR) with standard errors, and HR with 95% CI for time‐to‐event outcomes. For continuous outcomes, we planned to obtain means and standard deviations (SD), or data necessary to calculate this information.
We resolved any disagreements by discussion, or, if required, by consulting the third review author (NRB).
We provided information about potentially relevant ongoing studies, including the trial identifier, in the Characteristics of ongoing studies table.
We attempted to contact authors of included studies to obtain key missing data as needed.
Dealing with duplicate and companion publications
In the event of duplicate publications, companion documents, or multiple reports of a primary study, we maximised yield of information by mapping all publications to unique studies and collating all available data, and used the most complete data set aggregated across all known publications. In case of doubt, we gave priority to the publication reporting the longest follow‐up associated with our primary or secondary outcomes.
Assessment of risk of bias in included studies
Two review authors (ARHS, ES) independently assessed the risk of bias of each included study. We resolved disagreements by consensus, or, if required, by consulting the third review author (NRB).
We assessed risk of bias using the Cochrane tool for assessing risk of bias (Higgins 2011b). We assessed the following 'Risk of bias' domains.
-
Random sequence generation (selection bias)
-
Allocation concealment (selection bias)
-
Blinding of participants and personnel (performance bias)
-
Blinding of outcome assessment (detection bias)
-
Incomplete outcome data (attrition bias)
-
Selective reporting (reporting bias)
-
Other sources of bias
We judged the domains as 'low risk', 'high risk', or 'unclear risk', and evaluated individual bias items as described in the Cochrane Handbook for Systematic Reviews of Interventions (Higgins 2011b).
We presented a 'Risk of bias' summary figure to illustrate these findings.
For performance bias (blinding of participants and personnel) and detection bias (blinding of outcome assessment), we evaluated the risk of bias separately for each outcome, and grouped outcomes according to whether they were measured subjectively or objectively when reporting our findings in the 'Risk of bias' tables. We defined the following endpoints as subjective outcomes: time‐to‐recurrence, time‐to‐progression, discontinuation of therapy due to adverse events, disease‐specific survival, adverse events, and disease‐specific quality of life. We defined the following endpoint as objective: time‐to‐death.
We also assessed attrition bias (incomplete outcome data) on an outcome‐specific basis, and presented the judgement for each outcome separately when reporting our findings in the 'Risk of bias' tables.
We further summarised the risk of bias across domains for each outcome in each included study, as well as across studies and domains for each outcome.
Measures of treatment effect
For dichotomous data, we calculated risk ratios (RR) with 95% CIs. We calculated HR and corresponding 95% CI to assess the intervention effect for time‐to‐event outcomes. We planned to express continuous data as mean differences (MD) with 95% CIs, unless different studies used different measures to assess the same outcome, in which case we planned to express data as standardised mean differences (SMD) with 95% CIs. We analysed the data using Review Manager 5 software (RevMan).
Unit of analysis issues
The unit of analysis was the individual participant. We handled trials with more than two intervention groups for inclusion in the review in accordance with guidance provided in the Cochrane Handbook for Systematic Reviews of Interventions (Higgins 2011c).
Dealing with missing data
We attempted to obtain missing data from study authors to perform intention‐to‐treat analyses; if data were not available, we performed available‐case analyses. If possible, we planned to investigate attrition rates (e.g. dropouts, losses to follow‐up, and withdrawals) and critically appraise issues of missing data. We did not impute missing data.
Assessment of heterogeneity
In the event of excessive heterogeneity unexplained by subgroup analyses, we planned not to report outcome results as the pooled effect estimate in a meta‐analysis but instead to provide a narrative description of the results of each study.
We identified heterogeneity (inconsistency) through visual inspection of the forest plots to assess the amount of overlap of CIs, and the I2 statistic, which quantifies inconsistency across studies, to assess the impact of heterogeneity on the meta‐analysis (Higgins 2002; Higgins 2003). We interpreted I2 as follows.
-
0% to 40%: may not be important
-
30% to 60%: may indicate moderate heterogeneity
-
50% to 90%: may indicate substantial heterogeneity
-
75% to 100%: considerable heterogeneity
The importance of the observed value of I2 depended on magnitude and direction of effects, as well as strength of evidence for heterogeneity (e.g. P value from a Chi2 test) (Deeks 2011).
When we found heterogeneity, we attempted to determine the possible reasons for it by examining individual study and subgroup characteristics (see Subgroup analysis and investigation of heterogeneity).
Assessment of reporting biases
We attempted to obtain study protocols to assess for selective outcome reporting.
In future updates of this review, if we include 10 or more studies investigating a particular outcome, we will use funnel plots to assess small‐study effects. There are several possible explanations for the asymmetry of a funnel plot, including true heterogeneity of effect with respect to trial size, poor methodological design (and hence bias of small trials), and publication bias, therefore we will interpret results carefully.
Data synthesis
We summarised data using a random‐effects model. We interpreted random‐effects meta‐analyses with due consideration of the whole distribution of effects. In addition, we performed statistical analyses according to the statistical guidelines contained in the Cochrane Handbook for Systematic Reviews of Interventions (Higgins 2011a). For dichotomous outcomes, we used the Mantel‐Haenszel method; for continuous outcomes, we planned to use the inverse‐variance method; and for time‐to‐event outcomes, we used the inverse‐variance method. We used Review Manager 5 software to perform analyses (RevMan).
Subgroup analysis and investigation of heterogeneity
We expected the following characteristics to introduce clinical heterogeneity, therefore where sufficient data were available, we planned to perform the following predefined subgroup analyses.
-
Risk (low risk versus intermediate risk versus high risk) according to the EORTC/EAU risk classification system (Babjuk 2017)
-
Dose and schedule of BCG (e.g. standard dose (81 mg weekly for six weeks) versus low dose (27 mg weekly for six weeks) versus very low dose (13.5 mg weekly for six weeks))
-
Dose and schedule of IFN‐α (e.g. higher dose (100 million units (MU) weekly for six weeks) versus lower dose (50 MU weekly for six weeks))
If EAU risk categories were not available, and if sufficient data were available, we planned to perform subgroup analyses based on:
-
number of tumours (one versus more than one)
-
tumour size (< 3 cm versus ≥ 3 cm)
-
tumour stage (Ta versus T1)
-
presence of CIS (absent or present)
-
tumour grade (Grade 1 versus Grades 2 and 3)
-
primary versus recurrent disease
Where there were sufficient studies, we used the test for subgroup differences in Review Manager 5 to compare subgroup analyses (RevMan).
Sensitivity analysis
We planned to perform sensitivity analyses based on risk of bias by excluding studies judged to be at 'high risk' or 'unclear risk' of bias for the particular outcome.
Summary of findings tables
We presented the overall quality of the evidence for each outcome according to the GRADE approach, which takes into account five criteria, related to internal validity (risk of bias, inconsistency, imprecision, publication bias) and external validity (directness of results) (Guyatt 2008; Guyatt 2011; Schünemann 2011). For each comparison, two review authors (ARHS, ES) independently rated the quality of evidence for each outcome as 'high', 'moderate', 'low', or 'very low' using GRADEpro GDT; we resolved any discrepancies by consensus, or, if needed, by consulting the third review author (NRB). For each comparison, we presented a summary of the evidence for the main outcomes in a 'Summary of findings' table (Guyatt 2011; Schünemann 2011). If meta‐analysis was not possible, we planned to present results in a narrative 'Summary of findings' table.
Results
Description of studies
Results of the search
Through database searching of the Cochrane Central Register of Controlled Trials (CENTRAL), MEDLINE (OvidSP), and Embase (OvidSP), we identified 204 records (see Figure 1). We identified a further 22 records through other sources including: one record identified through personal communication; 18 records identified through trial registry searching; and three records identified through handsearching. After removal of duplicates, we screened the titles and abstracts of 149 records, and excluded 130. We screened 19 full‐text articles, and excluded two studies that were non‐randomised trials. We included a total of five trials (17 records) in the review: two records were published in Italian, one record was published in Russian, and the remaining 14 records were published in English. We did not identify any relevant ongoing trials.

Study flow diagram (searched 14 March 2016, updated 25 August 2016).
Included studies
Details of the included studies are presented in the Characteristics of included studies tables. We included five studies (17 records) in the review that randomised a total of 1231 participants. The smallest study randomised 36 participants (Bercovich 1995); the largest study randomised 670 participants (Nepple 2010). All of the included studies were randomised controlled trials. Two study authors responded to requests for full‐text manuscripts (Bercovich 1995; Minich 2009). We contacted authors of all included studies for further information on study methodology and results (see Characteristics of included studies).
Three studies were multi‐institutional (Chiong 2011; Jarvinen 2015; Nepple 2010), and two did not specify (Bercovich 1995; Minich 2009). One study specified its setting as part of the FinnBladder IV study group (Jarvinen 2015), located in Finland, while the other four studies did not specify the study location (though the authors were affiliated to institutions in Italy (Bercovich 1995), Singapore (Chiong 2011), Belarus (Minich 2009), and the United States (Nepple 2010)).
The studies included a variety of participant groups. All studies reported more male participants than female. Mean age of participants overall ranged from 61.9 to 68.4 years and was provided in all but one study (Jarvinen 2015).
All included studies enrolled people with NMIBC (at least stage Ta, T1), with three also specifically including people with CIS (Bercovich 1995; Chiong 2011; Nepple 2010). One study specified no prior intravesical therapy (Chiong 2011); one specified no prior BCG for bladder cancer (Nepple 2010); and one specified that people with previous instillation therapy have at least one of the recurrences at six months after the last instillation (Jarvinen 2015). Prior intravesical therapy was not specified in the remaining studies.
The follow‐up duration varied between the studies. The follow‐up range was reported as 0.2 to 19.8 years in Jarvinen 2015; the median ranged from 38.3 months, in Minich 2009, to 60 months, in Chiong 2011 (and up to 207 months in a subsequent abstract for this study, Esuvaranathan 2014, which has not yet been published as a full manuscript). Mean follow‐up was reported in Bercovich 1995 as 16.72 (SD 8.7) months in the BCG plus IFN‐α group and 24.11 (SD 8.15) months in the BCG alone group. One study did not clearly report duration of follow‐up (Nepple 2010).
In four studies, the experimental group received BCG in combination with IFN‐α (co‐administration) (Bercovich 1995; Chiong 2011; Minich 2009; Nepple 2010), and in one study, alternating monthly injections of BCG and IFN‐α were administered (Jarvinen 2015). In one study, two arms were administered BCG alone at different doses (27 mg and 81 mg) (Chiong 2011); the data for these two arms were pooled in our analyses. Nepple 2010 was a 2x2 factorial study design that considered two comparisons of BCG and IFN‐α versus BCG alone. In one comparison, each of the groups was given recommended daily allowance dose of vitamins, and in the other comparison, each of the groups was given a megadose of oral vitamins. We pooled the data for BCG and IFN‐α and BCG alone in our analyses, regardless of vitamin allocation.
The dose range of BCG and IFN‐α in the experimental groups varied, as did the duration of treatment. Bacillus Calmette‐Guérin dose ranged from 27 mg, in Chiong 2011, to 125 mg, in Minich 2009, given in combination with IFN‐α dose of 6 MU (Minich 2009), 10 MU (Bercovich 1995; Chiong 2011), or 50 MU (Jarvinen 2015; Nepple 2010). Induction courses were comparable across four studies: once weekly for six weeks (Bercovich 1995; Chiong 2011; Minich 2009; Nepple 2010); one study did not administer BCG induction (Jarvinen 2015). Three studies gave maintenance courses: monthly for 10 months in Bercovich 1995, monthly for one year in Jarvinen 2015, and three consecutive weekly instillations at 4, 7, 13, 19, 25, and 37 months if participants remained bladder cancer‐free (with a reduced BCG dose (16.6 mg) in combination with IFN‐α) in Nepple 2010. One study gave a "booster" course of three, once‐per‐week instillations (Chiong 2011).
The dose of BCG in the comparator groups also varied, ranging from 27 mg, in Chiong 2011, to 125 mg, in Minich 2009. In all studies but one (Bercovich 1995), the BCG dose was the same in the experimental and comparator groups. Bercovich 1995 lowered the BCG dose in the experimental group (75 mg BCG dose in the experimental group, 150 mg BCG dose in the comparator group).
There was also variation in the strains of BCG used across the studies: BCG Pasteur F in Bercovich 1995; Connaught strain in Chiong 2011; Russian strain in Minich 2009; and TICE strain in Jarvinen 2015 and Nepple 2010.
Three studies gave co‐interventions: Jarvinen 2015 used perioperative intravesical mitomycin C; Nepple 2010 administered two co‐interventions consisting of a recommended daily allowance dose of oral vitamins and a megadose of oral vitamins; and after intravesical injection in Bercovich 1995, ketoprofen was given at a dose of 200 mg per day for two days associated with norfloxacin or cinoxacin 1 g per day for three days, for the treatment of infections.
Three studies specified funding sources: Chiong 2011: National Medical Research Council Singapore; Jarvinen 2015: Finnish Cancer Foundation and pharmaceutical companies (Teknika, Organon, Pharmacia, Roche, and Schering‐Plough); and Nepple 2010: Schering‐Plough and Mission Pharmacal. Chiong 2011 and Jarvinen 2015 reported no conflicts of interest, and Nepple 2010 declared conflicts of interest for two study authors (related to financial interests or other relationships with pharmaceutical companies, or both). Two studies reported neither funding sources nor conflicts of interest (Bercovich 1995; Minich 2009).
Excluded studies
We excluded two studies; the reasons for exclusion are described in Figure 1 and Characteristics of excluded studies. Joudi 2006 and O'Donnell 2004 were not randomised controlled trials.
Risk of bias in included studies
We assessed the risk of bias of the included studies according to the seven domains outlined in the Cochrane 'Risk of bias' tool (Higgins 2011b). We extracted the methodological details of the studies from the published data. No study protocols were made available for us to further assess the risk of bias. For details on risk of bias, see Figure 2 and Figure 3 and Characteristics of included studies.

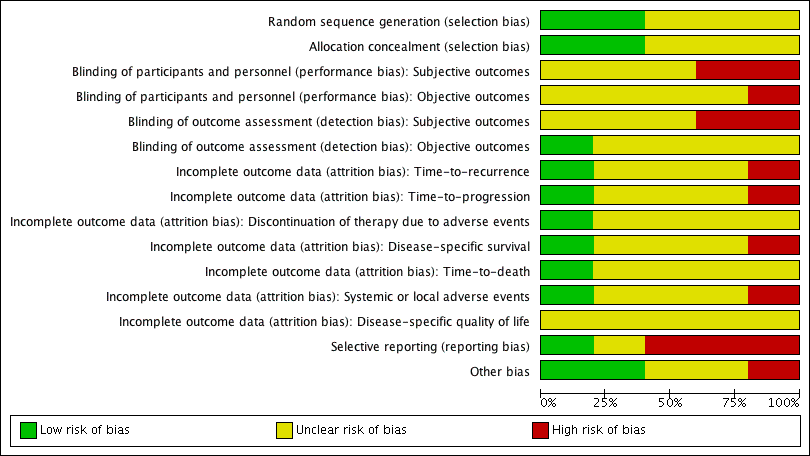
Risk of bias graph: review authors' judgements about each risk of bias item presented as percentages across all included studies.
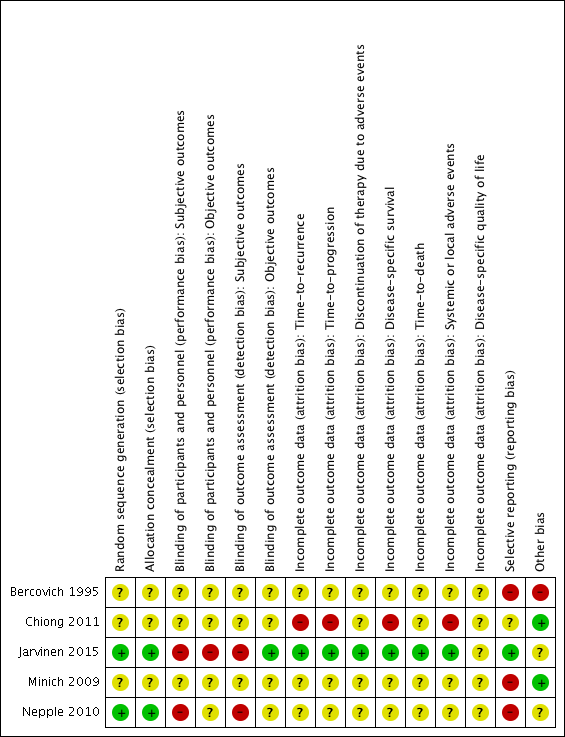
Risk of bias summary: review authors' judgements about each risk of bias item for each included study.
Allocation
Random sequence generation
Two studies reported adequate methods for sequence generation and were judged as at low risk of bias (Jarvinen 2015; Nepple 2010). In the other three included studies (Bercovich 1995; Chiong 2011; Minich 2009), information on sequence generation was not reported or was insufficient to allow a judgement (unclear risk of bias).
Allocation concealment
Two studies provided adequate methods for concealing allocation (low risk of bias) (Jarvinen 2015; Nepple 2010). The other three studies did not report information on allocation concealment (unclear risk of bias) (Bercovich 1995; Chiong 2011; Minich 2009).
Blinding
Blinding of participants and personnel
Subjective outcomes
In two studies, blinding was not detailed (Bercovich 1995; Minich 2009); another study was described as "double blind", however no further details were provided (unclear risk of bias) (Chiong 2011). Participants and providers were not blinded to IFN‐α administration in Nepple 2010. Due to the nature of the interventions (BCG versus BCG alternating with IFN‐α) in Jarvinen 2015, it was considered unlikely that participants and personnel were blinded to the intervention for subjective outcomes. We judged the last two studies to be at high risk of performance bias, as the subjective outcomes reported were considered likely to be influenced by lack of blinding.
Objective outcomes
Jarvinen 2015 was the only trial to report on the one review outcome we judged to be objective (time‐to‐death; reported as "overall survival"). However, due to the absence of blinding, we considered risk of performance bias to be high.
Blinding of outcome assessment
Subjective outcomes
In two studies, blinding was not detailed (Bercovich 1995; Minich 2009); another study was described as "double blind", however no further details were provided (unclear risk of bias) (Chiong 2011). Providers were not blinded to IFN‐α administration in Nepple 2010. Due to the nature of the interventions (BCG versus BCG alternating with IFN‐α) in Jarvinen 2015, it was considered unlikely that personnel were blinded to the intervention for subjective outcomes. We judged the last two studies to be at high risk of detection bias, as the subjective outcomes reported were considered likely to be influenced by lack of blinding.
Objective outcomes
Jarvinen 2015 was the only trial to report on the one review outcome we judged to be objective (time‐to‐death; reported as "overall survival"); we considered risk of detection bias to be low.
Incomplete outcome data
We assessed risk of bias for incomplete outcome data on an outcome‐specific basis (see Characteristics of included studies for further details).
In three studies (Bercovich 1995; Minich 2009; Nepple 2010), where outcome data have been provided, information reported in the published manuscripts was insufficient to determine risk of attrition bias (unclear risk of bias). No information was provided regarding whether there were postrandomisation losses to follow‐up, withdrawals, or study group changes, and if so, how missing data were managed.
We judged Chiong 2011 to be at high risk of attrition bias for reported outcomes, with limited detail regarding postrandomisation losses to follow‐up and withdrawals provided; discrepancies in numbers of "non evaluable" participants across study manuscripts; and a relatively large proportion of participants "not evaluable" in the longer‐term follow‐up (32/140).
We judged Jarvinen 2015 to be at low risk of attrition bias, as while 31 out of 236 participants were excluded postrandomisation, the exclusions and reasons for exclusions were balanced between groups, and the study reported intention‐to‐treat analyses.
Selective reporting
We judged three studies to be at high risk of reporting bias (Bercovich 1995; Minich 2009; Nepple 2010). No mortality or progression outcomes were reported in Bercovich 1995, and adverse events were incompletely reported in text. In Nepple 2010, no mortality or progression outcomes were reported; the secondary outcome (severity of treatment toxicity) was prespecified but not reported; and some results relating to recurrence and progression were reported incompletely in text, for example “Overall 231 of 670 patients (34%) had documented recurrence, including muscle invasive disease in 47 (7%) and discovery of metastatic disease in 7 (1%)” (it was not clear to which groups these participants had been allocated). In Minich 2009, discontinuation of adverse events was reported incompletely in text.
We judged one study to be at unclear risk of reporting bias (Chiong 2011), as to date, data from the long‐term follow‐up have been reported in abstract form only, thus it was not possible to confidently assess selective reporting.
We judged one study to be at low risk of reporting bias (Jarvinen 2015), as all expected outcomes were reported; of note, however, median time‐to‐recurrence "was not attained" in the BCG alone group.
Other potential sources of bias
We judged two studies to be at low risk of other bias (Chiong 2011; Minich 2009), with comparable groups at baseline, and no other obvious sources of bias identified.
We judged one study to be at high risk of other bias due to limited reporting of baseline characteristics and exclusion of an additional study arm (IFN‐α alone) from reporting due to lack of effect on recurrence (Bercovich 1995).
We judged two studies to be at unclear risk of other bias (Jarvinen 2015; Nepple 2010). Both studies reported conflicts of interest, and it was not clear what impact, if any, these had on the conduct of the studies. In Jarvinen 2015, baseline characteristics were largely balanced, however it was unclear whether timing of single immediate chemotherapy instillation differed significantly between groups. Regarding additional treatments during follow‐up, there were more treatments in the BCG alternating with IFN‐α group (27 versus 16), which the authors suggest “may have additionally contributed to decreasing the progression rate and the difference between the groups”. In Nepple 2010, baseline characteristics were not reported by treatment group, thus it was not possible to assess comparability of groups.
Effects of interventions
See: Summary of findings for the main comparison Intravesically administered BCG combined with IFN‐α compared to intravesically administered BCG alone for treating non‐muscle‐invasive bladder cancer; Summary of findings 2 Intravesically administered BCG alternating with IFN‐α compared to intravesically administered BCG alone for treating non‐muscle‐invasive bladder cancer
Intravesically administered BCG plus IFN‐α versus intravesically administered BCG alone
We included four studies in this comparison (Bercovich 1995; Chiong 2011; Minich 2009; Nepple 2010).
See summary of findings Table for the main comparison.
Primary outcomes
Time‐to‐recurrence or recurrence
One study reported on time‐to‐recurrence (presented as disease‐free interval) and found no clear difference overall between the BCG plus IFN‐α and BCG alone groups (hazard ratio (HR) 1.11, 95% confidence interval (CI) 0.86 to 1.43; 1 study; 670 participants) (Analysis 1.1) (Nepple 2010). The duration of follow‐up was not clearly reported in Nepple 2010.
All four studies reported dichotomous data for recurrence (Bercovich 1995; Chiong 2011; Minich 2009; Nepple 2010), and overall no clear difference was observed (average risk ratio (RR) 0.76, 95% CI 0.44 to 1.32; 4 studies; 925 participants; very low‐quality evidence) (Analysis 1.2). We identified substantial heterogeneity (I2 = 74%) for this outcome. In Bercovich 1995, recurrence was reported after a mean follow‐up of 16.72 (SD 8.7) months for the BCG plus IFN‐α group and 24.11 (SD 8.15) months for the BCG alone group; in Chiong 2011, participants were followed for a median of 60 months; in Minich 2009, median duration of follow‐up was 38.3 months; and the duration of follow‐up was not clearly reported in Nepple 2010.
An abstract, Esuvaranathan 2014, has reported later follow‐up data for Chiong 2011, although not in a format that we could include in the meta‐analysis. "The evaluable study cohort (n = 108) was followed up to 207 months, with a total of 35 recurrences ... . Five years after randomisation, the probability of being recurrence‐free were 56.4% and 78.2% in the full‐dose BCG and combination arms respectively (p = 0.037). The mean time to recurrence was 118 months for full‐dose BCG compared to 145 months for the combination arm." We were unable to obtain additional information from the authors.
Progression
Two studies reported dichotomous data for progression (Chiong 2011; Minich 2009), and overall no clear difference between groups was observed (average RR 0.26, 95% CI 0.04 to 1.87; 2 studies; 219 participants) (Analysis 1.3). We identified moderate statistical heterogeneity (I2 = 42%) for this outcome. In Chiong 2011, participants progressed to muscle‐invasive disease at a median of 39 months after therapy, while in Minich 2009, progression was observed between 3.6 and 29.7 months. We judged the quality of the evidence for this outcome to be low.
Discontinuation of therapy due to adverse events
None of the studies reported data on discontinuation of therapy due to adverse events that could be included in a meta‐analysis.
Minich 2009 reported that the frequency of discontinuation of therapy due to adverse events between groups was not statistically different (P = 0.743), with 10 participants not completing the full course of treatment due to adverse events. It was not reported to which group these participants had been assigned.
Secondary outcomes
Disease‐specific mortality
One study reported dichotomous data for disease‐specific mortality (not our prespecified outcome disease‐specific survival) and observed no clear difference between groups (RR 0.38, 95% CI 0.05 to 3.05; 1 study; 99 participants; very low‐quality evidence) (Analysis 1.4) (Chiong 2011). In Chiong 2011, the cancer‐specific deaths were at a median of 60 months.
Time‐to‐death
None of the studies reported on time‐to‐death.
Systemic or local adverse events
Minich 2009 reported on the occurrence of any adverse events during the course of treatment (including disorientation/delirium and macroscopic haematuria), and observed a 67% relative reduction in the risk of any adverse events in the BCG plus IFN‐α group (RR 0.33, 95% CI 0.13 to 0.86; 1 study; 120 participants) (Analysis 1.5).
Nepple 2010 reported on the occurrence specifically of fever or constitutional symptoms, and observed a 122% relative increase in the occurrence of fever (RR 2.22, 95% CI 1.27 to 3.91; 1 study; 670 participants) and a 61% relative increase in the occurrence of constitutional symptoms (RR 1.61, 95% CI 1.10 to 2.36; 1 study; 670 participants) for participants in the BCG plus IFN‐α group compared with the BCG alone group (Analysis 1.5).
Bercovich 1995 and Chiong 2011 reported data regarding adverse events incompletely:
Bercovich 1995 reported: "The results point out that the combination treatment is superior to BCG full dose therapy in terms of side effects." It was noted that all participants in the BCG alone group had strangury and fever, and four had macroscopic haematuria. The incidence of adverse events in the BCG plus IFN‐α group was not reported.
Chiong 2011 reported on autoimmune clinical manifestations (including arthritis, arthralgia, iritis, and uveitis) for eight (6%) of the 140 participants of whom "two received full dose BCG (81 mg), three received one third BCG (27 mg) and three received one‐third BCG (27 mg) with 10 million units of IFN‐α2b". On average, the manifestations were observed following the sixth intravesical instillation (ranging from the third to the ninth). The denominators for the groups were not reported, which prevented inclusion of these data in a meta‐analysis. Further, Chiong 2011 (in Esuvaranathan 2014) reported: "Overall the treatment was well tolerated. Both local and systemic symptoms were significantly decreased in the low‐dose BCG plus IFN‐α2b arm compared to full‐dose BCG during the first 6 instillations but not for the booster instillations." These results have been reported in abstract format only.
Disease‐specific quality of life
None of the studies reported on disease‐specific quality of life.
Subgroup and sensitivity analysis
We planned to conduct subgroup analyses based on risk according to the EORTC/EAU risk classification system, dose and schedule of BCG, and dose and schedule of IFN‐α. Data from the four studies were insufficient to conduct subgroup analyses based on risk classification or BCG dose, with all studies administering a different dose of BCG (induction courses: Chiong 2011: 27 mg BCG; Nepple 2010: 50 mg BCG; Bercovich 1995: 75 mg BCG; Minich 2009: 125 mg BCG; all weekly for six weeks). We were able to conduct a subgroup analysis for recurrence based on dose of IFN‐α, comparing the studies that administered higher‐dose IFN‐α (50 MU) versus lower‐dose IFN‐α (6 to 10 MU) weekly for six weeks during induction. The subgroup interaction test (Chi2 = 6.49, P = 0.01, I2 = 84.6%) indicated a possible difference in effect for recurrence based on dose of IFN‐α. A reduction in recurrence was observed in the studies administering a lower dose of IFN‐α (RR 0.58, 95% CI 0.36 to 0.94; 3 studies; 255 participants), a difference which was not observed in the one study that administered a higher dose (RR 1.14, 95% CI 0.93 to 1.41; 1 study; 670 participants) (Analysis 1.2). However, the results of this analysis should be interpreted with caution, given the small number of studies and participants included in these subgroups.
We were not able to perform other planned subgroup analyses due to the limited number of studies included in this review and paucity of data for primary outcomes. We did not conduct sensitivity analyses, as we judged none of the four studies included in this comparison to be at low risk of bias overall.
Intravesically administered BCG alternating with IFN‐α versus intravesically administered BCG alone
We included one study in this comparison (Jarvinen 2015).
See summary of findings Table 2.
Primary outcomes
Time‐to‐recurrence
In Jarvinen 2015, the time‐to‐recurrence was accelerated in the BCG alternating with IFN‐α group compared with the BCG alone group (HR 2.86, 95% CI 1.98 to 4.13; 1 study; 205 participants; low‐quality evidence) (Analysis 2.1). The study reported the median time‐to‐recurrence as 10 months in the BCG alternating with IFN‐α group, and "was not attained" in the BCG alone group (Jarvinen 2015).
Time‐to‐progression
In Jarvinen 2015, there was no clear difference in time‐to‐progression between the BCG alternating with IFN‐α group and the BCG alone group (HR 2.39, 95% CI 0.92 to 6.21; 1 study; 205 participants; low‐quality evidence) (Analysis 2.2). The study reported no progressions in the BCG alone group after seven years of follow‐up, with two progressions occurring after 10 years in the BCG alternating with IFN‐α group (Jarvinen 2015).
Discontinuation of therapy due to adverse events
In Jarvinen 2015, there was no clear difference in discontinuation of therapy due to adverse events (RR 2.97, 95% CI 0.31 to 28.09; 1 study; 205 participants; low‐quality evidence) (Analysis 2.3). The reasons for discontinuation were: BCG alternating with IFN‐α group: intensive local pain after BCG at six months, nausea at six months, fatigue at eight months; BCG alone group: severe skin reaction after BCG at six months (Jarvinen 2015).
Secondary outcomes
Disease‐specific mortality
Jarvinen 2015 reported on disease‐specific mortality (not our prespecified outcome disease‐specific survival). There was no clear difference in disease‐specific mortality between the BCG alternating with IFN‐α and BCG alone groups (HR 2.74, 95% CI 0.73 to 10.28; 1 study; 205 participants; low‐quality evidence) (Analysis 2.4). The study reported that all deaths from carcinoma occurred during the first 10 years of follow‐up, and most (7/11) during the first five years of follow‐up (Jarvinen 2015).
Overall survival
Jarvinen 2015 reported on overall survival (deaths from any cause) (not our prespecified outcome time‐to‐death), and observed no clear difference between the BCG alternating with IFN‐α and BCG alone groups (HR 1.00, 95% CI 0.68 to 1.47; 1 study; 205 participants) (Analysis 2.5). The study reported the median survival time as 12.9 years in the BCG alternating with IFN‐α group and 12.2 years in the BCG alone group (Jarvinen 2015).
Systemic or local adverse events
In Jarvinen 2015, there was no clear difference between groups for adverse events (RR 1.65, 95% CI 0.41 to 6.73; 1 study; 205 participants) (Analysis 2.6). In the BCG and IFN‐α group, one participant had intensive local pain at six months, one complained of nausea at six months, one complained of fatigue at eight months, and there were two cases of epididymitis; in the BCG alone group, one participant had a severe skin reaction at six months, one frequently had high fever, and one participant had a contracted bladder two months after the end of therapy. The study also reported that there were no systemic BCG infections or treatment‐related deaths (Jarvinen 2015).
Disease‐specific quality of life
Jarvinen 2015 did not report on disease‐specific quality of life.
Subgroup and sensitivity analysis
We performed no subgroup or sensitivity analyses because only one study was included in this comparison and thus no meta‐analyses were conducted.
Discussion
Summary of main results
We included five studies in this review, with a total of 1231 participants randomised across the included studies comparing intravesical BCG with IFN‐α versus intravesical BCG alone for the treatment of NMIBC, contributing data to two comparisons (intravesical BCG plus IFN‐α versus intravesical BCG alone; intravesical BCG alternating with IFN‐α versus intravesical BCG alone).
Intravesical BCG plus IFN‐α versus intravesical BCG alone
We found very low‐quality evidence showing no clear difference in recurrence (across four studies including 925 participants), and low‐quality evidence showing no clear difference in progression (across two studies including 219 participants) with BCG plus IFN‐α versus BCG alone. None of the studies reported on the other primary outcome, discontinuation of therapy due to adverse events. Regarding secondary outcomes, there was very low‐quality evidence (from one study including 99 participants) showing no clear difference in disease‐specific mortality between the BCG plus IFN‐α and BCG alone groups. We observed mixed results for adverse events. None of the included studies reported on the other secondary outcomes, time‐to‐death and disease‐specific quality of life. A subgroup analysis based on IFN‐α dose for the outcome recurrence suggested a possible difference in effect based on dose, in favour of lower‐dose IFN‐α (6 to 10 MU) compared with a higher dose (50 MU); however, given the small numbers of studies (and participants), and their variable methodological quality, this result should be interpreted with caution.
Intravesical BCG alternating with IFN‐α versus intravesical BCG alone
We found low‐quality evidence (from one study including 205 participants) showing a higher probability of recurrence with BCG alternating with IFN‐α compared with BCG alone. However, we also found low‐quality evidence (from one study including 205 participants) showing no clear difference in the probability of progression or the risk of discontinuation of therapy due to adverse events between BCG alternating with IFN‐α compared with BCG alone. Regarding secondary outcomes, there was low‐quality evidence showing no clear difference in disease‐specific mortality between BCG alternating with IFN‐α and BCG alone, and, similarly, no clear differences between groups for overall survival and systemic or local adverse events. The included study did not report on disease‐specific quality of life.
Overall completeness and applicability of evidence
The studies included in this review examined clinically important populations seen in routine clinical practice. Regarding the primary outcomes, only two studies reported on time‐to‐recurrence (though three additional trials reported on the dichotomous outcome recurrence); one on time‐to‐progression (though two additional trials reported on the dichotomous outcome progression); and one on discontinuation of therapy due to adverse events. Reporting of the secondary outcomes for this review also varied. Although none of the included studies reported on the secondary outcome disease‐specific survival, two studies reported on disease‐specific mortality. Similarly, none of the studies reported on time‐to‐death, though one study reported on overall survival. All of the studies reported information regarding adverse events (though some reported this information incompletely). None of the included studies reported on disease‐specific quality of life.
The participants and assessed interventions conformed to the review question, though there are several points to be made with regard to the applicability of the evidence. We performed two comparisons, as it was judged that BCG co‐administered with IFN‐α was a different intervention to BCG alternating with IFN‐α. Two included studies evaluated only BCG naive participants (Chiong 2011; Nepple 2010), and three studies had co‐interventions (Bercovich 1995; Jarvinen 2015; Nepple 2010); the effects of these factors on the results of this review are not clear. There was notable variation in the doses of BCG and IFN‐α in the included studies, and variation in timing and duration of the interventions (three included studies included both induction and maintenance dosing schedules (Bercovich 1995; Chiong 2011; Nepple 2010); one provided only an induction dosing schedule (Minich 2009); and one provided only a maintenance dose schedule (Jarvinen 2015)). The frequency of administration of the intervention in the maintenance dose varied from weekly for three weeks, in Chiong 2011, to monthly for 10 months, in Bercovich 1995. Such variation in doses and schedules may affect the applicability of the results of this review. While we were able to perform a subgroup analysis for recurrence based on IFN‐α, we were unable to perform a similar analysis for different doses of BCG, with each study administering a different BCG dose. Each of the studies used a different BCG strain, potentially affecting the applicability of the results of the review based on the availability of a particular BCG strain. Some of the studies provided limited information regarding pathological characteristics (such as stage, grade, primary or recurrent lesions, unifocal or multifocal lesions), consequently we were also unable to conduct subgroup analyses based on risk categories.
Quality of the evidence
We assessed the quality of evidence using the GRADE approach for prespecified outcomes analysed in the two main comparisons. We found that for the first comparison (BCG plus IFN‐α versus BCG alone), the evidence was of low (progression) or very low quality (recurrence and disease‐specific mortality). These judgements were based on design limitations and imprecision of effect estimates, for all included outcomes. For the second comparison (BCG alternating with IFN‐α versus BCG alone), the evidence was of low quality (time‐to‐recurrence, time‐to‐progression, discontinuation of therapy due to adverse events, and disease‐specific mortality). These judgements were based on design limitations in the included studies and imprecision. The 'Risk of bias' figures (Figure 2; Figure 3) indicate that many aspects of quality were unclear for several of the included studies, often due to a lack of reporting of methodology.
Potential biases in the review process
We followed the recommendations outlined in the Cochrane Handbook for Systematic Reviews of Interventions to minimise biases (Higgins 2011a). In order to reduce the potential for publication bias, we performed an extensive literature search without language or publication status restrictions, and additionally searched trial registries for unpublished, planned, or ongoing studies. It is possible that additional studies may have been conducted but not yet published, or that additional studies have been published but not yet identified. Should any such studies be identified, we will include them in further updates of this review. At least two review authors independently assessed studies for inclusion and performed data extraction and assessment of risk of bias for all of the included studies.
We considered only randomised controlled trials for inclusion in this review. Although some recent evidence has suggested that on average, there may not be large differences in the risk estimates of adverse events from randomised controlled trials and observational studies (Golder 2011), it is widely recognised that for the comprehensive assessment of rare or serious adverse events, or both, and the assessment of adverse events outside of the randomised trial setting (where participants are 'highly selected'), it is often necessary to consider studies of other designs (such as controlled clinical trials, cohort studies, case‐control studies, and even case series and case reports) (Loke 2011), which was beyond the scope of this review.
Agreements and disagreements with other studies or reviews
We have not identified any other systematic reviews specifically comparing BCG with IFN‐α versus BCG alone for NMIBC. Two recently published reviews of diagnosis and treatment of NMIBC included comparisons of BCG with IFN‐α versus BCG alone (Chou 2015; Zhu 2013). The comparison in Zhu 2013 focused only on the outcome of recurrence‐free survival and included two studies: one randomised trial that we included in our review, Nepple 2010, and a case series, Bazarbashi 2000. Similar to the findings in our review, Zhu 2013 reported no difference for recurrence between those treated with BCG plus IFN‐α and those treated with BCG alone. Another recently published review undertook two comparisons similar to our review (BCG plus IFN‐α versus BCG alone and BCG alternating with IFN‐α versus BCG alone) and had similar findings (Chou 2015). One study was included in the first comparison of BCG plus IFN‐α versus BCG alone (Nepple 2010), and one study for the second comparison (Kaasinen 2000), which reported the earlier follow‐up data for the trial included in our review (Jarvinen 2015). The findings of Chou 2015 were similar to those in our review: BCG alternating with IFN‐α had a higher risk of recurrence when compared with BCG alone, and no difference was observed in the risk of recurrence or progression between BCG plus IFN‐α and BCG alone.

Study flow diagram (searched 14 March 2016, updated 25 August 2016).
Risk of bias graph: review authors' judgements about each risk of bias item presented as percentages across all included studies.

Risk of bias summary: review authors' judgements about each risk of bias item for each included study.

Comparison 1 Intravesically administered BCG combined with IFN‐α versus intravesically administered BCG alone, Outcome 1 Time‐to‐recurrence.

Comparison 1 Intravesically administered BCG combined with IFN‐α versus intravesically administered BCG alone, Outcome 2 Recurrence.
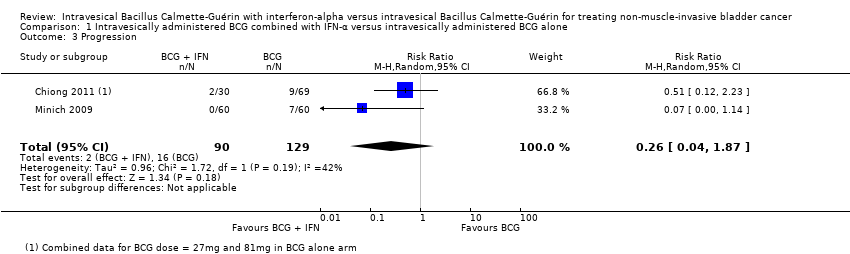
Comparison 1 Intravesically administered BCG combined with IFN‐α versus intravesically administered BCG alone, Outcome 3 Progression.
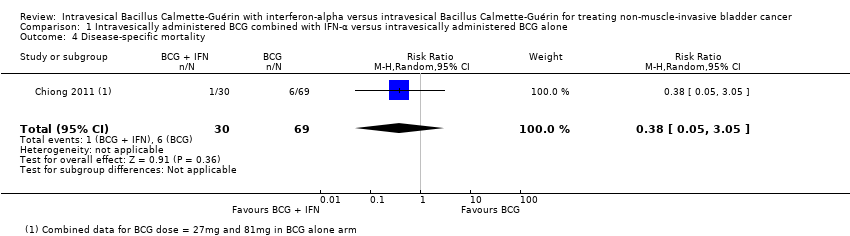
Comparison 1 Intravesically administered BCG combined with IFN‐α versus intravesically administered BCG alone, Outcome 4 Disease‐specific mortality.
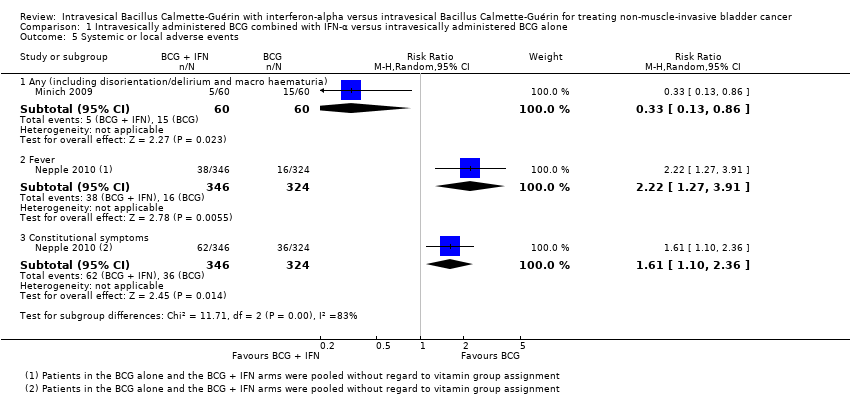
Comparison 1 Intravesically administered BCG combined with IFN‐α versus intravesically administered BCG alone, Outcome 5 Systemic or local adverse events.

Comparison 2 Intravesically administered BCG alternating with IFN‐α versus intravesically administered BCG alone, Outcome 1 Time‐to‐recurrence.
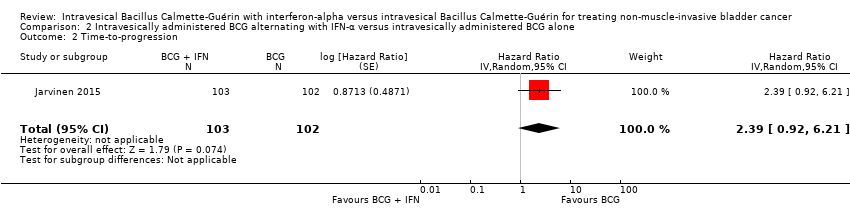
Comparison 2 Intravesically administered BCG alternating with IFN‐α versus intravesically administered BCG alone, Outcome 2 Time‐to‐progression.
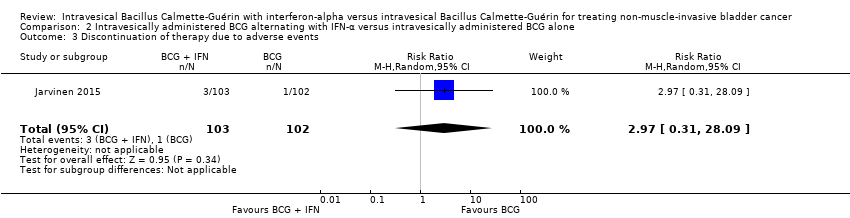
Comparison 2 Intravesically administered BCG alternating with IFN‐α versus intravesically administered BCG alone, Outcome 3 Discontinuation of therapy due to adverse events.

Comparison 2 Intravesically administered BCG alternating with IFN‐α versus intravesically administered BCG alone, Outcome 4 Disease‐specific mortality.

Comparison 2 Intravesically administered BCG alternating with IFN‐α versus intravesically administered BCG alone, Outcome 5 Overall survival.
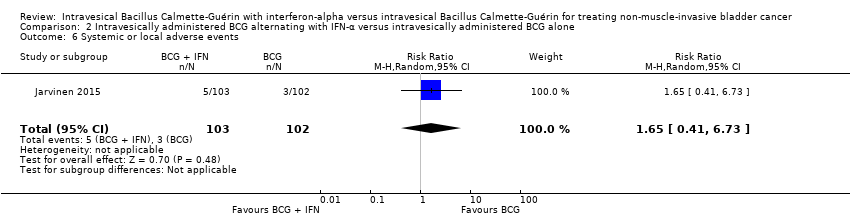
Comparison 2 Intravesically administered BCG alternating with IFN‐α versus intravesically administered BCG alone, Outcome 6 Systemic or local adverse events.
| Intravesically administered BCG combined with IFN‐α compared to intravesically administered BCG alone for treating non‐muscle‐invasive bladder cancer Patient or population: patients with non‐muscle invasive bladder cancer Intervention: BCG combined with IFN‐α Comparison: BCG alone | |||||
| Outcomes | № of participants | Quality of the evidence | Relative effect | Anticipated absolute effects* (95% CI) | |
| Risk with intravesically administered BCG alone | Risk difference with intravesically administered BCG combined with IFN‐α | ||||
| Recurrence Follow‐up: median 38.3 to 60 months | 925 | ⊕⊕⊝⊝ | RR 0.76 | Study population | |
| 342 per 1000 | 82 fewer per 1000 | ||||
| Progression Follow‐up: median 38.3 to 60 months | 219 | ⊕⊕⊝⊝ | RR 0.26 | Study population | |
| 124 per 1000 | 92 fewer per 1000 | ||||
| Discontinuation of therapy due to adverse events ‐ not measured | ‐ | ‐ | ‐ | ‐ | ‐ |
| Disease‐specific mortality Follow‐up: median 60 months | 99 | ⊕⊝⊝⊝ | RR 0.38 | Study population | |
| 87 per 1000 | 54 fewer per 1000 | ||||
| Disease‐specific quality of life ‐ not measured | ‐ | ‐ | ‐ | ‐ | ‐ |
| *The risk in the intervention group (and its 95% confidence interval) is based on the assumed risk in the comparison group and the relative effect of the intervention (and its 95% CI). BCG: Bacillus Calmette‐Guérin; CI: confidence interval; IFN‐α: interferon‐alpha; RCT: randomised controlled trial; RR: risk ratio | |||||
| GRADE Working Group grades of evidence | |||||
| 1Downgraded for study limitations (‐1): high risk of bias: 'blinding of participants and personnel' (Nepple 2010); 'blinding of outcome assessment' (Nepple 2010); 'selective reporting' (Bercovich 1995; Minich 2009; Nepple 2010); 'other bias' (Bercovich 1995). | |||||
| Intravesically administered BCG alternating with IFN‐α compared to intravesically administered BCG alone for treating non‐muscle‐invasive bladder cancer Patient or population: patients with non‐muscle invasive bladder cancer Intervention: BCG alternating with IFN‐α Comparison: BCG alone | |||||
| Outcomes | № of participants | Quality of the evidence | Relative effect | Anticipated absolute effects* (95% CI) | |
| Risk with intravesically administered BCG alone | Risk difference with intravesically administered BCG alternating with IFN‐α | ||||
| Time‐to‐recurrence Follow‐up: median 8.6 to 10.3 years | 205 | ⊕⊕⊕⊝ | HR 2.86 | Study population | |
| 431 per 1000 | 370 more per 1000 | ||||
| Time‐to‐progression Follow‐up: median 8.6 to 10.3 years | 205 | ⊕⊕⊝⊝ | HR 2.39 | Study population | |
| 59 per 1000 | 76 more per 1000 | ||||
| Discontinuation of therapy due to adverse events Follow‐up: median 8.6 to 10.3 years | 205 | ⊕⊕⊝⊝ | RR 2.97 | Study population | |
| 10 per 1000 | 19 more per 1000 | ||||
| Disease‐specific mortality Follow‐up: median 8.6 to 10.3 years | 205 | ⊕⊕⊝⊝ | HR 2.74 | Study population | |
| 29 per 1000 | 49 more per 1000 | ||||
| Disease‐specific quality of life ‐ not measured | ‐ | ‐ | ‐ | ‐ | ‐ |
| *The risk in the intervention group (and its 95% confidence interval) is based on the assumed risk in the comparison group and the relative effect of the intervention (and its 95% CI). | |||||
| GRADE Working Group grades of evidence | |||||
| 1Downgraded for study limitations (‐1): high risk of bias: 'blinding of participants and personnel', 'blinding of outcome assessment' (Jarvinen 2015). | |||||
| Outcome or subgroup title | No. of studies | No. of participants | Statistical method | Effect size |
| 1 Time‐to‐recurrence Show forest plot | 1 | 670 | Hazard Ratio (Random, 95% CI) | 1.11 [0.86, 1.43] |
| 2 Recurrence Show forest plot | 4 | 925 | Risk Ratio (M‐H, Random, 95% CI) | 0.76 [0.44, 1.32] |
| 2.1 IFN‐α higher dose (50 MU) weekly for 6 weeks | 1 | 670 | Risk Ratio (M‐H, Random, 95% CI) | 1.14 [0.93, 1.41] |
| 2.2 IFN‐α lower dose (6 to 10 MU) weekly for 6 weeks | 3 | 255 | Risk Ratio (M‐H, Random, 95% CI) | 0.58 [0.36, 0.94] |
| 3 Progression Show forest plot | 2 | 219 | Risk Ratio (M‐H, Random, 95% CI) | 0.26 [0.04, 1.87] |
| 4 Disease‐specific mortality Show forest plot | 1 | 99 | Risk Ratio (M‐H, Random, 95% CI) | 0.38 [0.05, 3.05] |
| 5 Systemic or local adverse events Show forest plot | 2 | Risk Ratio (M‐H, Random, 95% CI) | Subtotals only | |
| 5.1 Any (including disorientation/delirium and macro haematuria) | 1 | 120 | Risk Ratio (M‐H, Random, 95% CI) | 0.33 [0.13, 0.86] |
| 5.2 Fever | 1 | 670 | Risk Ratio (M‐H, Random, 95% CI) | 2.22 [1.27, 3.91] |
| 5.3 Constitutional symptoms | 1 | 670 | Risk Ratio (M‐H, Random, 95% CI) | 1.61 [1.10, 2.36] |
| Outcome or subgroup title | No. of studies | No. of participants | Statistical method | Effect size |
| 1 Time‐to‐recurrence Show forest plot | 1 | 205 | Hazard Ratio (Random, 95% CI) | 2.86 [1.98, 4.13] |
| 2 Time‐to‐progression Show forest plot | 1 | 205 | Hazard Ratio (Random, 95% CI) | 2.39 [0.92, 6.21] |
| 3 Discontinuation of therapy due to adverse events Show forest plot | 1 | 205 | Risk Ratio (M‐H, Random, 95% CI) | 2.97 [0.31, 28.09] |
| 4 Disease‐specific mortality Show forest plot | 1 | 205 | Hazard Ratio (Random, 95% CI) | 2.74 [0.73, 10.28] |
| 5 Overall survival Show forest plot | 1 | 205 | Hazard Ratio (Random, 95% CI) | 1.0 [0.68, 1.47] |
| 6 Systemic or local adverse events Show forest plot | 1 | 205 | Risk Ratio (M‐H, Random, 95% CI) | 1.65 [0.41, 6.73] |