Bacilo de Calmette‐Guérin intravesical con interferón‐alfa versus bacilo de Calmette‐Guérin para el tratamiento del cáncer de vejiga sin invasión de la muscular
Appendices
Appendix 1. CENTRAL search strategy
-
MeSH descriptor Urinary Bladder Neoplasms explode all trees
-
(bladder* NEAR/3 (cancer* or carcinoma* or neoplas* or tumo?r* or tum?r*)):ti,ab,kw
-
MeSH descriptor Carcinoma, Transitional Cell explode all trees
-
(tcc or transitional cell):ti,ab,kw
-
MeSH descriptor Ureteral Neoplasms explode all trees
-
MeSH descriptor Urethral Neoplasms explode all trees
-
((bladder* or urethra* or ureter* or urin* or urotheli* or renal pelvis or calice*) NEAR/3 (cancer* or carcinoma* or adenoma* or adenocarcinoma* or squamous* or neoplas* or tumo?r* or tum?r* or malignan*)):ti,ab,kw
-
(#1 OR #2 OR #3 OR #4 OR #5 OR #6 OR #7)
-
MeSH descriptor BCG vaccine explode all trees
-
bacillus calmette guerin:ti,ab,kw
-
bcg:ti,ab,kw
-
(#9 OR #10 OR #11)
-
MeSH descriptor Interferons explode all trees
-
((interferon*) or (ifn alpha) or (ifn alfa)):ti,ab,kw
-
(#13 OR #14)
-
(#8 AND #12 AND #15)
Appendix 2. MEDLINE (OvidSP) search strategy
-
exp urinary bladder neoplasms/
-
(bladder$ adj3 (cancer$ or carcinoma$ or neoplas$ or tumo?r$ or tum?r$)).mp.
-
exp carcinoma, transitional cell/
-
(tcc or transitional cell).mp.
-
exp ureteral neoplasms/
-
urethral neoplasms/
-
((bladder$ or urethra$ or ureter$ or urin$ or urotheli$ or renal pelvis or calice$) adj3 (cancer$ or carcinoma$ or adenoma$ or adenocarcinoma$ or squamous$ or neoplas$ or tumo?r$ or tum?r$ or malignan$)).tw.
-
or/1‐7
-
exp BCG vaccine/
-
bacillus calmette guerin.tw
-
bcg.tw
-
or/9‐11
-
exp Interferons/
-
interferon$.mp.
-
(interferon alpha or interferon alfa).mp.
-
or/13‐15
-
randomized controlled trial.pt.
-
controlled clinical trial.pt.
-
randomized.ab.
-
placebo.ab.
-
clinical trials as topic.sh.
-
randomly.ab.
-
trial.ti.
-
or/17‐23
-
exp animals/ not humans.sh.
-
24 not 25
-
8 and 12 and 16 and 26
Appendix 3. Embase (OvidSP) search strategy
-
exp bladder tumor/
-
(bladder$ adj3 (cancer$ or carcinoma$ or neoplas$ or tumo?r$ or tum?r$)).mp.
-
exp transitional cell carcinoma/
-
(tcc or transitional cell).mp.
-
exp ureter tumor/
-
exp urethra tumor/
-
((bladder$ or urethra$ or ureter$ or urin$ or urotheli$ or renal pelvis or calice$) adj3 (cancer$ or carcinoma$ or adenoma$ or adenocarcinoma$ or squamous$ or neoplas$ or tumo?r$ or tum?r$ or malignan$)).tw.
-
or/1‐7
-
exp BCG vaccine/
-
bacillus calmette guerin.ti,ab
-
bcg.ti,ab
-
or/9‐11
-
exp INTERFERON
-
interferon$.mp.
-
(interferon alpha or interferon alfa).mp.
-
or/13‐15
-
crossover procedure/
-
double‐blind procedure/
-
randomized controlled trial/
-
single‐blind procedure/
-
(random$ or factorial$ or crossover$ or cross over$ or placebo$ or assign$ or allocat$ or volunteer$).mp.
-
((doubl$ or singl$) adj blind$).mp.
-
or/17‐22
-
8 and 12 and 16 and 23
Appendix 4. ClinicalTrials.gov search strategy
Basic search:
(bladder OR urethra OR ureter OR urinary OR urothelial OR urologic OR renal pelvis) AND (bacillus calmette guerin OR bcg) AND (interferon OR ifn)
Appendix 5. WHO ICTRP search strategy
Simple search with each of these lines searched and assessed separately:
Bladder AND bcg AND ifn
Bladder AND bcg AND interferon
Bladder AND bacillus calmette guerin AND ifn
Bladder AND bacillus calmette guerin AND interferon

Study flow diagram (searched 14 March 2016, updated 25 August 2016).
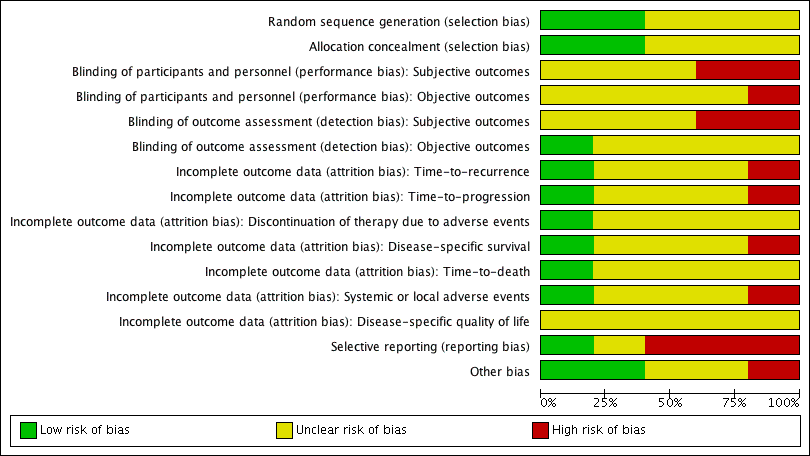
Risk of bias graph: review authors' judgements about each risk of bias item presented as percentages across all included studies.
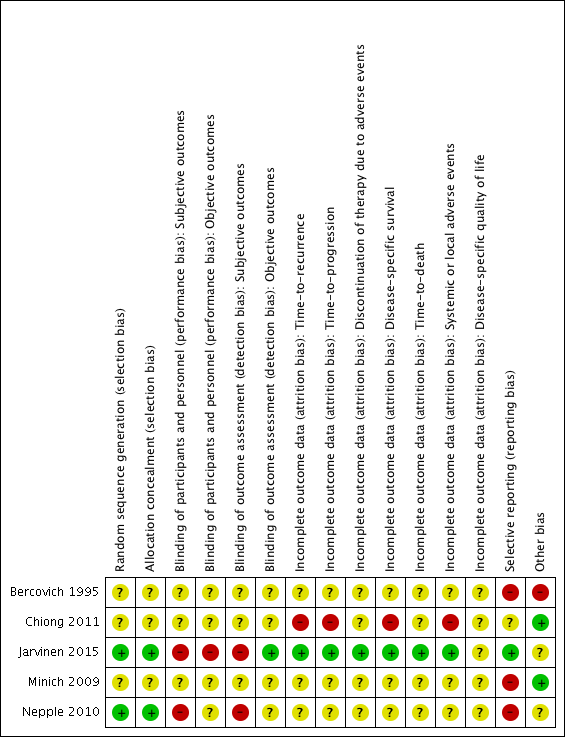
Risk of bias summary: review authors' judgements about each risk of bias item for each included study.

Comparison 1 Intravesically administered BCG combined with IFN‐α versus intravesically administered BCG alone, Outcome 1 Time‐to‐recurrence.

Comparison 1 Intravesically administered BCG combined with IFN‐α versus intravesically administered BCG alone, Outcome 2 Recurrence.
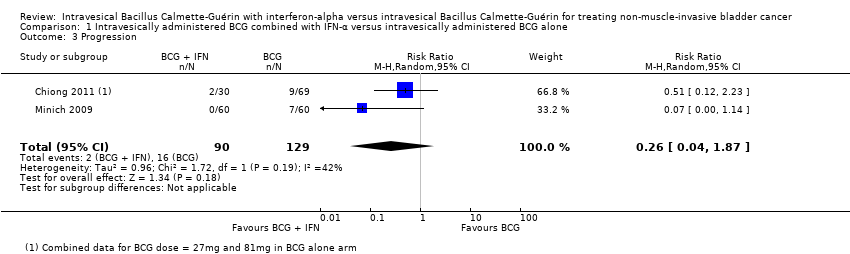
Comparison 1 Intravesically administered BCG combined with IFN‐α versus intravesically administered BCG alone, Outcome 3 Progression.
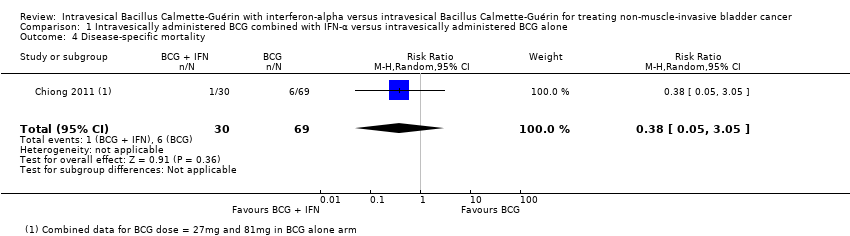
Comparison 1 Intravesically administered BCG combined with IFN‐α versus intravesically administered BCG alone, Outcome 4 Disease‐specific mortality.
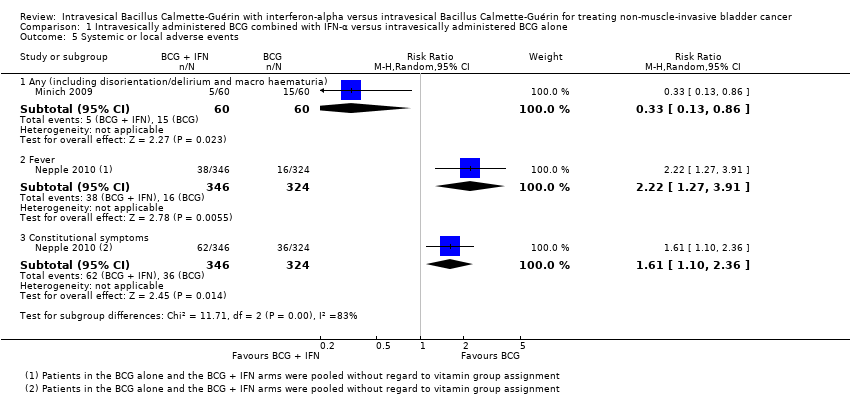
Comparison 1 Intravesically administered BCG combined with IFN‐α versus intravesically administered BCG alone, Outcome 5 Systemic or local adverse events.

Comparison 2 Intravesically administered BCG alternating with IFN‐α versus intravesically administered BCG alone, Outcome 1 Time‐to‐recurrence.
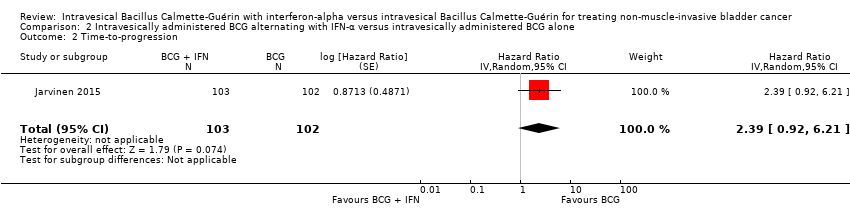
Comparison 2 Intravesically administered BCG alternating with IFN‐α versus intravesically administered BCG alone, Outcome 2 Time‐to‐progression.
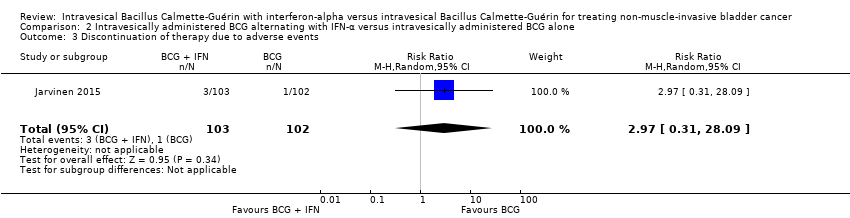
Comparison 2 Intravesically administered BCG alternating with IFN‐α versus intravesically administered BCG alone, Outcome 3 Discontinuation of therapy due to adverse events.

Comparison 2 Intravesically administered BCG alternating with IFN‐α versus intravesically administered BCG alone, Outcome 4 Disease‐specific mortality.

Comparison 2 Intravesically administered BCG alternating with IFN‐α versus intravesically administered BCG alone, Outcome 5 Overall survival.
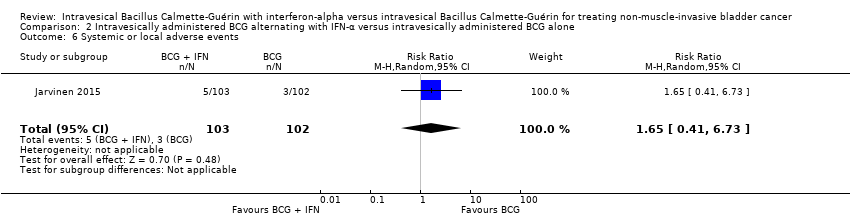
Comparison 2 Intravesically administered BCG alternating with IFN‐α versus intravesically administered BCG alone, Outcome 6 Systemic or local adverse events.
| Intravesically administered BCG combined with IFN‐α compared to intravesically administered BCG alone for treating non‐muscle‐invasive bladder cancer Patient or population: patients with non‐muscle invasive bladder cancer Intervention: BCG combined with IFN‐α Comparison: BCG alone | |||||
| Outcomes | № of participants | Quality of the evidence | Relative effect | Anticipated absolute effects* (95% CI) | |
| Risk with intravesically administered BCG alone | Risk difference with intravesically administered BCG combined with IFN‐α | ||||
| Recurrence Follow‐up: median 38.3 to 60 months | 925 | ⊕⊕⊝⊝ | RR 0.76 | Study population | |
| 342 per 1000 | 82 fewer per 1000 | ||||
| Progression Follow‐up: median 38.3 to 60 months | 219 | ⊕⊕⊝⊝ | RR 0.26 | Study population | |
| 124 per 1000 | 92 fewer per 1000 | ||||
| Discontinuation of therapy due to adverse events ‐ not measured | ‐ | ‐ | ‐ | ‐ | ‐ |
| Disease‐specific mortality Follow‐up: median 60 months | 99 | ⊕⊝⊝⊝ | RR 0.38 | Study population | |
| 87 per 1000 | 54 fewer per 1000 | ||||
| Disease‐specific quality of life ‐ not measured | ‐ | ‐ | ‐ | ‐ | ‐ |
| *The risk in the intervention group (and its 95% confidence interval) is based on the assumed risk in the comparison group and the relative effect of the intervention (and its 95% CI). BCG: Bacillus Calmette‐Guérin; CI: confidence interval; IFN‐α: interferon‐alpha; RCT: randomised controlled trial; RR: risk ratio | |||||
| GRADE Working Group grades of evidence | |||||
| 1Downgraded for study limitations (‐1): high risk of bias: 'blinding of participants and personnel' (Nepple 2010); 'blinding of outcome assessment' (Nepple 2010); 'selective reporting' (Bercovich 1995; Minich 2009; Nepple 2010); 'other bias' (Bercovich 1995). | |||||
| Intravesically administered BCG alternating with IFN‐α compared to intravesically administered BCG alone for treating non‐muscle‐invasive bladder cancer Patient or population: patients with non‐muscle invasive bladder cancer Intervention: BCG alternating with IFN‐α Comparison: BCG alone | |||||
| Outcomes | № of participants | Quality of the evidence | Relative effect | Anticipated absolute effects* (95% CI) | |
| Risk with intravesically administered BCG alone | Risk difference with intravesically administered BCG alternating with IFN‐α | ||||
| Time‐to‐recurrence Follow‐up: median 8.6 to 10.3 years | 205 | ⊕⊕⊕⊝ | HR 2.86 | Study population | |
| 431 per 1000 | 370 more per 1000 | ||||
| Time‐to‐progression Follow‐up: median 8.6 to 10.3 years | 205 | ⊕⊕⊝⊝ | HR 2.39 | Study population | |
| 59 per 1000 | 76 more per 1000 | ||||
| Discontinuation of therapy due to adverse events Follow‐up: median 8.6 to 10.3 years | 205 | ⊕⊕⊝⊝ | RR 2.97 | Study population | |
| 10 per 1000 | 19 more per 1000 | ||||
| Disease‐specific mortality Follow‐up: median 8.6 to 10.3 years | 205 | ⊕⊕⊝⊝ | HR 2.74 | Study population | |
| 29 per 1000 | 49 more per 1000 | ||||
| Disease‐specific quality of life ‐ not measured | ‐ | ‐ | ‐ | ‐ | ‐ |
| *The risk in the intervention group (and its 95% confidence interval) is based on the assumed risk in the comparison group and the relative effect of the intervention (and its 95% CI). | |||||
| GRADE Working Group grades of evidence | |||||
| 1Downgraded for study limitations (‐1): high risk of bias: 'blinding of participants and personnel', 'blinding of outcome assessment' (Jarvinen 2015). | |||||
| Outcome or subgroup title | No. of studies | No. of participants | Statistical method | Effect size |
| 1 Time‐to‐recurrence Show forest plot | 1 | 670 | Hazard Ratio (Random, 95% CI) | 1.11 [0.86, 1.43] |
| 2 Recurrence Show forest plot | 4 | 925 | Risk Ratio (M‐H, Random, 95% CI) | 0.76 [0.44, 1.32] |
| 2.1 IFN‐α higher dose (50 MU) weekly for 6 weeks | 1 | 670 | Risk Ratio (M‐H, Random, 95% CI) | 1.14 [0.93, 1.41] |
| 2.2 IFN‐α lower dose (6 to 10 MU) weekly for 6 weeks | 3 | 255 | Risk Ratio (M‐H, Random, 95% CI) | 0.58 [0.36, 0.94] |
| 3 Progression Show forest plot | 2 | 219 | Risk Ratio (M‐H, Random, 95% CI) | 0.26 [0.04, 1.87] |
| 4 Disease‐specific mortality Show forest plot | 1 | 99 | Risk Ratio (M‐H, Random, 95% CI) | 0.38 [0.05, 3.05] |
| 5 Systemic or local adverse events Show forest plot | 2 | Risk Ratio (M‐H, Random, 95% CI) | Subtotals only | |
| 5.1 Any (including disorientation/delirium and macro haematuria) | 1 | 120 | Risk Ratio (M‐H, Random, 95% CI) | 0.33 [0.13, 0.86] |
| 5.2 Fever | 1 | 670 | Risk Ratio (M‐H, Random, 95% CI) | 2.22 [1.27, 3.91] |
| 5.3 Constitutional symptoms | 1 | 670 | Risk Ratio (M‐H, Random, 95% CI) | 1.61 [1.10, 2.36] |
| Outcome or subgroup title | No. of studies | No. of participants | Statistical method | Effect size |
| 1 Time‐to‐recurrence Show forest plot | 1 | 205 | Hazard Ratio (Random, 95% CI) | 2.86 [1.98, 4.13] |
| 2 Time‐to‐progression Show forest plot | 1 | 205 | Hazard Ratio (Random, 95% CI) | 2.39 [0.92, 6.21] |
| 3 Discontinuation of therapy due to adverse events Show forest plot | 1 | 205 | Risk Ratio (M‐H, Random, 95% CI) | 2.97 [0.31, 28.09] |
| 4 Disease‐specific mortality Show forest plot | 1 | 205 | Hazard Ratio (Random, 95% CI) | 2.74 [0.73, 10.28] |
| 5 Overall survival Show forest plot | 1 | 205 | Hazard Ratio (Random, 95% CI) | 1.0 [0.68, 1.47] |
| 6 Systemic or local adverse events Show forest plot | 1 | 205 | Risk Ratio (M‐H, Random, 95% CI) | 1.65 [0.41, 6.73] |