Intervenciones para aumentar la asistencia a las pruebas de detección de retinopatía diabética
Resumen
Antecedentes
La asistencia a las pruebas de detección es invariablemente inferior a los niveles recomendados, a pesar de las pruebas a favor de la eficacia de las pruebas de detección de retinopatía diabética (DRS, por sus siglas en inglés) para reducir el riesgo de pérdida de la visión.
Objetivos
El objetivo principal de la revisión fue evaluar la eficacia de las intervenciones de mejoramiento de la calidad (QI, por sus siglas en inglés) que intentan aumentar la asistencia a las DRS en pacientes con diabetes tipo 1 y tipo 2.
Los objectivos secundarios fueron:
Utilizar taxonomías validadas de estrategias de intervención de QI y técnicas de modificación del comportamiento (BCT) para codificar la descripción de las intervenciones en los estudios incluidos y determinar si las intervenciones que incluyen ciertas estrategias de QI o componentes BCT son más eficaces para aumentar la asistencia a las pruebas de detección;
Explorar la heterogeneidad en el tamaño del efecto dentro de los estudios y entre ellos, para identificar los posibles factores explicativos de la variabilidad en el tamaño del efecto;
Explorar los efectos diferenciales en los subgrupos para proporcionar información sobre cómo se podría mejorar la equidad en la asistencia a las pruebas de detección;
Evaluar y resumir críticamente la evidencia actual sobre el uso de los recursos, los costos y la relación costo‐eficacia.
Métodos de búsqueda
Se realizaron búsquedas en la Biblioteca Cochrane, MEDLINE, Embase, PsycINFO, Web of Science, ProQuest Family Health, OpenGrey, el ISRCTN, ClinicalTrials.gov y el ICTRP de la OMS para identificar los ensayos controlados aleatorios (ECA) diseñados para mejorar la asistencia a las DRS, o que evaluaron las estrategias generales de mejoramiento de la calidad (QI) en el tratamiento de la diabetes e informaron el efecto de la intervención en la asistencia a las DRS. Se realizaron búsquedas en los recursos el 13 de febrero de 2017. No se aplicó ninguna restricción de fecha o idioma en las búsquedas.
Criterios de selección
Se incluyeron los ECA que compararon cualquier intervención de QI con la atención habitual o una intervención más intensiva (escalonada) frente a una intervención menos intensiva.
Obtención y análisis de los datos
Se codificó la estrategia de QI utilizando una modificación de la taxonomía desarrollada por la Cochrane Effective Practice and Organization of Care (EPOC) y BCT, con la BCT Taxonomy versión 1 (BCTTv1). Se utilizaron los elementos PROGRESS (lugar de residencia, raza/grupo étnico/cultura/idioma, ocupación, género/sexo, religión, educación, nivel socioeconómico y capital social) para describir las características de los participantes de los estudios incluidos que podrían afectar la equidad de acceso a los servicios de salud.
Dos autores de la revisión, de forma independiente, extrajeron los datos. Un autor de la revisión ingresó los datos en Review Manager 5 y un segundo autor de la revisión los verificó. Dos autores de la revisión, de forma independiente, evaluaron el riesgo de sesgo de los estudios incluidos y extrajeron los datos. La certeza de la evidencia se calificó con la herramienta GRADE.
Resultados principales
Se incluyeron 66 ECA realizados predominantemente (62%) en los EE. UU. En términos generales, los ensayos se consideraron en riesgo de sesgo bajo o poco claro. Las estrategias de QI eran multifacéticas y dirigidas a pacientes, profesionales de la salud o sistemas sanitarios. Cincuenta y seis estudios (329 164 participantes) compararon la intervención frente a la atención habitual (mediana de duración del seguimiento de 12 meses). En general, la asistencia a las DRS aumentó un 12% (diferencia de riesgos [DR] 0,12; intervalo de confianza [IC] del 95%: 0,10 a 0,14; evidencia de certeza baja) comparada con la atención habitual, con una heterogeneidad significativa en el tamaño del efecto. Tanto las intervenciones de QI dirigidas a las DRS (DR 0,17; IC del 95%: 0,11 a 0,22) como las generales (DR 0,12; IC del 95%: 0,09 a 0,15) fueron eficaces, sobre todo cuando la asistencia inicial a las DRS fue baja. Todas las combinaciones de BCT se asociaron con mejorías significativas, en especial en las que tenían una asistencia deficiente. Se hallaron estimaciones del efecto mayores en los análisis de subgrupos para las BCT de "establecimiento de objetivos (resultado)" (DR 0,26; IC del 95%: 0,16 a 0,36) y "retroalimentación sobre los resultados del comportamiento" (DR 0,22; IC del 95%: 0,15 a 0,29) en las intervenciones dirigidas a los pacientes y la "reestructuración del entorno social" (DR 0,19; IC del 95%: 0,12 a 0,26) y la "fuente fiable" (DR 0,16; IC del 95%: 0,08 a 0,24) en intervenciones dirigidas a profesionales de la salud.
Diez estudios (23 715 participantes) compararon una intervención más intensiva (escalonada) frente a una intervención menos intensiva. En estos estudios la asistencia a las DRS aumentó un 5% (DR 0,05; IC del 95%: 0,02 a 0,09; evidencia de certeza moderada).
Catorce estudios que informaron cualquier intervención de QI en comparación con la atención habitual incluyeron resultados económicos. Sin embargo, solo cinco de ellas eran evaluaciones económicas completas. En general, hallamos que no hay suficientes pruebas para establecer conclusiones sólidas sobre la efectividad relativa de la relación costo‐eficacia de las intervenciones comparadas entre sí o con la atención habitual.
A excepción del género y el origen étnico, las características de los participantes fueron mal descritas en términos de elementos PROGRESS. Se realizaron diecisiete estudios (25,8%) en poblaciones desfavorecidas. No se realizaron estudios en países de ingresos bajos o medios.
Conclusiones de los autores
Los resultados de esta revisión aportan pruebas de que las intervenciones de QI dirigidas a pacientes, profesionales de la salud o al sistema sanitario se asocian con mejorías significativas en la asistencia a las DRS en comparación con la atención habitual. No hubo diferencias estadísticamente significativas entre las intervenciones específicamente dirigidas a las DRS y las que formaron parte de una estrategia general de QI para perfeccionar el tratamiento de la diabetes. Este es un resultado significativo, debido a los beneficios adicionales de las intervenciones generales de QI en cuanto a la mejoría en el control de la glucemia y del riesgo vascular, y la detección de otras complicaciones microvasculares. Es probable que también se puedan lograr mejorías adicionales (aunque más pequeñas) en la asistencia a las DRS, aumentando la intensidad de un componente concreto del QI o añadiendo otros componentes.
PICO
Resumen en términos sencillos
Intervenciones para aumentar la asistencia a las pruebas de detección de retinopatía diabética
¿Cuál es el objetivo de esta revisión?
El objetivo de esta revisión fue averiguar si son eficaces las intervenciones utilizadas para mejorar la asistencia a las pruebas de detección de retinopatía diabética.
Mensajes clave
Los resultados de esta revisión hallaron pruebas que indican que las intervenciones dirigidas a pacientes, a los profesionales de la salud o al sistema sanitario probablemente sean eficaces para mejorar la asistencia a las pruebas de detección de retinopatía diabética en comparación con la atención habitual. Se hallaron beneficios para las intervenciones dirigidas específicamente a las pruebas de detección de retinopatía diabética, así como a las que formaban parte de una estrategia general para mejorar el tratamiento de la diabetes. Esto es importante, ya que las estrategias más generales se asocian con beneficios adicionales, como mejorar el control de la glucemia y aumentar la detección de otras complicaciones relacionadas con la diabetes.
¿Qué se estudió en la revisión?
Los pacientes con diabetes pueden perder agudeza visual debido a los efectos nocivos de la enfermedad sobre los vasos sanguíneos pequeños de la parte posterior del ojo (retinopatía diabética). Las pruebas de cribado de la retinopatía diabética para detectar y tratar los signos precoces pueden prevenir la pérdida de la visión. Sin embargo, la asistencia a las pruebas de detección es variable y las modificaciones que ponen en riesgo la visión tal vez no se detecten en el momento adecuado.
Esta revisión examinó una variedad de intervenciones para mejorar las pruebas de detección de la retinopatía diabética.
¿Cuáles son los principales resultados de la revisión?
Los autores de la revisión Cochrane encontraron 66 estudios relevantes. Cuarenta y un estudios fueron de EE. UU., 14 de Europa, tres de Canadá, tres de Australia y cinco de otros lugares. Cincuenta y seis estudios compararon la intervención para mejorar la asistencia a las pruebas de detección con la atención habitual y diez compararon una intervención más intensiva con una menos intensiva.
Descubrimos que las intervenciones dirigidas a pacientes o profesionales de la salud o a ambos, o al sistema sanitario eran eficaces para mejorar la asistencia a las pruebas de detección. Las intervenciones destinadas a mejorar la calidad general del tratamiento de la diabetes funcionaron, al igual que las orientadas específicamente a mejorar las pruebas de detección de la retinopatía. En promedio, la asistencia aumentó un 12% en comparación con ninguna intervención.
¿Cuál es el grado de actualización de esta revisión?
Los autores de la revisión Cochrane buscaron estudios que se habían publicado hasta el 13 Febrero 2017.
Conclusiones de los autores
Summary of findings
| Any quality improvement intervention compared to usual care for diabetic retinopathy screening | ||||||
| Patient or population: patients with type 1 or 2 diabetes eligible for diabetic retinopathy screening | ||||||
| Outcomes | Illustrative comparative risks | Risk Difference (95% CI) | No of Participants | Quality of the evidence | Comments | |
| Assumed risk | Corresponding risk (95% CI) | |||||
| Attendance with usual care | Attendance with any QI Intervention | |||||
| Proportion of participants attending screening (median follow‐up 12 months post‐intervention) | 472 per 1000 | 580 per 1000 (557 to 604) | RD 12% (95% CI 10% to 14%) | 329,164 | ⊕⊕⊝⊝ | There was substantial unexplained heterogeneity between studies (I2 = 93%, P < 0.001). The effect appears to be larger when baseline performance is low |
| Ongoing adherence to screening | ‐ | ‐ | ‐ | ‐ | ‐ | Not reported |
| Economic Outcomes Resources used (staff time, equipment, consumables) | Wide variation in resources used for each study, hence difficult to collate the resource used as a single output | ‐ | 85 ‐ 20,000 (13 RCTs) | ⊕⊕⊝⊝ | ‐ | |
| Staff/personnel costs; costs of treatment and care; cost of primary care; lost wages and lost productivity | Wide variation in resources used from different interventions also made it difficult to derive average costs compared with usual care | ‐ | 85 ‐ 20,000 (10 RCTs) | |||
| Incremental Cost effectiveness of interventions | GBP 13,154 for promotion of self‐management; GBP 73,683 for 5 years for face‐to‐face meeting, GBP 18.77 for phone call | ‐ | 85 ‐ 603 (3 RCTs) | |||
| CI: Confidence interval; RD: Risk difference | ||||||
| GRADE Working Group grades of evidence | ||||||
| 1We downgraded the certainty of the evidence by two levels from high to low for inconsistency, due to wide variation in the effect estimates across studies that could not be explained. 2We downgraded the certainty of the evidence for the economic outcomes by two levels from high to low due to inconsistency across different elements of the economic outcomes (see Table 7). | ||||||
| Resources and costs per participant | ||||||||||
| Economic outcomes No of studies with evidence for the economic outcomes | Design | Limitations/risk of bias | Inconsistency | Indirectness | Imprecision | Other factors | No of participants | Any Quality Improvement intervention | Usual care | Overall quality |
| Resources used (staff time, equipment, consumables) (13 studies) Adair 2013Clancy 2007Davis 2010Eccles 2007Frei 2014Frijling 2002Krein 2004Litaker 2003Piette 2001Pizzi 2015Prezio 201Wagner 2001Walker 2008 | RCTs | Yesa | Yes ( there was justification for variation based on setting) | No | No | Resources used varied due to settings and intervention strategy | 85 ‐ 20,000 | Wide variation in resources used for each study, hence difficult to collate the resource used as a single output | ⊕⊕⊖⊖ LOW | |
| Staff/personnel costs; costs of treatment and care; cost of primary care; lost wages and lost productivity Adair 2013Clancy 2007Davis 2010Eccles 2007Frijling 2002Litaker 2003Piette 2001Pizzi 2015Prezio 2014Walker 2008 | RCTs | Yesa | Yes ( there was justification for variation based on setting) | No | No | Costs varied due to settings, level of experience and educational Background of personnel | 85 ‐ 20,000 | Wide variation in resources used from different interventions also made it difficult to derive average costs compared with usual care | ⊕⊕⊖⊖ LOW | |
| Incremental cost effectiveness of interventions. (3 studies) | RCTs | Yesa | No | No | No | None | 85 ‐ 603 | GBP 13,154 for promotion of self‐management GBP 73,683 for 5 years for face‐to‐face meeting GBP 18.77 for phone call | ⊕⊕⊕⊖ LOW | |
| a. Unclear risk from adequate masking (blinding), Unclear sequence generation and allocation concealment | ||||||||||
| Stepped quality improvement intervention compared to intervention alone for diabetic retinopathy screening | ||||||
| Patient or population: patients with type 1 or 2 diabetes eligible for diabetic retinopathy screening | ||||||
| Outcomes | Illustrative comparative risks | Risk Difference (95% CI) | No of Participants | Quality of the evidence | Comments | |
| Assumed risk (95% CI) | Corresponding risk (95% CI) | |||||
| Attendance with usual care | Attendance with stepped QI intervention | |||||
| Proportion of participants attending screening (median follow‐up 12 months post‐intervention) | 361 per 1000 | 405 per 1000 (372 to 437) | RD 5% (95% CI 2% to 9%) | 23,715 | ⊕⊕⊕⊝ | There was unexplained heterogeneity between studies (I2 = 56%, P = 0.02) |
| Ongoing adherence to screening | ‐ | ‐ | ‐ | ‐ | ‐ | ‐ |
| Economic outcomes | ‐ | ‐ | ‐ | ‐ | ‐ | ‐ |
| CI: Confidence interval; RD: Risk difference | ||||||
| GRADE Working Group grades of evidence | ||||||
| 1We downgraded the certainty of the evidence by one level from high to moderate for inconsistency due to variation in the effect estimates across studies that could not be explained. | ||||||
Antecedentes
Descripción de la afección
La retinopatía diabética es la complicación microvascular más frecuente de la diabetes mellitus y una de las principales causas de ceguera de la población adulta en edad laboral, en el mundo occidental (Sivaprasad 2012). La duración de la diabetes es el factor pronóstico más sólido para el desarrollo y la progresión de la retinopatía. Dentro de los 20 años posteriores al diagnóstico, casi todos los pacientes con diabetes tipo 1 y más del 60% de los pacientes con el tipo 2 padecen retinopatía (Fong 2004). En las personas de ascendencia asiática, africana y latinoamericana, en comparación con las poblaciones blancas, hay una mayor prevalencia de retinopatía diabética (Sivaprasad 2012). Otros factores de riesgo del desarrollo y la progresión de la retinopatía diabética incluyen los siguientes: control glucémico deficiente, hipertensión e hiperlipidemia (Yau 2012). Se calculó que en todo el mundo aproximadamente 93 millones de individuos pueden tener alguna modalidad de retinopatía diabética, y 28 millones cumplen con los criterios de valoración de la enfermedad con riesgo de la visión (Yau 2012). Existe escasa evidencia acerca de la carga económica de la retinopatía diabética. Una estimación reciente de los costos de la atención sanitaria en Suecia fue de 106 000 euros cada 100 000 habitantes por año, en función de una prevalencia de la diabetes del 4,8% (intervalo de confianza del 95%: 4,7 a 4,9) (Heintz 2010). Estos costos excluyen los efectos de los costos en los pacientes con retinopatía diabética y sus familias.
Si bien existen tratamientos eficaces para la retinopatía diabética con riesgo de la visión, como la fotocoagulación con láser (Evans 2014) y, más recientemente, el uso de inhibidores del factor de crecimiento endotelial antivascular (Virgili 2014), el éxito de estas intervenciones depende de la detección precoz y la derivación oportuna para su tratamiento. Las pruebas de detección de retinopatía diabética (DRS) satisface los criterios de la Organización Mundial de la salud (OMS) para un programa de pruebas de detección (Scanlon 2008): a saber, el deterioro visual asociado con la diabetes es un problema de salud pública importante; la retinopatía con riesgo de la visión tiene una etapa latente reconocible; se dispone de un tratamiento universalmente aceptado y eficaz; y se ha demostrado que las pruebas de detección son rentables en términos de años de visión preservados en comparación la ausencia de pruebas de detección (Jones 2010). Muchos países recomiendan las DRS anuales o cada dos años con viarias modalidades de pruebas de detección, incluidas las siguientes: oftalmoscopia realizada por varios profesionales de la salud (como oftalmólogos, optometristas, especialistas en diabetes) o mediante fotografía retiniana estándar u oftalmoscopia digital (American Diabetes Association 2015; Kristinsson 1995; Scanlon 2008). Recientemente, se desarrollaron algoritmos matemáticos que proporcionan una evaluación individualizada del riesgo de retinopatía diabética y la optimización de los intervalos de las pruebas de detección en función del tipo y la duración de la diabetes, la HbA1c, la presión arterial sistólica, el sexo y la presencia y el grado de retinopatía (Lund 2016).
Relativamente pocos países introdujeron un programa nacional de DRS poblacional, y en la mayoría de los países las pruebas de detección siguen siendo no sistemáticas.
El estándar de referencia para la detección de la retinopatía diabética consiste en siete campos fotográficos de color estándar de 35 grados, como lo describe el grupo de investigación sobre el Tratamiento Precoz de la Retinopatía Diabética (EDTRS, por sus siglas en inglés) (EDTRS 1991). Sin embargo, esta técnica es impracticable en las pruebas de detección de retinopatía a nivel general. Si bien la oftalmoscopia a través de las pupilas dilatadas ha sido tradicionalmente el método preferido para las pruebas de detección circunstanciales, el procedimiento varía en la precisión diagnóstica según la técnica particular utilizada (oftalmoscopia directa o indirecta) o de la experiencia del profesional de la salud que realiza la prueba (Hutchinson 2000). Los recientes avances en la oftalmoscopia digital facilitaron la rápida obtención de imágenes de la retina de alta calidad que pueden ser almacenadas y, posteriormente, calificadas. La imagenología digital combinada con personas capacitadas en la calificación resultó ser una herramienta de selección eficaz para identificar la retinopatía con riesgo de la visión (Williams 2004), y cada vez tiene mayor aceptación para las pruebas de detección poblacionales (Kirkizlar 2013; Sharp 2003; Silva 2009; Taylor 2007).
A pesar de la evidencia que apoya la eficacia de las DRS para reducir el riesgo de pérdida de la visión, la cobertura de las pruebas de detección se hallan constantemente por debajo de los niveles recomendados (Millett 2006; Paz 2006; Saadine 2008). Las elevadas tasas de falta de asistencia tienen consecuencias económicas importantes. Por ejemplo, el North and East Devon Diabetic Retinal Screening Service del Reino Unido invitó a 22 651 personas a participar en las pruebas de detección de la retina entre abril de 2009 y marzo de 2010. De los invitados, 2137 (9,4%) no asistieron a la consulta después de tres recordatorios. Cada consulta costó 34 libras esterlinas en 2009 y 37 libras esterlinas en 2010, el costo total de la falta de asistencia fue de 78 259 libras esterlinas (2009/2010 GBP) (Waqar 2012). Se demostró que son varios los factores que afectan el acceso y la asistencia a las DRS, incluido el origen étnico, ser de edad más joven (menos de 40 años), una mayor duración de la diabetes y vivir en zonas con alto grado de privación social (Byun 2013; Gulliford 2010; Hwang 2015; Kliner 2012).
Descripción de la intervención
Se ha demostrado que varias intervenciones destinadas específicamente a mejorar las DRS, como las dirigidas a los pacientes, los profesionales de la salud o el sistema sanitario, son eficaces para mejorar la asistencia a través de una serie de modelos de pruebas de detección de la retinopatía (Zhang 2007). Algunos ejemplos de intervenciones centradas en el paciente incluyen: (1) programas educativos para aumentar la sensibilización sobre la retinopatía diabética y promover el autocuidado, y (2) el uso de avisos/recordatorios. Las intervenciones centradas en el profesional sanitario incluyen las siguientes: (1) educación de los médicos, y (2) auditoría y retroalimentación del rendimiento. Las intervenciones del sistema incluyen las siguientes: (1) cambios en el equipo; (2) establecimiento de un registro electrónico y recordatorios, y (3) el uso de la telemedicina.
Además de las estrategias específicamente dirigidas a las DRS, la implementación de estrategias generales de mejoramiento de la calidad (QI) en el tratamiento de la diabetes también pueden resultar eficaces para mejorar la cobertura de las pruebas de detección. Una revisión sistemática reciente y un metanálisis de ensayos que evaluaron una serie de estrategias de QI predefinidas para mejorar el tratamiento de la diabetes informaron que estas estrategias se asociaron con un aumento significativo de las DRS en comparación con la atención habitual (cociente de riesgo 1,22; intervalo de confianza del 95%: 1,13 a 1,32) (Tricco 2012). Sin embargo, esta revisión no incluyó los estudios donde las intervenciones se dirigieron exclusivamente a los pacientes, y los autores no pudieron distinguir la efectividad de los componentes individuales de QI ni identificar los posibles modificadores del efecto. Además, la revisión no incluyó una perspectiva económica.
De qué manera podría funcionar la intervención
La mayoría de los estudios que evalúan la eficacia de las intervenciones para mejorar la atención de la diabetes (incluidas las que se administran específicamente para mejorar las DRS) a menudo implican intervenciones multicomponentes que intentan cambiar el comportamiento de los profesionales de la salud (p.ej., aconsejar a los pacientes que asistan a las DRS) o a los pacientes (por ejemplo, asistencia efectiva), o ambas. Como no existe una relación constante entre la cantidad de componentes de intervención y la eficacia (Grimshaw 2004), se desconoce cuál es el número "ideal" de componentes de estos programas. Además, dada la complejidad de las intervenciones investigadas hasta la fecha, no siempre queda claro cuáles componentes concretos son los elementos efectivos de estas intervenciones (es decir, los "componentes activos"). Por lo tanto, el contenido de las complejas intervenciones de cambio de comportamiento se ha denominado como "caja negra" (Grimshaw 2014). Hay pruebas de que cuanto más clara sea la descripción de los componentes "activos" de una intervención compleja, más sencilla será su administración de manera efectiva, constante y rentable (Michie 2009). Por lo tanto, la identificación de las intervenciones eficaces para aumentar la asistencia a las DRS primero requiere tener claro el contenido de la intervención y la relación funcional entre los componentes de las intervenciones y el resultado previsto. La Effective Practice and Organisation of Care (EPOC) de Cochrane elaboró una taxonomía que se puede utilizar para clasificar el contenido de la intervención en revisiones sistemáticas (EPOC 2015). Si bien la taxonomía "EPOC" proporciona un lenguaje común y una descripción resumida útil sobre la intervención, la taxonomía podría no ser los suficientemente detallada para especificar con claridad los componentes de la intervención (Presseau 2015). Un enfoque complementario consiste en proporcionar una categorización integral de los componentes de la intervención en cuanto a las técnicas usadas de modificación del comportamiento (BCT). Las BCT se definen como los "componentes observables, replicables e irreducibles de una intervención que están diseñados para alterar o redirigir los procesos causales que regulan el comportamiento" (Michie 2013). Recientemente, se publicó una taxonomía fiable de 93 BCT (desarrollada en conjunto por el miembro del equipo JF) para proporcionar una terminología común y uniforme (taxonomía de BCT versión 1 [BCTTv1]), que establece que se podrían identificar y describir los componentes BCT de las intervenciones complejas. Los ejemplos de etiquetas de las BCT en esta taxonomía incluyen los siguientes: "establecimiento de objetivos", "automonitorización", "proporcionar retroalimentación sobre el comportamiento" y "resolución de problemas". Los miembros del equipo de la revisión (JP, NI y JG) han demostrado con éxito la viabilidad de usar la taxonomía de BCT dentro de los ensayos de intervenciones de QI para el tratamiento de la diabetes (Presseau 2015).
Por qué es importante realizar esta revisión
Debido al valor de las pruebas de detección para reducir el riesgo de pérdida de la visión en los pacientes con diabetes, es esencial aumentar la asistencia a las DRS en la medida en que los recursos disponibles lo permitan. Se ha informado una amplia variación geográfica en la cobertura de las pruebas de detección, con las correspondientes desigualdades en los resultados. Es importante considerar si esas estrategias valen la pena, dado el aumento constante de los costos (utilización de recursos) y los beneficios (efectos) asociados con las intervenciones para mejorar la asistencia a las DRS.
Esta revisión contribuirá a identificar las estrategias de implementación para la detección temprana de la retinopatía con riesgo de la visión, mediante la identificación de los componentes activos de las intervenciones que aumentan la asistencia a las pruebas de detección. Además, al explorar los efectos diferenciales de las intervenciones en subgrupos concretos, los resultados podrían proporcionar pistas para ayudar a reducir las desigualdades en la asistencia a las pruebas de detección y determinar el efecto de la falta de equidad en la eficacia y la efectividad de la intervención. Si bien hubo varias revisiones sistemáticas sobre las intervenciones para optimizar los programas de pruebas de detección en adultos (Everett 2011; Holden 2010), es probable que esta evidencia no sea directamente transferible a las DRS. Las pruebas de detección para la retinopatía diabética difieren de otras formas de pruebas de detección debido a que el grupo objetivo ya tiene un contacto significativo con el sistema sanitario, por la diabetes subyacente, y las pruebas de detección tienen que ser de por vida (es decir, se requiere una vigilancia anual o cada dos años).
Objetivos
El objetivo principal de la revisión fue evaluar la efectividad del QI que busca aumentar la asistencia a las DRS en pacientes con diabetes tipo 1 y tipo 2.
Objetivos secundarios:
-
Utilizar taxonomías validadas de estrategias de intervención de QI y técnicas de modificación del comportamiento (BCT) para codificar la descripción de las intervenciones en los estudios incluidos y determinar si las intervenciones que incluyen ciertas estrategias de QI o componentes BCT son más eficaces para aumentar la asistencia a las pruebas de detección;
-
Explorar la heterogeneidad en el tamaño del efecto dentro de los estudios y entre ellos, para identificar los posibles factores explicativos de la variabilidad en el tamaño del efecto;
-
Explorar los efectos diferenciales en los subgrupos para proporcionar información sobre cómo se podría mejorar la equidad en la asistencia a las pruebas de detección;
-
Evaluar y resumir críticamente la evidencia actual sobre el uso de los recursos, los costos y la relación costo‐eficacia.
Métodos
Criterios de inclusión de estudios para esta revisión
Tipos de estudios
Se consideraron los ensayos controlados aleatorios (ECA), tanto aleatorizados individualmente como los ECA por grupos, realizados en un entorno de atención primaria o secundaria, específicamente diseñados para mejorar la asistencia a las DRS o que evaluaron estrategias generales para mejorar el tratamiento de la diabetes. Con más frecuencia, este último grupo de estudios se ocupó de los "objetivos de mejoramiento de la calidad" o los "procesos de la diabetes de las medidas de atención" como medidas de resultado primarias o secundarias. Solo se incluyeron estos estudios si informaron el efecto de la intervención en la asistencia a las DRS.
Para investigar la relación entre costo y efectividad se incluyeron evaluaciones económicas completas (análisis de la relación costo‐eficacia, análisis de la relación costo‐utilidad y análisis de costo‐beneficio), los estudios de análisis de costos y de aprovechamiento de recursos realizados en forma simultánea o como parte de un ECA incluido.
Tipos de participantes
Se incluyeron a pacientes con diabetes mellitus tipo 1 y tipo 2 que eran elegibles para las DRS.
Tipos de intervenciones
Se incluyeron los ECA que usaron cualquier estrategia planificada o cualquier combinación de estrategias para mejorar la asistencia a las DRS dirigidas a los individuos con diabetes (p.ej., recordatorios, promoción del autocuidado), profesionales de la salud (p.ej., educación, auditoría y retroalimentación [feedback]) o el sistema sanitario (p.ej., registros electrónicos, cambios de equipo). Las intervenciones incluyeron a las que se dirigen específicamente a las DRS, así como las que integraban una estrategia general para mejorar los procesos del tratamiento de la diabetes. Las intervenciones de comparación fueron como se especificaron en los estudios incluidos.
Tipos de medida de resultado
Resultados primarios
La medida de resultado primaria fue la diferencia en la asistencia a las DRS (una o más visitas) en un período de dos años después de la implementación de la intervención. Esto podría basarse en autoinformes, bases de datos de solicitudes de reintegro o auditorías de historias clínicas (médicos de hospitales o de atención primaria, o registros del sistema administrativo de las pruebas de detección).
Resultados secundarios
Se consideraron los siguientes resultados secundarios:
-
Cumplimiento permanente con las pruebas de detección según la asistencia a las pruebas de detección después del cribado inicial posterior a la intervención.
-
Resultados económicos:
-
-
Recursos (tiempo del personal, equipo, accesorios) requeridos para administrar intervenciones para aumentar la asistencia a las pruebas de detección
-
Costos del personal utilizados para proporcionar las intervenciones; costos del tratamiento y de la atención; costo de la atención primaria; salarios perdidos y productividad perdida (producción laboral)
-
Relación costo‐eficacia (cocientes de relación costo‐eficacia crecientes [ICER]; costo creciente por año de vida ajustado por calidad (QALY); costo creciente por año de vida ajustado por discapacidad (DALY); cocientes de relación costo‐beneficio crecientes; beneficios netos).
-
Results
Description of studies
Results of the search
The electronic searches yielded 9030 records (Figure 1). The Cochrane Information Specialist removed 1786 duplicate records and we screened the remaining 7244 records plus 33 records identified from additional sources (Tricco 2012). We rejected 7152 records after reading the abstracts and obtained full‐text reports of 125 references for further assessment. We identified 81 reports of 66 studies that met the inclusion criteria (see Characteristics of included studies) and excluded 34 reports of 34 studies (see Characteristics of excluded studies). We also identified nine reports of eight ongoing trials (see Characteristics of ongoing studies), and will assess these when results become available.

Study flow diagram.
Included studies
The included studies were conducted between 1988 and 2013. Thirty‐five studies (53%) were parallel‐group patient RCTs enrolling 237,025 patients, and 31 (47%) were cluster‐RCTs in which the healthcare professional or the healthcare setting was the unit of randomisation. These included 6126 clusters (range 6 to 4125). Fifty‐nine studies (89.4%) had two arms, six studies (9.1%) had three arms and one study (1.5%) had more than three arms. For further details see Characteristics of included studies.
Types of participants
Participant characteristics are reported in Table 3. Most of the studies (57.6%) recruited participants with type 2 diabetes, 15.2% of studies included those with either type 1 or type 2 diabetes, and in 12.1% of studies the type of diabetes was not reported.
| Study characteristics | Target: diabetic retinopathy screening attendance N = 16 | Target: general quality improvement in diabetes care N = 50 | TOTAL N = 66 |
| Study design | Individual RCT: n = 14 (87.5%) Cluster‐RCT: n = 2 (12.5%) 2 arms n = 13 (81.3%) 3 arms n = 2 (12.5%) > 3 arms n = 1 (6.3%) | Individual RCT: n = 21 (42%) Cluster‐RCT: n = 29 (58%) 2 arms n = 46 (92%) 3 arms n = 4 (8%) | Individual RCT n = 35 (53%) Cluster‐RCT n = 31 (47%) 2 arms n = 59 (89.4%) 3 arms n = 6 (9.1%) > 3 arms n = 1 (1.5%) |
| Location | USA: n = 12 (75%) Canada: n = 1 (6.3%) China: n = 1 (6.3%) Germany: n = 1 (6.3%) UK: n = 1 (6.3%) Conducted between 1995 and 2013 | USA: n = 29 (58%) Canada: n = 2 (4%) Netherlands: n = 4 (8%) Australia: n = 3 (6%) UK: n = 2 (4%) Other n = 10 (20%) Conducted between 1988 and 2013 | USA: n = 41 (62.1%) Canada: n = 3 (4.6%) Netherlands: n = 4 (6.1%) Australia: n = 3 (4.6%) UK: n = 3 (4.6%) Other: n = 12 (18.2%) Conducted between 1988 and 2013 |
| Setting | Primary care: n = 11 (68.8%) Outpatient clinics: n = 4 (25%) Unclear: n = 1 (6.3%) | Primary care: n = 40 (80%) Outpatient n = 3 (6%) Unclear: n = 7 (14%) | Primary care: n = 51 (77.3%) Outpatient clinics n = 7 (10.6%) Unclear n = 8 (12.1%) |
| Diabetes type | Type 2: n = 4 (25%) Type 1 and Type 2: n = 3 (18.8%) Not reported: n = 9 (56.3%) | Type 2: n = 34 (68%) Type 1 and Type 2 n = 7 (14%) Not reported: n = 9 (18%) | Type 2 : n = 38 (57.6%) Type 1 and 2 n = 10 (15.2%) Not reported n = 18 (27.3%) |
| Number of participants recruited | Individual RCT = 38,273 Cluster RCT = 4135 clusters, 182,513 participants Total: 220,786 participants included | Individual RCT = 198,752 Cluster RCT = 1991 clusters, 78,276 participants Total: 277,028 participants included | Individual RCT = 237,025 Cluster RCT = 6126 clusters, 260,789 participants Total: 497,814 participants included |
| Median age | Median 60.7 yrs (range 51.1 ‐ 72.7) | Median 60.6 yrs (range 46.8 ‐ 74) Number reporting n = 34 | Median 60.7 yrs (46.8 ‐ 74) Number reporting n = 43 |
| Gender (% male) | Median 38.9% (range 25% ‐ 98%) Number reporting n = 12 | Median 49.8% (range 25% ‐ 97%): Number reporting n = 35 | Median 48% (25% ‐ 98%) Number reporting n = 47 |
| Type of screening | Retinal exam n = 12 (75%) Grading of digital retinal images: n = 4 (25%) | Retinal exam n = 49 (98%) Grading of retinal images n = 1 (2%) | Retinal exam n = 61 (92.4%) Grading of retinal images n = 5 (7.6%) |
| Baseline screening attendance (in previous 12 or 24 m) | Median 0% (range 0% ‐ 48.4%) Reported in 7 studies | Median 37.1% (range 0% ‐ 88%) Reported in 36 studies | Median 35.4% (range 0% ‐ 87.8%) Reported in 43 studies |
| Longest duration of follow‐up (median)* | Median 6 months (range 3 ‐ 48) Number reporting n = 14 | Median 12 months (range 1 ‐ 30): Number reporting n = 49 | Median 12 months (range 1 ‐ 48) Number reporting n = 63 |
| Intervention target (modified EPOC classification) | Median number of targets in intervention arm = 2 Participant n = 14 (87.5%) Healthcare professional n = 4 (25%) Healthcare system n = 4 (25%) | Median number of targets in intervention arm = 3 Participant n = 31 (62%) Healthcare professional n = 31 (62%) Healthcare system n = 37 (74%) | Median number of targets in intervention arm = 3 Participant n = 45 (68.2%) Healthcare professional n = 35 (53%) Healthcare system n = 41 (62.1%) |
Mansberger 2015 reported follow‐up data to 48 months but intervention offered to intervention and control group after 18 months and data reported at 12 and 24 months.
We used PROGRESS elements to describe the characteristics of participants in the included studies that could have an impact on equity of access to health services. With the exception of gender (reported in 93.9% of studies) and ethnicity (reported in 56.1% of studies), the characteristics of participants were poorly described, and the relative effectiveness of the interventions for subgroups in terms of PROGRESS elements was never reported. Seventeen studies (25.8%) were conducted in disadvantaged populations and none were carried out in low‐ or middle‐income countries.
Types of setting
Details of study location and setting are given in Table 3. Most of the studies (62.1%) were conducted in the USA, 21.2% in Europe and 16.7% elsewhere. The setting was primary care in 77.7%, secondary care in 10.6% and unclear in 12.1%.
Intervention content in terms of QI components (coded using the modified EPOC taxonomy)
Interventions were either specifically targeted at improving attendance for DRS (N = 16) or were part of a general QI intervention to improve diabetes care (N = 50). For studies comparing any intervention to usual care, most studies provided no description of usual care, which precluded coding of the comparator arm.
All 12 QI intervention components, as defined by the modified EPOC taxonomy, were used in at least one study (Figure 2). Generally, interventions were multifaceted, with several QI components per intervention arm (median 3, range 1 ‐ 7). For interventions specifically targeting DRS attendance, the most commonly used QI components were ‘Patient reminders (56% of studies)’ and ‘Patient education (75%) (Figure 3). For general QI interventions, a greater number and range of strategies were used, including: ‘Patient education’ (48% of studies), ‘Promotion of self‐management’ (40%), ‘Case management’ (40%), ‘Clinician education’ (38%) and ‘Team changes’ (36%).
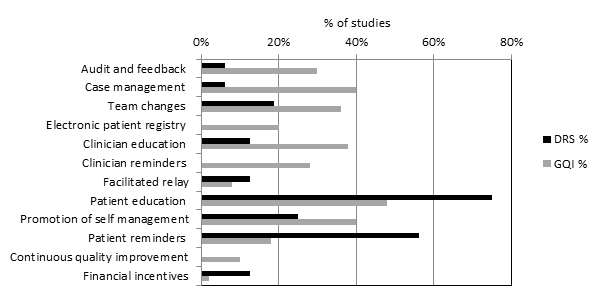
Quality improvement components used in intervention arm of included studies. (DRS=diabetic retinopathy screening, GQI=general quality improvement).

Risk of bias summary: review authors' judgements about each risk of bias item for each included study.
Intervention content in terms of BCTs (coded using the BCT taxonomy)
Overall, 39 out of the possible 93 BCTs (42%) were identified as targeting change in patient or healthcare professional behaviour in at least one trial. Interventions specifically targeting DRS primarily used techniques aimed at patients, particularly ‘Instruction on how to perform the behaviour’ (75% of studies), ‘Prompts/cues’ (69%) and ‘Information about consequences’ (56%) (Figure 4). Relatively few of these studies used BCTs that were aimed at healthcare professionals (Figure 5). By contrast, these healthcare professional‐directed strategies were more widely used in general QI interventions, in particular: ‘Instruction on how to perform the behaviour’ (66%), ‘Restructuring the social environment’ (52%) and ‘Feedback on outcomes of behaviour/Biofeedback’ (36%). Table 1 provides illustrative quotations for each BCT.

Behaviour change techniques (BCTs) targeting patients used in intervention arm. of included studies (DRS=diabetic retinopathy screening, GQI=general quality improvement).

Behaviour change techniques (BCTs) targeting healthcare professionals used in intervention arm of included studies (DRS=diabetic retinopathy screening, GQI=general quality improvement).
For studies comparing any intervention to usual care, most studies provided no description of usual care, which precluded coding of the comparator arm.
Outcome measures
In 12 (75%) of the 16 studies where the primary target of the intervention was to improve attendance for DRS, the outcome was a dilated fundus examination conducted by an ophthalmologist or optometrist during the follow‐up period post‐intervention (median follow‐up 12 months). The fundus examination was confirmed by a medical record audit, health claims database, or an eye‐care professional confirmed examination. In four studies (25%) DRS consisted of screening of digital retinal images.
Of the 50 studies where DRS attendance was reported as part of a general QI intervention, DRS was usually listed as part of a number of processes of care based on diabetes guideline recommendations. DRS was variously described as a dilated fundus examination/diabetic eye exam/retinal exam/eye exam in 49 studies (98%) and involved grading of retinal images in one study. DRS was confirmed by medical record audit, from claims databases or patient self‐reports (both validated and unvalidated by an eye‐care professional). The median duration of follow‐up was 12 months (range 1 ‐ 48 months).
In terms of economic outcomes, five studies reported a full economic evaluation (Davis 2010; Eccles 2007; Pizzi 2015; Prezio 2014; Walker 2008).Three of these were cost‐effectiveness analyses (Davis 2010; Prezio 2014; Walker 2008) and two were cost‐consequence analyses (Eccles 2007; Pizzi 2015). Nine studies were partial economic evaluations; five were resource‐utilisation studies, (Clancy 2007; Frei 2014; Krein 2004; McCall 2011; Piette 2001), while four were cost‐outcome descriptions (Adair 2013; Frijling 2002; Litaker 2003; Wagner 2001). We could not retrieve the full text of one of the cost‐effectiveness studies, but the abstract provided some information required for the review alongside the clinical‐effectiveness report (Davis 2010).
Excluded studies
Risk of bias in included studies
We conducted 'Risk of bias' assessment using the Cochrane EPOC 'Risk of bias' tool. Figure 3 and Figure 6 summarise the risks of bias. Overall, we judged trials to be at low or unclear risk of bias for most of the bias domains. We provide support for each judgement in the Characteristics of included studies tables.

Risk of bias graph: review authors' judgements about each risk of bias item presented as percentages across all included studies.
The studies that reported economic outcomes are a subset of the studies included in the review, and the risks of bias of these studies were very similar to the main body of included studies. With respect to the economic methodological quality, only five of the 14 included studies reported full economic evaluations (Davis 2010; Eccles 2007; Pizzi 2015; Prezio 2014; Walker 2008). One of these studies (Davis 2010) was published as an abstract and lacked important methodological details. Only three of the studies with full economic evaluations (Pizzi 2015; Prezio 2014; Walker 2008) reported a sensitivity analysis to explore changes in the costs and outcomes under different scenarios. Discounting in economic evaluations is necessary to adjust future costs and outcomes of an intervention to its present value, but was reported in only one of the full economic outcomes (Prezio 2014). Its use would have been appropriate in those other studies which had a stated follow‐up of longer than 12 months (Eccles 2007; Frijling 2002; Krein 2004; Wagner 2008). We considered the methodological quality of the full economic evaluations to be moderate, while the partial economic evaluations by their nature lacked the methodological characteristics expected of an economic evaluation. Full details of the methodological quality assessment for each of the included economic evaluations are available in Table 4 and Table 5.
| CHEC criteria checklists | Adair 2013 | Clancy 2007 | Davis 2011 | Eccles 2007 | Frei 2014 | Frijling 2002 | Krein 2004 | Litaker 2003 | McCall 2011 | Piette 2001 | Pizzi 2015 | Prezio 2014 | Schechter 2008 | Wagner 2001 |
| Is the study population clearly described? | Y | Y | Y | Y | Y | Y | Y | Y | Y | Y | Y | Y | Y | Y |
| Are competing alternatives clearly described? | Y | Y | Y | N | N | Y | Y | Y | N | N | Y | Y | Y | N |
| Is a well‐defined research question posed in answerable form? | Y | Y | Y | Y | Y | Y | Y | Y | Y | N | Y | Y | Y | Y |
| Is the economic study design appropriate to the stated objective? | N | N | Y | N | N | N | N | Y | N | N | Y | Y | Y | N |
| Is the chosen time horizon appropriate to include relevant costs and consequences? | Y | N | U | N | N | N | N | Y | N | N | Y | Y | Y | N |
| Is the actual perspective chosen appropriate? | Y | N | Y | Y | Y | Y | Y | Y | Y | Y | Y | Y | Y | Y |
| Are all important and relevant costs for each alternative identified? | Y | N | Y | Y | N | N | N | N | N | N | Y | Y | Y | N |
| Are all costs measured appropriately in physical units? | Y | N | U | Y | N | Y | N | Y | Y | N | Y | Y | Y | N |
| Are costs valued appropriately? | Y | N | N | Y | N | Y | N | Y | N | N | Y | Y | Y | N |
| Are all important and relevant outcomes for each alternative identified? | Y | N | Y | Y | Y | Y | N | Y | N | Y | Y | Y | Y | N |
| Are all outcomes measured appropriately? | Y | Y | Y | Y | N | Y | N | Y | Y | N | Y | Y | Y | N |
| Are outcomes valued appropriately? | N | N | N | Y | N | N | N | N | N | N | Y | Y | N | N |
| Is an incremental analysis of costs and outcomes of alternatives performed? | N | N | Y | N | N | N | N | N | N | N | Y | Y | Y | N |
| Are all future costs and outcomes discounted appropriately? | N | N | N | N | N | N | N | N | N | N | Y | Y | N | N |
| Are all important variables, whose values are uncertain, appropriately subjected to sensitivity analysis? | N | N | N | Y | N | N | N | N | N | N | Y | Y | Y | N |
| Do the conclusions follow from the data reported? | Y | Y | Y | N | Y | Y | Y | N | N | Y | Y | Y | Y | Y |
| Does the study discuss the generalizability of the results to other settings patient/client groups? | Y | Y | Y | Y | Y | Y | Y | Y | N | Y | Y | Y | Y | Y |
| Does the article indicate that there is no potential conflict of interest of study researcher(s) and funder(s)? | Y | Y | Y | Y | Y | Y | Y | Y | N | Y | Y | Y | Y | Y |
| Are ethical and distributional issues discussed appropriately? | Y | Y | Y | Y | Y | Y | Y | Y | Y | Y | Y | Y | Y | Y |
N: no
U: unclear
Y: yes
| Section of paper | Component | Reported on page number |
| Adair 2013 | ||
| Abstract | Provide a structured summary of objectives, perspective, setting, methods (including study design and inputs), results (including base case and uncertainty analyses), and conclusions | Not reported |
| Introduction | ‐ | |
| Background and objectives | Provide an explicit statement of the broader context for the study | 176 |
| Present the study question and its relevance for health policy or practice decisions | 176 | |
| Methods | ||
| Target population and subgroups | Describe characteristics of the base case population and subgroups analysed, including why they were chosen | 177 |
| Setting and location | State relevant aspects of the system(s) in which the decision(s) need(s) to be made | 177 |
| Study perspective | Describe the perspective of the study and relate this to the costs being evaluated | 178 ‐ 179 |
| Comparators | Describe the interventions or strategies being compared and state why they were chosen | Not reported |
| Time horizon | State the time horizon(s) over which costs and consequences are being evaluated and say why appropriate | Not reported |
| Discount rate | Report the choice of discount rate(s) used for costs and outcomes and say why appropriate | Not reported |
| Choice of health outcomes | Describe what outcomes were used as the measure(s) of benefit in the evaluation and their relevance for the type of analysis performed | Not reported |
| Measurement of effectiveness | Single study‐based estimates: Describe fully the design features of the single effectiveness study and why the single study was a sufficient source of clinical effectiveness data | Not reported |
| Synthesis‐based estimates: Describe fully the methods used for identification of included studies and synthesis of clinical effectiveness data | Not reported | |
| Measurement and valuation of preference based outcomes | If applicable, describe the population and methods used to elicit preferences for outcomes | Not reported |
| Estimating resources and costs | Single study‐based economic evaluation: Describe approaches used to estimate resource use associated with the alternative interventions. Describe primary or secondary research methods for valuing each resource item in terms of its unit cost. Describe any adjustments made to approximate to opportunity costs | 179 |
| Currency, price date, and conversion | Report the dates of the estimated resource quantities and unit costs. Describe methods for adjusting estimated unit costs to the year of reported costs if necessary. Describe methods for converting costs into a common currency base and the exchange rate | 179 |
| Choice of model | Describe and give reasons for the specific type of decision‐analytical model used. Providing a figure to show model structure is strongly recommended | Not reported |
| Assumptions | Describe all structural or other assumptions underpinning the decision‐analytical model | Not reported |
| Analytical methods | Describe all analytical methods supporting the evaluation. This could include methods for dealing with skewed, missing, or censored data; extrapolation methods; methods for pooling data; approaches to validate or make adjustments (such as half cycle corrections) to a model; and methods for handling population heterogeneity and uncertainty | Not reported |
| Results | ||
| Study parameters | Report the values, ranges, references, and, if used, probability distributions for all parameters. Report reasons or sources for distributions used to represent uncertainty where appropriate. Providing a table to show the input values is strongly recommended | Appendices w65 |
| Incremental costs and outcomes | For each intervention, report mean values for the main categories of estimated costs and outcomes of interest, as well as mean differences between the comparator groups. If applicable, report incremental cost‐effectiveness ratios | Appendices w65 |
| Characterising uncertainty | Single study‐based economic evaluation: Describe the effects of sampling uncertainty for the estimated incremental cost and incremental effectiveness parameters, together with the impact of methodological assumptions (such as discount rate, study perspective) | Not reported |
| Model‐based economic evaluation: Describe the effects on the results of uncertainty for all input parameters, and uncertainty related to the structure of the model and assumptions | Not reported | |
| Characterising heterogeneity | If applicable, report differences in costs, outcomes, or cost‐effectiveness that can be explained by variations between subgroups of patients with different baseline characteristics or other observed variability in effects that are not reducible by more information | Not reported |
| Discussion | ||
| Study findings, limitations, generalisability, and current knowledge | Summarise key study findings and describe how they support the conclusions reached. Discuss limitations and the generalisability of the findings and how the findings fit with current knowledge | 183 |
| Other | ||
| Source of funding | Describe how the study was funded and the role of the funder in the identification, design, conduct, and reporting of the analysis. Describe other non‐monetary sources of support | 183 |
| Conflicts of interest | Describe any potential for conflict of interest of study contributors in accordance with journal policy. In the absence of a journal policy, we recommend authors comply with International Committee of Medical Journal Editors recommendations | 183 |
| Clancy 2007 | ||
| Title | Identify the study as an economic evaluation or use more specific terms such as “cost‐effectiveness analysis”, and describe the interventions compared. | Not reported |
| Abstract | Provide a structured summary of objectives, perspective, setting, methods (including study design and inputs), results (including base case and uncertainty analyses), and conclusions. | Not reported |
| Introduction | ||
| Background and objectives | Provide an explicit statement of the broader context for the study. | Not reported |
| Present the study question and its relevance for health policy or practice decisions. | 620 | |
| Methods | Not reported | |
| Target population and subgroups | Describe characteristics of the base case population and subgroups analysed, including why they were chosen. | 621 |
| Setting and location | State relevant aspects of the system(s) in which the decision(s) need(s) to be made. | Not reported |
| Study perspective | Describe the perspective of the study and relate this to the costs being evaluated. | Not reported |
| Comparators | Describe the interventions or strategies being compared and state why they were chosen. | 620 ‐ 621 |
| Time horizon | State the time horizon(s) over which costs and consequences are being evaluated and say why appropriate. | Not reported |
| Discount rate | Report the choice of discount rate(s) used for costs and outcomes and say why appropriate. | Not reported |
| Choice of health outcomes | Describe what outcomes were used as the measure(s) of benefit in the evaluation and their relevance for the type of analysis performed. | Not reported |
| Measurement of effectiveness | Single study‐based estimates: Describe fully the design features of the single effectiveness study and why the single study was a sufficient source of clinical effectiveness data. | 620 |
| Synthesis‐based estimates: Describe fully the methods used for identification of included studies and synthesis of clinical effectiveness data. | Not reported | |
| Measurement and valuation of preference based outcomes | If applicable, describe the population and methods used to elicit preferences for outcomes. | Not reported |
| Estimating resources and costs | Single study‐based economic evaluation: Describe approaches used to estimate resource use associated with the alternative interventions. Describe primary or secondary research methods for valuing each resource item in terms of its unit cost. Describe any adjustments made to approximate to opportunity costs. | Not reported |
| Currency, price date, and conversion | Report the dates of the estimated resource quantities and unit costs. Describe methods for adjusting estimated unit costs to the year of reported costs if necessary. Describe methods for converting costs into a common currency base and the exchange rate. | Not reported |
| Choice of model | Describe and give reasons for the specific type of decision‐analytical model used. Providing a figure to show model structure is strongly recommended. | Not reported |
| Assumptions | Describe all structural or other assumptions underpinning the decision‐analytical model. | Not reported |
| Analytical methods | Describe all analytical methods supporting the evaluation. This could include methods for dealing with skewed, missing, or censored data; extrapolation methods; methods for pooling data; approaches to validate or make adjustments (such as half cycle corrections) to a model; and methods for handling population heterogeneity and uncertainty. | 622 |
| Results | ||
| Study parameters | Report the values, ranges, references, and, if used, probability distributions for all parameters. Report reasons or sources for distributions used to represent uncertainty where appropriate. Providing a table to show the input values is strongly recommended. | Not reported |
| Incremental costs and outcomes | For each intervention, report mean values for the main categories of estimated costs and outcomes of interest, as well as mean differences between the comparator groups. If applicable, report incremental cost‐effectiveness ratios. | Not reported |
| Characterising uncertainty | Single study‐based economic evaluation: Describe the effects of sampling uncertainty for the estimated incremental cost and incremental effectiveness parameters, together with the impact of methodological assumptions (such as discount rate, study perspective). | Not reported |
| Model‐based economic evaluation: Describe the effects on the results of uncertainty for all input parameters, and uncertainty related to the structure of the model and assumptions | Not reported | |
| Characterising heterogeneity | If applicable, report differences in costs, outcomes, or cost‐effectiveness that can be explained by variations between subgroups of patients with different baseline characteristics or other observed variability in effects that are not reducible by more information. | Not reported |
| Discussion | ||
| Study findings, limitations, generalisability, and current knowledge | Summarise key study findings and describe how they support the conclusions reached. Discuss limitations and the generalisability of the findings and how the findings fit with current knowledge. | Not reported |
| Other | ||
| Source of funding | Describe how the study was funded and the role of the funder in the identification, design, conduct, and reporting of the analysis. Describe other non‐monetary sources of support. | 624 |
| Conflicts of interest | Describe any potential for conflict of interest of study contributors in accordance with journal policy. In the absence of a journal policy, we recommend authors comply with International Committee of Medical Journal Editors recommendations. | 624 |
| Davis 2010 | ||
| Title | Identify the study as an economic evaluation or use more specific terms such as “cost‐effectiveness analysis”, and describe the interventions compared. | Abstract A325 |
| Abstract | Provide a structured summary of objectives, perspective, setting, methods (including study design and inputs), results (including base case and uncertainty analyses), and conclusions. | Abstract A325 |
| Introduction | ||
| Background and objectives | Provide an explicit statement of the broader context for the study. | Abstract A325 |
| Present the study question and its relevance for health policy or practice decisions. | 1712 of effectiveness report | |
| Methods | ||
| Target population and subgroups | Describe characteristics of the base case population and subgroups analysed, including why they were chosen. | 1714 of effectiveness report |
| Setting and location | State relevant aspects of the system(s) in which the decision(s) need(s) to be made. | Abstract A325 |
| Study perspective | Describe the perspective of the study and relate this to the costs being evaluated. | Not reported |
| Comparators | Describe the interventions or strategies being compared and state why they were chosen. | Abstract A325 |
| Time horizon | State the time horizon(s) over which costs and consequences are being evaluated and say why appropriate. | Abstract A325 |
| Discount rate | Report the choice of discount rate(s) used for costs and outcomes and say why appropriate. | Not reported |
| Choice of health outcomes | Describe what outcomes were used as the measure(s) of benefit in the evaluation and their relevance for the type of analysis performed. | 1713 |
| Measurement of effectiveness | Single study‐based estimates: Describe fully the design features of the single effectiveness study and why the single study was a sufficient source of clinical effectiveness data. | Abstract A325 |
| Synthesis‐based estimates: Describe fully the methods used for identification of included studies and synthesis of clinical effectiveness data. | Not applicable | |
| Measurement and valuation of preference based outcomes | If applicable, describe the population and methods used to elicit preferences for outcomes. | Not reported |
| Estimating resources and costs | Single study‐based economic evaluation: Describe approaches used to estimate resource use associated with the alternative interventions. Describe primary or secondary research methods for valuing each resource item in terms of its unit cost. Describe any adjustments made to approximate to opportunity costs. | Not reported |
| Currency, price date, and conversion | Report the dates of the estimated resource quantities and unit costs. Describe methods for adjusting estimated unit costs to the year of reported costs if necessary. Describe methods for converting costs into a common currency base and the exchange rate. | Not reported |
| Choice of model | Describe and give reasons for the specific type of decision‐analytical model used. Providing a figure to show model structure is strongly recommended. | Not applicable |
| Assumptions | Describe all structural or other assumptions underpinning the decision‐analytical model. | Not applicable |
| Analytical methods | Describe all analytical methods supporting the evaluation. This could include methods for dealing with skewed, missing, or censored data; extrapolation methods; methods for pooling data; approaches to validate or make adjustments (such as half cycle corrections) to a model; and methods for handling population heterogeneity and uncertainty. | Not applicable |
| Results | ||
| Study parameters | Report the values, ranges, references, and, if used, probability distributions for all parameters. Report reasons or sources for distributions used to represent uncertainty where appropriate. Providing a table to show the input values is strongly recommended. | Not reported |
| Incremental costs and outcomes | For each intervention, report mean values for the main categories of estimated costs and outcomes of interest, as well as mean differences between the comparator groups. If applicable, report incremental cost‐effectiveness ratios. | Abstract A325 |
| Characterising uncertainty | Single study‐based economic evaluation: Describe the effects of sampling uncertainty for the estimated incremental cost and incremental effectiveness parameters, together with the impact of methodological assumptions (such as discount rate, study perspective). | Not reported |
| Model‐based economic evaluation: Describe the effects on the results of uncertainty for all input parameters, and uncertainty related to the structure of the model and assumptions. | Not applicable | |
| Characterising heterogeneity | If applicable, report differences in costs, outcomes, or cost‐effectiveness that can be explained by variations between subgroups of patients with different baseline characteristics or other observed variability in effects that are not reducible by more information. | Not reported |
| Discussion | ||
| Study findings, limitations, generalisability, and current knowledge | Summarise key study findings and describe how they support the conclusions reached. Discuss limitations and the generalisability of the findings and how the findings fit with current knowledge. | Not reported |
| Other | ||
| Source of funding | Describe how the study was funded and the role of the funder in the identification, design, conduct, and reporting of the analysis. Describe other non‐monetary sources of support. | 1716 |
| Conflicts of interest | Describe any potential for conflict of interest of study contributors in accordance with journal policy. In the absence of a journal policy, we recommend authors comply with International Committee of Medical Journal Editors recommendations. | 1716 |
| Eccles 2007 | ||
| Title | Identify the study as an economic evaluation or use more specific terms such as “cost‐effectiveness analysis”, and describe the interventions compared. | Not reported |
| Abstract | Provide a structured summary of objectives, perspective, setting, methods (including study design and inputs), results (including base case and uncertainty analyses), and conclusions. | Not reported |
| Introduction | ||
| Background and objectives | Provide an explicit statement of the broader context for the study. | 2 |
| Present the study question and its relevance for health policy or practice decisions. | 2 | |
| Methods | ||
| Target population and subgroups | Describe characteristics of the base case population and subgroups analysed, including why they were chosen. | 2 |
| Setting and location | State relevant aspects of the system(s) in which the decision(s) need(s) to be made. | 2 |
| Study perspective | Describe the perspective of the study and relate this to the costs being evaluated. | 4 |
| Comparators | Describe the interventions or strategies being compared and state why they were chosen. | 4 |
| Time horizon | State the time horizon(s) over which costs and consequences are being evaluated and say why appropriate. | 4 |
| Discount rate | Report the choice of discount rate(s) used for costs and outcomes and say why appropriate. | |
| Choice of health outcomes | Describe what outcomes were used as the measure(s) of benefit in the evaluation and their relevance for the type of analysis performed. | 3 |
| Measurement of effectiveness | Single study‐based estimates: Describe fully the design features of the single effectiveness study and why the single study was a sufficient source of clinical effectiveness data. | Not reported |
| Synthesis‐based estimates: Describe fully the methods used for identification of included studies and synthesis of clinical effectiveness data. | Not reported | |
| Measurement and valuation of preference based outcomes | If applicable, describe the population and methods used to elicit preferences for outcomes. | 3 |
| Estimating resources and costs | Single study‐based economic evaluation: Describe approaches used to estimate resource use associated with the alternative interventions. Describe primary or secondary research methods for valuing each resource item in terms of its unit cost. Describe any adjustments made to approximate to opportunity costs. | 3 |
| Currency, price date, and conversion | Report the dates of the estimated resource quantities and unit costs. Describe methods for adjusting estimated unit costs to the year of reported costs if necessary. Describe methods for converting costs into a common currency base and the exchange rate. | 4 |
| Choice of model | Describe and give reasons for the specific type of decision‐analytical model used. Providing a figure to show model structure is strongly recommended. | Not reported |
| Assumptions | Describe all structural or other assumptions underpinning the decision‐analytical model. | Not reported |
| Analytical methods | Describe all analytical methods supporting the evaluation. This could include methods for dealing with skewed, missing, or censored data; extrapolation methods; methods for pooling data; approaches to validate or make adjustments (such as half cycle corrections) to a model; and methods for handling population heterogeneity and uncertainty. | Not reported |
| Results | ||
| Study parameters | Report the values, ranges, references, and, if used, probability distributions for all parameters. Report reasons or sources for distributions used to represent uncertainty where appropriate. Providing a table to show the input values is strongly recommended. | Not reportted |
| Incremental costs and outcomes | For each intervention, report mean values for the main categories of estimated costs and outcomes of interest, as well as mean differences between the comparator groups. If applicable, report incremental cost‐effectiveness ratios. | 8 ‐ 12 |
| Characterising uncertainty | Single study‐based economic evaluation: Describe the effects of sampling uncertainty for the estimated incremental cost and incremental effectiveness parameters, together with the impact of methodological assumptions (such as discount rate, study perspective). | Not reported |
| Model‐based economic evaluation: Describe the effects on the results of uncertainty for all input parameters, and uncertainty related to the structure of the model and assumptions. | Not reported | |
| Characterising heterogeneity | If applicable, report differences in costs, outcomes, or cost‐effectiveness that can be explained by variations between subgroups of patients with different baseline characteristics or other observed variability in effects that are not reducible by more information. | Not reported |
| Discussion | ||
| Study findings, limitations, generalisability, and current knowledge | Summarise key study findings and describe how they support the conclusions reached. Discuss limitations and the generalisability of the findings and how the findings fit with current knowledge. | 6, 10 |
| Other | ||
| Source of funding | Describe how the study was funded and the role of the funder in the identification, design, conduct, and reporting of the analysis. Describe other non‐monetary sources of support. | 11 |
| Conflicts of interest | Describe any potential for conflict of interest of study contributors in accordance with journal policy. In the absence of a journal policy, we recommend authors comply with International Committee of Medical Journal Editors recommendations. | 11 |
| Frei 2014 | ||
| Title | Identify the study as an economic evaluation or use more specific terms such as “cost‐effectiveness analysis”, and describe the interventions compared. | Not reported |
| Abstract | Provide a structured summary of objectives, perspective, setting, methods (including study design and inputs), results (including base case and uncertainty analyses), and conclusions. | Not reported |
| Introduction | ||
| Background and objectives | Provide an explicit statement of the broader context for the study. | 1040 |
| Present the study question and its relevance for health policy or practice decisions. | 1040 | |
| Methods | ||
| Target population and subgroups | Describe characteristics of the base case population and subgroups analysed, including why they were chosen. | 1043 |
| Setting and location | State relevant aspects of the system(s) in which the decision(s) need(s) to be made. | 1040 |
| Study perspective | Describe the perspective of the study and relate this to the costs being evaluated. | Not reported |
| Comparators | Describe the interventions or strategies being compared and state why they were chosen. | 1040 |
| Time horizon | State the time horizon(s) over which costs and consequences are being evaluated and say why appropriate. | Not reported |
| Discount rate | Report the choice of discount rate(s) used for costs and outcomes and say why appropriate. | Not reported |
| Choice of health outcomes | Describe what outcomes were used as the measure(s) of benefit in the evaluation and their relevance for the type of analysis performed. | Not reported |
| Measurement of effectiveness | Single study‐based estimates: Describe fully the design features of the single effectiveness study and why the single study was a sufficient source of clinical effectiveness data. | Not reported |
| Synthesis‐based estimates: Describe fully the methods used for identification of included studies and synthesis of clinical effectiveness data. | Not applicable | |
| Measurement and valuation of preference based outcomes | If applicable, describe the population and methods used to elicit preferences for outcomes. | Not reported |
| Estimating resources and costs | Single study‐based economic evaluation: Describe approaches used to estimate resource use associated with the alternative interventions. Describe primary or secondary research methods for valuing each resource item in terms of its unit cost. Describe any adjustments made to approximate to opportunity costs. | Not reported |
| Currency, price date, and conversion | Report the dates of the estimated resource quantities and unit costs. Describe methods for adjusting estimated unit costs to the year of reported costs if necessary. Describe methods for converting costs into a common currency base and the exchange rate. | Not reported |
| Choice of model | Describe and give reasons for the specific type of decision‐analytical model used. Providing a figure to show model structure is strongly recommended. | Not applicable |
| Assumptions | Describe all structural or other assumptions underpinning the decision‐analytical model. | Not applicable |
| Analytical methods | Describe all analytical methods supporting the evaluation. This could include methods for dealing with skewed, missing, or censored data; extrapolation methods; methods for pooling data; approaches to validate or make adjustments (such as half cycle corrections) to a model; and methods for handling population heterogeneity and uncertainty. | Not applicable |
| Results | ||
| Study parameters | Report the values, ranges, references, and, if used, probability distributions for all parameters. Report reasons or sources for distributions used to represent uncertainty where appropriate. Providing a table to show the input values is strongly recommended. | Not reported |
| Incremental costs and outcomes | For each intervention, report mean values for the main categories of estimated costs and outcomes of interest, as well as mean differences between the comparator groups. If applicable, report incremental cost‐effectiveness ratios. | Not reported |
| Characterising uncertainty | Single study‐based economic evaluation: Describe the effects of sampling uncertainty for the estimated incremental cost and incremental effectiveness parameters, together with the impact of methodological assumptions (such as discount rate, study perspective). | Not reported |
| Model‐based economic evaluation: Describe the effects on the results of uncertainty for all input parameters, and uncertainty related to the structure of the model and assumptions. | Not applicable | |
| Characterising heterogeneity | If applicable, report differences in costs, outcomes, or cost‐effectiveness that can be explained by variations between subgroups of patients with different baseline characteristics or other observed variability in effects that are not reducible by more information. | Not reported |
| Discussion | ||
| Study findings, limitations, generalisability, and current knowledge | Summarise key study findings and describe how they support the conclusions reached. Discuss limitations and the generalisability of the findings and how the findings fit with current knowledge. | 1045 |
| Other | ||
| Source of funding | Describe how the study was funded and the role of the funder in the identification, design, conduct, and reporting of the analysis. Describe other non‐monetary sources of support. | 1045 |
| Conflicts of interest | Describe any potential for conflict of interest of study contributors in accordance with journal policy. In the absence of a journal policy, we recommend authors comply with International Committee of Medical Journal Editors recommendations. | 1045 |
| Frijling 2002 | ||
| Title | Identify the study as an economic evaluation or use more specific terms such as “cost‐effectiveness analysis”, and describe the interventions compared. | Not reported |
| Abstract | Provide a structured summary of objectives, perspective, setting, methods (including study design and inputs), results (including base case and uncertainty analyses), and conclusions. | Not reported |
| Introduction | ||
| Background and objectives | Provide an explicit statement of the broader context for the study. | 837 |
| Present the study question and its relevance for health policy or practice decisions. | 837 | |
| Methods | ||
| Target population and subgroups | Describe characteristics of the base case population and subgroups analysed, including why they were chosen. | 838 |
| Setting and location | State relevant aspects of the system(s) in which the decision(s) need(s) to be made. | 838 |
| Study perspective | Describe the perspective of the study and relate this to the costs being evaluated. | Not reported |
| Comparators | Describe the interventions or strategies being compared and state why they were chosen. | 837 |
| Time horizon | State the time horizon(s) over which costs and consequences are being evaluated and say why appropriate. | Not reported |
| Discount rate | Report the choice of discount rate(s) used for costs and outcomes and say why appropriate. | Not reported |
| Choice of health outcomes | Describe what outcomes were used as the measure(s) of benefit in the evaluation and their relevance for the type of analysis performed. | Not reported |
| Measurement of effectiveness | Single study‐based estimates: Describe fully the design features of the single effectiveness study and why the single study was a sufficient source of clinical effectiveness data. | Not reported |
| Synthesis‐based estimates: Describe fully the methods used for identification of included studies and synthesis of clinical effectiveness data. | Not applicable | |
| Measurement and valuation of preference based outcomes | If applicable, describe the population and methods used to elicit preferences for outcomes. | Not reported |
| Estimating resources and costs | Single study‐based economic evaluation: Describe approaches used to estimate resource use associated with the alternative interventions. Describe primary or secondary research methods for valuing each resource item in terms of its unit cost. Describe any adjustments made to approximate to opportunity costs. | Not reported |
| Currency, price date, and conversion | Report the dates of the estimated resource quantities and unit costs. Describe methods for adjusting estimated unit costs to the year of reported costs if necessary. Describe methods for converting costs into a common currency base and the exchange rate. | Not reported |
| Choice of model | Describe and give reasons for the specific type of decision‐analytical model used. Providing a figure to show model structure is strongly recommended. | Not applicable |
| Assumptions | Describe all structural or other assumptions underpinning the decision‐analytical model. | Not applicable |
| Analytical methods | Describe all analytical methods supporting the evaluation. This could include methods for dealing with skewed, missing, or censored data; extrapolation methods; methods for pooling data; approaches to validate or make adjustments (such as half cycle corrections) to a model; and methods for handling population heterogeneity and uncertainty. | Not reported |
| Results | ||
| Study parameters | Report the values, ranges, references, and, if used, probability distributions for all parameters. Report reasons or sources for distributions used to represent uncertainty where appropriate. Providing a table to show the input values is strongly recommended. | Not reported |
| Incremental costs and outcomes | For each intervention, report mean values for the main categories of estimated costs and outcomes of interest, as well as mean differences between the comparator groups. If applicable, report incremental cost‐effectiveness ratios. | Not reported |
| Characterising uncertainty | Single study‐based economic evaluation: Describe the effects of sampling uncertainty for the estimated incremental cost and incremental effectiveness parameters, together with the impact of methodological assumptions (such as discount rate, study perspective). | Not reported |
| Model‐based economic evaluation: Describe the effects on the results of uncertainty for all input parameters, and uncertainty related to the structure of the model and assumptions. | Not applicable | |
| Characterising heterogeneity | If applicable, report differences in costs, outcomes, or cost‐effectiveness that can be explained by variations between subgroups of patients with different baseline characteristics or other observed variability in effects that are not reducible by more information. | Not applicable |
| Discussion | ||
| Study findings, limitations, generalisability, and current knowledge | Summarise key study findings and describe how they support the conclusions reached. Discuss limitations and the generalisability of the findings and how the findings fit with current knowledge. | 841 |
| Other | ||
| Source of funding | Describe how the study was funded and the role of the funder in the identification, design, conduct, and reporting of the analysis. Describe other non‐monetary sources of support. | 841 |
| Conflicts of interest | Describe any potential for conflict of interest of study contributors in accordance with journal policy. In the absence of a journal policy, we recommend authors comply with International Committee of Medical Journal Editors recommendations. | Not reported |
| Krein 2004 | ||
| Title | Identify the study as an economic evaluation or use more specific terms such as “cost‐effectiveness analysis”, and describe the interventions compared. | Not reported |
| Abstract | Provide a structured summary of objectives, perspective, setting, methods (including study design and inputs), results (including base case and uncertainty analyses), and conclusions. | Not reported |
| Introduction | ||
| Background and objectives | Provide an explicit statement of the broader context for the study. | 732 |
| Present the study question and its relevance for health policy or practice decisions. | 732 | |
| Methods | ||
| Target population and subgroups | Describe characteristics of the base case population and subgroups analysed, including why they were chosen. | 733 |
| Setting and location | State relevant aspects of the system(s) in which the decision(s) need(s) to be made. | 733 |
| Study perspective | Describe the perspective of the study and relate this to the costs being evaluated. | Not reported |
| Comparators | Describe the interventions or strategies being compared and state why they were chosen. | 733 |
| Time horizon | State the time horizon(s) over which costs and consequences are being evaluated and say why appropriate. | Not reported |
| Discount rate | Report the choice of discount rate(s) used for costs and outcomes and say why appropriate. | Not reported |
| Choice of health outcomes | Describe what outcomes were used as the measure(s) of benefit in the evaluation and their relevance for the type of analysis performed. | Not reported |
| Measurement of effectiveness | Single study‐based estimates: Describe fully the design features of the single effectiveness study and why the single study was a sufficient source of clinical effectiveness data. | Not reported |
| Synthesis‐based estimates: Describe fully the methods used for identification of included studies and synthesis of clinical effectiveness data. | ||
| Measurement and valuation of preference based outcomes | If applicable, describe the population and methods used to elicit preferences for outcomes. | Not reported |
| Estimating resources and costs | Single study‐based economic evaluation: Describe approaches used to estimate resource use associated with the alternative interventions. Describe primary or secondary research methods for valuing each resource item in terms of its unit cost. Describe any adjustments made to approximate to opportunity costs. | Not reported |
| Currency, price date, and conversion | Report the dates of the estimated resource quantities and unit costs. Describe methods for adjusting estimated unit costs to the year of reported costs if necessary. Describe methods for converting costs into a common currency base and the exchange rate. | Not reported |
| Choice of model | Describe and give reasons for the specific type of decision‐analytical model used. Providing a figure to show model structure is strongly recommended. | |
| Assumptions | Describe all structural or other assumptions underpinning the decision‐analytical model. | Not reported |
| Analytical methods | Describe all analytical methods supporting the evaluation. This could include methods for dealing with skewed, missing, or censored data; extrapolation methods; methods for pooling data; approaches to validate or make adjustments (such as half cycle corrections) to a model; and methods for handling population heterogeneity and uncertainty. | Not reported |
| Results | ||
| Study parameters | Report the values, ranges, references, and, if used, probability distributions for all parameters. Report reasons or sources for distributions used to represent uncertainty where appropriate. Providing a table to show the input values is strongly recommended. | Not reported |
| Incremental costs and outcomes | For each intervention, report mean values for the main categories of estimated costs and outcomes of interest, as well as mean differences between the comparator groups. If applicable, report incremental cost‐effectiveness ratios. | Not reported |
| Characterising uncertainty | Single study‐based economic evaluation: Describe the effects of sampling uncertainty for the estimated incremental cost and incremental effectiveness parameters, together with the impact of methodological assumptions (such as discount rate, study perspective). | Not reported |
| Model‐based economic evaluation: Describe the effects on the results of uncertainty for all input parameters, and uncertainty related to the structure of the model and assumptions. | Not applicable | |
| Characterising heterogeneity | If applicable, report differences in costs, outcomes, or cost‐effectiveness that can be explained by variations between subgroups of patients with different baseline characteristics or other observed variability in effects that are not reducible by more information. | Not applicable |
| Discussion | ||
| Study findings, limitations, generalisability, and current knowledge | Summarise key study findings and describe how they support the conclusions reached. Discuss limitations and the generalisability of the findings and how the findings fit with current knowledge. | 738 |
| Other | ||
| Source of funding | Describe how the study was funded and the role of the funder in the identification, design, conduct, and reporting of the analysis. Describe other non‐monetary sources of support. | 732 |
| Conflicts of interest | Describe any potential for conflict of interest of study contributors in accordance with journal policy. In the absence of a journal policy, we recommend authors comply with International Committee of Medical Journal Editors recommendations. | Not reported |
| Litaker 2003 | ||
| Title | Identify the study as an economic evaluation or use more specific terms such as “cost‐effectiveness analysis”, and describe the interventions compared. | front page |
| Abstract | Provide a structured summary of objectives, perspective, setting, methods (including study design and inputs), results (including base case and uncertainty analyses), and conclusions. | Not reported |
| Introduction | ||
| Background and objectives | Provide an explicit statement of the broader context for the study. | 224 |
| Present the study question and its relevance for health policy or practice decisions. | 224 | |
| Methods | ||
| Target population and subgroups | Describe characteristics of the base case population and subgroups analysed, including why they were chosen. | 225 |
| Setting and location | State relevant aspects of the system(s) in which the decision(s) need(s) to be made. | 225 |
| Study perspective | Describe the perspective of the study and relate this to the costs being evaluated. | Not reported |
| Comparators | Describe the interventions or strategies being compared and state why they were chosen. | 226 |
| Time horizon | State the time horizon(s) over which costs and consequences are being evaluated and say why appropriate. | Not reported |
| Discount rate | Report the choice of discount rate(s) used for costs and outcomes and say why appropriate. | Not reported |
| Choice of health outcomes | Describe what outcomes were used as the measure(s) of benefit in the evaluation and their relevance for the type of analysis performed. | Not reported |
| Measurement of effectiveness | Single study‐based estimates: Describe fully the design features of the single effectiveness study and why the single study was a sufficient source of clinical effectiveness data. | Not reported |
| Synthesis‐based estimates: Describe fully the methods used for identification of included studies and synthesis of clinical effectiveness data. | Not reported | |
| Measurement and valuation of preference based outcomes | If applicable, describe the population and methods used to elicit preferences for outcomes. | 226 |
| Estimating resources and costs | Single study‐based economic evaluation: Describe approaches used to estimate resource use associated with the alternative interventions. Describe primary or secondary research methods for valuing each resource item in terms of its unit cost. Describe any adjustments made to approximate to opportunity costs. | Not reported |
| Currency, price date, and conversion | Report the dates of the estimated resource quantities and unit costs. Describe methods for adjusting estimated unit costs to the year of reported costs if necessary. Describe methods for converting costs into a common currency base and the exchange rate. | Not reported |
| Choice of model | Describe and give reasons for the specific type of decision‐analytical model used. Providing a figure to show model structure is strongly recommended. | Not applicable |
| Assumptions | Describe all structural or other assumptions underpinning the decision‐analytical model. | Not applicable |
| Analytical methods | Describe all analytical methods supporting the evaluation. This could include methods for dealing with skewed, missing, or censored data; extrapolation methods; methods for pooling data; approaches to validate or make adjustments (such as half cycle corrections) to a model; and methods for handling population heterogeneity and uncertainty. | Not applicable |
| Results | ||
| Study parameters | Report the values, ranges, references, and, if used, probability distributions for all parameters. Report reasons or sources for distributions used to represent uncertainty where appropriate. Providing a table to show the input values is strongly recommended. | Not reported |
| Incremental costs and outcomes | For each intervention, report mean values for the main categories of estimated costs and outcomes of interest, as well as mean differences between the comparator groups. If applicable, report incremental cost‐effectiveness ratios. | Not reported |
| Characterising uncertainty | Single study‐based economic evaluation: Describe the effects of sampling uncertainty for the estimated incremental cost and incremental effectiveness parameters, together with the impact of methodological assumptions (such as discount rate, study perspective). | Not reported |
| Model‐based economic evaluation: Describe the effects on the results of uncertainty for all input parameters, and uncertainty related to the structure of the model and assumptions. | Not applicable | |
| Characterising heterogeneity | If applicable, report differences in costs, outcomes, or cost‐effectiveness that can be explained by variations between subgroups of patients with different baseline characteristics or other observed variability in effects that are not reducible by more information. | 232 |
| Discussion | ||
| Study findings, limitations, generalisability, and current knowledge | Summarise key study findings and describe how they support the conclusions reached. Discuss limitations and the generalisability of the findings and how the findings fit with current knowledge. | 234 |
| Other | ||
| Source of funding | Describe how the study was funded and the role of the funder in the identification, design, conduct, and reporting of the analysis. Describe other non‐monetary sources of support. | 235 |
| Conflicts of interest | Describe any potential for conflict of interest of study contributors in accordance with journal policy. In the absence of a journal policy, we recommend authors comply with International Committee of Medical Journal Editors recommendations. | Not reported |
| McCall 2011 | ||
| Title | Identify the study as an economic evaluation or use more specific terms such as “cost‐effectiveness analysis”, and describe the interventions compared. | Not reported |
| Abstract | Provide a structured summary of objectives, perspective, setting, methods (including study design and inputs), results (including base case and uncertainty analyses), and conclusions. | Not reported |
| Introduction | ||
| Background and objectives | Provide an explicit statement of the broader context for the study. | 1705 |
| Present the study question and its relevance for health policy or practice decisions. | 1706 | |
| Methods | ||
| Target population and subgroups | Describe characteristics of the base case population and subgroups analysed, including why they were chosen. | 1708 |
| Setting and location | State relevant aspects of the system(s) in which the decision(s) need(s) to be made. | 1705 |
| Study perspective | Describe the perspective of the study and relate this to the costs being evaluated. | Not reported |
| Comparators | Describe the interventions or strategies being compared and state why they were chosen. | Not reported |
| Time horizon | State the time horizon(s) over which costs and consequences are being evaluated and say why appropriate. | Not reported |
| Discount rate | Report the choice of discount rate(s) used for costs and outcomes and say why appropriate. | Not reported |
| Choice of health outcomes | Describe what outcomes were used as the measure(s) of benefit in the evaluation and their relevance for the type of analysis performed. | Not reported |
| Measurement of effectiveness | Single study‐based estimates: Describe fully the design features of the single effectiveness study and why the single study was a sufficient source of clinical effectiveness data. | Not reported |
| Synthesis‐based estimates: Describe fully the methods used for identification of included studies and synthesis of clinical effectiveness data. | Not applicable | |
| Measurement and valuation of preference based outcomes | If applicable, describe the population and methods used to elicit preferences for outcomes. | Not applicable |
| Estimating resources and costs | Single study‐based economic evaluation: Describe approaches used to estimate resource use associated with the alternative interventions. Describe primary or secondary research methods for valuing each resource item in terms of its unit cost. Describe any adjustments made to approximate to opportunity costs. | Not reported |
| Currency, price date, and conversion | Report the dates of the estimated resource quantities and unit costs. Describe methods for adjusting estimated unit costs to the year of reported costs if necessary. Describe methods for converting costs into a common currency base and the exchange rate. | Not reported |
| Choice of model | Describe and give reasons for the specific type of decision‐analytical model used. Providing a figure to show model structure is strongly recommended. | Not applicable |
| Assumptions | Describe all structural or other assumptions underpinning the decision‐analytical model. | Not applicable |
| Analytical methods | Describe all analytical methods supporting the evaluation. This could include methods for dealing with skewed, missing, or censored data; extrapolation methods; methods for pooling data; approaches to validate or make adjustments (such as half cycle corrections) to a model; and methods for handling population heterogeneity and uncertainty. | Not applicable |
| Results | ||
| Study parameters | Report the values, ranges, references, and, if used, probability distributions for all parameters. Report reasons or sources for distributions used to represent uncertainty where appropriate. Providing a table to show the input values is strongly recommended. | Not reported |
| Incremental costs and outcomes | For each intervention, report mean values for the main categories of estimated costs and outcomes of interest, as well as mean differences between the comparator groups. If applicable, report incremental cost‐effectiveness ratios. | Not reported |
| Characterising uncertainty | Single study‐based economic evaluation: Describe the effects of sampling uncertainty for the estimated incremental cost and incremental effectiveness parameters, together with the impact of methodological assumptions (such as discount rate, study perspective). | Not reported |
| Model‐based economic evaluation: Describe the effects on the results of uncertainty for all input parameters, and uncertainty related to the structure of the model and assumptions | Not applicable | |
| Characterising heterogeneity | If applicable, report differences in costs, outcomes, or cost‐effectiveness that can be explained by variations between subgroups of patients with different baseline characteristics or other observed variability in effects that are not reducible by more information. | Not applicable |
| Discussion | ||
| Study findings, limitations, generalisability, and current knowledge | Summarise key study findings and describe how they support the conclusions reached. Discuss limitations and the generalisability of the findings and how the findings fit with current knowledge. | 1712 |
| Other | ||
| Source of funding | Describe how the study was funded and the role of the funder in the identification, design, conduct, and reporting of the analysis. Describe other non‐monetary sources of support. | Not reported |
| Conflicts of interest | Describe any potential for conflict of interest of study contributors in accordance with journal policy. In the absence of a journal policy, we recommend authors comply with International Committee of Medical Journal Editors recommendations. | Not reported |
| Piette 2001 | ||
| Title | Identify the study as an economic evaluation or use more specific terms such as “cost‐effectiveness analysis”, and describe the interventions compared. | Not reported |
| Abstract | Provide a structured summary of objectives, perspective, setting, methods (including study design and inputs), results (including base case and uncertainty analyses), and conclusions. | Not reported |
| Introduction | ||
| Background and objectives | Provide an explicit statement of the broader context for the study. | 202 ‐ 203 |
| Present the study question and its relevance for health policy or practice decisions. | Not reported | |
| Methods | ||
| Target population and subgroups | Describe characteristics of the base case population and subgroups analysed, including why they were chosen. | 204 |
| Setting and location | State relevant aspects of the system(s) in which the decision(s) need(s) to be made. | 203 |
| Study perspective | Describe the perspective of the study and relate this to the costs being evaluated. | Not reported |
| Comparators | Describe the interventions or strategies being compared and state why they were chosen. | 177 |
| Time horizon | State the time horizon(s) over which costs and consequences are being evaluated and say why appropriate. | Not reported |
| Discount rate | Report the choice of discount rate(s) used for costs and outcomes and say why appropriate. | Not reported |
| Choice of health outcomes | Describe what outcomes were used as the measure(s) of benefit in the evaluation and their relevance for the type of analysis performed. | Not reported |
| Measurement of effectiveness | Single study‐based estimates: Describe fully the design features of the single effectiveness study and why the single study was a sufficient source of clinical effectiveness data. | Not reported |
| Synthesis‐based estimates: Describe fully the methods used for identification of included studies and synthesis of clinical effectiveness data. | Not applicable | |
| Measurement and valuation of preference based outcomes | If applicable, describe the population and methods used to elicit preferences for outcomes. | Not applicable |
| Estimating resources and costs | Single study‐based economic evaluation: Describe approaches used to estimate resource use associated with the alternative interventions. Describe primary or secondary research methods for valuing each resource item in terms of its unit cost. Describe any adjustments made to approximate to opportunity costs. | Not reported |
| Currency, price date, and conversion | Report the dates of the estimated resource quantities and unit costs. Describe methods for adjusting estimated unit costs to the year of reported costs if necessary. Describe methods for converting costs into a common currency base and the exchange rate. | Not reported |
| Choice of model | Describe and give reasons for the specific type of decision‐analytical model used. Providing a figure to show model structure is strongly recommended. | Not applicable |
| Assumptions | Describe all structural or other assumptions underpinning the decision‐analytical model. | Not applicable |
| Analytical methods | Describe all analytical methods supporting the evaluation. This could include methods for dealing with skewed, missing, or censored data; extrapolation methods; methods for pooling data; approaches to validate or make adjustments (such as half cycle corrections) to a model; and methods for handling population heterogeneity and uncertainty. | Not applicable |
| Results | ||
| Study parameters | Report the values, ranges, references, and, if used, probability distributions for all parameters. Report reasons or sources for distributions used to represent uncertainty where appropriate. Providing a table to show the input values is strongly recommended. | Not reported |
| Incremental costs and outcomes | For each intervention, report mean values for the main categories of estimated costs and outcomes of interest, as well as mean differences between the comparator groups. If applicable, report incremental cost‐effectiveness ratios. | Not reported |
| Characterising uncertainty | Single study‐based economic evaluation: Describe the effects of sampling uncertainty for the estimated incremental cost and incremental effectiveness parameters, together with the impact of methodological assumptions (such as discount rate, study perspective). | Not reported |
| Model‐based economic evaluation: Describe the effects on the results of uncertainty for all input parameters, and uncertainty related to the structure of the model and assumptions. | Not applicable | |
| Characterising heterogeneity | If applicable, report differences in costs, outcomes, or cost‐effectiveness that can be explained by variations between subgroups of patients with different baseline characteristics or other observed variability in effects that are not reducible by more information. | Not reported |
| Discussion | ||
| Study findings, limitations, generalisability, and current knowledge | Summarise key study findings and describe how they support the conclusions reached. Discuss limitations and the generalisability of the findings and how the findings fit with current knowledge. | 207 |
| Other | ||
| Source of funding | Describe how the study was funded and the role of the funder in the identification, design, conduct, and reporting of the analysis. Describe other non‐monetary sources of support. | 207 |
| Conflicts of interest | Describe any potential for conflict of interest of study contributors in accordance with journal policy. In the absence of a journal policy, we recommend authors comply with International Committee of Medical Journal Editors recommendations. | Not reported |
| Pizzi 2015 | ||
| Title | Identify the study as an economic evaluation or use more specific terms such as “cost‐effectiveness analysis”, and describe the interventions compared. | front page |
| Abstract | Provide a structured summary of objectives, perspective, setting, methods (including study design and inputs), results (including base case and uncertainty analyses), and conclusions. | front page |
| Introduction | ||
| Background and objectives | Provide an explicit statement of the broader context for the study. | 254 |
| Present the study question and its relevance for health policy or practice decisions. | 254 | |
| Methods | ||
| Target population and subgroups | Describe characteristics of the base case population and subgroups analysed, including why they were chosen. | 254 |
| Setting and location | State relevant aspects of the system(s) in which the decision(s) need(s) to be made. | 254 |
| Study perspective | Describe the perspective of the study and relate this to the costs being evaluated. | 255 |
| Comparators | Describe the interventions or strategies being compared and state why they were chosen. | 254 |
| Time horizon | State the time horizon(s) over which costs and consequences are being evaluated and say why appropriate. | 256 |
| Discount rate | Report the choice of discount rate(s) used for costs and outcomes and say why appropriate. | 256 |
| Choice of health outcomes | Describe what outcomes were used as the measure(s) of benefit in the evaluation and their relevance for the type of analysis performed. | 255 |
| Measurement of effectiveness | Single study‐based estimates: Describe fully the design features of the single effectiveness study and why the single study was a sufficient source of clinical effectiveness data. | 254 ‐ 255 |
| Synthesis‐based estimates: Describe fully the methods used for identification of included studies and synthesis of clinical effectiveness data. | Not reported | |
| Measurement and valuation of preference based outcomes | If applicable, describe the population and methods used to elicit preferences for outcomes. | Not applicable |
| Estimating resources and costs | Single study‐based economic evaluation: Describe approaches used to estimate resource use associated with the alternative interventions. Describe primary or secondary research methods for valuing each resource item in terms of its unit cost. Describe any adjustments made to approximate to opportunity costs. | 256 |
| Currency, price date, and conversion | Report the dates of the estimated resource quantities and unit costs. Describe methods for adjusting estimated unit costs to the year of reported costs if necessary. Describe methods for converting costs into a common currency base and the exchange rate. | 256 |
| Choice of model | Describe and give reasons for the specific type of decision‐analytical model used. Providing a figure to show model structure is strongly recommended. | 256 |
| Assumptions | Describe all structural or other assumptions underpinning the decision‐analytical model. | 256 ‐ 257 |
| Analytical methods | Describe all analytical methods supporting the evaluation. This could include methods for dealing with skewed, missing, or censored data; extrapolation methods; methods for pooling data; approaches to validate or make adjustments (such as half cycle corrections) to a model; and methods for handling population heterogeneity and uncertainty. | 256 |
| Results | ||
| Study parameters | Report the values, ranges, references, and, if used, probability distributions for all parameters. Report reasons or sources for distributions used to represent uncertainty where appropriate. Providing a table to show the input values is strongly recommended. | 258 ‐ 259 |
| Incremental costs and outcomes | For each intervention, report mean values for the main categories of estimated costs and outcomes of interest, as well as mean differences between the comparator groups. If applicable, report incremental cost‐effectiveness ratios. | 260 |
| Characterising uncertainty | Single study‐based economic evaluation: Describe the effects of sampling uncertainty for the estimated incremental cost and incremental effectiveness parameters, together with the impact of methodological assumptions (such as discount rate, study perspective). | 258 ‐ 260 |
| Model‐based economic evaluation: Describe the effects on the results of uncertainty for all input parameters, and uncertainty related to the structure of the model and assumptions. | Not reported | |
| Characterising heterogeneity | If applicable, report differences in costs, outcomes, or cost‐effectiveness that can be explained by variations between subgroups of patients with different baseline characteristics or other observed variability in effects that are not reducible by more information. | 258 ‐ 260 |
| Discussion | ||
| Study findings, limitations, generalisability, and current knowledge | Summarise key study findings and describe how they support the conclusions reached. Discuss limitations and the generalisability of the findings and how the findings fit with current knowledge. | 261 ‐ 262 |
| Other | ||
| Source of funding | Describe how the study was funded and the role of the funder in the identification, design, conduct, and reporting of the analysis. Describe other non‐monetary sources of support. | 263 |
| Conflicts of interest | Describe any potential for conflict of interest of study contributors in accordance with journal policy. In the absence of a journal policy, we recommend authors comply with International Committee of Medical Journal Editors recommendations. | 263 |
| Prezio 2014 | ||
| Title | Identify the study as an economic evaluation or use more specific terms such as “cost‐effectiveness analysis”, and describe the interventions compared. | 771 |
| Abstract | Provide a structured summary of objectives, perspective, setting, methods (including study design and inputs), results (including base case and uncertainty analyses), and conclusions. | 771 |
| Introduction | ||
| Background and objectives | Provide an explicit statement of the broader context for the study. | 772 |
| Present the study question and its relevance for health policy or practice decisions. | 772 | |
| Methods | ||
| Target population and subgroups | Describe characteristics of the base case population and subgroups analysed, including why they were chosen. | 772 |
| Setting and location | State relevant aspects of the system(s) in which the decision(s) need(s) to be made. | 772 |
| Study perspective | Describe the perspective of the study and relate this to the costs being evaluated. | 772 |
| Comparators | Describe the interventions or strategies being compared and state why they were chosen. | 772 |
| Time horizon | State the time horizon(s) over which costs and consequences are being evaluated and say why appropriate. | 772 |
| Discount rate | Report the choice of discount rate(s) used for costs and outcomes and say why appropriate. | 772 |
| Choice of health outcomes | Describe what outcomes were used as the measure(s) of benefit in the evaluation and their relevance for the type of analysis performed. | 774 |
| Measurement of effectiveness | Single study‐based estimates: Describe fully the design features of the single effectiveness study and why the single study was a sufficient source of clinical effectiveness data. | 772 |
| Synthesis‐based estimates: Describe fully the methods used for identification of included studies and synthesis of clinical effectiveness data. | Not reported | |
| Measurement and valuation of preference based outcomes | If applicable, describe the population and methods used to elicit preferences for outcomes. | Not applicable |
| Estimating resources and costs | Single study‐based economic evaluation: Describe approaches used to estimate resource use associated with the alternative interventions. Describe primary or secondary research methods for valuing each resource item in terms of its unit cost. Describe any adjustments made to approximate to opportunity costs. | 772 |
| Currency, price date, and conversion | Report the dates of the estimated resource quantities and unit costs. Describe methods for adjusting estimated unit costs to the year of reported costs if necessary. Describe methods for converting costs into a common currency base and the exchange rate. | 772 |
| Choice of model | Describe and give reasons for the specific type of decision‐analytical model used. Providing a figure to show model structure is strongly recommended. | 772 |
| Assumptions | Describe all structural or other assumptions underpinning the decision‐analytical model. | 772 ‐ 774 |
| Analytical methods | Describe all analytical methods supporting the evaluation. This could include methods for dealing with skewed, missing, or censored data; extrapolation methods; methods for pooling data; approaches to validate or make adjustments (such as half cycle corrections) to a model; and methods for handling population heterogeneity and uncertainty. | 774 |
| Results | ||
| Study parameters | Report the values, ranges, references, and, if used, probability distributions for all parameters. Report reasons or sources for distributions used to represent uncertainty where appropriate. Providing a table to show the input values is strongly recommended. | 774 ‐ 776 |
| Incremental costs and outcomes | For each intervention, report mean values for the main categories of estimated costs and outcomes of interest, as well as mean differences between the comparator groups. If applicable, report incremental cost‐effectiveness ratios. | 777 |
| Characterising uncertainty | Single study‐based economic evaluation: Describe the effects of sampling uncertainty for the estimated incremental cost and incremental effectiveness parameters, together with the impact of methodological assumptions (such as discount rate, study perspective). | 776 ‐ 777 |
| Model‐based economic evaluation: Describe the effects on the results of uncertainty for all input parameters, and uncertainty related to the structure of the model and assumptions. | Not applicable | |
| Characterising heterogeneity | If applicable, report differences in costs, outcomes, or cost‐effectiveness that can be explained by variations between subgroups of patients with different baseline characteristics or other observed variability in effects that are not reducible by more information. | 777 |
| Discussion | ||
| Study findings, limitations, generalisability, and current knowledge | Summarise key study findings and describe how they support the conclusions reached. Discuss limitations and the generalisability of the findings and how the findings fit with current knowledge. | 775 |
| Other | ||
| Source of funding | Describe how the study was funded and the role of the funder in the identification, design, conduct, and reporting of the analysis. Describe other non‐monetary sources of support. | 778 |
| Conflicts of interest | Describe any potential for conflict of interest of study contributors in accordance with journal policy. In the absence of a journal policy, we recommend authors comply with International Committee of Medical Journal Editors recommendations. | 778 |
| Schechter 2008 | ||
| Title | Identify the study as an economic evaluation or use more specific terms such as “cost‐effectiveness analysis”, and describe the interventions compared. | 763 |
| Abstract | Provide a structured summary of objectives, perspective, setting, methods (including study design and inputs), results (including base case and uncertainty analyses), and conclusions. | 763 |
| Introduction | ||
| Background and objectives | Provide an explicit statement of the broader context for the study. | 763 ‐ 764 |
| Present the study question and its relevance for health policy or practice decisions. | 764 | |
| Methods | ||
| Target population and subgroups | Describe characteristics of the base case population and subgroups analysed, including why they were chosen. | 764 |
| Setting and location | State relevant aspects of the system(s) in which the decision(s) need(s) to be made. | 764 |
| Study perspective | Describe the perspective of the study and relate this to the costs being evaluated. | 764 |
| Comparators | Describe the interventions or strategies being compared and state why they were chosen. | 764 |
| Time horizon | State the time horizon(s) over which costs and consequences are being evaluated and say why appropriate. | 764 |
| Discount rate | Report the choice of discount rate(s) used for costs and outcomes and say why appropriate. | 765 |
| Choice of health outcomes | Describe what outcomes were used as the measure(s) of benefit in the evaluation and their relevance for the type of analysis performed. | 764 |
| Measurement of effectiveness | Single study‐based estimates: Describe fully the design features of the single effectiveness study and why the single study was a sufficient source of clinical effectiveness data. | 764 |
| Synthesis‐based estimates: Describe fully the methods used for identification of included studies and synthesis of clinical effectiveness data. | Not applicable | |
| Measurement and valuation of preference based outcomes | If applicable, describe the population and methods used to elicit preferences for outcomes. | 765 |
| Estimating resources and costs | Single study‐based economic evaluation: Describe approaches used to estimate resource use associated with the alternative interventions. Describe primary or secondary research methods for valuing each resource item in terms of its unit cost. Describe any adjustments made to approximate to opportunity costs. | 764 |
| Currency, price date, and conversion | Report the dates of the estimated resource quantities and unit costs. Describe methods for adjusting estimated unit costs to the year of reported costs if necessary. Describe methods for converting costs into a common currency base and the exchange rate. | 764 |
| Choice of model | Describe and give reasons for the specific type of decision‐analytical model used. Providing a figure to show model structure is strongly recommended. | Not applicable |
| Assumptions | Describe all structural or other assumptions underpinning the decision‐analytical model. | Not applicable |
| Analytical methods | Describe all analytical methods supporting the evaluation. This could include methods for dealing with skewed, missing, or censored data; extrapolation methods; methods for pooling data; approaches to validate or make adjustments (such as half cycle corrections) to a model; and methods for handling population heterogeneity and uncertainty. | 765 |
| Results | ||
| Study parameters | Report the values, ranges, references, and, if used, probability distributions for all parameters. Report reasons or sources for distributions used to represent uncertainty where appropriate. Providing a table to show the input values is strongly recommended. | 766 |
| Incremental costs and outcomes | For each intervention, report mean values for the main categories of estimated costs and outcomes of interest, as well as mean differences between the comparator groups. If applicable, report incremental cost‐effectiveness ratios. | 765 |
| Characterising uncertainty | Single study‐based economic evaluation: Describe the effects of sampling uncertainty for the estimated incremental cost and incremental effectiveness parameters, together with the impact of methodological assumptions (such as discount rate, study perspective) | 766 |
| Model‐based economic evaluation: Describe the effects on the results of uncertainty for all input parameters, and uncertainty related to the structure of the model and assumptions. | Not applicable | |
| Characterising heterogeneity | If applicable, report differences in costs, outcomes, or cost‐effectiveness that can be explained by variations between subgroups of patients with different baseline characteristics or other observed variability in effects that are not reducible by more information. | 765 |
| Discussion | ||
| Study findings, limitations, generalisability, and current knowledge | Summarise key study findings and describe how they support the conclusions reached. Discuss limitations and the generalisability of the findings and how the findings fit with current knowledge. | 767 |
| Other | ||
| Source of funding | Describe how the study was funded and the role of the funder in the identification, design, conduct, and reporting of the analysis. Describe other non‐monetary sources of support. | 767 |
| Conflicts of interest | Describe any potential for conflict of interest of study contributors in accordance with journal policy. In the absence of a journal policy, we recommend authors comply with International Committee of Medical Journal Editors recommendations. | 768 |
| Wagner 2001 | ||
| Title | Identify the study as an economic evaluation or use more specific terms such as “cost‐effectiveness analysis”, and describe the interventions compared. | Not reported |
| Abstract | Provide a structured summary of objectives, perspective, setting, methods (including study design and inputs), results (including base case and uncertainty analyses), and conclusions. | Not reported |
| Introduction | ||
| Background and objectives | Provide an explicit statement of the broader context for the study. | 695 |
| Present the study question and its relevance for health policy or practice decisions. | 695 | |
| Methods | ||
| Target population and subgroups | Describe characteristics of the base case population and subgroups analysed, including why they were chosen. | 697 |
| Setting and location | State relevant aspects of the system(s) in which the decision(s) need(s) to be made. | 695 ‐ 696 |
| Study perspective | Describe the perspective of the study and relate this to the costs being evaluated. | Not reported |
| Comparators | Describe the interventions or strategies being compared and state why they were chosen. | Not reported |
| Time horizon | State the time horizon(s) over which costs and consequences are being evaluated and say why appropriate. | Not reported |
| Discount rate | Report the choice of discount rate(s) used for costs and outcomes and say why appropriate. | Not reported |
| Choice of health outcomes | Describe what outcomes were used as the measure(s) of benefit in the evaluation and their relevance for the type of analysis performed. | Not reported |
| Measurement of effectiveness | Single study‐based estimates: Describe fully the design features of the single effectiveness study and why the single study was a sufficient source of clinical effectiveness data. | Not reported |
| Synthesis‐based estimates: Describe fully the methods used for identification of included studies and synthesis of clinical effectiveness data. | Not applicable | |
| Measurement and valuation of preference based outcomes | If applicable, describe the population and methods used to elicit preferences for outcomes. | Not applicable |
| Estimating resources and costs | Single study‐based economic evaluation: Describe approaches used to estimate resource use associated with the alternative interventions. Describe primary or secondary research methods for valuing each resource item in terms of its unit cost. Describe any adjustments made to approximate to opportunity costs. | Not reported |
| Currency, price date, and conversion | Report the dates of the estimated resource quantities and unit costs. Describe methods for adjusting estimated unit costs to the year of reported costs if necessary. Describe methods for converting costs into a common currency base and the exchange rate. | Not reported |
| Choice of model | Describe and give reasons for the specific type of decision‐analytical model used. Providing a figure to show model structure is strongly recommended. | Not applicable |
| Assumptions | Describe all structural or other assumptions underpinning the decision‐analytical model. | Not applicable |
| Analytical methods | Describe all analytical methods supporting the evaluation. This could include methods for dealing with skewed, missing, or censored data; extrapolation methods; methods for pooling data; approaches to validate or make adjustments (such as half cycle corrections) to a model; and methods for handling population heterogeneity and uncertainty. | Not reported |
| Results | ||
| Study parameters | Report the values, ranges, references, and, if used, probability distributions for all parameters. Report reasons or sources for distributions used to represent uncertainty where appropriate. Providing a table to show the input values is strongly recommended. | 697 ‐ 698 |
| Incremental costs and outcomes | For each intervention, report mean values for the main categories of estimated costs and outcomes of interest, as well as mean differences between the comparator groups. If applicable, report incremental cost‐effectiveness ratios. | Not reported |
| Characterising uncertainty | Single study‐based economic evaluation: Describe the effects of sampling uncertainty for the estimated incremental cost and incremental effectiveness parameters, together with the impact of methodological assumptions (such as discount rate, study perspective). | Not reported |
| Model‐based economic evaluation: Describe the effects on the results of uncertainty for all input parameters, and uncertainty related to the structure of the model and assumptions | Not reported | |
| Characterising heterogeneity | If applicable, report differences in costs, outcomes, or cost‐effectiveness that can be explained by variations between subgroups of patients with different baseline characteristics or other observed variability in effects that are not reducible by more information. | Not reported |
| Discussion | ||
| Study findings, limitations, generalisability, and current knowledge | Summarise key study findings and describe how they support the conclusions reached. Discuss limitations and the generalisability of the findings and how the findings fit with current knowledge. | 698 ‐ 699 |
| Other | ||
| Source of funding | Describe how the study was funded and the role of the funder in the identification, design, conduct, and reporting of the analysis. Describe other non‐monetary sources of support. | 699 |
| Conflicts of interest | Describe any potential for conflict of interest of study contributors in accordance with journal policy. In the absence of a journal policy, we recommend authors comply with International Committee of Medical Journal Editors recommendations. | Not reported |
Allocation
Thirty‐three studies (50%) reported using appropriate methods for random sequence allocation. Two studies (Gabbay 2006; McDermott 2001) described a non‐random component in the sequence generation process and we judged them to be at a high risk of bias for this domain. The rest of the studies provided insufficient information about the sequence‐generation process to judge risk of bias. We rated allocation concealment as adequate in 39 studies (59%), either because the unit of allocation was by institution, team or professional and allocation was performed on all units at the start of the study, or a suitable method was used to conceal allocation.
Blinding
We rated four studies at a high risk of bias; Adair 2013, where retinopathy screening data were extracted from patient records by unmasked extractors, whose knowledge of allocation could have influenced outcome; Franco 2007, in which the general practitioners (GPs) in the intervention group provided the data on retinopathy screening; in Sonnichsen 2010, where masking was not possible and knowledge of being in the intervention or control group may have influenced the outcome; and Ward 1996, where one of the outcome assessors was the research nurse who conducted the interviews to obtain the outcome data in one arm of the trial, and was therefore unmasked.
Incomplete outcome data
We judged 15 studies (22.7%) to be at a high risk of attrition bias, with attrition of 20% or more (Dijkstra 2005; Franco 2007; Gabbay 2013; Harris 2005; Hermans 2013; Ilag 2003; Jacobs 2012; Jansink 2013; Kirwin 2010; Maljanian 2005; O'Connor 2005; Perria 2007; Sonnichsen 2010; Varney 2014; Wagner 2001).The remaining studies were either at low (N = 40) or unclear (N = 11) risk of bias for this domain.
Selective reporting
It was possible to judge if a study was free from selective outcome reporting in only 17 of the included studies (25.8%), as the outcomes were consistent with a prospectively‐published clinical trials registry entry or trial protocol. We were unable to assess selective reporting in the remainder, due to the lack of a study protocol or trial register entry, or in the case of studies where trial registration was performed retrospectively.
Other potential sources of bias
In five studies (7.6%) there was a baseline imbalance in DRS attendance of 10% or more between intervention and control groups, and in seven studies (10.6%) it was not possible to control for the possibility that the control group received the intervention.
Effects of interventions
See: Summary of findings for the main comparison Any quality improvement intervention compared to usual care for diabetic retinopathy screening; Summary of findings 2 Stepped quality improvement intervention compared to intervention alone for diabetic retinopathy screening
For details of the GRADE assessments, see summary of findings Table for the main comparison and summary of findings Table 2.
Primary outcome
See summary of findings Table for the main comparison and summary of findings Table 2.
One or more visits for diabetic retinopathy screening within a two‐year period following implementation of the intervention
All 66 trials provided data for this outcome. These consisted of two types of comparison: 56 of the 66 studies (85%) compared an intervention against “current usual care”, and 10 (15%) compared a more intensive QI intervention or group of QI interventions against a less intensive intervention. Since these were addressing different questions, we conducted separate meta‐analyses on the 56 and the 10 studies.
Thirty‐one of the 66 trials (47%) were cluster‐RCTs. Only nine of these reported an ICC and the ICC reported typically did not relate specifically to DRS outcomes. Of the nine reporting an ICC, the most commonly reported value was 0.05, and so this was the value we imputed for studies with no estimates of ICCs. The smallest value reported was 0.01 and the largest value was 0.2. We ran a sensitivity analysis to investigate the impact on the computed effect estimates of using the lower and upper range values (see table below).
| ICC | 0.05 | 0.01 | 0.2 | ||||||
| Model | RD | LCL | UCL | RD | LCL | UCL | RD | LCL | UCL |
| DRS | 0.17 | 0.11 | 0.22 | 0.17 | 0.11 | 0.22 | 0.17 | 0.11 | 0.22 |
| General | 0.12 | 0.09 | 0.15 | 0.12 | 0.09 | 0.16 | 0.11 | 0.08 | 0.15 |
| Combined | 0.12 | 0.10 | 0.14 | 0.13 | 0.11 | 0.15 | 0.12 | 0.10 | 0.14 |
Abbreviations: RD: risk difference; LCL: lower limit; UCL: upper limit
Comparison 1: Any QI intervention versus usual care
Of the 56 studies which compared any intervention against usual care, 13 (23%) evaluated interventions specifically targeting DRS. The remaining 43 (77%) evaluated interventions directed towards improving the general quality of diabetes care (including DRS attendance). Although there was substantial heterogeneity in intervention effects (I2 = 93%), 48 out of the 56 studies showed an improvement in DRS attendance. Since it may be argued that it is better to examine clinical differences in a meta‐analysis rather than to use them as a reason for not conducting one, we computed pooled estimates for each of these subgroups. We adopted a random‐effects model, which can accommodate statistical heterogeneity between studies by assuming that different studies have different true effect sizes, but we acknowledge that use of the random‐effects model does not in it itself deal with heterogeneity. We assessed whether there was evidence of a subgroup effect and, since there was not (P = 0.15), we conducted all subsequent statistical analyses on the 56 studies. Overall, DRS attendance increased by 12% (risk difference (RD) 0.12, 95% confidence interval (CI) 0.10 to 0.14; low‐certainty evidence) compared with usual care (Analysis 1.1Figure 7).

Forest plot of comparison: 1 Any quality improvement intervention compared to usual care, outcome: 1.1 Proportion of participants attending screening.
There was some evidence of funnel plot asymmetry (Figure 8). Terrin 2003 has suggested, however, that the funnel plot may be inappropriate for heterogeneous meta‐analyses, so we did not downgrade our findings because of this.

Funnel plot of comparison: 1 Any quality improvement intervention compared to usual care, outcome: 1.1 Proportion of patients attending screening.
Comparison 2: More intensive (stepped) intervention versus less intensive intervention
Examples of studies in this comparison included: a tailored (individualised) versus a generic patient education newsletter; a comparison of audit and feedback to the healthcare professional compared to audit and feedback combined with a diabetes team outreach service. Ten studies contributed to this analysis (Analysis 2.1; Figure 9). Three (30%) evaluated interventions specifically targeting DRS, while seven (70%) evaluated interventions directed towards improving the general quality of diabetes care. In these studies DRS attendance increased by 5% (RD 0.05, 95% CI 0.02 to 0.09; moderate‐certainty evidence) (Analysis 2.1).

Forest plot of comparison: 2 Stepped quality improvement intervention compared to intervention alone (control), outcome: 2.1 Proportion of participants attending screening.
Secondary outcomes
Ongoing adherence to DRS based on attendance for screening following the initial screening post‐intervention
It was not possible to extract data on ongoing adherence to DRS (based on attendance for screening following the initial screening post‐intervention), since either it was not possible to identify unique screening episodes from pooled data reported at two time points, or in one study due to the intervention being offered to the comparator arm 18 months post‐randomisation (Mansberger 2015).
Economic outcomes
Resources (staff time, equipment, consumables) required to deliver interventions to increase attendance for DRS
We graded each intervention between one (least resource‐intensive) and five (most resource‐intensive), or as zero (unable to determine), with a record of how the review author graded each study also provided. We developed an algorithm to derive the ordered rank. This mapped resource components and their intensity to the ordered rank. We incorporated the following resource components into the algorithm: face‐to‐face minutes; telephone calls; patient home visits; printed materials/software; training.
We then used the resource components and their intensity levels to extract the resource use required to deliver the interventions in all included studies. Two review authors (JL and EGR) conducted this independently. The percentage of studies for each resource grouping for the 56 studies comparing any intervention with usual care was as follows: 1 = 48.2%; 2 = 10.7%; 3 = 8.9%; 4 = 19.6%; 5 = 12.6%.
Costs of staff used to provide interventions; costs of treatment and care; cost of primary care; lost wages and lost productivity (work output)
We converted all reported costs to the 2016 British pound, and summarise them for each study in Table 2. Only two studies (Eccles 2007; Prezio 2014) reported both the direct and indirect costs (productivity loss) of the interventions. In all other studies, the costs of the interventions reported covered just the direct costs of providing that intervention. Five studies (Adair 2013; Clancy 2007; Frijling 2002; Prezio 2014; Pizzi 2015) reported the total direct costs of the interventions, but the resources they considered relevant and how they combined them to estimate total cost varied between studies. We report components of the total cost for each intervention in Table 2.
The types of resources included in the cost calculations for each study varied; hence, it is difficult to compare directly across the studies. The estimated training cost differed between the few studies that reported this information. In terms of the costs of treatment and care of diabetes, there was no obvious difference in the healthcare costs between the interventions and comparators in the studies that reported these data, primarily reflecting an absence of evidence. Further details on resources and costs from each included studies can be found in Table 2.
Incremental cost‐effectiveness ratio (ICER)
Only three studies conducted in the USA (Davis 2010; Prezio 2014; Walker 2008) reported this outcome. Davis 2010 reported an incremental cost per QALY of GBP 13,154 over one year for a diabetes telecare intervention compared to no intervention. However, it is unclear what tool they used to estimate QALYs. Prezio 2014 used an established whole‐disease model, the Archimedes Model simulator, to estimate the incremental cost per QALY. Using a discount rate of 3% and programme effectiveness at 100%, the incremental cost per QALY was GBP 73,683 over five years, and GBP 261 over 20 years for the intervention (a culturally‐tailored diabetes education programme delivered by community health worker) compared with usual care. Prezio 2014 and Walker 2008 also reported an incremental cost‐effectiveness ratio. In this study, the unit of effectiveness was the number of diabetic fundus examinations gained, which was associated with the number of diabetic retinopathies diagnosed. The incremental cost per dilated fundus examination gained for telephone intervention compared to the mailed/printed intervention was GBP 333. Pizzi 2015 reported a cost‐effectiveness analysis with an incremental cost‐effectiveness ratio for the telephone intervention of GBP 18.77 per additional patient attending a dilated fundus examination, compared with usual care. We did not calculate the ratio for the mailed intervention because it was dominated by usual care.
Exploration of heterogeneity
We detected substantial heterogeneity (I2 > 90%), which we investigated by subgroup analysis and meta‐regression.
Subgroup analysis
Enough studies were available to investigate the effectiveness of nine out of the possible 12 QI components. Insufficient data were available to analyse ‘continuous quality improvement’, ‘financial incentives’ and 'facilitated relay' of information to clinicians. Interventions incorporating all nine QI components evaluated in the subgroup analysis were associated with improvements in DRS attendance, with higher pooled effect estimates for interventions directed at patients (promotion of self‐management and patient education) or the organisation of the health system (team changes or the establishment of an electronic patient registry) (Table 6). Sufficient studies were available to investigate the effectiveness of interventions containing particular BCTs (including 10 BCTs aimed at patients and seven aimed at healthcare professionals). Interventions incorporating all 17 BCTs included in the subgroup analysis were all shown to be effective in improving DRS attendance. For BCTs aimed at patients, we found higher pooled effect estimates for ‘goal setting (outcome)’ and ‘credible source’ and for healthcare professionals ‘restructuring the social environment’ and ‘credible source’ (Table 6). There were insufficient data to conduct the planned analysis on the variability of effect size according to population subgroups, and there were too few studies within each resource category to conduct a subgroup analysis of the relationship between effect size and resource intensity.
| Subgroup category | N studies | RD (95% CI) | I2 % |
| QI Strategy | |||
| Audit and feedback | 11 | 0.12 (0.06 to 0.18) | 89 |
| Case management | 18 | 0.14 (0.07 to 0.21) | 94 |
| Team changes | 19 | 0.20 (0.13 to 0.26) | 88 |
| Electronic patient registry | 10 | 0.18 (0.07 to 0.29) | 94 |
| Clinician education | 16 | 0.13 (0.07 to 0.19) | 95 |
| Clinician reminders | 10 | 0.13 (0.05 to 0.21) | 85 |
| Patient Education | 30 | 0.15 (0.13 to 0.18) | 95 |
| Promotion of self‐management | 21 | 0.19 (0.13 to 0.26) | 96 |
| Patient reminders | 16 | 0.11 (0.07 to 0.14) | 93 |
| BCT (patients) | |||
| Goal setting (Outcome) | 14 | 0.26 (0.16 to 0.36) | 93 |
| Feedback on outcomes of behaviour/biofeedback | 15 | 0.19 (0.13 to 0.25) | 80 |
| Credible source | 10 | 0.22 (0.06 to 0.38) | 95 |
| Prompts/cues | 25 | 0.11 (0.07 to 0.14) | 92 |
| Social support (unspecified) | 14 | 0.19 (0.09 to 0.28) | 93 |
| Problem solving | 10 | 0.17 (0.08 to 0.27) | 89 |
| Restructuring the social environment | 17 | 0.17 (0.10 to 0.24) | 85 |
| Instruction on how to perform behaviour | 34 | 0.13 (0.11 to 0.15) | 94 |
| Social support (practical) | 20 | 0.14 (0.09 to 0.20) | 90 |
| Information about health consequences | 19 | 0.12 (0.07 to 0.16) | 92 |
| BCT (healthcare professionals) | |||
| Restructuring the social environment | 23 | 0.19 (0.12 to 0.26) | 91 |
| Credible source | 13 | 0.16 (0.08 to 0.24) | 95 |
| Adding objects to the environment | 15 | 0.14 (0.07 to 0.20) | 88 |
| Social support (practical) | 10 | 0.13 (0.03 to 0.22) | 87 |
| Instruction on how to perform behaviour | 30 | 0.13 (0.08 to 0.17) | 93 |
| Prompts/cues | 15 | 0.12 (0.06 to 0.17) | 85 |
| Feedback on outcomes of behaviour/biofeedback | 17 | 0.11 (0.07 to 0.16) | 81 |
Metaregressions
Metaregression revealed some evidence of an association between effect size and baseline DRS attendance, with larger effects in studies with poorer screening attendance (Figure 10). The regression coefficient was ‐0.208 (‐0.419 to 0.004). The residual I2 was still very high at 94%. Because of regression to the mean, this association might be spurious, so we conducted a permutation test to allow for this (with 1000 permutations, P = 0.055). A comparison between the effect sizes from studies at high risk of bias (defined for this purpose as high risk of bias in one or more domains) was slightly (but not statistically‐significantly) higher than those at low risk of bias (regression coefficient 0.008 (‐0.136 to 0.094)). Similarly, we found no association between study design (individual or cluster‐RCT) and effect size (regression coefficient ‐ 0.049 (‐0.136 to 0.039), P = 0.268), nor between resource intensity and effect size (regression coefficient 0.013 (‐0.015 0.042), P = 0.356).
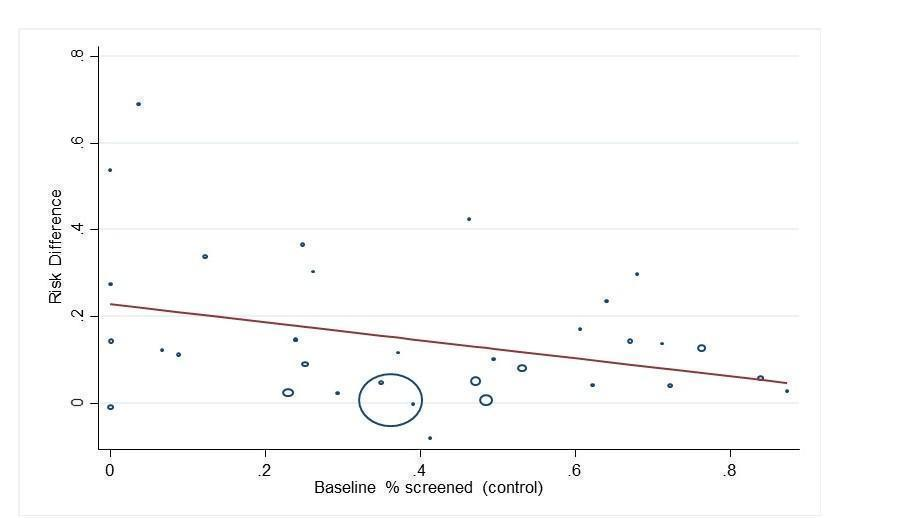
Bubble plot showing the relationship between the risk difference and baseline percentage screened
When component QI/BCTs were explored (comparing studies with the intervention to those studies without), there was some evidence of an association between the patient‐targeted BCT ‘goal setting (outcome)’, with greater improvement in DRS attendance observed in studies with compared to those without this BCT (regression coefficient 0.162 (0.07 to 0.254), P = 0.001). It should be noted that we made no adjustments for multiplicity in these investigations, so that results should be observed as hypothesis‐generating rather than confirmatory.
Discusión
Resumen de los resultados principales
Esta revisión identificó 66 ECA/ECA por grupos que investigaron la efectividad de las intervenciones para mejorar la asistencia a las DRS. Cincuenta y seis estudios (329 164 participantes) compararon diversas intervenciones de QI con la atención habitual. Un metanálisis de estos estudios halló que los componentes de la intervención de QI dirigidos a los pacientes, el profesional de la salud o al sistema sanitario se asociaron con un aumento absoluto del 12% en la asistencia a las DRS. En 13 de estos estudios, la intervención de QI se dirigió específicamente a las DRS y en 43 estudios la intervención era una intervención general de QI para mejorar el tratamiento de la diabetes. Aunque la estimación del efecto agrupado fue mayor para las intervenciones dirigidas a las DRS en comparación con las intervenciones no dirigidas (aumento del 17% en la asistencia a las DRS en comparación con el 12%), esta diferencia no fue estadísticamente significativa.
Diez estudios (23 715 participantes) compararon una intervención menos intensiva (control "activo") con una intervención más intensiva. Tres de estos estudios se ocuparon específicamente de las DRS y siete eran intervenciones generales de QI. El objetivo de estos estudios fue determinar si aumentar la intensidad del componente de una intervención, o introducir otros componentes, aumentaría las DRS. La estimación de los efectos agrupados para estos estudios fue menor, con un aumento del 5% en la asistencia a las DRS a favor de la intervención más intensiva, lo que sugiere que es posible mejorar aún más el tamaño del efecto con intervenciones más intensas.
La comparación principal de esta revisión (cualquier intervención de QI frente a la atención habitual) se asoció con heterogeneidad significativa. Esto se exploró mediante análisis de subgrupos y metarregresión. Hubo algunas pruebas de tamaños del efecto más grandes en las poblaciones con una menor asistencia a las DRS al comienzo; sin embargo, gran parte de la heterogeneidad observada no tuvo causa aparente. Hubo una cantidad suficiente de estudios para investigar el efecto de determinados componentes de QI o de BCT, para identificar los componentes activos de las intervenciones. Los 12 componentes de QI, definidos por la taxonomía modificada de EPOC, se utilizaron en al menos un estudio, y las intervenciones generalmente fueron multifacéticas, con dos o tres componentes de QI por brazo de intervención. En un análisis de subgrupos, los componentes de QI dirigidos a pacientes, profesionales de la salud o al sistema sanitario fueron eficaces. Una metarregresión, que comparó los estudios que usaban componentes de QI concretos con otros sin estos componentes, no halló diferencias estadísticamente significativas entre los componentes de la intervención.
Pudimos describir más a fondo las intervenciones según el componente BCT, que proporciona un nivel de detalle más adecuado para describir el contenido de la intervención. En un análisis de subgrupos, todas las BCT usadas con frecuencia fueron eficaces para mejorar la asistencia, con DR agrupadas que oscilaron entre 0,11 y 0,26. Una metarregresión reveló que las intervenciones que tenían ciertas BCT eran más eficaces para mejorar la asistencia a las DRS, estas incluyen: "establecimiento del objetivo (resultado)" (coeficiente de regresión [CR]: 0,162; IC del 95%: 0,070 a 0,254; P = 0,001). Hubo algunas pruebas de tamaños del efecto más grandes en las poblaciones con una menor asistencia a las DRS al comienzo, (CR: ‐0,208; IC del 95%: ‐0,419 a 0,004; P = 0,054). Sin embargo, gran parte de la heterogeneidad observada no tuvo causa aparente.
No se hallaron estudios que informaran nuestra medida de resultado secundaria de cumplimiento permanente con las DRS después de la consulta de detección inicial posterior a la intervención, ni datos sobre la eficacia relativa de las intervenciones en subgrupos poblacionales concretos; p.ej., características socioeconómicas.
Catorce estudios que informaron resultados económicos se incluyeron en la revisión. Sin embargo, solo cinco de ellas eran evaluaciones económicas completas. En general, hallamos que no hay suficientes pruebas para establecer conclusiones sólidas sobre la efectividad relativa de la relación costo‐eficacia de las intervenciones comparadas entre sí o con la atención habitual. Los componentes de QI dirigidos a los pacientes parecían ser más intensivos en recursos en comparación con los componentes dirigidos a profesionales de la salud, excepto el establecimiento de un registro electrónico de pacientes; aunque habría economías de escala con altos costos de establecimiento, aunque los costos de funcionamiento en marcha serían comparativamente bajos.
Compleción y aplicabilidad general de las pruebas
Hasta donde sabemos, solo dos países del mundo (Reino Unido e Islandia) han introducido un programa nacional de detección sistemática de retinopatía diabética. En el resto de los países la detección sigue siendo oportunista. La asistencia a las pruebas de detección suele ser subóptima, aunque muchos países recomiendan un examen de retina anual, o cada dos años, en las pautas de la práctica clínica de la diabetes. La mayoría de los ensayos de esta revisión (76%) incluyeron intervenciones generales de QI para el tratamiento de la diabetes e inscribieron a pacientes que no obtuvieron indicadores de calidad relevantes para la diabetes, como las DRS. El análisis agrupado de cualquier intervención de QI comparada con la atención habitual reveló que tanto las intervenciones dirigidas a las DRS como las generales fueron efectivas para mejorar la asistencia a las pruebas de detección, sobre todo en las poblaciones con una escasa asistencia inicial a las pruebas de detección. Sin embargo, la presencia de heterogeneidad significativa sin causa aparente y la falta de datos sobre el efecto de la intervención en subgrupos poblacionales concretos significan que sigue existiendo cierta incertidumbre sobre el tamaño del aumento previsto en la asistencia a las pruebas de detección.
Si bien los posibles daños asociados con otros tipos de pruebas de detección de salud están bien documentados, en esta revisión no incluimos formalmente los efectos adversos/daños como resultado, ya que el riesgo de un resultado adverso asociado con las pruebas de detección de retinopatía es bajo. Sin embargo, ninguno de los estudios incluidos informó resultados adversos.
Calidad de la evidencia
En general, se consideró que la certeza de las pruebas fue baja, según la GRADE. Se bajó el nivel de la evidencia dos niveles, debido a inconsistencias graves en los resultados. Para estimar la DR agrupada entre los estudios, se decidió de antemano utilizar un modelo de efectos aleatorios que pondera los estudios de manera más equitativa que un modelo de efectos fijos. Dado que hubo algunas pruebas de tamaños del efecto más grandes en estudios más pequeños, nuestra estimación de efectos aleatorios del efecto de la intervención es más beneficiosa de la que se habría obtenido con un modelo de efectos fijos.
Respecto de muchos dominios, no fue posible determinar el riesgo de sesgo debido al informe deficiente. Por ejemplo, como muchos de los ECA no tenían un protocolo de publicación prospectivo, no fue posible juzgar si los resultados se informaron de forma selectiva. Un análisis de subgrupos halló que, aunque los estudios con alto riesgo de sesgo tenían estimaciones del efecto ligeramente más altas en comparación con los de bajo riesgo de sesgo, esta diferencia no fue estadísticamente significativa. El consenso del equipo de revisión fue no bajar el nivel de certeza de la evidencia respecto del riesgo de sesgo.
De los 22 posibles estudios "económicos" identificados por el equipo de revisión, 14 fueron elegibles para la revisión como evaluaciones económicas parciales o completas. Se consideró que la certeza de la evidencia económica era baja, según la GRADE. Se bajó el nivel debido a la falta de uniformidad entre los diferentes elementos de los resultados económicos. También se identificó sesgo de publicación en dos de los ocho estudios excluidos. Estos estudios no informaron las evaluaciones económicas previstas, ya que no hallaron pruebas de efectividad de la intervención. Este enfoque podría considerarse como un informe selectivo de resultados, a tal punto que no se informan los posibles resultados económicos negativos. Este fenómeno de sesgo de publicación ha sido reconocido con anterioridad, donde los estudios con resultados de eficacia desfavorables no se publican o se publican después en revistas de baja repercusión. Además, desde el punto de vista analítico dicho enfoque es deficiente, ya que estos estudios combinan la ausencia de pruebas con un hallazgo de evidencia de ausencia "de un efecto". También se hallaron pruebas de sesgo de publicación a través de la inspección de un gráfico en embudo, pero esto fue difícil de evaluar en presencia de esta heterogeneidad significativa.
La mayoría de las evaluaciones económicas tenían limitaciones en los informes. Solo unas pocas proporcionaran un desglose de los costos asociados con la administración de los diferentes componentes de la intervención. Tampoco hubo suficientes pruebas para demostrar si una parte de los costos directos de la intervención y del tratamiento se pueden compensar con la reducción de los costos de productividad. Sin embargo, es importante notar que un hallazgo esperado de una intervención eficaz serían los beneficios en salud y las reducciones en los costos del tratamiento de la diabetes. La calidad metodológica general de los estudios económicos incluidos fue mixta. Las evaluaciones económicas parciales identificadas, por su naturaleza carecían de las características metodológicas previstas de una evaluación económica. La calidad metodológica de las evaluaciones económicas completas se calificaron como moderadas.
Muchos de nuestros estudios no informaron los valores del coeficiente de correlación intragrupo (ICC). Se utilizaron los datos proporcionados para permitir una estimación de un "ICC promedio", que luego se aplicó a los estudios que no informan los ICC. Como se trató de una imputación, se intentó explorar el efecto que habría tenido el uso de otros valores de ICC, y de este modo se repitió nuestro análisis con los valores superiores e inferiores del ICC que se habían observado. Realizar una variación de este tipo no afectó materialmente nuestras estimaciones de la DR.
Sesgos potenciales en el proceso de revisión
Se consideró que muchos dominios tenían un riesgo de sesgo "incierto", debido al informe deficiente. Aunque se estableció contacto con los autores para solicitar más información sobre el contenido de la intervención, no se pidió formalmente toda la información necesaria para emitir un juicio más fundado en todos los dominios del sesgo.
La codificación del contenido de la intervención fue un desafío, debido a la escasez de fuentes de datos primarios; aunque en algunos casos (aproximadamente el 17%) esto se compensó con la obtención de información adicional por parte de los investigadores sobre el contenido de la intervención, quienes también proporcionaron materiales utilizados en la administración de las intervenciones. No pudimos evaluar el efecto de algunos componentes del QI de la intervención debido a que había muy pocos ensayos disponibles para nuestros análisis de subgrupos y de metarregresión. Además, no pudimos controlar todos los posibles factores de confusión. Dada la complejidad de las intervenciones que incorporaron varios componentes de QI, es probable que otras covariables hayan interactuado de forma sinérgica o antagónica con la intervención investigada. La corta duración de los ECA incluidos (habitualmente 12 meses o menos) o la incapacidad de informar los episodios individuales de detección hicieron imposible evaluar el efecto de las intervenciones de QI en la asistencia a las DRS en curso.
Acuerdos y desacuerdos con otros estudios o revisiones
Una sola revisión sistemática anterior (Zhang 2007) investigó la eficacia de las intervenciones para aumentar la aceptación de las DRS. Aunque esta revisión incluyó 48 estudios, solo 12 de éstos fueron ECA. Asimismo, los autores concluyeron que son varias las intervenciones que pueden ser efectivas para mejorar la aceptación de las pruebas de detección, y estas incluyen; aumentar la toma de conciencia por parte del paciente y del prestador sobre la retinopatía diabética, mediante la introducción de un programa de registro/recordatorios por ordenador y el desarrollo de un sistema sanitario extrahospitalario.
En comparación con la escasez de revisiones sistemáticas sobre el efecto de las intervenciones tendientes a mejorar los resultados de las DRS, muchas revisiones evaluaron el efecto de las intervenciones generales de QI tendientes a mejorar la calidad general del tratamiento de la diabetes (Worswick 2013). Una revisión sistemática reciente publicada por los miembros del equipo actual (Tricco 2012) incluyó 48 ECA por grupos y 94 ECA de pacientes, y halló mejorías en muchos resultados de calidad importantes para los pacientes con diabetes. Un metanálisis de un subconjunto de 23 ECA informó un aumento en la aceptación de las pruebas de detección de la retinopatía (CR 1,22; IC del 95%: 1,13 a 1,32).
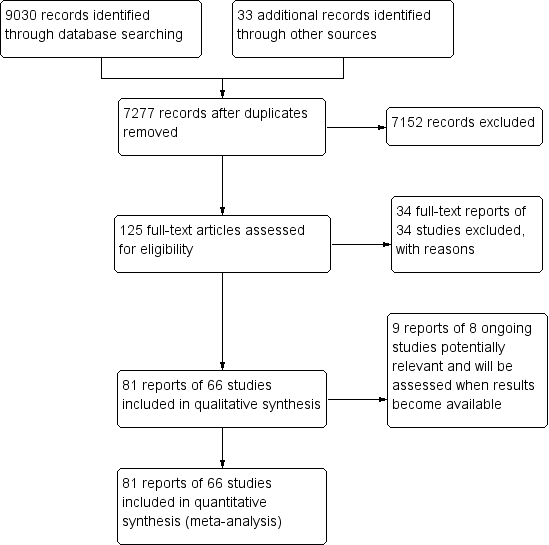
Study flow diagram.

Quality improvement components used in intervention arm of included studies. (DRS=diabetic retinopathy screening, GQI=general quality improvement).

Risk of bias summary: review authors' judgements about each risk of bias item for each included study.

Behaviour change techniques (BCTs) targeting patients used in intervention arm. of included studies (DRS=diabetic retinopathy screening, GQI=general quality improvement).
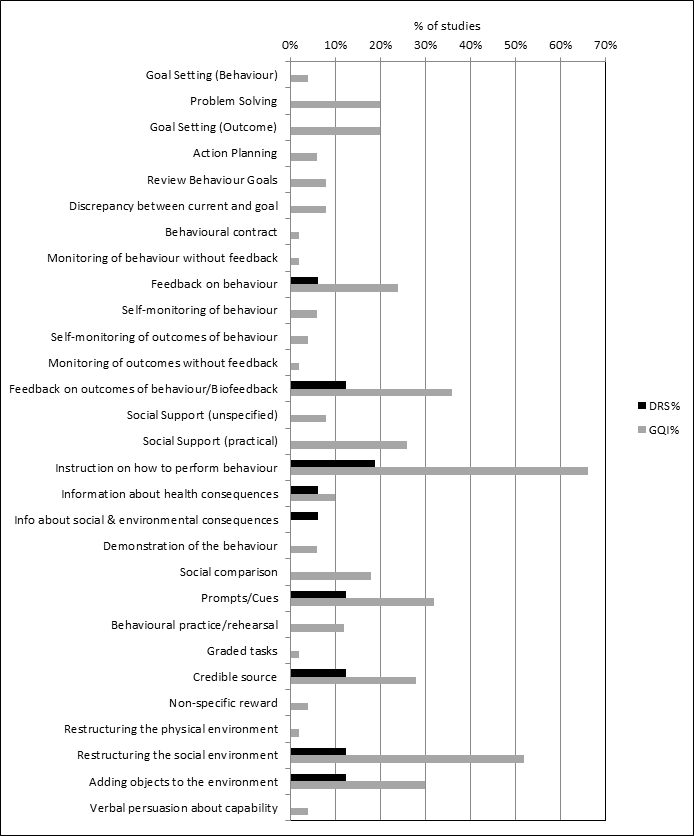
Behaviour change techniques (BCTs) targeting healthcare professionals used in intervention arm of included studies (DRS=diabetic retinopathy screening, GQI=general quality improvement).
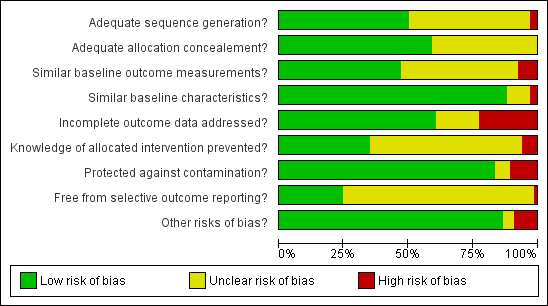
Risk of bias graph: review authors' judgements about each risk of bias item presented as percentages across all included studies.
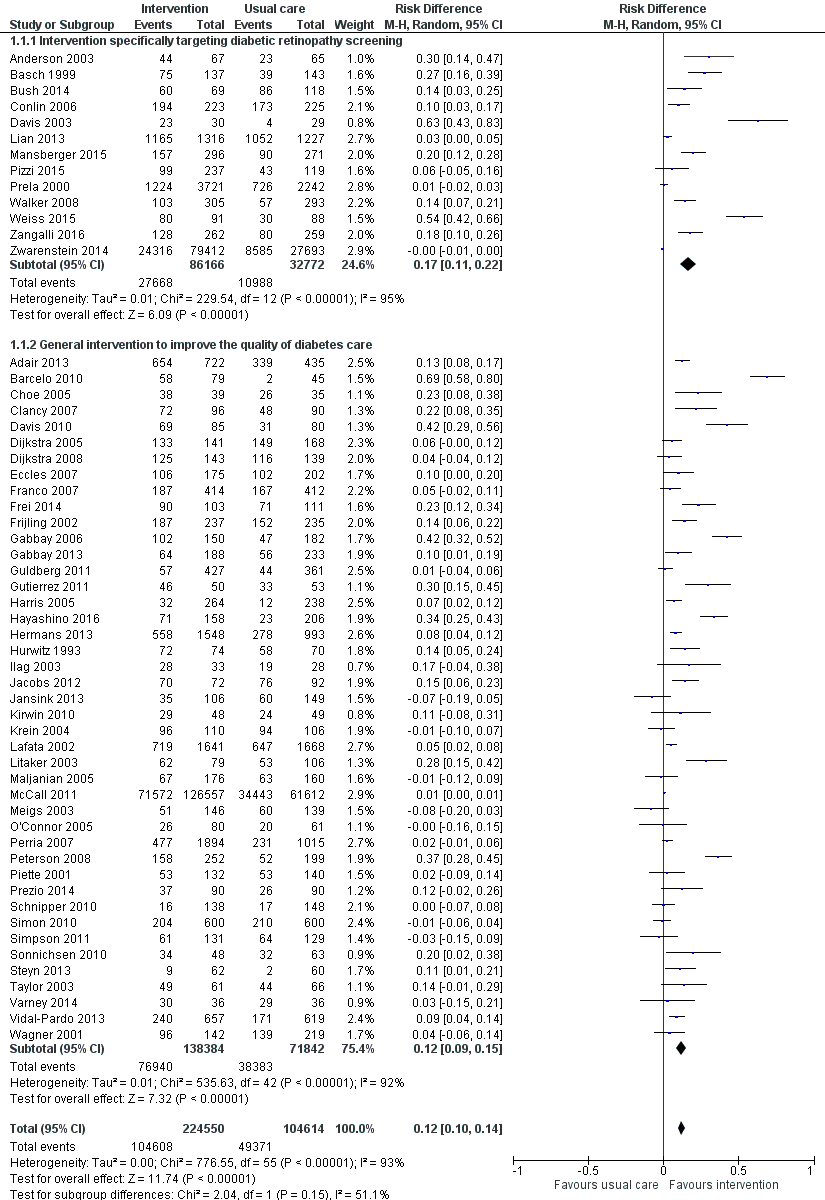
Forest plot of comparison: 1 Any quality improvement intervention compared to usual care, outcome: 1.1 Proportion of participants attending screening.

Funnel plot of comparison: 1 Any quality improvement intervention compared to usual care, outcome: 1.1 Proportion of patients attending screening.

Forest plot of comparison: 2 Stepped quality improvement intervention compared to intervention alone (control), outcome: 2.1 Proportion of participants attending screening.

Bubble plot showing the relationship between the risk difference and baseline percentage screened

Comparison 1 Any quality improvement intervention compared to usual care, Outcome 1 Proportion of participants attending screening.

Comparison 2 Stepped quality improvement intervention compared to intervention alone, Outcome 1 Proportion of participants attending screening.
| Any quality improvement intervention compared to usual care for diabetic retinopathy screening | ||||||
| Patient or population: patients with type 1 or 2 diabetes eligible for diabetic retinopathy screening | ||||||
| Outcomes | Illustrative comparative risks | Risk Difference (95% CI) | No of Participants | Quality of the evidence | Comments | |
| Assumed risk | Corresponding risk (95% CI) | |||||
| Attendance with usual care | Attendance with any QI Intervention | |||||
| Proportion of participants attending screening (median follow‐up 12 months post‐intervention) | 472 per 1000 | 580 per 1000 (557 to 604) | RD 12% (95% CI 10% to 14%) | 329,164 | ⊕⊕⊝⊝ | There was substantial unexplained heterogeneity between studies (I2 = 93%, P < 0.001). The effect appears to be larger when baseline performance is low |
| Ongoing adherence to screening | ‐ | ‐ | ‐ | ‐ | ‐ | Not reported |
| Economic Outcomes Resources used (staff time, equipment, consumables) | Wide variation in resources used for each study, hence difficult to collate the resource used as a single output | ‐ | 85 ‐ 20,000 (13 RCTs) | ⊕⊕⊝⊝ | ‐ | |
| Staff/personnel costs; costs of treatment and care; cost of primary care; lost wages and lost productivity | Wide variation in resources used from different interventions also made it difficult to derive average costs compared with usual care | ‐ | 85 ‐ 20,000 (10 RCTs) | |||
| Incremental Cost effectiveness of interventions | GBP 13,154 for promotion of self‐management; GBP 73,683 for 5 years for face‐to‐face meeting, GBP 18.77 for phone call | ‐ | 85 ‐ 603 (3 RCTs) | |||
| CI: Confidence interval; RD: Risk difference | ||||||
| GRADE Working Group grades of evidence | ||||||
| 1We downgraded the certainty of the evidence by two levels from high to low for inconsistency, due to wide variation in the effect estimates across studies that could not be explained. 2We downgraded the certainty of the evidence for the economic outcomes by two levels from high to low due to inconsistency across different elements of the economic outcomes (see Table 7). | ||||||
| Resources and costs per participant | ||||||||||
| Economic outcomes No of studies with evidence for the economic outcomes | Design | Limitations/risk of bias | Inconsistency | Indirectness | Imprecision | Other factors | No of participants | Any Quality Improvement intervention | Usual care | Overall quality |
| Resources used (staff time, equipment, consumables) (13 studies) Adair 2013Clancy 2007Davis 2010Eccles 2007Frei 2014Frijling 2002Krein 2004Litaker 2003Piette 2001Pizzi 2015Prezio 201Wagner 2001Walker 2008 | RCTs | Yesa | Yes ( there was justification for variation based on setting) | No | No | Resources used varied due to settings and intervention strategy | 85 ‐ 20,000 | Wide variation in resources used for each study, hence difficult to collate the resource used as a single output | ⊕⊕⊖⊖ LOW | |
| Staff/personnel costs; costs of treatment and care; cost of primary care; lost wages and lost productivity Adair 2013Clancy 2007Davis 2010Eccles 2007Frijling 2002Litaker 2003Piette 2001Pizzi 2015Prezio 2014Walker 2008 | RCTs | Yesa | Yes ( there was justification for variation based on setting) | No | No | Costs varied due to settings, level of experience and educational Background of personnel | 85 ‐ 20,000 | Wide variation in resources used from different interventions also made it difficult to derive average costs compared with usual care | ⊕⊕⊖⊖ LOW | |
| Incremental cost effectiveness of interventions. (3 studies) | RCTs | Yesa | No | No | No | None | 85 ‐ 603 | GBP 13,154 for promotion of self‐management GBP 73,683 for 5 years for face‐to‐face meeting GBP 18.77 for phone call | ⊕⊕⊕⊖ LOW | |
| a. Unclear risk from adequate masking (blinding), Unclear sequence generation and allocation concealment | ||||||||||
| Stepped quality improvement intervention compared to intervention alone for diabetic retinopathy screening | ||||||
| Patient or population: patients with type 1 or 2 diabetes eligible for diabetic retinopathy screening | ||||||
| Outcomes | Illustrative comparative risks | Risk Difference (95% CI) | No of Participants | Quality of the evidence | Comments | |
| Assumed risk (95% CI) | Corresponding risk (95% CI) | |||||
| Attendance with usual care | Attendance with stepped QI intervention | |||||
| Proportion of participants attending screening (median follow‐up 12 months post‐intervention) | 361 per 1000 | 405 per 1000 (372 to 437) | RD 5% (95% CI 2% to 9%) | 23,715 | ⊕⊕⊕⊝ | There was unexplained heterogeneity between studies (I2 = 56%, P = 0.02) |
| Ongoing adherence to screening | ‐ | ‐ | ‐ | ‐ | ‐ | ‐ |
| Economic outcomes | ‐ | ‐ | ‐ | ‐ | ‐ | ‐ |
| CI: Confidence interval; RD: Risk difference | ||||||
| GRADE Working Group grades of evidence | ||||||
| 1We downgraded the certainty of the evidence by one level from high to moderate for inconsistency due to variation in the effect estimates across studies that could not be explained. | ||||||
| Behaviour change technique (BCT) and abbreviated definitions | Illustrative quotation |
| Goals and planning | |
| Goal setting (behaviour) Set or agree a goal defined in terms of the behaviour to be achieved e.g. Set targets for how often patients should attend DRS, or general diabetes self‐management, such as frequency of blood glucose testing, amount of carbohydrates to consume at each meal | "Practice nurses planned independent consultations with patients. The monitoring tool guided them through the consultations, and provided the opportunity to help the patient in selecting appropriate, concrete, behavioural goals …. The monitoring tool addressed clinical parameters (e.g., HbA1C, BP and LDL cholesterol levels), examinations (e.g. food control, neurological tests, and eye examinations), adherence to prescribed drugs, self‐care goals, and other recommendations" (Frei 2014 p 1040‐1) |
| Problem solving Analyse, or prompt the person to analyse, factors influencing the behaviour and generate or select strategies that include overcoming barriers and/or increasing facilitators e.g. Support patients to identify reasons for wanting or not wanting to attend DRS, and helping them select potential strategies for overcoming these barriers to screening attendance | "Using a semi structured protocol, the health educator (C.J. H.) offered one‐on‐one, interactive education and counselling. Having established rapport, she worked to identify and understand each subject’s reasons for and /or barriers to having a dilated retinal examination. Focused problem‐solving then guided the subject toward making an informed choice about receiving an ophthalmic examination." (Basch 1999, p 1879) |
| Goal setting (outcome) Set or agree a goal defined in terms of a positive outcome of wanted behaviour e.g. Agree with the patient target HbA1c, blood pressure, or cholesterol level, or target range for blood glucose | "During the case management sessions, patients and providers set management goals that were reasonable to achieve." (Barcelo 2010, p 147) |
| Action planning Prompt detailed planning of performance of the behaviour e.g. Support the patient to develop a plan for how often they will attend DRS, where the DRS will occur, and how they will get to their appointment | "Behavioural activation for diabetic retinopathy prevention combined the principles of education about diabetes mellitus, behavioural therapy, and the health belief model to assist participants in identifying barriers to obtaining dilated fundus examinations, problems‐solving solutions to surmounting barriers, formulating action plans to facilitate dilated retinal examinations, and gauging the success of action plans." (Weiss 2015, p 1007) |
| Review behaviour goals Review behaviour goal(s) jointly with the person and consider modifying goal(s) or behaviour change strategy in light of achievement e.g. During scheduled diabetic review consultations, discuss with patients how they are progressing with their agreed self‐management behavioural goals (e.g. frequency of blood glucose testing, attendance for DRS). Where patients are not meeting agreed goals, either discuss how to adjust goals if needed to increase feasibility, or engage in problem‐solving to overcome any barriers to goal attainment | "Care managers were trained to use a patient‐centred self‐management approach that included review of the medical care needs and self‐care goals that the patient identified and brainstorming additional strategies that patients could use to overcome barriers to their goals." (Glasgow 2005, p 35) |
| Discrepancy between current and goal Draw attention to discrepancies between a person’s current behaviour and the person’s previously set outcome goals, behaviour goals or action plans e.g. Provide feedback to healthcare professionals on the proportion of patients who have received DRS in the previous 12 months, and compare this against a gold standard for clinical practice based on clinical guidelines | "Physicians in the IG [intervention group] received a monthly report of their care quality with the top 10% quality of diabetes care score for all physicians being the achievable benchmark."(Hayashino 2016, p 1) |
| Review outcome goal(s) Review outcome goal(s) jointly with the person and consider modifying goal(s) in light of achievement e.g. Review or alter target blood glucose levels towards a more feasible/achievable intermediate target | "The telephone call was structured to first review the patient’s goals, followed by medication use, symptoms, glucose monitoring, blood pressure monitoring and self‐management /care activities" (Taylor 2003, p 1059) |
| Behavioural contract Create a written specification of the behaviour to be performed, agreed by the person, and witnesses by another e.g. Ask the person with diabetes to sign a contract in their self‐management plan or diary, undertaking to attend DRS once | Care guides asked patients to sign a contract (which was scanned into the HHR) agreeing to work toward their disease‐specific goals. (Adair 2013, p 176) |
| Commitment Ask the person to affirm or reaffirm statement indicating commitment to change the behaviour e.g. Ask the person with diabetes to verbally affirm or reaffirm that they are committed to attending DRS at the agreed frequency and location | "The initial goal was toelicit a verbal commitment to schedule an eye examination." (Basch 1999, p 1879) |
| Feedback and monitoring | |
| Monitoring of behaviour by others without feedback Observe or record behaviour with the person’s knowledge as part of a behaviour change strategy e.g. Record the proportion of patients who attend for a DRS exam as part of clinical audit, but the results are not fed back to the healthcare professionals whose practice has been audited | "Foot examinations, blood pressure, and eye examinations were recorded on the reminder by clinic staff, collected after the patient visit and entered manually." (Peterson 2008, p 2239) |
| Feedback on behaviour Monitor and provide information or evaluative feedback on performance of the behaviour (e.g. form, frequency, duration, intensity) e.g. Provide a feedback report to healthcare professionals, stating the proportion of their patients who have attended a DRS exam, had their blood pressure taken, and had a foot examination | "In addition, diabetic members who did not have a record of a diabetic retinopathy exam received educational materials and a report of their current DRE status directly from the HMO 2 weeks later." (Halbert 1999, p 753) |
| Self‐monitoring of behaviour Establish a method for the person to monitor and record their behaviour(s) as part of a behaviour change strategy e.g. A person with diabetes maintains a self‐management diary in which they record their daily food intake and exercise, and tick off a checklist when they have attended their annual DRS exam | "We prepared feedback sheets for adherence to these eight indicators using data from thephysicians’ self‐report forms, as the physicians monitored and promoted these indicators to improve adherence." (Hayashino 2015, p 601) |
| Self‐monitoring of outcomes of behaviour Establish a method for the person to monitor and record the outcome(s) of their behaviour as part of a behaviour change strategy e.g. A person with diabetes records in their self‐management diary the results of their latest HbA1C result and DRS exam | "In general, case managers were directed to encourage patient self‐management, including diet and exercise, provide reminders for recommended screening/tests,help with appointment scheduling;monitoring home glucose and blood pressure levels…" (Krein 2004, p 734) |
| Monitoring of outcomes of behaviour by others without feedback Observe or record outcomes of behaviour with the person’s knowledge as part of a behaviour change strategy e.g. A person attends a DRS exam, but is not provided with the results of the examination | "The nurse case manager used behavioural goals setting, established individualized care plan, provide patient self‐management education and surveillance of patients…ordered protocol‐driven laboratory tests, tracked the outcomes using the computerized data registry…" (Gabbay 2006, p 30) |
| Feedback on outcomes of behaviour Monitor and provide feedback on the outcome of performance of the behaviour e.g. Informing the person with diabetes of the results of DRS exam [i.e. presence/absence of retinopathy] | "…all persons who attended the screening clinics received a dilated eye exam by a volunteer community‐based ophthalmologist. The eye exam included visual acuity, intraocular pressure, and a fundus examination through a dilated pupil…immediately after receiving the dilated eye exam, the patient was told the results by the examination ophthalmologist." (Anderson 2003, p 41) |
| Biofeedback Provide feedback about the body (e.g. physiological or biochemical state) using an external monitoring device as part of a behaviour change strategy | " … immediately after receiving the dilated eye exam, the patient was told the results by the examination ophthalmologist." (Anderson 2003, p 41) |
| Social Support | |
| Social Support (unspecified) Advise on, arrange or provide social support (e.g. from friends, relatives, colleagues, ‘buddies’ or staff) or non‐contingent praise or reward for performance of the behaviour. In includes encouragement and counselling e.g. Provide general encouragement or reassurance to a person with diabetes to attend their DRS appointment | "Overall, the intervention included …and self‐management support (provided by the practice nurse)." (Frei 2014, p 1041) |
| Social Support (practical) Advise on, arrange, or provide practical help (e.g. from friends, relatives, colleagues, ‘buddies’ or staff) for performance of the behaviour e.g. Provide practical help for a patient with diabetes to attend DRS. This can include, for example: arranging a referral to DRS, arranging or providing transport to the clinic | "Referrals were facilitated to other clinicians when indicated, including ophthalmology, podiatry, nutrition and primary care for follow‐up of acute or other chronic issues or when requested by patients." (Jacobs 2012, p 616) |
| Shaping knowledge | |
| Instruction on how to perform behaviour Advise or agree on how to perform the behaviour (includes ‘skills training’) e.g. Provide advice to a person with diabetes on how often guidelines recommend attending DRS, where they can obtain a DRS, and how to schedule an eye exam | "A direct mail reminder was sent to patients to reinforce the importance of annual eye exams and included the following text: If you don’t have an eye doctor, ask you regular doctor to refer you to one." (Prela 2000, p 258) |
| Natural consequences | |
| Information about health consequences Provide information (e.g. written, verbal, visual) about health consequences of performing the behaviour e.g. Provide advice to the person with diabetes, on the negative health consequences of retinopathy, and the benefits of early detection | "A tailored telephone intervention was delivered by bilingual interventionists and included: Risk communications, such as the frequency lack of symptoms of retinopathy and that early treatment for retinopathy decreases the risk of blindness, were included." (Walker 2008, p 187) |
| Salience of consequences Use methods specifically designed to emphasise the consequences of performing the behaviour with the aim of making them more memorable e.g. Give a person with diabetes a leaflet containing testimonials from other persons with diabetes who suffer from retinopathy to emphasise the benefits of attending DRS and early detection | "The videotape used emotional appeals through storytelling to increase motivation to have a yearly dilated retinal examination." (Basch 1999, p 1879) |
| Information about social & environmental consequences Provide information (e.g. written, verbal, visual) about social and environmental consequences of performing the behaviour e.g. Provide information on the costs of having a DRS exam | "A take‐home reminder (aimed at patients, to remind them to make an appointment for an eye exam), to be given to patients by their Family Practitioner, included the following text: OKIP covers annual eye checks for patients with diabetes so you will not have to pay" (Zwarenstein 2014, p 90) |
| Information about emotional consequences Provide information (e.g. written, verbal, visual) about emotional consequences of performing the behaviour e.g. Provide a leaflet recognising the potential negative effects on emotional and mental health of managing a chronic illness, such as diabetes | "Group visit content, though patient‐guided, was physician‐directed to cover educational topics…and the emotional aspects of diabetes." (Clancy 2007, p 621) |
| Comparison of behaviour | |
| Demonstration of the behaviour Provide an observable sample of the performance of the behaviour, directly in person or indirectly (e.g. by film, picture, for the person to aspire to or imitate) e.g. Play a video demonstrating the DRS procedure | "The newsletter consisted of six sections, including a testimonial designed to model eye examination behaviour" (Ellish 2011, p 1593) |
| Social comparison Draw attention to others’ performance to allow comparison with the person’s own performance e.g. Provide healthcare professionals with feedback on the proportion of their patients who have had a DRS exam, and benchmark this in comparison to other hospitals or healthcare professionals | "The system presented register data on their’ Type 2 diabetes population, giving them the option either to use the data during individual diabetes consultations or to gain an overview of the quality of their diabetes care and compare it with the corresponding quality in their colleagues’ practices." (Guldberg 2011, p 326) |
| Information about others’ approval Provide information about what other people think about their behaviour. The information clarifies whether others will like, approve or disapprove of what the person is doing or will do e.g. Tell the person with diabetes that their family members would likely be keen for them to attend their DRS appointment | "One of the message in the targeted newsletter read: Even though you’ve been thinking about getting a dilated eye exam, we hope you’ll make the call now"(Ellish 2011, Additional information provided by the author) |
| Associations | |
| Prompts/Cues Introduce or define environmental or social stimulus with the purpose of prompting or cueing the behaviour e.g. Phone the person with diabetes to remind them of their upcoming DRS appointment | "For those who made an appointment, a reminder letter was mailed 3 weeks prior to the scheduled appointment. Additionally, there was an automated reminder call the day before the scheduled appointment" (Pizzi 2015, p 255) |
| Reduce prompts/cues Withdraw gradually prompts to perform the behaviour e.g. Decrease the frequency with which a person with diabetes is sent a reminder of their DRS attendance (i.e. from weekly, to fornightly, to monthly, to quarterly reminders) | "Recommendations for regular telephone follow‐ups for diabetes patients, which will be monthly in the 1st half year and then will probably decrease" (Jansink 2013 (coded from protocol 2009) |
| Repetition and substitution | |
| Behavioural practice/rehearsal Prompt practice or rehearsal of the performance of the behaviour one or more times in a context or at a time when the performance may not be necessary, in order to increase habit and skill e.g. Provide an opportunity for trainee healthcare professionals to practise delivering a DRS exam to an actor role‐playing a patient with diabetes | "During a 2‐day training session, case managers received instruction on collaborative goal setting, with case examples and role‐playing used to familiarize them with the treatment algorithms"( Krein 2004, p 734) |
| Graded tasks Set easy‐to‐perform tasks, making them increasingly difficult, but achievable, until the behaviour is performed e.g. Initially allocate a healthcare professional responsibility for one component of DRS exam and progressively increase their responsibility | "Theoretically, this form of facilitation should be necessary for only a relatively short period of time, with the practice improvement team progressively assuming responsibility for the ongoing improvement efforts after the initial facilitation." (Dickinson 2014, p 10) |
| Comparison of outcomes | |
| Credible source Present verbal or visual communication from a credible source in favour of or against the behaviour e.g. Include the logos for national health institutes, or cite published clinical guidelines, to endorse information provided in leaflets regarding DRS | "Participants in the print‐intervention group received a mailing of a colourful, 14‐page booklet on preventing diabetes eye problems called Keep Your Eyes Healthy, in English or Spanish,developed b y the National Institutes of Health." (Walker 2008, p 187) |
| Reward and threat | |
| Material incentive (behaviour) Inform that money, vouchers or other valued objects will be delivered if and only if there has been effort and/or progress in performing the behaviour e.g. Advise the person with diabetes that they will receive a shopping voucher if they attend their upcoming DRS appointment | "The automated system offered a live telephone call back to assist in scheduling test and alsooffered to send participants the following items: 1) a voucher that would allow the provider to waive the co‐payment for a dilated eye examination…" (Simon 2010, p 1452) |
| Social reward Arrange verbal or non‐verbal reward if and only if there has been effort and/or progress in performing the behaviour e.g. Verbally praise the person with diabetes if they attend their DRS appointment | "When a subject reported having a dilated retinal examination a congratulatory letter was sent." (Basch 1999, p 1879) |
| Non‐specific reward Inform that a reward will be delivered if and only if there has been effort and/or progress in performing the behaviour e.g. Inform the healthcare professional that they will be rewarded for conducting a DRS exam with a target proportion of their patients | "CME credits were given to the participating physicians in the workshops" (Vidal‐Pardo 2013, p 752) |
| Antecedents | |
| Restructuring the physical environment Change or advise to change the physical environment in order to facilitate performance of the wanted behaviour or create barriers to the unwanted behaviour e.g. Introduce mobile DRS vans in geographically remote areas to increase access to screening facilities | "Care guide workstations were located in the clinic waiting rooms, to facilitate face‐to‐face interactions with patients, providers, and nurses." (Adair 2013, p 177) |
| Restructuring the social environment Change or advise to change the social environment in order to facilitate performance of the wanted behaviour or create barriers to the unwanted behaviour e.g. Change a healthcare team and team working, such as introducing a new specialist diabetes nurse role responsible for monitoring screening rates and phoning people with diabetes to remind them to attend their DRS appointment | "Three multi‐lingual Link Workers already employed by Coventry Primary Care Trust (PCT) were trained in diabetes management and care and assigned to work with specific intervention GP surgeries" (Bush 2014, p 295) |
| Adding objects to the environment Add objects to the environment in order to facilitate performance of the behaviour e.g. Introduce new computerised software to a general practice to help monitor and remind healthcare professionals as to which patients need to be prompted to attend DRS | "In addition 4500 diabetes passports were made available at the four hospitals…" (Dijkstra 2005, p 128) |
| Scheduled consequences | |
| Behaviour cost Arrange for withdrawal of something valued if and only if an unwanted behaviour is performed e.g. Charging people with diabetes a fee for failing to attend a DRS exam | "We were interested to find out whether a small copayment would be an important deterrent to the uptake of screening for diabetic retinopathy (DR)…We conducted a randomized trial in which one group was charged a small fee for DR screening and the other was provided with free access." (Lian 2013, p 1247) |
| Self‐belief | |
| Verbal persuasion about capability Tell the person that they can successfully perform the wanted behaviour, arguing against self‐doubts and asserting that they can and will succeed e.g. Encourage or reassure the patient to attend a DRS exam, providing information as needed to address any concerns or self‐doubts they may have about attending for a DRS exam | "Diabetes is a serious, lifelong condition, but there is so much that you can do to protect your health. Take charge of your health, not only for today, but also for the years to come" (Lafata 2002, p 523) |
| Focus on past success Advise to think about or list previous successes in performing the behaviour (or parts of it) e.g. Help the person with diabetes to remember the last time they attended a DRS exam, and use this as an opportunity to reassure them of the benefits of attending | A comprehensive programme that integrated lifestyle: counselling based on motivational interviewing principles was integrated into structured diabetes care. [In description of motivational interviewing] "Self‐efficacy can be strengthened by affirming past success (i.e. reinforcement)…" (Jansink 2013 , additional information from protocol) |
| DRS: diabetic retinopathy screening | |
| QI Component | Study | DRS or GQI | Estimated costs of resources used | Resources used |
| Promotion of self‐management | N = 85 participants | GQI | Staff cost per person = GBP 625.25; costs of the other resources used = GBP 476.35 over 12 months Direct cost per person = GBP 1101 | 13 x 15‐minute sessions (3 individuals and 10 group session) with nurses and 4 hours with health educator per person |
| N = 14 clinics, 278 participants | GQI | Not reported | 1‐hour group session with relevant health professional every 3 ‐ 6 months | |
| Team changes | N = 15 practices, 164 participants | GQI | Not reported | 6‐day training for nurses, 2 x 4‐hour workshops for physicians and nurses |
| N = 14 clinics, 278 participants | GQI | Not reported | 1‐hour group session with relevant health professional every 3 ‐ 6 months | |
| N = 79 participants | GQI | Mean personnel costs for the intervention per month per patient = GBP 130.15 Total additional personnel costs = GBP 10281.97 | An average of 180 minutes with participants | |
| Case management | N = 123 participants | GQI | Not reported | 2 days training for case managers, 20 hours/week time spent with participants. Quarterly profiling and subsequently every 6 months |
| Patient education | N = 90 participants | GQI | Physician cost = GBP 48.76/hour Community health worker = GBP 12.91/hour Cost of intervention over 20 years = GBP 3646.10 per patient | 7 sessions per participants, 1 hour physician supervision for health workers |
| N = 117 participants for mailed intervention, 120 for telephone intervention | DRS | Staff time for 120 participants = GBP 501.13 for telephone over 1 month Staff time for 117 participants = GBP 173.17 for mailed intervention over 1 month GBP 85.24/hour for the physician, GBP 29.32/hr for health services manager, GBP 16.72/hour for medical assistant Cost of materials for telephone = GBP 30.25, cost of materials for mailed intervention Total cost of intervention = GBP 577.64 for 120 participants in telephone group, GBP 335.48 for 117 participants in mailed group over a month Total cost when appointment is made and kept per participant; Telephone intervention = GBP 9.47 Mailed intervention = GBP 8.83 | 1‐hour supervision for every 20‐hour intervention delivered 2 x 1‐hour meetings with medical assistants, health services manage and ophthalmologist | |
| N = 930 participants | GQI | Care guide cost for 120 participants = GBP 375,917 at the rate of GBP 11.77/hour over a year 2 supervisory nurses = GBP 85,847.24 Training cost = GBP 2228.99 modular furniture and equipment for 12 stations = GBP 79,422.81 Total cost = GBP 463,993 Total cost of intervention per participant = GBP 326 | 12 care guides, 2 weeks training, 2 supervisory nurses, 5 visits on average to clinics, 4 contacts with participants, furniture and modular equipment | |
| N = approximately 20,000 participants | GQI | Not reported | Not reported | |
| N = 96 participants | GQI | Deposit fee for group visit = GBP 13.4/visit, for 12 visits = GBP 160.60 | Monthly meeting for a year for 2 hours which includes 1 primary care internal medicine physician, 1 registered nurse per visit Training for physicians and nurses 3‐ hour training for clinic staff 12 group visits for 1 year | |
| Schechter 2008 (Walker 2008) N = 305 participants for telephone intervention, 298 for print intervention | DRS | Costs of health educator = GBP 14,890.83 Training and supervision = GBP 2756.44 Telephone charges = GBP 679.67 for 305 participants Costs of printing and mailing = GBP 465.99 for 298 participants | Average of 3.2 calls for about 20 minutes +5 minutes call preparation per participant over 6 months 20 hours training, 1 hour supervision by diabetes nurse educator, telephone calls | |
| Electronic patient register | N = 30 practices, 1674 participants | GQI | Cost of developing the guidelines = GBP 10,208 Cost of software development = GBP 12519.36 Cost of educational activities = GBP 2148.11 Additional cost of running the system = GBP 9964.46 Annual cost per participant = GBP 68.21 | Cost of guidelines and software development. Average of 2 follow‐up contacts |
| Patient reminders | Schechter 2008 (Walker 2008) N = 305 participants for telephone intervention, 298 for print intervention | DRS | Costs of health educator = GBP 14,890.83 Training and supervision = GBP 2756.44 Telephone charges = GBP 679.67 for 305 participants Costs of printing and mailing = GBP 465.99 for 298 participants | Average of 3.2 calls for about 20 minutes + 5 minutes call preparation per participant over 6 months 20 hours training, 1 hour supervision by diabetes nurse educator, telephone calls |
| N = 117 participants for mailed intervention, 120 for telephone intervention | DRS | Staff time for 120 participants = GBP 501.13 for telephone over 1 month Staff time for 117 participants = GBP 173.17 for mailed intervention over 1 month GBP 85.24/hour for the physician, GBP 29.32/hour for health services manager, GBP 16.72/hour for medical assistant Cost of materials for telephone = GBP 30.25, cost of materials for mailed intervention Total cost of intervention = GBP 577.64 for 120 participants in telephone group, GBP 335.48 for 117 participants in mailed group over a month | 1 hour supervision for every 20‐hour intervention delivered 2 x 1‐hour meetings with medical assistants, health services manager and ophthalmologist | |
| Audit and feedback | N = 62 clusters, 703 participants | GQI | Cost of clinical decision‐making per practice = GBP 341.51 | 80 hours training for facilitator, 15 x 1‐hour visits to practice clinic, 3 hours GP time for implementation of feedback |
| Clinician reminders | N = 79 participants | GQI | Mean personnel costs for the intervention per month = GBP 130.15 Total additional personnel costs = GBP 10,281.97 | An average of 180 minutes with participants over 12 months |
| Continuous quality improvements | N = 146 participants | GQI | Approximately GBP 14 ‐ GBP 24 per year for automated calls. | 13 nurses spending an average of 3.8 hours per participant, 15 automated calls |
| DRS: diabetic retinopathy screening | ||||
| Study characteristics | Target: diabetic retinopathy screening attendance N = 16 | Target: general quality improvement in diabetes care N = 50 | TOTAL N = 66 |
| Study design | Individual RCT: n = 14 (87.5%) Cluster‐RCT: n = 2 (12.5%) 2 arms n = 13 (81.3%) 3 arms n = 2 (12.5%) > 3 arms n = 1 (6.3%) | Individual RCT: n = 21 (42%) Cluster‐RCT: n = 29 (58%) 2 arms n = 46 (92%) 3 arms n = 4 (8%) | Individual RCT n = 35 (53%) Cluster‐RCT n = 31 (47%) 2 arms n = 59 (89.4%) 3 arms n = 6 (9.1%) > 3 arms n = 1 (1.5%) |
| Location | USA: n = 12 (75%) Canada: n = 1 (6.3%) China: n = 1 (6.3%) Germany: n = 1 (6.3%) UK: n = 1 (6.3%) Conducted between 1995 and 2013 | USA: n = 29 (58%) Canada: n = 2 (4%) Netherlands: n = 4 (8%) Australia: n = 3 (6%) UK: n = 2 (4%) Other n = 10 (20%) Conducted between 1988 and 2013 | USA: n = 41 (62.1%) Canada: n = 3 (4.6%) Netherlands: n = 4 (6.1%) Australia: n = 3 (4.6%) UK: n = 3 (4.6%) Other: n = 12 (18.2%) Conducted between 1988 and 2013 |
| Setting | Primary care: n = 11 (68.8%) Outpatient clinics: n = 4 (25%) Unclear: n = 1 (6.3%) | Primary care: n = 40 (80%) Outpatient n = 3 (6%) Unclear: n = 7 (14%) | Primary care: n = 51 (77.3%) Outpatient clinics n = 7 (10.6%) Unclear n = 8 (12.1%) |
| Diabetes type | Type 2: n = 4 (25%) Type 1 and Type 2: n = 3 (18.8%) Not reported: n = 9 (56.3%) | Type 2: n = 34 (68%) Type 1 and Type 2 n = 7 (14%) Not reported: n = 9 (18%) | Type 2 : n = 38 (57.6%) Type 1 and 2 n = 10 (15.2%) Not reported n = 18 (27.3%) |
| Number of participants recruited | Individual RCT = 38,273 Cluster RCT = 4135 clusters, 182,513 participants Total: 220,786 participants included | Individual RCT = 198,752 Cluster RCT = 1991 clusters, 78,276 participants Total: 277,028 participants included | Individual RCT = 237,025 Cluster RCT = 6126 clusters, 260,789 participants Total: 497,814 participants included |
| Median age | Median 60.7 yrs (range 51.1 ‐ 72.7) | Median 60.6 yrs (range 46.8 ‐ 74) Number reporting n = 34 | Median 60.7 yrs (46.8 ‐ 74) Number reporting n = 43 |
| Gender (% male) | Median 38.9% (range 25% ‐ 98%) Number reporting n = 12 | Median 49.8% (range 25% ‐ 97%): Number reporting n = 35 | Median 48% (25% ‐ 98%) Number reporting n = 47 |
| Type of screening | Retinal exam n = 12 (75%) Grading of digital retinal images: n = 4 (25%) | Retinal exam n = 49 (98%) Grading of retinal images n = 1 (2%) | Retinal exam n = 61 (92.4%) Grading of retinal images n = 5 (7.6%) |
| Baseline screening attendance (in previous 12 or 24 m) | Median 0% (range 0% ‐ 48.4%) Reported in 7 studies | Median 37.1% (range 0% ‐ 88%) Reported in 36 studies | Median 35.4% (range 0% ‐ 87.8%) Reported in 43 studies |
| Longest duration of follow‐up (median)* | Median 6 months (range 3 ‐ 48) Number reporting n = 14 | Median 12 months (range 1 ‐ 30): Number reporting n = 49 | Median 12 months (range 1 ‐ 48) Number reporting n = 63 |
| Intervention target (modified EPOC classification) | Median number of targets in intervention arm = 2 Participant n = 14 (87.5%) Healthcare professional n = 4 (25%) Healthcare system n = 4 (25%) | Median number of targets in intervention arm = 3 Participant n = 31 (62%) Healthcare professional n = 31 (62%) Healthcare system n = 37 (74%) | Median number of targets in intervention arm = 3 Participant n = 45 (68.2%) Healthcare professional n = 35 (53%) Healthcare system n = 41 (62.1%) |
| Mansberger 2015 reported follow‐up data to 48 months but intervention offered to intervention and control group after 18 months and data reported at 12 and 24 months. | |||
| CHEC criteria checklists | Adair 2013 | Clancy 2007 | Davis 2011 | Eccles 2007 | Frei 2014 | Frijling 2002 | Krein 2004 | Litaker 2003 | McCall 2011 | Piette 2001 | Pizzi 2015 | Prezio 2014 | Schechter 2008 | Wagner 2001 |
| Is the study population clearly described? | Y | Y | Y | Y | Y | Y | Y | Y | Y | Y | Y | Y | Y | Y |
| Are competing alternatives clearly described? | Y | Y | Y | N | N | Y | Y | Y | N | N | Y | Y | Y | N |
| Is a well‐defined research question posed in answerable form? | Y | Y | Y | Y | Y | Y | Y | Y | Y | N | Y | Y | Y | Y |
| Is the economic study design appropriate to the stated objective? | N | N | Y | N | N | N | N | Y | N | N | Y | Y | Y | N |
| Is the chosen time horizon appropriate to include relevant costs and consequences? | Y | N | U | N | N | N | N | Y | N | N | Y | Y | Y | N |
| Is the actual perspective chosen appropriate? | Y | N | Y | Y | Y | Y | Y | Y | Y | Y | Y | Y | Y | Y |
| Are all important and relevant costs for each alternative identified? | Y | N | Y | Y | N | N | N | N | N | N | Y | Y | Y | N |
| Are all costs measured appropriately in physical units? | Y | N | U | Y | N | Y | N | Y | Y | N | Y | Y | Y | N |
| Are costs valued appropriately? | Y | N | N | Y | N | Y | N | Y | N | N | Y | Y | Y | N |
| Are all important and relevant outcomes for each alternative identified? | Y | N | Y | Y | Y | Y | N | Y | N | Y | Y | Y | Y | N |
| Are all outcomes measured appropriately? | Y | Y | Y | Y | N | Y | N | Y | Y | N | Y | Y | Y | N |
| Are outcomes valued appropriately? | N | N | N | Y | N | N | N | N | N | N | Y | Y | N | N |
| Is an incremental analysis of costs and outcomes of alternatives performed? | N | N | Y | N | N | N | N | N | N | N | Y | Y | Y | N |
| Are all future costs and outcomes discounted appropriately? | N | N | N | N | N | N | N | N | N | N | Y | Y | N | N |
| Are all important variables, whose values are uncertain, appropriately subjected to sensitivity analysis? | N | N | N | Y | N | N | N | N | N | N | Y | Y | Y | N |
| Do the conclusions follow from the data reported? | Y | Y | Y | N | Y | Y | Y | N | N | Y | Y | Y | Y | Y |
| Does the study discuss the generalizability of the results to other settings patient/client groups? | Y | Y | Y | Y | Y | Y | Y | Y | N | Y | Y | Y | Y | Y |
| Does the article indicate that there is no potential conflict of interest of study researcher(s) and funder(s)? | Y | Y | Y | Y | Y | Y | Y | Y | N | Y | Y | Y | Y | Y |
| Are ethical and distributional issues discussed appropriately? | Y | Y | Y | Y | Y | Y | Y | Y | Y | Y | Y | Y | Y | Y |
| N: no | ||||||||||||||
| Section of paper | Component | Reported on page number |
| Adair 2013 | ||
| Abstract | Provide a structured summary of objectives, perspective, setting, methods (including study design and inputs), results (including base case and uncertainty analyses), and conclusions | Not reported |
| Introduction | ‐ | |
| Background and objectives | Provide an explicit statement of the broader context for the study | 176 |
| Present the study question and its relevance for health policy or practice decisions | 176 | |
| Methods | ||
| Target population and subgroups | Describe characteristics of the base case population and subgroups analysed, including why they were chosen | 177 |
| Setting and location | State relevant aspects of the system(s) in which the decision(s) need(s) to be made | 177 |
| Study perspective | Describe the perspective of the study and relate this to the costs being evaluated | 178 ‐ 179 |
| Comparators | Describe the interventions or strategies being compared and state why they were chosen | Not reported |
| Time horizon | State the time horizon(s) over which costs and consequences are being evaluated and say why appropriate | Not reported |
| Discount rate | Report the choice of discount rate(s) used for costs and outcomes and say why appropriate | Not reported |
| Choice of health outcomes | Describe what outcomes were used as the measure(s) of benefit in the evaluation and their relevance for the type of analysis performed | Not reported |
| Measurement of effectiveness | Single study‐based estimates: Describe fully the design features of the single effectiveness study and why the single study was a sufficient source of clinical effectiveness data | Not reported |
| Synthesis‐based estimates: Describe fully the methods used for identification of included studies and synthesis of clinical effectiveness data | Not reported | |
| Measurement and valuation of preference based outcomes | If applicable, describe the population and methods used to elicit preferences for outcomes | Not reported |
| Estimating resources and costs | Single study‐based economic evaluation: Describe approaches used to estimate resource use associated with the alternative interventions. Describe primary or secondary research methods for valuing each resource item in terms of its unit cost. Describe any adjustments made to approximate to opportunity costs | 179 |
| Currency, price date, and conversion | Report the dates of the estimated resource quantities and unit costs. Describe methods for adjusting estimated unit costs to the year of reported costs if necessary. Describe methods for converting costs into a common currency base and the exchange rate | 179 |
| Choice of model | Describe and give reasons for the specific type of decision‐analytical model used. Providing a figure to show model structure is strongly recommended | Not reported |
| Assumptions | Describe all structural or other assumptions underpinning the decision‐analytical model | Not reported |
| Analytical methods | Describe all analytical methods supporting the evaluation. This could include methods for dealing with skewed, missing, or censored data; extrapolation methods; methods for pooling data; approaches to validate or make adjustments (such as half cycle corrections) to a model; and methods for handling population heterogeneity and uncertainty | Not reported |
| Results | ||
| Study parameters | Report the values, ranges, references, and, if used, probability distributions for all parameters. Report reasons or sources for distributions used to represent uncertainty where appropriate. Providing a table to show the input values is strongly recommended | Appendices w65 |
| Incremental costs and outcomes | For each intervention, report mean values for the main categories of estimated costs and outcomes of interest, as well as mean differences between the comparator groups. If applicable, report incremental cost‐effectiveness ratios | Appendices w65 |
| Characterising uncertainty | Single study‐based economic evaluation: Describe the effects of sampling uncertainty for the estimated incremental cost and incremental effectiveness parameters, together with the impact of methodological assumptions (such as discount rate, study perspective) | Not reported |
| Model‐based economic evaluation: Describe the effects on the results of uncertainty for all input parameters, and uncertainty related to the structure of the model and assumptions | Not reported | |
| Characterising heterogeneity | If applicable, report differences in costs, outcomes, or cost‐effectiveness that can be explained by variations between subgroups of patients with different baseline characteristics or other observed variability in effects that are not reducible by more information | Not reported |
| Discussion | ||
| Study findings, limitations, generalisability, and current knowledge | Summarise key study findings and describe how they support the conclusions reached. Discuss limitations and the generalisability of the findings and how the findings fit with current knowledge | 183 |
| Other | ||
| Source of funding | Describe how the study was funded and the role of the funder in the identification, design, conduct, and reporting of the analysis. Describe other non‐monetary sources of support | 183 |
| Conflicts of interest | Describe any potential for conflict of interest of study contributors in accordance with journal policy. In the absence of a journal policy, we recommend authors comply with International Committee of Medical Journal Editors recommendations | 183 |
| Clancy 2007 | ||
| Title | Identify the study as an economic evaluation or use more specific terms such as “cost‐effectiveness analysis”, and describe the interventions compared. | Not reported |
| Abstract | Provide a structured summary of objectives, perspective, setting, methods (including study design and inputs), results (including base case and uncertainty analyses), and conclusions. | Not reported |
| Introduction | ||
| Background and objectives | Provide an explicit statement of the broader context for the study. | Not reported |
| Present the study question and its relevance for health policy or practice decisions. | 620 | |
| Methods | Not reported | |
| Target population and subgroups | Describe characteristics of the base case population and subgroups analysed, including why they were chosen. | 621 |
| Setting and location | State relevant aspects of the system(s) in which the decision(s) need(s) to be made. | Not reported |
| Study perspective | Describe the perspective of the study and relate this to the costs being evaluated. | Not reported |
| Comparators | Describe the interventions or strategies being compared and state why they were chosen. | 620 ‐ 621 |
| Time horizon | State the time horizon(s) over which costs and consequences are being evaluated and say why appropriate. | Not reported |
| Discount rate | Report the choice of discount rate(s) used for costs and outcomes and say why appropriate. | Not reported |
| Choice of health outcomes | Describe what outcomes were used as the measure(s) of benefit in the evaluation and their relevance for the type of analysis performed. | Not reported |
| Measurement of effectiveness | Single study‐based estimates: Describe fully the design features of the single effectiveness study and why the single study was a sufficient source of clinical effectiveness data. | 620 |
| Synthesis‐based estimates: Describe fully the methods used for identification of included studies and synthesis of clinical effectiveness data. | Not reported | |
| Measurement and valuation of preference based outcomes | If applicable, describe the population and methods used to elicit preferences for outcomes. | Not reported |
| Estimating resources and costs | Single study‐based economic evaluation: Describe approaches used to estimate resource use associated with the alternative interventions. Describe primary or secondary research methods for valuing each resource item in terms of its unit cost. Describe any adjustments made to approximate to opportunity costs. | Not reported |
| Currency, price date, and conversion | Report the dates of the estimated resource quantities and unit costs. Describe methods for adjusting estimated unit costs to the year of reported costs if necessary. Describe methods for converting costs into a common currency base and the exchange rate. | Not reported |
| Choice of model | Describe and give reasons for the specific type of decision‐analytical model used. Providing a figure to show model structure is strongly recommended. | Not reported |
| Assumptions | Describe all structural or other assumptions underpinning the decision‐analytical model. | Not reported |
| Analytical methods | Describe all analytical methods supporting the evaluation. This could include methods for dealing with skewed, missing, or censored data; extrapolation methods; methods for pooling data; approaches to validate or make adjustments (such as half cycle corrections) to a model; and methods for handling population heterogeneity and uncertainty. | 622 |
| Results | ||
| Study parameters | Report the values, ranges, references, and, if used, probability distributions for all parameters. Report reasons or sources for distributions used to represent uncertainty where appropriate. Providing a table to show the input values is strongly recommended. | Not reported |
| Incremental costs and outcomes | For each intervention, report mean values for the main categories of estimated costs and outcomes of interest, as well as mean differences between the comparator groups. If applicable, report incremental cost‐effectiveness ratios. | Not reported |
| Characterising uncertainty | Single study‐based economic evaluation: Describe the effects of sampling uncertainty for the estimated incremental cost and incremental effectiveness parameters, together with the impact of methodological assumptions (such as discount rate, study perspective). | Not reported |
| Model‐based economic evaluation: Describe the effects on the results of uncertainty for all input parameters, and uncertainty related to the structure of the model and assumptions | Not reported | |
| Characterising heterogeneity | If applicable, report differences in costs, outcomes, or cost‐effectiveness that can be explained by variations between subgroups of patients with different baseline characteristics or other observed variability in effects that are not reducible by more information. | Not reported |
| Discussion | ||
| Study findings, limitations, generalisability, and current knowledge | Summarise key study findings and describe how they support the conclusions reached. Discuss limitations and the generalisability of the findings and how the findings fit with current knowledge. | Not reported |
| Other | ||
| Source of funding | Describe how the study was funded and the role of the funder in the identification, design, conduct, and reporting of the analysis. Describe other non‐monetary sources of support. | 624 |
| Conflicts of interest | Describe any potential for conflict of interest of study contributors in accordance with journal policy. In the absence of a journal policy, we recommend authors comply with International Committee of Medical Journal Editors recommendations. | 624 |
| Davis 2010 | ||
| Title | Identify the study as an economic evaluation or use more specific terms such as “cost‐effectiveness analysis”, and describe the interventions compared. | Abstract A325 |
| Abstract | Provide a structured summary of objectives, perspective, setting, methods (including study design and inputs), results (including base case and uncertainty analyses), and conclusions. | Abstract A325 |
| Introduction | ||
| Background and objectives | Provide an explicit statement of the broader context for the study. | Abstract A325 |
| Present the study question and its relevance for health policy or practice decisions. | 1712 of effectiveness report | |
| Methods | ||
| Target population and subgroups | Describe characteristics of the base case population and subgroups analysed, including why they were chosen. | 1714 of effectiveness report |
| Setting and location | State relevant aspects of the system(s) in which the decision(s) need(s) to be made. | Abstract A325 |
| Study perspective | Describe the perspective of the study and relate this to the costs being evaluated. | Not reported |
| Comparators | Describe the interventions or strategies being compared and state why they were chosen. | Abstract A325 |
| Time horizon | State the time horizon(s) over which costs and consequences are being evaluated and say why appropriate. | Abstract A325 |
| Discount rate | Report the choice of discount rate(s) used for costs and outcomes and say why appropriate. | Not reported |
| Choice of health outcomes | Describe what outcomes were used as the measure(s) of benefit in the evaluation and their relevance for the type of analysis performed. | 1713 |
| Measurement of effectiveness | Single study‐based estimates: Describe fully the design features of the single effectiveness study and why the single study was a sufficient source of clinical effectiveness data. | Abstract A325 |
| Synthesis‐based estimates: Describe fully the methods used for identification of included studies and synthesis of clinical effectiveness data. | Not applicable | |
| Measurement and valuation of preference based outcomes | If applicable, describe the population and methods used to elicit preferences for outcomes. | Not reported |
| Estimating resources and costs | Single study‐based economic evaluation: Describe approaches used to estimate resource use associated with the alternative interventions. Describe primary or secondary research methods for valuing each resource item in terms of its unit cost. Describe any adjustments made to approximate to opportunity costs. | Not reported |
| Currency, price date, and conversion | Report the dates of the estimated resource quantities and unit costs. Describe methods for adjusting estimated unit costs to the year of reported costs if necessary. Describe methods for converting costs into a common currency base and the exchange rate. | Not reported |
| Choice of model | Describe and give reasons for the specific type of decision‐analytical model used. Providing a figure to show model structure is strongly recommended. | Not applicable |
| Assumptions | Describe all structural or other assumptions underpinning the decision‐analytical model. | Not applicable |
| Analytical methods | Describe all analytical methods supporting the evaluation. This could include methods for dealing with skewed, missing, or censored data; extrapolation methods; methods for pooling data; approaches to validate or make adjustments (such as half cycle corrections) to a model; and methods for handling population heterogeneity and uncertainty. | Not applicable |
| Results | ||
| Study parameters | Report the values, ranges, references, and, if used, probability distributions for all parameters. Report reasons or sources for distributions used to represent uncertainty where appropriate. Providing a table to show the input values is strongly recommended. | Not reported |
| Incremental costs and outcomes | For each intervention, report mean values for the main categories of estimated costs and outcomes of interest, as well as mean differences between the comparator groups. If applicable, report incremental cost‐effectiveness ratios. | Abstract A325 |
| Characterising uncertainty | Single study‐based economic evaluation: Describe the effects of sampling uncertainty for the estimated incremental cost and incremental effectiveness parameters, together with the impact of methodological assumptions (such as discount rate, study perspective). | Not reported |
| Model‐based economic evaluation: Describe the effects on the results of uncertainty for all input parameters, and uncertainty related to the structure of the model and assumptions. | Not applicable | |
| Characterising heterogeneity | If applicable, report differences in costs, outcomes, or cost‐effectiveness that can be explained by variations between subgroups of patients with different baseline characteristics or other observed variability in effects that are not reducible by more information. | Not reported |
| Discussion | ||
| Study findings, limitations, generalisability, and current knowledge | Summarise key study findings and describe how they support the conclusions reached. Discuss limitations and the generalisability of the findings and how the findings fit with current knowledge. | Not reported |
| Other | ||
| Source of funding | Describe how the study was funded and the role of the funder in the identification, design, conduct, and reporting of the analysis. Describe other non‐monetary sources of support. | 1716 |
| Conflicts of interest | Describe any potential for conflict of interest of study contributors in accordance with journal policy. In the absence of a journal policy, we recommend authors comply with International Committee of Medical Journal Editors recommendations. | 1716 |
| Eccles 2007 | ||
| Title | Identify the study as an economic evaluation or use more specific terms such as “cost‐effectiveness analysis”, and describe the interventions compared. | Not reported |
| Abstract | Provide a structured summary of objectives, perspective, setting, methods (including study design and inputs), results (including base case and uncertainty analyses), and conclusions. | Not reported |
| Introduction | ||
| Background and objectives | Provide an explicit statement of the broader context for the study. | 2 |
| Present the study question and its relevance for health policy or practice decisions. | 2 | |
| Methods | ||
| Target population and subgroups | Describe characteristics of the base case population and subgroups analysed, including why they were chosen. | 2 |
| Setting and location | State relevant aspects of the system(s) in which the decision(s) need(s) to be made. | 2 |
| Study perspective | Describe the perspective of the study and relate this to the costs being evaluated. | 4 |
| Comparators | Describe the interventions or strategies being compared and state why they were chosen. | 4 |
| Time horizon | State the time horizon(s) over which costs and consequences are being evaluated and say why appropriate. | 4 |
| Discount rate | Report the choice of discount rate(s) used for costs and outcomes and say why appropriate. | |
| Choice of health outcomes | Describe what outcomes were used as the measure(s) of benefit in the evaluation and their relevance for the type of analysis performed. | 3 |
| Measurement of effectiveness | Single study‐based estimates: Describe fully the design features of the single effectiveness study and why the single study was a sufficient source of clinical effectiveness data. | Not reported |
| Synthesis‐based estimates: Describe fully the methods used for identification of included studies and synthesis of clinical effectiveness data. | Not reported | |
| Measurement and valuation of preference based outcomes | If applicable, describe the population and methods used to elicit preferences for outcomes. | 3 |
| Estimating resources and costs | Single study‐based economic evaluation: Describe approaches used to estimate resource use associated with the alternative interventions. Describe primary or secondary research methods for valuing each resource item in terms of its unit cost. Describe any adjustments made to approximate to opportunity costs. | 3 |
| Currency, price date, and conversion | Report the dates of the estimated resource quantities and unit costs. Describe methods for adjusting estimated unit costs to the year of reported costs if necessary. Describe methods for converting costs into a common currency base and the exchange rate. | 4 |
| Choice of model | Describe and give reasons for the specific type of decision‐analytical model used. Providing a figure to show model structure is strongly recommended. | Not reported |
| Assumptions | Describe all structural or other assumptions underpinning the decision‐analytical model. | Not reported |
| Analytical methods | Describe all analytical methods supporting the evaluation. This could include methods for dealing with skewed, missing, or censored data; extrapolation methods; methods for pooling data; approaches to validate or make adjustments (such as half cycle corrections) to a model; and methods for handling population heterogeneity and uncertainty. | Not reported |
| Results | ||
| Study parameters | Report the values, ranges, references, and, if used, probability distributions for all parameters. Report reasons or sources for distributions used to represent uncertainty where appropriate. Providing a table to show the input values is strongly recommended. | Not reportted |
| Incremental costs and outcomes | For each intervention, report mean values for the main categories of estimated costs and outcomes of interest, as well as mean differences between the comparator groups. If applicable, report incremental cost‐effectiveness ratios. | 8 ‐ 12 |
| Characterising uncertainty | Single study‐based economic evaluation: Describe the effects of sampling uncertainty for the estimated incremental cost and incremental effectiveness parameters, together with the impact of methodological assumptions (such as discount rate, study perspective). | Not reported |
| Model‐based economic evaluation: Describe the effects on the results of uncertainty for all input parameters, and uncertainty related to the structure of the model and assumptions. | Not reported | |
| Characterising heterogeneity | If applicable, report differences in costs, outcomes, or cost‐effectiveness that can be explained by variations between subgroups of patients with different baseline characteristics or other observed variability in effects that are not reducible by more information. | Not reported |
| Discussion | ||
| Study findings, limitations, generalisability, and current knowledge | Summarise key study findings and describe how they support the conclusions reached. Discuss limitations and the generalisability of the findings and how the findings fit with current knowledge. | 6, 10 |
| Other | ||
| Source of funding | Describe how the study was funded and the role of the funder in the identification, design, conduct, and reporting of the analysis. Describe other non‐monetary sources of support. | 11 |
| Conflicts of interest | Describe any potential for conflict of interest of study contributors in accordance with journal policy. In the absence of a journal policy, we recommend authors comply with International Committee of Medical Journal Editors recommendations. | 11 |
| Frei 2014 | ||
| Title | Identify the study as an economic evaluation or use more specific terms such as “cost‐effectiveness analysis”, and describe the interventions compared. | Not reported |
| Abstract | Provide a structured summary of objectives, perspective, setting, methods (including study design and inputs), results (including base case and uncertainty analyses), and conclusions. | Not reported |
| Introduction | ||
| Background and objectives | Provide an explicit statement of the broader context for the study. | 1040 |
| Present the study question and its relevance for health policy or practice decisions. | 1040 | |
| Methods | ||
| Target population and subgroups | Describe characteristics of the base case population and subgroups analysed, including why they were chosen. | 1043 |
| Setting and location | State relevant aspects of the system(s) in which the decision(s) need(s) to be made. | 1040 |
| Study perspective | Describe the perspective of the study and relate this to the costs being evaluated. | Not reported |
| Comparators | Describe the interventions or strategies being compared and state why they were chosen. | 1040 |
| Time horizon | State the time horizon(s) over which costs and consequences are being evaluated and say why appropriate. | Not reported |
| Discount rate | Report the choice of discount rate(s) used for costs and outcomes and say why appropriate. | Not reported |
| Choice of health outcomes | Describe what outcomes were used as the measure(s) of benefit in the evaluation and their relevance for the type of analysis performed. | Not reported |
| Measurement of effectiveness | Single study‐based estimates: Describe fully the design features of the single effectiveness study and why the single study was a sufficient source of clinical effectiveness data. | Not reported |
| Synthesis‐based estimates: Describe fully the methods used for identification of included studies and synthesis of clinical effectiveness data. | Not applicable | |
| Measurement and valuation of preference based outcomes | If applicable, describe the population and methods used to elicit preferences for outcomes. | Not reported |
| Estimating resources and costs | Single study‐based economic evaluation: Describe approaches used to estimate resource use associated with the alternative interventions. Describe primary or secondary research methods for valuing each resource item in terms of its unit cost. Describe any adjustments made to approximate to opportunity costs. | Not reported |
| Currency, price date, and conversion | Report the dates of the estimated resource quantities and unit costs. Describe methods for adjusting estimated unit costs to the year of reported costs if necessary. Describe methods for converting costs into a common currency base and the exchange rate. | Not reported |
| Choice of model | Describe and give reasons for the specific type of decision‐analytical model used. Providing a figure to show model structure is strongly recommended. | Not applicable |
| Assumptions | Describe all structural or other assumptions underpinning the decision‐analytical model. | Not applicable |
| Analytical methods | Describe all analytical methods supporting the evaluation. This could include methods for dealing with skewed, missing, or censored data; extrapolation methods; methods for pooling data; approaches to validate or make adjustments (such as half cycle corrections) to a model; and methods for handling population heterogeneity and uncertainty. | Not applicable |
| Results | ||
| Study parameters | Report the values, ranges, references, and, if used, probability distributions for all parameters. Report reasons or sources for distributions used to represent uncertainty where appropriate. Providing a table to show the input values is strongly recommended. | Not reported |
| Incremental costs and outcomes | For each intervention, report mean values for the main categories of estimated costs and outcomes of interest, as well as mean differences between the comparator groups. If applicable, report incremental cost‐effectiveness ratios. | Not reported |
| Characterising uncertainty | Single study‐based economic evaluation: Describe the effects of sampling uncertainty for the estimated incremental cost and incremental effectiveness parameters, together with the impact of methodological assumptions (such as discount rate, study perspective). | Not reported |
| Model‐based economic evaluation: Describe the effects on the results of uncertainty for all input parameters, and uncertainty related to the structure of the model and assumptions. | Not applicable | |
| Characterising heterogeneity | If applicable, report differences in costs, outcomes, or cost‐effectiveness that can be explained by variations between subgroups of patients with different baseline characteristics or other observed variability in effects that are not reducible by more information. | Not reported |
| Discussion | ||
| Study findings, limitations, generalisability, and current knowledge | Summarise key study findings and describe how they support the conclusions reached. Discuss limitations and the generalisability of the findings and how the findings fit with current knowledge. | 1045 |
| Other | ||
| Source of funding | Describe how the study was funded and the role of the funder in the identification, design, conduct, and reporting of the analysis. Describe other non‐monetary sources of support. | 1045 |
| Conflicts of interest | Describe any potential for conflict of interest of study contributors in accordance with journal policy. In the absence of a journal policy, we recommend authors comply with International Committee of Medical Journal Editors recommendations. | 1045 |
| Frijling 2002 | ||
| Title | Identify the study as an economic evaluation or use more specific terms such as “cost‐effectiveness analysis”, and describe the interventions compared. | Not reported |
| Abstract | Provide a structured summary of objectives, perspective, setting, methods (including study design and inputs), results (including base case and uncertainty analyses), and conclusions. | Not reported |
| Introduction | ||
| Background and objectives | Provide an explicit statement of the broader context for the study. | 837 |
| Present the study question and its relevance for health policy or practice decisions. | 837 | |
| Methods | ||
| Target population and subgroups | Describe characteristics of the base case population and subgroups analysed, including why they were chosen. | 838 |
| Setting and location | State relevant aspects of the system(s) in which the decision(s) need(s) to be made. | 838 |
| Study perspective | Describe the perspective of the study and relate this to the costs being evaluated. | Not reported |
| Comparators | Describe the interventions or strategies being compared and state why they were chosen. | 837 |
| Time horizon | State the time horizon(s) over which costs and consequences are being evaluated and say why appropriate. | Not reported |
| Discount rate | Report the choice of discount rate(s) used for costs and outcomes and say why appropriate. | Not reported |
| Choice of health outcomes | Describe what outcomes were used as the measure(s) of benefit in the evaluation and their relevance for the type of analysis performed. | Not reported |
| Measurement of effectiveness | Single study‐based estimates: Describe fully the design features of the single effectiveness study and why the single study was a sufficient source of clinical effectiveness data. | Not reported |
| Synthesis‐based estimates: Describe fully the methods used for identification of included studies and synthesis of clinical effectiveness data. | Not applicable | |
| Measurement and valuation of preference based outcomes | If applicable, describe the population and methods used to elicit preferences for outcomes. | Not reported |
| Estimating resources and costs | Single study‐based economic evaluation: Describe approaches used to estimate resource use associated with the alternative interventions. Describe primary or secondary research methods for valuing each resource item in terms of its unit cost. Describe any adjustments made to approximate to opportunity costs. | Not reported |
| Currency, price date, and conversion | Report the dates of the estimated resource quantities and unit costs. Describe methods for adjusting estimated unit costs to the year of reported costs if necessary. Describe methods for converting costs into a common currency base and the exchange rate. | Not reported |
| Choice of model | Describe and give reasons for the specific type of decision‐analytical model used. Providing a figure to show model structure is strongly recommended. | Not applicable |
| Assumptions | Describe all structural or other assumptions underpinning the decision‐analytical model. | Not applicable |
| Analytical methods | Describe all analytical methods supporting the evaluation. This could include methods for dealing with skewed, missing, or censored data; extrapolation methods; methods for pooling data; approaches to validate or make adjustments (such as half cycle corrections) to a model; and methods for handling population heterogeneity and uncertainty. | Not reported |
| Results | ||
| Study parameters | Report the values, ranges, references, and, if used, probability distributions for all parameters. Report reasons or sources for distributions used to represent uncertainty where appropriate. Providing a table to show the input values is strongly recommended. | Not reported |
| Incremental costs and outcomes | For each intervention, report mean values for the main categories of estimated costs and outcomes of interest, as well as mean differences between the comparator groups. If applicable, report incremental cost‐effectiveness ratios. | Not reported |
| Characterising uncertainty | Single study‐based economic evaluation: Describe the effects of sampling uncertainty for the estimated incremental cost and incremental effectiveness parameters, together with the impact of methodological assumptions (such as discount rate, study perspective). | Not reported |
| Model‐based economic evaluation: Describe the effects on the results of uncertainty for all input parameters, and uncertainty related to the structure of the model and assumptions. | Not applicable | |
| Characterising heterogeneity | If applicable, report differences in costs, outcomes, or cost‐effectiveness that can be explained by variations between subgroups of patients with different baseline characteristics or other observed variability in effects that are not reducible by more information. | Not applicable |
| Discussion | ||
| Study findings, limitations, generalisability, and current knowledge | Summarise key study findings and describe how they support the conclusions reached. Discuss limitations and the generalisability of the findings and how the findings fit with current knowledge. | 841 |
| Other | ||
| Source of funding | Describe how the study was funded and the role of the funder in the identification, design, conduct, and reporting of the analysis. Describe other non‐monetary sources of support. | 841 |
| Conflicts of interest | Describe any potential for conflict of interest of study contributors in accordance with journal policy. In the absence of a journal policy, we recommend authors comply with International Committee of Medical Journal Editors recommendations. | Not reported |
| Krein 2004 | ||
| Title | Identify the study as an economic evaluation or use more specific terms such as “cost‐effectiveness analysis”, and describe the interventions compared. | Not reported |
| Abstract | Provide a structured summary of objectives, perspective, setting, methods (including study design and inputs), results (including base case and uncertainty analyses), and conclusions. | Not reported |
| Introduction | ||
| Background and objectives | Provide an explicit statement of the broader context for the study. | 732 |
| Present the study question and its relevance for health policy or practice decisions. | 732 | |
| Methods | ||
| Target population and subgroups | Describe characteristics of the base case population and subgroups analysed, including why they were chosen. | 733 |
| Setting and location | State relevant aspects of the system(s) in which the decision(s) need(s) to be made. | 733 |
| Study perspective | Describe the perspective of the study and relate this to the costs being evaluated. | Not reported |
| Comparators | Describe the interventions or strategies being compared and state why they were chosen. | 733 |
| Time horizon | State the time horizon(s) over which costs and consequences are being evaluated and say why appropriate. | Not reported |
| Discount rate | Report the choice of discount rate(s) used for costs and outcomes and say why appropriate. | Not reported |
| Choice of health outcomes | Describe what outcomes were used as the measure(s) of benefit in the evaluation and their relevance for the type of analysis performed. | Not reported |
| Measurement of effectiveness | Single study‐based estimates: Describe fully the design features of the single effectiveness study and why the single study was a sufficient source of clinical effectiveness data. | Not reported |
| Synthesis‐based estimates: Describe fully the methods used for identification of included studies and synthesis of clinical effectiveness data. | ||
| Measurement and valuation of preference based outcomes | If applicable, describe the population and methods used to elicit preferences for outcomes. | Not reported |
| Estimating resources and costs | Single study‐based economic evaluation: Describe approaches used to estimate resource use associated with the alternative interventions. Describe primary or secondary research methods for valuing each resource item in terms of its unit cost. Describe any adjustments made to approximate to opportunity costs. | Not reported |
| Currency, price date, and conversion | Report the dates of the estimated resource quantities and unit costs. Describe methods for adjusting estimated unit costs to the year of reported costs if necessary. Describe methods for converting costs into a common currency base and the exchange rate. | Not reported |
| Choice of model | Describe and give reasons for the specific type of decision‐analytical model used. Providing a figure to show model structure is strongly recommended. | |
| Assumptions | Describe all structural or other assumptions underpinning the decision‐analytical model. | Not reported |
| Analytical methods | Describe all analytical methods supporting the evaluation. This could include methods for dealing with skewed, missing, or censored data; extrapolation methods; methods for pooling data; approaches to validate or make adjustments (such as half cycle corrections) to a model; and methods for handling population heterogeneity and uncertainty. | Not reported |
| Results | ||
| Study parameters | Report the values, ranges, references, and, if used, probability distributions for all parameters. Report reasons or sources for distributions used to represent uncertainty where appropriate. Providing a table to show the input values is strongly recommended. | Not reported |
| Incremental costs and outcomes | For each intervention, report mean values for the main categories of estimated costs and outcomes of interest, as well as mean differences between the comparator groups. If applicable, report incremental cost‐effectiveness ratios. | Not reported |
| Characterising uncertainty | Single study‐based economic evaluation: Describe the effects of sampling uncertainty for the estimated incremental cost and incremental effectiveness parameters, together with the impact of methodological assumptions (such as discount rate, study perspective). | Not reported |
| Model‐based economic evaluation: Describe the effects on the results of uncertainty for all input parameters, and uncertainty related to the structure of the model and assumptions. | Not applicable | |
| Characterising heterogeneity | If applicable, report differences in costs, outcomes, or cost‐effectiveness that can be explained by variations between subgroups of patients with different baseline characteristics or other observed variability in effects that are not reducible by more information. | Not applicable |
| Discussion | ||
| Study findings, limitations, generalisability, and current knowledge | Summarise key study findings and describe how they support the conclusions reached. Discuss limitations and the generalisability of the findings and how the findings fit with current knowledge. | 738 |
| Other | ||
| Source of funding | Describe how the study was funded and the role of the funder in the identification, design, conduct, and reporting of the analysis. Describe other non‐monetary sources of support. | 732 |
| Conflicts of interest | Describe any potential for conflict of interest of study contributors in accordance with journal policy. In the absence of a journal policy, we recommend authors comply with International Committee of Medical Journal Editors recommendations. | Not reported |
| Litaker 2003 | ||
| Title | Identify the study as an economic evaluation or use more specific terms such as “cost‐effectiveness analysis”, and describe the interventions compared. | front page |
| Abstract | Provide a structured summary of objectives, perspective, setting, methods (including study design and inputs), results (including base case and uncertainty analyses), and conclusions. | Not reported |
| Introduction | ||
| Background and objectives | Provide an explicit statement of the broader context for the study. | 224 |
| Present the study question and its relevance for health policy or practice decisions. | 224 | |
| Methods | ||
| Target population and subgroups | Describe characteristics of the base case population and subgroups analysed, including why they were chosen. | 225 |
| Setting and location | State relevant aspects of the system(s) in which the decision(s) need(s) to be made. | 225 |
| Study perspective | Describe the perspective of the study and relate this to the costs being evaluated. | Not reported |
| Comparators | Describe the interventions or strategies being compared and state why they were chosen. | 226 |
| Time horizon | State the time horizon(s) over which costs and consequences are being evaluated and say why appropriate. | Not reported |
| Discount rate | Report the choice of discount rate(s) used for costs and outcomes and say why appropriate. | Not reported |
| Choice of health outcomes | Describe what outcomes were used as the measure(s) of benefit in the evaluation and their relevance for the type of analysis performed. | Not reported |
| Measurement of effectiveness | Single study‐based estimates: Describe fully the design features of the single effectiveness study and why the single study was a sufficient source of clinical effectiveness data. | Not reported |
| Synthesis‐based estimates: Describe fully the methods used for identification of included studies and synthesis of clinical effectiveness data. | Not reported | |
| Measurement and valuation of preference based outcomes | If applicable, describe the population and methods used to elicit preferences for outcomes. | 226 |
| Estimating resources and costs | Single study‐based economic evaluation: Describe approaches used to estimate resource use associated with the alternative interventions. Describe primary or secondary research methods for valuing each resource item in terms of its unit cost. Describe any adjustments made to approximate to opportunity costs. | Not reported |
| Currency, price date, and conversion | Report the dates of the estimated resource quantities and unit costs. Describe methods for adjusting estimated unit costs to the year of reported costs if necessary. Describe methods for converting costs into a common currency base and the exchange rate. | Not reported |
| Choice of model | Describe and give reasons for the specific type of decision‐analytical model used. Providing a figure to show model structure is strongly recommended. | Not applicable |
| Assumptions | Describe all structural or other assumptions underpinning the decision‐analytical model. | Not applicable |
| Analytical methods | Describe all analytical methods supporting the evaluation. This could include methods for dealing with skewed, missing, or censored data; extrapolation methods; methods for pooling data; approaches to validate or make adjustments (such as half cycle corrections) to a model; and methods for handling population heterogeneity and uncertainty. | Not applicable |
| Results | ||
| Study parameters | Report the values, ranges, references, and, if used, probability distributions for all parameters. Report reasons or sources for distributions used to represent uncertainty where appropriate. Providing a table to show the input values is strongly recommended. | Not reported |
| Incremental costs and outcomes | For each intervention, report mean values for the main categories of estimated costs and outcomes of interest, as well as mean differences between the comparator groups. If applicable, report incremental cost‐effectiveness ratios. | Not reported |
| Characterising uncertainty | Single study‐based economic evaluation: Describe the effects of sampling uncertainty for the estimated incremental cost and incremental effectiveness parameters, together with the impact of methodological assumptions (such as discount rate, study perspective). | Not reported |
| Model‐based economic evaluation: Describe the effects on the results of uncertainty for all input parameters, and uncertainty related to the structure of the model and assumptions. | Not applicable | |
| Characterising heterogeneity | If applicable, report differences in costs, outcomes, or cost‐effectiveness that can be explained by variations between subgroups of patients with different baseline characteristics or other observed variability in effects that are not reducible by more information. | 232 |
| Discussion | ||
| Study findings, limitations, generalisability, and current knowledge | Summarise key study findings and describe how they support the conclusions reached. Discuss limitations and the generalisability of the findings and how the findings fit with current knowledge. | 234 |
| Other | ||
| Source of funding | Describe how the study was funded and the role of the funder in the identification, design, conduct, and reporting of the analysis. Describe other non‐monetary sources of support. | 235 |
| Conflicts of interest | Describe any potential for conflict of interest of study contributors in accordance with journal policy. In the absence of a journal policy, we recommend authors comply with International Committee of Medical Journal Editors recommendations. | Not reported |
| McCall 2011 | ||
| Title | Identify the study as an economic evaluation or use more specific terms such as “cost‐effectiveness analysis”, and describe the interventions compared. | Not reported |
| Abstract | Provide a structured summary of objectives, perspective, setting, methods (including study design and inputs), results (including base case and uncertainty analyses), and conclusions. | Not reported |
| Introduction | ||
| Background and objectives | Provide an explicit statement of the broader context for the study. | 1705 |
| Present the study question and its relevance for health policy or practice decisions. | 1706 | |
| Methods | ||
| Target population and subgroups | Describe characteristics of the base case population and subgroups analysed, including why they were chosen. | 1708 |
| Setting and location | State relevant aspects of the system(s) in which the decision(s) need(s) to be made. | 1705 |
| Study perspective | Describe the perspective of the study and relate this to the costs being evaluated. | Not reported |
| Comparators | Describe the interventions or strategies being compared and state why they were chosen. | Not reported |
| Time horizon | State the time horizon(s) over which costs and consequences are being evaluated and say why appropriate. | Not reported |
| Discount rate | Report the choice of discount rate(s) used for costs and outcomes and say why appropriate. | Not reported |
| Choice of health outcomes | Describe what outcomes were used as the measure(s) of benefit in the evaluation and their relevance for the type of analysis performed. | Not reported |
| Measurement of effectiveness | Single study‐based estimates: Describe fully the design features of the single effectiveness study and why the single study was a sufficient source of clinical effectiveness data. | Not reported |
| Synthesis‐based estimates: Describe fully the methods used for identification of included studies and synthesis of clinical effectiveness data. | Not applicable | |
| Measurement and valuation of preference based outcomes | If applicable, describe the population and methods used to elicit preferences for outcomes. | Not applicable |
| Estimating resources and costs | Single study‐based economic evaluation: Describe approaches used to estimate resource use associated with the alternative interventions. Describe primary or secondary research methods for valuing each resource item in terms of its unit cost. Describe any adjustments made to approximate to opportunity costs. | Not reported |
| Currency, price date, and conversion | Report the dates of the estimated resource quantities and unit costs. Describe methods for adjusting estimated unit costs to the year of reported costs if necessary. Describe methods for converting costs into a common currency base and the exchange rate. | Not reported |
| Choice of model | Describe and give reasons for the specific type of decision‐analytical model used. Providing a figure to show model structure is strongly recommended. | Not applicable |
| Assumptions | Describe all structural or other assumptions underpinning the decision‐analytical model. | Not applicable |
| Analytical methods | Describe all analytical methods supporting the evaluation. This could include methods for dealing with skewed, missing, or censored data; extrapolation methods; methods for pooling data; approaches to validate or make adjustments (such as half cycle corrections) to a model; and methods for handling population heterogeneity and uncertainty. | Not applicable |
| Results | ||
| Study parameters | Report the values, ranges, references, and, if used, probability distributions for all parameters. Report reasons or sources for distributions used to represent uncertainty where appropriate. Providing a table to show the input values is strongly recommended. | Not reported |
| Incremental costs and outcomes | For each intervention, report mean values for the main categories of estimated costs and outcomes of interest, as well as mean differences between the comparator groups. If applicable, report incremental cost‐effectiveness ratios. | Not reported |
| Characterising uncertainty | Single study‐based economic evaluation: Describe the effects of sampling uncertainty for the estimated incremental cost and incremental effectiveness parameters, together with the impact of methodological assumptions (such as discount rate, study perspective). | Not reported |
| Model‐based economic evaluation: Describe the effects on the results of uncertainty for all input parameters, and uncertainty related to the structure of the model and assumptions | Not applicable | |
| Characterising heterogeneity | If applicable, report differences in costs, outcomes, or cost‐effectiveness that can be explained by variations between subgroups of patients with different baseline characteristics or other observed variability in effects that are not reducible by more information. | Not applicable |
| Discussion | ||
| Study findings, limitations, generalisability, and current knowledge | Summarise key study findings and describe how they support the conclusions reached. Discuss limitations and the generalisability of the findings and how the findings fit with current knowledge. | 1712 |
| Other | ||
| Source of funding | Describe how the study was funded and the role of the funder in the identification, design, conduct, and reporting of the analysis. Describe other non‐monetary sources of support. | Not reported |
| Conflicts of interest | Describe any potential for conflict of interest of study contributors in accordance with journal policy. In the absence of a journal policy, we recommend authors comply with International Committee of Medical Journal Editors recommendations. | Not reported |
| Piette 2001 | ||
| Title | Identify the study as an economic evaluation or use more specific terms such as “cost‐effectiveness analysis”, and describe the interventions compared. | Not reported |
| Abstract | Provide a structured summary of objectives, perspective, setting, methods (including study design and inputs), results (including base case and uncertainty analyses), and conclusions. | Not reported |
| Introduction | ||
| Background and objectives | Provide an explicit statement of the broader context for the study. | 202 ‐ 203 |
| Present the study question and its relevance for health policy or practice decisions. | Not reported | |
| Methods | ||
| Target population and subgroups | Describe characteristics of the base case population and subgroups analysed, including why they were chosen. | 204 |
| Setting and location | State relevant aspects of the system(s) in which the decision(s) need(s) to be made. | 203 |
| Study perspective | Describe the perspective of the study and relate this to the costs being evaluated. | Not reported |
| Comparators | Describe the interventions or strategies being compared and state why they were chosen. | 177 |
| Time horizon | State the time horizon(s) over which costs and consequences are being evaluated and say why appropriate. | Not reported |
| Discount rate | Report the choice of discount rate(s) used for costs and outcomes and say why appropriate. | Not reported |
| Choice of health outcomes | Describe what outcomes were used as the measure(s) of benefit in the evaluation and their relevance for the type of analysis performed. | Not reported |
| Measurement of effectiveness | Single study‐based estimates: Describe fully the design features of the single effectiveness study and why the single study was a sufficient source of clinical effectiveness data. | Not reported |
| Synthesis‐based estimates: Describe fully the methods used for identification of included studies and synthesis of clinical effectiveness data. | Not applicable | |
| Measurement and valuation of preference based outcomes | If applicable, describe the population and methods used to elicit preferences for outcomes. | Not applicable |
| Estimating resources and costs | Single study‐based economic evaluation: Describe approaches used to estimate resource use associated with the alternative interventions. Describe primary or secondary research methods for valuing each resource item in terms of its unit cost. Describe any adjustments made to approximate to opportunity costs. | Not reported |
| Currency, price date, and conversion | Report the dates of the estimated resource quantities and unit costs. Describe methods for adjusting estimated unit costs to the year of reported costs if necessary. Describe methods for converting costs into a common currency base and the exchange rate. | Not reported |
| Choice of model | Describe and give reasons for the specific type of decision‐analytical model used. Providing a figure to show model structure is strongly recommended. | Not applicable |
| Assumptions | Describe all structural or other assumptions underpinning the decision‐analytical model. | Not applicable |
| Analytical methods | Describe all analytical methods supporting the evaluation. This could include methods for dealing with skewed, missing, or censored data; extrapolation methods; methods for pooling data; approaches to validate or make adjustments (such as half cycle corrections) to a model; and methods for handling population heterogeneity and uncertainty. | Not applicable |
| Results | ||
| Study parameters | Report the values, ranges, references, and, if used, probability distributions for all parameters. Report reasons or sources for distributions used to represent uncertainty where appropriate. Providing a table to show the input values is strongly recommended. | Not reported |
| Incremental costs and outcomes | For each intervention, report mean values for the main categories of estimated costs and outcomes of interest, as well as mean differences between the comparator groups. If applicable, report incremental cost‐effectiveness ratios. | Not reported |
| Characterising uncertainty | Single study‐based economic evaluation: Describe the effects of sampling uncertainty for the estimated incremental cost and incremental effectiveness parameters, together with the impact of methodological assumptions (such as discount rate, study perspective). | Not reported |
| Model‐based economic evaluation: Describe the effects on the results of uncertainty for all input parameters, and uncertainty related to the structure of the model and assumptions. | Not applicable | |
| Characterising heterogeneity | If applicable, report differences in costs, outcomes, or cost‐effectiveness that can be explained by variations between subgroups of patients with different baseline characteristics or other observed variability in effects that are not reducible by more information. | Not reported |
| Discussion | ||
| Study findings, limitations, generalisability, and current knowledge | Summarise key study findings and describe how they support the conclusions reached. Discuss limitations and the generalisability of the findings and how the findings fit with current knowledge. | 207 |
| Other | ||
| Source of funding | Describe how the study was funded and the role of the funder in the identification, design, conduct, and reporting of the analysis. Describe other non‐monetary sources of support. | 207 |
| Conflicts of interest | Describe any potential for conflict of interest of study contributors in accordance with journal policy. In the absence of a journal policy, we recommend authors comply with International Committee of Medical Journal Editors recommendations. | Not reported |
| Pizzi 2015 | ||
| Title | Identify the study as an economic evaluation or use more specific terms such as “cost‐effectiveness analysis”, and describe the interventions compared. | front page |
| Abstract | Provide a structured summary of objectives, perspective, setting, methods (including study design and inputs), results (including base case and uncertainty analyses), and conclusions. | front page |
| Introduction | ||
| Background and objectives | Provide an explicit statement of the broader context for the study. | 254 |
| Present the study question and its relevance for health policy or practice decisions. | 254 | |
| Methods | ||
| Target population and subgroups | Describe characteristics of the base case population and subgroups analysed, including why they were chosen. | 254 |
| Setting and location | State relevant aspects of the system(s) in which the decision(s) need(s) to be made. | 254 |
| Study perspective | Describe the perspective of the study and relate this to the costs being evaluated. | 255 |
| Comparators | Describe the interventions or strategies being compared and state why they were chosen. | 254 |
| Time horizon | State the time horizon(s) over which costs and consequences are being evaluated and say why appropriate. | 256 |
| Discount rate | Report the choice of discount rate(s) used for costs and outcomes and say why appropriate. | 256 |
| Choice of health outcomes | Describe what outcomes were used as the measure(s) of benefit in the evaluation and their relevance for the type of analysis performed. | 255 |
| Measurement of effectiveness | Single study‐based estimates: Describe fully the design features of the single effectiveness study and why the single study was a sufficient source of clinical effectiveness data. | 254 ‐ 255 |
| Synthesis‐based estimates: Describe fully the methods used for identification of included studies and synthesis of clinical effectiveness data. | Not reported | |
| Measurement and valuation of preference based outcomes | If applicable, describe the population and methods used to elicit preferences for outcomes. | Not applicable |
| Estimating resources and costs | Single study‐based economic evaluation: Describe approaches used to estimate resource use associated with the alternative interventions. Describe primary or secondary research methods for valuing each resource item in terms of its unit cost. Describe any adjustments made to approximate to opportunity costs. | 256 |
| Currency, price date, and conversion | Report the dates of the estimated resource quantities and unit costs. Describe methods for adjusting estimated unit costs to the year of reported costs if necessary. Describe methods for converting costs into a common currency base and the exchange rate. | 256 |
| Choice of model | Describe and give reasons for the specific type of decision‐analytical model used. Providing a figure to show model structure is strongly recommended. | 256 |
| Assumptions | Describe all structural or other assumptions underpinning the decision‐analytical model. | 256 ‐ 257 |
| Analytical methods | Describe all analytical methods supporting the evaluation. This could include methods for dealing with skewed, missing, or censored data; extrapolation methods; methods for pooling data; approaches to validate or make adjustments (such as half cycle corrections) to a model; and methods for handling population heterogeneity and uncertainty. | 256 |
| Results | ||
| Study parameters | Report the values, ranges, references, and, if used, probability distributions for all parameters. Report reasons or sources for distributions used to represent uncertainty where appropriate. Providing a table to show the input values is strongly recommended. | 258 ‐ 259 |
| Incremental costs and outcomes | For each intervention, report mean values for the main categories of estimated costs and outcomes of interest, as well as mean differences between the comparator groups. If applicable, report incremental cost‐effectiveness ratios. | 260 |
| Characterising uncertainty | Single study‐based economic evaluation: Describe the effects of sampling uncertainty for the estimated incremental cost and incremental effectiveness parameters, together with the impact of methodological assumptions (such as discount rate, study perspective). | 258 ‐ 260 |
| Model‐based economic evaluation: Describe the effects on the results of uncertainty for all input parameters, and uncertainty related to the structure of the model and assumptions. | Not reported | |
| Characterising heterogeneity | If applicable, report differences in costs, outcomes, or cost‐effectiveness that can be explained by variations between subgroups of patients with different baseline characteristics or other observed variability in effects that are not reducible by more information. | 258 ‐ 260 |
| Discussion | ||
| Study findings, limitations, generalisability, and current knowledge | Summarise key study findings and describe how they support the conclusions reached. Discuss limitations and the generalisability of the findings and how the findings fit with current knowledge. | 261 ‐ 262 |
| Other | ||
| Source of funding | Describe how the study was funded and the role of the funder in the identification, design, conduct, and reporting of the analysis. Describe other non‐monetary sources of support. | 263 |
| Conflicts of interest | Describe any potential for conflict of interest of study contributors in accordance with journal policy. In the absence of a journal policy, we recommend authors comply with International Committee of Medical Journal Editors recommendations. | 263 |
| Prezio 2014 | ||
| Title | Identify the study as an economic evaluation or use more specific terms such as “cost‐effectiveness analysis”, and describe the interventions compared. | 771 |
| Abstract | Provide a structured summary of objectives, perspective, setting, methods (including study design and inputs), results (including base case and uncertainty analyses), and conclusions. | 771 |
| Introduction | ||
| Background and objectives | Provide an explicit statement of the broader context for the study. | 772 |
| Present the study question and its relevance for health policy or practice decisions. | 772 | |
| Methods | ||
| Target population and subgroups | Describe characteristics of the base case population and subgroups analysed, including why they were chosen. | 772 |
| Setting and location | State relevant aspects of the system(s) in which the decision(s) need(s) to be made. | 772 |
| Study perspective | Describe the perspective of the study and relate this to the costs being evaluated. | 772 |
| Comparators | Describe the interventions or strategies being compared and state why they were chosen. | 772 |
| Time horizon | State the time horizon(s) over which costs and consequences are being evaluated and say why appropriate. | 772 |
| Discount rate | Report the choice of discount rate(s) used for costs and outcomes and say why appropriate. | 772 |
| Choice of health outcomes | Describe what outcomes were used as the measure(s) of benefit in the evaluation and their relevance for the type of analysis performed. | 774 |
| Measurement of effectiveness | Single study‐based estimates: Describe fully the design features of the single effectiveness study and why the single study was a sufficient source of clinical effectiveness data. | 772 |
| Synthesis‐based estimates: Describe fully the methods used for identification of included studies and synthesis of clinical effectiveness data. | Not reported | |
| Measurement and valuation of preference based outcomes | If applicable, describe the population and methods used to elicit preferences for outcomes. | Not applicable |
| Estimating resources and costs | Single study‐based economic evaluation: Describe approaches used to estimate resource use associated with the alternative interventions. Describe primary or secondary research methods for valuing each resource item in terms of its unit cost. Describe any adjustments made to approximate to opportunity costs. | 772 |
| Currency, price date, and conversion | Report the dates of the estimated resource quantities and unit costs. Describe methods for adjusting estimated unit costs to the year of reported costs if necessary. Describe methods for converting costs into a common currency base and the exchange rate. | 772 |
| Choice of model | Describe and give reasons for the specific type of decision‐analytical model used. Providing a figure to show model structure is strongly recommended. | 772 |
| Assumptions | Describe all structural or other assumptions underpinning the decision‐analytical model. | 772 ‐ 774 |
| Analytical methods | Describe all analytical methods supporting the evaluation. This could include methods for dealing with skewed, missing, or censored data; extrapolation methods; methods for pooling data; approaches to validate or make adjustments (such as half cycle corrections) to a model; and methods for handling population heterogeneity and uncertainty. | 774 |
| Results | ||
| Study parameters | Report the values, ranges, references, and, if used, probability distributions for all parameters. Report reasons or sources for distributions used to represent uncertainty where appropriate. Providing a table to show the input values is strongly recommended. | 774 ‐ 776 |
| Incremental costs and outcomes | For each intervention, report mean values for the main categories of estimated costs and outcomes of interest, as well as mean differences between the comparator groups. If applicable, report incremental cost‐effectiveness ratios. | 777 |
| Characterising uncertainty | Single study‐based economic evaluation: Describe the effects of sampling uncertainty for the estimated incremental cost and incremental effectiveness parameters, together with the impact of methodological assumptions (such as discount rate, study perspective). | 776 ‐ 777 |
| Model‐based economic evaluation: Describe the effects on the results of uncertainty for all input parameters, and uncertainty related to the structure of the model and assumptions. | Not applicable | |
| Characterising heterogeneity | If applicable, report differences in costs, outcomes, or cost‐effectiveness that can be explained by variations between subgroups of patients with different baseline characteristics or other observed variability in effects that are not reducible by more information. | 777 |
| Discussion | ||
| Study findings, limitations, generalisability, and current knowledge | Summarise key study findings and describe how they support the conclusions reached. Discuss limitations and the generalisability of the findings and how the findings fit with current knowledge. | 775 |
| Other | ||
| Source of funding | Describe how the study was funded and the role of the funder in the identification, design, conduct, and reporting of the analysis. Describe other non‐monetary sources of support. | 778 |
| Conflicts of interest | Describe any potential for conflict of interest of study contributors in accordance with journal policy. In the absence of a journal policy, we recommend authors comply with International Committee of Medical Journal Editors recommendations. | 778 |
| Schechter 2008 | ||
| Title | Identify the study as an economic evaluation or use more specific terms such as “cost‐effectiveness analysis”, and describe the interventions compared. | 763 |
| Abstract | Provide a structured summary of objectives, perspective, setting, methods (including study design and inputs), results (including base case and uncertainty analyses), and conclusions. | 763 |
| Introduction | ||
| Background and objectives | Provide an explicit statement of the broader context for the study. | 763 ‐ 764 |
| Present the study question and its relevance for health policy or practice decisions. | 764 | |
| Methods | ||
| Target population and subgroups | Describe characteristics of the base case population and subgroups analysed, including why they were chosen. | 764 |
| Setting and location | State relevant aspects of the system(s) in which the decision(s) need(s) to be made. | 764 |
| Study perspective | Describe the perspective of the study and relate this to the costs being evaluated. | 764 |
| Comparators | Describe the interventions or strategies being compared and state why they were chosen. | 764 |
| Time horizon | State the time horizon(s) over which costs and consequences are being evaluated and say why appropriate. | 764 |
| Discount rate | Report the choice of discount rate(s) used for costs and outcomes and say why appropriate. | 765 |
| Choice of health outcomes | Describe what outcomes were used as the measure(s) of benefit in the evaluation and their relevance for the type of analysis performed. | 764 |
| Measurement of effectiveness | Single study‐based estimates: Describe fully the design features of the single effectiveness study and why the single study was a sufficient source of clinical effectiveness data. | 764 |
| Synthesis‐based estimates: Describe fully the methods used for identification of included studies and synthesis of clinical effectiveness data. | Not applicable | |
| Measurement and valuation of preference based outcomes | If applicable, describe the population and methods used to elicit preferences for outcomes. | 765 |
| Estimating resources and costs | Single study‐based economic evaluation: Describe approaches used to estimate resource use associated with the alternative interventions. Describe primary or secondary research methods for valuing each resource item in terms of its unit cost. Describe any adjustments made to approximate to opportunity costs. | 764 |
| Currency, price date, and conversion | Report the dates of the estimated resource quantities and unit costs. Describe methods for adjusting estimated unit costs to the year of reported costs if necessary. Describe methods for converting costs into a common currency base and the exchange rate. | 764 |
| Choice of model | Describe and give reasons for the specific type of decision‐analytical model used. Providing a figure to show model structure is strongly recommended. | Not applicable |
| Assumptions | Describe all structural or other assumptions underpinning the decision‐analytical model. | Not applicable |
| Analytical methods | Describe all analytical methods supporting the evaluation. This could include methods for dealing with skewed, missing, or censored data; extrapolation methods; methods for pooling data; approaches to validate or make adjustments (such as half cycle corrections) to a model; and methods for handling population heterogeneity and uncertainty. | 765 |
| Results | ||
| Study parameters | Report the values, ranges, references, and, if used, probability distributions for all parameters. Report reasons or sources for distributions used to represent uncertainty where appropriate. Providing a table to show the input values is strongly recommended. | 766 |
| Incremental costs and outcomes | For each intervention, report mean values for the main categories of estimated costs and outcomes of interest, as well as mean differences between the comparator groups. If applicable, report incremental cost‐effectiveness ratios. | 765 |
| Characterising uncertainty | Single study‐based economic evaluation: Describe the effects of sampling uncertainty for the estimated incremental cost and incremental effectiveness parameters, together with the impact of methodological assumptions (such as discount rate, study perspective) | 766 |
| Model‐based economic evaluation: Describe the effects on the results of uncertainty for all input parameters, and uncertainty related to the structure of the model and assumptions. | Not applicable | |
| Characterising heterogeneity | If applicable, report differences in costs, outcomes, or cost‐effectiveness that can be explained by variations between subgroups of patients with different baseline characteristics or other observed variability in effects that are not reducible by more information. | 765 |
| Discussion | ||
| Study findings, limitations, generalisability, and current knowledge | Summarise key study findings and describe how they support the conclusions reached. Discuss limitations and the generalisability of the findings and how the findings fit with current knowledge. | 767 |
| Other | ||
| Source of funding | Describe how the study was funded and the role of the funder in the identification, design, conduct, and reporting of the analysis. Describe other non‐monetary sources of support. | 767 |
| Conflicts of interest | Describe any potential for conflict of interest of study contributors in accordance with journal policy. In the absence of a journal policy, we recommend authors comply with International Committee of Medical Journal Editors recommendations. | 768 |
| Wagner 2001 | ||
| Title | Identify the study as an economic evaluation or use more specific terms such as “cost‐effectiveness analysis”, and describe the interventions compared. | Not reported |
| Abstract | Provide a structured summary of objectives, perspective, setting, methods (including study design and inputs), results (including base case and uncertainty analyses), and conclusions. | Not reported |
| Introduction | ||
| Background and objectives | Provide an explicit statement of the broader context for the study. | 695 |
| Present the study question and its relevance for health policy or practice decisions. | 695 | |
| Methods | ||
| Target population and subgroups | Describe characteristics of the base case population and subgroups analysed, including why they were chosen. | 697 |
| Setting and location | State relevant aspects of the system(s) in which the decision(s) need(s) to be made. | 695 ‐ 696 |
| Study perspective | Describe the perspective of the study and relate this to the costs being evaluated. | Not reported |
| Comparators | Describe the interventions or strategies being compared and state why they were chosen. | Not reported |
| Time horizon | State the time horizon(s) over which costs and consequences are being evaluated and say why appropriate. | Not reported |
| Discount rate | Report the choice of discount rate(s) used for costs and outcomes and say why appropriate. | Not reported |
| Choice of health outcomes | Describe what outcomes were used as the measure(s) of benefit in the evaluation and their relevance for the type of analysis performed. | Not reported |
| Measurement of effectiveness | Single study‐based estimates: Describe fully the design features of the single effectiveness study and why the single study was a sufficient source of clinical effectiveness data. | Not reported |
| Synthesis‐based estimates: Describe fully the methods used for identification of included studies and synthesis of clinical effectiveness data. | Not applicable | |
| Measurement and valuation of preference based outcomes | If applicable, describe the population and methods used to elicit preferences for outcomes. | Not applicable |
| Estimating resources and costs | Single study‐based economic evaluation: Describe approaches used to estimate resource use associated with the alternative interventions. Describe primary or secondary research methods for valuing each resource item in terms of its unit cost. Describe any adjustments made to approximate to opportunity costs. | Not reported |
| Currency, price date, and conversion | Report the dates of the estimated resource quantities and unit costs. Describe methods for adjusting estimated unit costs to the year of reported costs if necessary. Describe methods for converting costs into a common currency base and the exchange rate. | Not reported |
| Choice of model | Describe and give reasons for the specific type of decision‐analytical model used. Providing a figure to show model structure is strongly recommended. | Not applicable |
| Assumptions | Describe all structural or other assumptions underpinning the decision‐analytical model. | Not applicable |
| Analytical methods | Describe all analytical methods supporting the evaluation. This could include methods for dealing with skewed, missing, or censored data; extrapolation methods; methods for pooling data; approaches to validate or make adjustments (such as half cycle corrections) to a model; and methods for handling population heterogeneity and uncertainty. | Not reported |
| Results | ||
| Study parameters | Report the values, ranges, references, and, if used, probability distributions for all parameters. Report reasons or sources for distributions used to represent uncertainty where appropriate. Providing a table to show the input values is strongly recommended. | 697 ‐ 698 |
| Incremental costs and outcomes | For each intervention, report mean values for the main categories of estimated costs and outcomes of interest, as well as mean differences between the comparator groups. If applicable, report incremental cost‐effectiveness ratios. | Not reported |
| Characterising uncertainty | Single study‐based economic evaluation: Describe the effects of sampling uncertainty for the estimated incremental cost and incremental effectiveness parameters, together with the impact of methodological assumptions (such as discount rate, study perspective). | Not reported |
| Model‐based economic evaluation: Describe the effects on the results of uncertainty for all input parameters, and uncertainty related to the structure of the model and assumptions | Not reported | |
| Characterising heterogeneity | If applicable, report differences in costs, outcomes, or cost‐effectiveness that can be explained by variations between subgroups of patients with different baseline characteristics or other observed variability in effects that are not reducible by more information. | Not reported |
| Discussion | ||
| Study findings, limitations, generalisability, and current knowledge | Summarise key study findings and describe how they support the conclusions reached. Discuss limitations and the generalisability of the findings and how the findings fit with current knowledge. | 698 ‐ 699 |
| Other | ||
| Source of funding | Describe how the study was funded and the role of the funder in the identification, design, conduct, and reporting of the analysis. Describe other non‐monetary sources of support. | 699 |
| Conflicts of interest | Describe any potential for conflict of interest of study contributors in accordance with journal policy. In the absence of a journal policy, we recommend authors comply with International Committee of Medical Journal Editors recommendations. | Not reported |
| Subgroup category | N studies | RD (95% CI) | I2 % |
| QI Strategy | |||
| Audit and feedback | 11 | 0.12 (0.06 to 0.18) | 89 |
| Case management | 18 | 0.14 (0.07 to 0.21) | 94 |
| Team changes | 19 | 0.20 (0.13 to 0.26) | 88 |
| Electronic patient registry | 10 | 0.18 (0.07 to 0.29) | 94 |
| Clinician education | 16 | 0.13 (0.07 to 0.19) | 95 |
| Clinician reminders | 10 | 0.13 (0.05 to 0.21) | 85 |
| Patient Education | 30 | 0.15 (0.13 to 0.18) | 95 |
| Promotion of self‐management | 21 | 0.19 (0.13 to 0.26) | 96 |
| Patient reminders | 16 | 0.11 (0.07 to 0.14) | 93 |
| BCT (patients) | |||
| Goal setting (Outcome) | 14 | 0.26 (0.16 to 0.36) | 93 |
| Feedback on outcomes of behaviour/biofeedback | 15 | 0.19 (0.13 to 0.25) | 80 |
| Credible source | 10 | 0.22 (0.06 to 0.38) | 95 |
| Prompts/cues | 25 | 0.11 (0.07 to 0.14) | 92 |
| Social support (unspecified) | 14 | 0.19 (0.09 to 0.28) | 93 |
| Problem solving | 10 | 0.17 (0.08 to 0.27) | 89 |
| Restructuring the social environment | 17 | 0.17 (0.10 to 0.24) | 85 |
| Instruction on how to perform behaviour | 34 | 0.13 (0.11 to 0.15) | 94 |
| Social support (practical) | 20 | 0.14 (0.09 to 0.20) | 90 |
| Information about health consequences | 19 | 0.12 (0.07 to 0.16) | 92 |
| BCT (healthcare professionals) | |||
| Restructuring the social environment | 23 | 0.19 (0.12 to 0.26) | 91 |
| Credible source | 13 | 0.16 (0.08 to 0.24) | 95 |
| Adding objects to the environment | 15 | 0.14 (0.07 to 0.20) | 88 |
| Social support (practical) | 10 | 0.13 (0.03 to 0.22) | 87 |
| Instruction on how to perform behaviour | 30 | 0.13 (0.08 to 0.17) | 93 |
| Prompts/cues | 15 | 0.12 (0.06 to 0.17) | 85 |
| Feedback on outcomes of behaviour/biofeedback | 17 | 0.11 (0.07 to 0.16) | 81 |
| Outcome or subgroup title | No. of studies | No. of participants | Statistical method | Effect size |
| 1 Proportion of participants attending screening Show forest plot | 56 | 329164 | Risk Difference (M‐H, Random, 95% CI) | 0.12 [0.10, 0.14] |
| 1.1 Intervention specifically targeting diabetic retinopathy screening | 13 | 118938 | Risk Difference (M‐H, Random, 95% CI) | 0.17 [0.11, 0.22] |
| 1.2 General intervention to improve the quality of diabetes care | 43 | 210226 | Risk Difference (M‐H, Random, 95% CI) | 0.12 [0.09, 0.15] |
| Outcome or subgroup title | No. of studies | No. of participants | Statistical method | Effect size |
| 1 Proportion of participants attending screening Show forest plot | 10 | 23715 | Risk Difference (M‐H, Random, 95% CI) | 0.05 [0.02, 0.09] |
| 1.1 Intervention specifically targeting diabetic retinopathy screening | 3 | 19698 | Risk Difference (M‐H, Random, 95% CI) | 0.04 [‐0.11, 0.19] |
| 1.2 General intervention to improve the quality of diabetes care | 7 | 4017 | Risk Difference (M‐H, Random, 95% CI) | 0.06 [0.02, 0.11] |