Interventionen um die Teilnahme an Früherkennungsuntersuchungen der diabetischen Retinopathie zu erhöhen
Abstract
Background
Despite evidence supporting the effectiveness of diabetic retinopathy screening (DRS) in reducing the risk of sight loss, attendance for screening is consistently below recommended levels.
Objectives
The primary objective of the review was to assess the effectiveness of quality improvement (QI) interventions that seek to increase attendance for DRS in people with type 1 and type 2 diabetes.
Secondary objectives were:
To use validated taxonomies of QI intervention strategies and behaviour change techniques (BCTs) to code the description of interventions in the included studies and determine whether interventions that include particular QI strategies or component BCTs are more effective in increasing screening attendance;
To explore heterogeneity in effect size within and between studies to identify potential explanatory factors for variability in effect size;
To explore differential effects in subgroups to provide information on how equity of screening attendance could be improved;
To critically appraise and summarise current evidence on the resource use, costs and cost effectiveness.
Search methods
We searched the Cochrane Library, MEDLINE, Embase, PsycINFO, Web of Science, ProQuest Family Health, OpenGrey, the ISRCTN, ClinicalTrials.gov, and the WHO ICTRP to identify randomised controlled trials (RCTs) that were designed to improve attendance for DRS or were evaluating general quality improvement (QI) strategies for diabetes care and reported the effect of the intervention on DRS attendance. We searched the resources on 13 February 2017. We did not use any date or language restrictions in the searches.
Selection criteria
We included RCTs that compared any QI intervention to usual care or a more intensive (stepped) intervention versus a less intensive intervention.
Data collection and analysis
We coded the QI strategy using a modification of the taxonomy developed by Cochrane Effective Practice and Organisation of Care (EPOC) and BCTs using the BCT Taxonomy version 1 (BCTTv1). We used Place of residence, Race/ethnicity/culture/language, Occupation, Gender/sex, Religion, Education, Socioeconomic status, and Social capital (PROGRESS) elements to describe the characteristics of participants in the included studies that could have an impact on equity of access to health services.
Two review authors independently extracted data. One review author entered the data into Review Manager 5 and a second review author checked them. Two review authors independently assessed risks of bias in the included studies and extracted data. We rated certainty of evidence using GRADE.
Main results
We included 66 RCTs conducted predominantly (62%) in the USA. Overall we judged the trials to be at low or unclear risk of bias. QI strategies were multifaceted and targeted patients, healthcare professionals or healthcare systems. Fifty‐six studies (329,164 participants) compared intervention versus usual care (median duration of follow‐up 12 months). Overall, DRS attendance increased by 12% (risk difference (RD) 0.12, 95% confidence interval (CI) 0.10 to 0.14; low‐certainty evidence) compared with usual care, with substantial heterogeneity in effect size. Both DRS‐targeted (RD 0.17, 95% CI 0.11 to 0.22) and general QI interventions (RD 0.12, 95% CI 0.09 to 0.15) were effective, particularly where baseline DRS attendance was low. All BCT combinations were associated with significant improvements, particularly in those with poor attendance. We found higher effect estimates in subgroup analyses for the BCTs ‘goal setting (outcome)’ (RD 0.26, 95% CI 0.16 to 0.36) and ‘feedback on outcomes of behaviour’ (RD 0.22, 95% CI 0.15 to 0.29) in interventions targeting patients, and ‘restructuring the social environment’ (RD 0.19, 95% CI 0.12 to 0.26) and ‘credible source’ (RD 0.16, 95% CI 0.08 to 0.24) in interventions targeting healthcare professionals.
Ten studies (23,715 participants) compared a more intensive (stepped) intervention versus a less intensive intervention. In these studies DRS attendance increased by 5% (RD 0.05, 95% CI 0.02 to 0.09; moderate‐certainty evidence).
Fourteen studies reporting any QI intervention compared to usual care included economic outcomes. However, only five of these were full economic evaluations. Overall, we found that there is insufficient evidence to draw robust conclusions about the relative cost effectiveness of the interventions compared to each other or against usual care.
With the exception of gender and ethnicity, the characteristics of participants were poorly described in terms of PROGRESS elements. Seventeen studies (25.8%) were conducted in disadvantaged populations. No studies were carried out in low‐ or middle‐income countries.
Authors' conclusions
The results of this review provide evidence that QI interventions targeting patients, healthcare professionals or the healthcare system are associated with meaningful improvements in DRS attendance compared to usual care. There was no statistically significant difference between interventions specifically aimed at DRS and those which were part of a general QI strategy for improving diabetes care. This is a significant finding, due to the additional benefits of general QI interventions in terms of improving glycaemic control, vascular risk management and screening for other microvascular complications. It is likely that further (but smaller) improvements in DRS attendance can also be achieved by increasing the intensity of a particular QI component or adding further components.
PICO
Laienverständliche Zusammenfassung
Interventionen um die Teilnahme an Früherkennungsuntersuchungen der diabetischen Retinopathie zu erhöhen
Was ist das Ziel dieses Reviews?
Das Ziel dieses Reviews war herauszufinden, ob Interventionen, die die Teilnahme an Früherkennungsuntersuchungen der diabetischen Retinopathie erhöhen sollen, wirksam sind.
Hauptaussagen
Dieser Review fand Evidenz dafür, dass Interventionen, die an Patienten, Gesundheitsfachpersonal oder das Gesundheitssystem gerichtet sind, im Vergleich zur Standardversorgung die Teilnahme an Früherkennungsuntersuchungen der diabetischen Retinopathie wahrscheinlich erhöhen. Wir konnten sowohl bei Interventionen, die speziell auf Früherkennungsuntersuchungen der diabetischen Retinopathie abzielten, als auch bei jenen, die Teil einer allgemeinen Strategie zur Verbesserung der Diabetesversorgung waren, einen Nutzen feststellen. Das ist deshalb wichtig, weil allgemeinere Strategien mit zusätzlichem Nutzen verbunden werden, wie einer verbesserten Blutzuckerkontrolle und vermehrter Erkennung anderer diabetesassoziierter Komplikationen.
Was wurde in diesem Review untersucht?
Als Folge der schädigenden Wirkung der Erkrankung auf die kleinen Blutgefäße im Augenhintergrund könnten Menschen mit Diabetes ihre Sehkraft verlieren. Untersuchungen, um erste Anzeichen der diabetischen Retinopathie zu erkennen und zu behandeln, können den Sehverlust verhindern. Allerdings ist die Teilnahme an diesen Früherkennungsuntersuchungen unterschiedlich und die Sehkraft gefährdenden Veränderungen werden möglicherweise nicht rechtzeitig erkannt.
Dieser Review hat eine Reihe von Interventionen betrachtet, die die Früherkennungsuntersuchung der diabetischen Retinopathie verbessern sollen.
Was sind die Hauptergebnisse des Reviews?
Die Cochrane Review Autoren haben 66 passende Studien gefunden. Hiervon waren 41 Studien aus den USA, 14 aus Europa, drei aus Kanada, drei aus Australien und die übrigen fünf aus anderen Ländern. Von diesen Studien haben 56 eine Intervention zur Erhöhung der Teilnahme an den Früherkennungsuntersuchungen der Retinopathie mit der Standardversorgung verglichen. Die übrigen 10 Studien haben eine intensivere mit einer weniger intensiven Intervention verglichen.
Wir haben festgestellt, dass Interventionen, die an Patienten und/oder Gesundheitsfachpersonal, oder an das Gesundheitssystem gerichtet waren, die Teilnahme an den Früherkennungsuntersuchungen erhöht haben. Interventionen, die auf die allgemeine Verbesserung der Diabetesversorgung abzielten, funktionierten genauso gut wie Interventionen, die speziell die Teilnahme an Früherkennungsuntersuchungen der diabetischen Retinopathie steigern sollten. Im Durchschnitt hat die Teilnahme im Vergleich zu keiner Intervention um 12 % zugenommen.
Wie aktuell ist dieser Review?
Die Autoren suchten nach Studien, die bis zum 13. Februar 2017 veröffentlicht wurden.
Authors' conclusions
Summary of findings
| Any quality improvement intervention compared to usual care for diabetic retinopathy screening | ||||||
| Patient or population: patients with type 1 or 2 diabetes eligible for diabetic retinopathy screening | ||||||
| Outcomes | Illustrative comparative risks | Risk Difference (95% CI) | No of Participants | Quality of the evidence | Comments | |
| Assumed risk | Corresponding risk (95% CI) | |||||
| Attendance with usual care | Attendance with any QI Intervention | |||||
| Proportion of participants attending screening (median follow‐up 12 months post‐intervention) | 472 per 1000 | 580 per 1000 (557 to 604) | RD 12% (95% CI 10% to 14%) | 329,164 | ⊕⊕⊝⊝ | There was substantial unexplained heterogeneity between studies (I2 = 93%, P < 0.001). The effect appears to be larger when baseline performance is low |
| Ongoing adherence to screening | ‐ | ‐ | ‐ | ‐ | ‐ | Not reported |
| Economic Outcomes Resources used (staff time, equipment, consumables) | Wide variation in resources used for each study, hence difficult to collate the resource used as a single output | ‐ | 85 ‐ 20,000 (13 RCTs) | ⊕⊕⊝⊝ | ‐ | |
| Staff/personnel costs; costs of treatment and care; cost of primary care; lost wages and lost productivity | Wide variation in resources used from different interventions also made it difficult to derive average costs compared with usual care | ‐ | 85 ‐ 20,000 (10 RCTs) | |||
| Incremental Cost effectiveness of interventions | GBP 13,154 for promotion of self‐management; GBP 73,683 for 5 years for face‐to‐face meeting, GBP 18.77 for phone call | ‐ | 85 ‐ 603 (3 RCTs) | |||
| CI: Confidence interval; RD: Risk difference | ||||||
| GRADE Working Group grades of evidence | ||||||
| 1We downgraded the certainty of the evidence by two levels from high to low for inconsistency, due to wide variation in the effect estimates across studies that could not be explained. 2We downgraded the certainty of the evidence for the economic outcomes by two levels from high to low due to inconsistency across different elements of the economic outcomes (see Table 7). | ||||||
| Resources and costs per participant | ||||||||||
| Economic outcomes No of studies with evidence for the economic outcomes | Design | Limitations/risk of bias | Inconsistency | Indirectness | Imprecision | Other factors | No of participants | Any Quality Improvement intervention | Usual care | Overall quality |
| Resources used (staff time, equipment, consumables) (13 studies) Adair 2013Clancy 2007Davis 2010Eccles 2007Frei 2014Frijling 2002Krein 2004Litaker 2003Piette 2001Pizzi 2015Prezio 201Wagner 2001Walker 2008 | RCTs | Yesa | Yes ( there was justification for variation based on setting) | No | No | Resources used varied due to settings and intervention strategy | 85 ‐ 20,000 | Wide variation in resources used for each study, hence difficult to collate the resource used as a single output | ⊕⊕⊖⊖ LOW | |
| Staff/personnel costs; costs of treatment and care; cost of primary care; lost wages and lost productivity Adair 2013Clancy 2007Davis 2010Eccles 2007Frijling 2002Litaker 2003Piette 2001Pizzi 2015Prezio 2014Walker 2008 | RCTs | Yesa | Yes ( there was justification for variation based on setting) | No | No | Costs varied due to settings, level of experience and educational Background of personnel | 85 ‐ 20,000 | Wide variation in resources used from different interventions also made it difficult to derive average costs compared with usual care | ⊕⊕⊖⊖ LOW | |
| Incremental cost effectiveness of interventions. (3 studies) | RCTs | Yesa | No | No | No | None | 85 ‐ 603 | GBP 13,154 for promotion of self‐management GBP 73,683 for 5 years for face‐to‐face meeting GBP 18.77 for phone call | ⊕⊕⊕⊖ LOW | |
| a. Unclear risk from adequate masking (blinding), Unclear sequence generation and allocation concealment | ||||||||||
| Stepped quality improvement intervention compared to intervention alone for diabetic retinopathy screening | ||||||
| Patient or population: patients with type 1 or 2 diabetes eligible for diabetic retinopathy screening | ||||||
| Outcomes | Illustrative comparative risks | Risk Difference (95% CI) | No of Participants | Quality of the evidence | Comments | |
| Assumed risk (95% CI) | Corresponding risk (95% CI) | |||||
| Attendance with usual care | Attendance with stepped QI intervention | |||||
| Proportion of participants attending screening (median follow‐up 12 months post‐intervention) | 361 per 1000 | 405 per 1000 (372 to 437) | RD 5% (95% CI 2% to 9%) | 23,715 | ⊕⊕⊕⊝ | There was unexplained heterogeneity between studies (I2 = 56%, P = 0.02) |
| Ongoing adherence to screening | ‐ | ‐ | ‐ | ‐ | ‐ | ‐ |
| Economic outcomes | ‐ | ‐ | ‐ | ‐ | ‐ | ‐ |
| CI: Confidence interval; RD: Risk difference | ||||||
| GRADE Working Group grades of evidence | ||||||
| 1We downgraded the certainty of the evidence by one level from high to moderate for inconsistency due to variation in the effect estimates across studies that could not be explained. | ||||||
Background
Description of the condition
Diabetic retinopathy is the most common microvascular complication of diabetes mellitus and a leading cause of blindness amongst the working‐age adult population in the Western world (Sivaprasad 2012). The duration of diabetes is the strongest predictor for the development and progression of retinopathy. Within 20 years of diagnosis, nearly all patients with type 1 diabetes and more than 60% of patients with type 2 have retinopathy (Fong 2004). A higher prevalence of diabetic retinopathy is found in people of South Asian, African and Latin American descent, compared to white populations (Sivaprasad 2012). Further risk factors for the development and progression of diabetic retinopathy include: poor glycaemic control, hypertension and hyperlipidaemia (Yau 2012). It has been estimated that globally approximately 93 million individuals may have some form of diabetic retinopathy, with 28 million suffering from the sight‐threatening end points of the disease (Yau 2012). There is limited evidence on the economic burden of diabetic retinopathy. One recent estimate for healthcare costs in Sweden was EUR 106,000 per 100,000 population a year, based upon a prevalence of diabetes of 4.8% (95% confidence interval 4.7 to 4.9) (Heintz 2010). These costs exclude cost impacts on those with diabetic retinopathy and their families.
Although effective treatments are available for sight‐threatening diabetic retinopathy in the form of laser photocoagulation (Evans 2014) and more recently the use of anti‐vascular endothelial growth factor inhibitors (Virgili 2014), the success of these interventions is dependent on early detection and timely referral for treatment. Diabetic retinopathy screening (DRS) fulfils the World Health Organization (WHO) criteria for a screening programme (Scanlon 2008): namely, diabetes‐associated visual impairment is an important public health problem; potentially sight‐threatening retinopathy has a recognisable latent stage; a universally accepted and effective treatment is available; and screening has been shown to be cost‐effective in terms of sight years preserved compared with no screening (Jones 2010). Annual or biennial DRS is recommended in many countries using a variety of screening modalities, including: ophthalmoscopy performed by a number of healthcare professionals (including ophthalmologists, optometrists, diabetic physicians) or using standard retinal photography or digital fundus imaging (American Diabetes Association 2015; Kristinsson 1995; Scanlon 2008). Recently, mathematical algorithms have been developed that provide individualised risk assessment for diabetic retinopathy and optimisation of screening intervals based on type and duration of diabetes, HbA1c, systolic blood pressure, gender and the presence and grade of retinopathy (Lund 2016).
Relatively few countries have introduced a national population‐based DRS programme, and in most parts of the world screening remains non‐systematic.
The reference standard for the detection of diabetic retinopathy consists of seven standard 35‐degree colour photographic fields as described by the Early Treatment Diabetic Retinopathy Study (EDTRS) research group (EDTRS 1991). However this technique is impractical for widespread retinopathy screening. Although ophthalmoscopy through dilated pupils has traditionally been the method of choice for opportunistic screening, the procedure varies in diagnostic accuracy depending on the particular technique used (direct or indirect ophthalmoscopy) or the experience of the healthcare professional performing the test (Hutchinson 2000). Recent developments in digital retinal photography have facilitated the rapid acquisition of high‐quality fundus images that can be stored and subsequently graded. Digital imaging combined with trained graders has been shown to be an effective screening tool to identify sight‐threatening retinopathy (Williams 2004), and is increasingly gaining acceptance for population screening (Kirkizlar 2013; Sharp 2003; Silva 2009; Taylor 2007).
Despite evidence supporting the effectiveness of DRS in reducing the risk of sight loss, screening coverage is consistently below recommended levels (Millett 2006; Paz 2006; Saadine 2008). The high rates of non‐attendance have major financial consequences. For example, the North and East Devon Diabetic Retinal Screening Service in the UK invited 22,651 people to participate in retinal screening between April 2009 and March 2010. Of those invited, 2137 (9.4%) failed to attend for their appointment after three reminders. With each appointment costing GBP 34 in 2009 and GBP 37 in 2010, the total cost of non‐attendance was GBP 78,259 (2009/2010 GBP) (Waqar 2012). Several factors have been shown to affect access and attendance for DRS, including ethnicity, younger age (less than 40 years), a longer duration of diabetes, and living in areas of high social deprivation (Byun 2013; Gulliford 2010; Hwang 2015; Kliner 2012).
Description of the intervention
Several interventions specifically aimed at improving DRS, including those targeting patients, health professionals or the healthcare system, have been shown to be effective in improving attendance across a range of retinopathy screening models (Zhang 2007). Examples of patient‐focused interventions include: (1) educational programmes to increase awareness of diabetic retinopathy and promote self‐management, and (2) the use of prompts/reminders. Provider‐focused interventions include: (1) clinician education, and (2) audit and performance feedback. System interventions include: (1) team changes; (2) establishing electronic registration and recall, and (3) the use of telemedicine.
In addition to strategies that specifically target DRS, general quality improvement (QI) implementation strategies for diabetes care may also be effective in improving screening coverage. A recent systematic review and meta‐analysis of trials assessing a number of predefined QI strategies to improve diabetes care reported that these were associated with a significant increase in DRS compared to usual care (risk ratio 1.22, 95% confidence interval 1.13 to 1.32) (Tricco 2012). However, this review did not include studies where interventions were solely targeted at patients, and the authors were unable to distinguish the effectiveness of individual QI components or identify potential effect modifiers. Furthermore, the review did not include an economic perspective.
How the intervention might work
Most studies assessing the effectiveness of interventions to improve diabetes care (including those delivered specifically to improve DRS) often involve multicomponent interventions that attempt to change the behaviour of healthcare professionals (e.g. advising patients to attend DRS) or patients (e.g. actually attending), or both. As there is no consistent association between the number of intervention components and their effectiveness (Grimshaw 2004), the ‘ideal’ number of components in such programmes is unknown. Furthermore, given the complexity of interventions tested to date, it is not always clear which specific components are the effective elements of these interventions (i.e. the 'active ingredients'). Hence, the content of complex behaviour change interventions has been referred to as a 'black box' (Grimshaw 2014). There is evidence that the more clearly the 'active' components of a complex intervention are described, the more readily the intervention may be delivered in an effective, consistent and cost‐effective manner (Michie 2009). Therefore, identification of the effective interventions for increasing attendance for DRS first requires clarity about intervention content and the functional relationship between components of interventions and the intended outcome. Cochrane Effective Practice and Organisation of Care (EPOC) have developed a taxonomy that can be used to classify intervention content in systematic reviews (EPOC 2015). Although the EPOC taxonomy provides a common language and a useful summary description of the intervention, the taxonomy may not be sufficiently detailed to specify the components of the intervention clearly (Presseau 2015). A complementary approach is to provide a comprehensive categorisation of the ingredients of the intervention in terms of the behaviour change techniques (BCTs) used. BCTs are defined as the ‘observable, replicable and irreducible components of an intervention that are designed to alter or redirect causal processes regulating behaviour' (Michie 2013). Recently, a reliable taxonomy of 93 BCTs has been published (co‐developed by team member JF) to provide a common, consistent terminology (BCT Taxonomy version 1 (BCTTv1)), by which the component BCTs in complex interventions may be identified and described. Examples of BCT labels in this taxonomy include: ‘goal setting,’ ‘self monitoring,’ ‘providing feedback on behaviour’ and ‘problem solving'. Review team members (JP, NI and JG) have successfully demonstrated the feasibility of using the BCT taxonomy within trials of QI interventions for diabetes care (Presseau 2015).
Why it is important to do this review
Given the value of screening for reducing the risk of sight loss amongst people with diabetes, it is essential that attendance for DRS is maximised as far as available resources allow. Wide geographical variation in screening coverage has been reported, with associated inequalities in outcomes. Given the incremental costs (resource use) and benefits (effects) associated with interventions to improve attendance for DRS, it is important to consider whether such strategies are worthwhile.
By identifying the active components of interventions that increase attendance for screening, this review will contribute to the identification of implementation strategies for early detection of sight‐threatening retinopathy. Furthermore, by exploring the differential effects of interventions in particular subgroups the results may provide clues to help to reduce inequalities in screening attendance and determine the impact of inequity on intervention effectiveness and efficiency. Although there have been a number of systematic reviews on interventions to optimise adult screening programmes (Everett 2011; Holden 2010), it is likely that this evidence is not directly transferable to DRS. Screening for diabetic retinopathy differs from other forms of screening in that the target group already has significant contact with the healthcare system due to their underlying diabetes, and screening has to be life‐long (i.e. annual or biennial surveillance is necessary).
Objectives
The primary objective of the review was to assess the effectiveness of QI interventions that seek to increase attendance for DRS in people with type 1 and type 2 diabetes.
Secondary objectives:
-
To use validated taxonomies of QI intervention strategies and behaviour change techniques (BCTs) to code the description of interventions in the included studies and determine whether interventions that include particular QI strategies or component BCTs are more effective in increasing screening attendance;
-
To explore heterogeneity in effect size within and between studies to identify potential explanatory factors for variability in effect size;
-
To explore differential effects in subgroups to provide information on how equity of screening attendance could be improved;
-
To critically appraise and summarise current evidence on the resource use, costs and cost effectiveness.
Methods
Criteria for considering studies for this review
Types of studies
We considered randomised controlled trials (RCTs), both individually randomised and cluster‐RCTs, conducted in a primary or secondary care setting, that were either specifically designed to improve attendance for DRS or were evaluating general strategies to improve diabetes care. Most commonly, the latter group of studies referred to 'quality improvement targets' or 'diabetes processes of care measures' as primary or secondary outcomes. We only included these studies if they reported on the effect of the intervention on DRS attendance.
To investigate cost effectiveness we included full economic evaluations (cost‐effectiveness analyses, cost‐utility analyses and cost‐benefit analyses), cost analyses and comparative resource‐utilisation studies conducted alongside or as part of an included RCT.
Types of participants
We included people with type 1 and type 2 diabetes mellitus who were eligible for DRS.
Types of interventions
We included RCTs that used any planned strategy or combination of strategies to improve attendance for diabetic DRS targeted at individuals with diabetes (e.g. reminders, promotion of self‐management), healthcare professionals (e.g. education, audit and feedback) or the healthcare system (e.g. electronic registries, team changes). Interventions included those specifically targeting DRS, as well as those that were part of a general strategy to improve processes of diabetes care. Comparator interventions were as specified in the included studies.
Types of outcome measures
Primary outcomes
The primary outcome was the difference in DRS attendance (one or more visits) within a two‐year period following implementation of the intervention. This could be based on self‐reports, medical insurance claims databases or health‐record audits (hospital, primary care physician or screening administration system record).
Secondary outcomes
We considered the following secondary outcomes:
-
Ongoing adherence to screening based on attendance for screening following the initial screening post‐intervention.
-
Economic outcomes:
-
-
Resources (staff time, equipment, consumables) required to deliver interventions to increase attendance for screening
-
Costs of staff used to provide interventions; costs of treatment and care; cost of primary care; lost wages and lost productivity (work output)
-
Cost effectiveness (incremental cost‐effectiveness ratios (ICERs); incremental cost per quality‐adjusted life year (QALY); incremental cost per disability‐adjusted life year (DALY); incremental cost‐benefit ratios; net benefits).
-
Search methods for identification of studies
Electronic searches
The Cochrane Eyes and Vision Information Specialist conducted systematic searches in the following databases for RCTs and controlled clinical trials. There were no language or publication year restrictions. The date of the search was 13 February 2017.
-
Cochrane Central Register of Controlled Trials (CENTRAL; 2017, Issue 2) (which contains the Cochrane Eyes and Vision Trials Register) in the Cochrane Library (searched 13 February 2017) (Appendix 1);
-
MEDLINE Ovid (1946 to 13 February 2017) (Appendix 2);
-
Embase Ovid (1980 to 13 February 2017) (Appendix 3);
-
PsycINFO (1967 to 13 February 2017) (Appendix 4);
-
Web of Science Conference Proceedings Citation Index‐Science (CPCI‐S) and Emerging Sources Citation Index (ESCI) (1990 to 13 February 2017) (Appendix 5);
-
ProQuest Family Health (1990 to 13 February 2017) (Appendix 6);
-
OpenGrey (1980 to 13 February 2017) (Appendix 7);
-
ISRCTN registry (www.isrctn.com/editAdvancedSearch; searched 13 February 2017) (Appendix 8);
-
US National Institutes of Health Ongoing Trials Register ClinicalTrials.gov (www.clinicaltrials.gov; searched 13 February 2017) (Appendix 9);
-
World Health Organization International Clinical Trials Registry Platform (www.who.int/ictrp; searched 13 February 2017) (Appendix 10).
Searching other resources
We searched the reference lists of included studies to identify additional relevant studies. In particular, we used the reference list of included and excluded studies of a 2012 systematic review by members of the current review team (NI and JG) (Tricco 2012), which investigated the effectiveness of QI strategies on the management of diabetes. Tricco 2012 identified studies which have multiple interventions to improve the quality of care in diabetes. Some of the studies in this review included attendance for DRS as one of the outcomes being assessed. However, since the information on screening for diabetic retinopathy was not reported in the abstract or coded in the MeSH or thesaurus headings, the electronic search strategy used in the current review did not identify a number of these studies. In addition to searching the reference list of Tricco 2012, we also obtained additional studies reporting retinopathy outcomes from the review team currently updating that review. The protocol for the updated review has been republished (Ivers 2014), as whilst the scope of the review remains the same, the update proposes an exploration of heterogeneity using an innovative meta‐analytical approach.
We also contacted experts in the field to request information on any ongoing or unpublished studies that would be relevant for this review.
Data collection and analysis
Selection of studies
Two review authors (JGL and JB) independently screened the titles and abstracts of studies identified by the electronic searches. We obtained full‐text copies of possibly relevant studies, resolving any differences of opinion regarding inclusion/exclusion by discussion. We documented reasons for exclusion at this stage.
Data extraction and management
Two review authors (JGL and EGR), working independently, extracted data from the included studies using a modified version of the Cochrane Effective and Organisation of Care (EPOC) data collection form (EPOC 2017), which incorporates information on study design, type and duration of interventions, participants, setting, methods, outcomes, and results. We translated studies in languages other than English and similarly extracted data in duplicate. Where numerical data were presented only in figures and not available from authors, two review authors performed data extraction by using Plot Digitizer open‐source software.
For the extraction of data on the sociodemographic characteristics of participants that are known to be important from an equity perspective, we used the Place, Race, Occupation, Gender, Religion, Education, Socioeconomic status, Social status (PROGRESS) framework (O'Neill 2014), and also recorded whether any interventions were aimed at disadvantaged or low‐ and middle‐income country populations, using the World Bank Atlas method.
An economics review author (PA) identified and further assessed studies judged potentially to include economic data. Data from included economic evaluations were extracted by one review author (PA) and checked by a second. We adapted data collection from the format and guidelines used to produce the structured abstracts of full economic evaluations for inclusion in the NHS Economic Evaluation Database, and redesigned them to accommodate the specific data required for our review (CDC 2012). We classified economic evaluations based on their analytical framework and coded them appropriately.
Coding of intervention content
We coded extracted intervention descriptions from all of the included studies using a validated taxonomy to characterise the constituent components of each intervention. Cochrane EPOC has developed a comprehensive taxonomy to classify intervention content in systematic reviews (EPOC 2015). We used a subset of the EPOC taxonomy that has been previously used by members of the review team in a review of the effectiveness of general QI implementation strategies for diabetes care (Tricco 2012). This adapted taxonomy incorporates 12 components targeting healthcare systems (case‐management, team changes, electronic patient registry, facilitated relay of information to clinicians, continuous quality improvement), clinicians (audit and feedback, clinician education, clinician reminders, financial incentives) or patients (patient education, promotion of self‐management and reminder systems). Two review authors (JGL and EGR) independently coded QI components as 'present' or 'absent' for both intervention and control arms, resolving discrepancies in coding by discussion.
To better characterise the detail of the intervention content, we also coded extracted intervention descriptions into component BCTs using the BCT taxonomy (Michie 2013), as a coding framework. Describing an intervention in terms of BCTs (i.e. 'active ingredients') provides a useful level of detail for synthesis and comparison (Presseau 2015). We coded BCTs for each intended recipient as 'present' or 'absent' separately for patient and healthcare professional recipients. We coded each intervention separately, including control arms. We coded system‐level interventions as targeting either healthcare provider or patient behaviour, or both, unless an alternative intervention recipient and their behaviour was reported (e.g. administrative staff sending reminder letters) (see Table 1).There is substantial evidence that the content of complex behaviour change interventions is often poorly described in published reports, rendering it more difficult to clearly specify the content of interventions on this basis alone and increasing the risk of misclassification (Lorencatto 2013). We therefore contacted all authors of included studies to ask for further information on the content of the intervention (e.g. a trial protocol, letters sent to patients, written or audio‐visual materials) to clarify the BCT coding. We coded these materials using the BCT taxonomy in the same manner as for the corresponding published reports.Two review authors (EGR and FL) independently conducted BCT coding, resolving discrepancies by discussion and if necessary by the involvement of a third review author (JF).
| Behaviour change technique (BCT) and abbreviated definitions | Illustrative quotation |
| Goals and planning | |
| Goal setting (behaviour) Set or agree a goal defined in terms of the behaviour to be achieved e.g. Set targets for how often patients should attend DRS, or general diabetes self‐management, such as frequency of blood glucose testing, amount of carbohydrates to consume at each meal | "Practice nurses planned independent consultations with patients. The monitoring tool guided them through the consultations, and provided the opportunity to help the patient in selecting appropriate, concrete, behavioural goals …. The monitoring tool addressed clinical parameters (e.g., HbA1C, BP and LDL cholesterol levels), examinations (e.g. food control, neurological tests, and eye examinations), adherence to prescribed drugs, self‐care goals, and other recommendations" (Frei 2014 p 1040‐1) |
| Problem solving Analyse, or prompt the person to analyse, factors influencing the behaviour and generate or select strategies that include overcoming barriers and/or increasing facilitators e.g. Support patients to identify reasons for wanting or not wanting to attend DRS, and helping them select potential strategies for overcoming these barriers to screening attendance | "Using a semi structured protocol, the health educator (C.J. H.) offered one‐on‐one, interactive education and counselling. Having established rapport, she worked to identify and understand each subject’s reasons for and /or barriers to having a dilated retinal examination. Focused problem‐solving then guided the subject toward making an informed choice about receiving an ophthalmic examination." (Basch 1999, p 1879) |
| Goal setting (outcome) Set or agree a goal defined in terms of a positive outcome of wanted behaviour e.g. Agree with the patient target HbA1c, blood pressure, or cholesterol level, or target range for blood glucose | "During the case management sessions, patients and providers set management goals that were reasonable to achieve." (Barcelo 2010, p 147) |
| Action planning Prompt detailed planning of performance of the behaviour e.g. Support the patient to develop a plan for how often they will attend DRS, where the DRS will occur, and how they will get to their appointment | "Behavioural activation for diabetic retinopathy prevention combined the principles of education about diabetes mellitus, behavioural therapy, and the health belief model to assist participants in identifying barriers to obtaining dilated fundus examinations, problems‐solving solutions to surmounting barriers, formulating action plans to facilitate dilated retinal examinations, and gauging the success of action plans." (Weiss 2015, p 1007) |
| Review behaviour goals Review behaviour goal(s) jointly with the person and consider modifying goal(s) or behaviour change strategy in light of achievement e.g. During scheduled diabetic review consultations, discuss with patients how they are progressing with their agreed self‐management behavioural goals (e.g. frequency of blood glucose testing, attendance for DRS). Where patients are not meeting agreed goals, either discuss how to adjust goals if needed to increase feasibility, or engage in problem‐solving to overcome any barriers to goal attainment | "Care managers were trained to use a patient‐centred self‐management approach that included review of the medical care needs and self‐care goals that the patient identified and brainstorming additional strategies that patients could use to overcome barriers to their goals." (Glasgow 2005, p 35) |
| Discrepancy between current and goal Draw attention to discrepancies between a person’s current behaviour and the person’s previously set outcome goals, behaviour goals or action plans e.g. Provide feedback to healthcare professionals on the proportion of patients who have received DRS in the previous 12 months, and compare this against a gold standard for clinical practice based on clinical guidelines | "Physicians in the IG [intervention group] received a monthly report of their care quality with the top 10% quality of diabetes care score for all physicians being the achievable benchmark."(Hayashino 2016, p 1) |
| Review outcome goal(s) Review outcome goal(s) jointly with the person and consider modifying goal(s) in light of achievement e.g. Review or alter target blood glucose levels towards a more feasible/achievable intermediate target | "The telephone call was structured to first review the patient’s goals, followed by medication use, symptoms, glucose monitoring, blood pressure monitoring and self‐management /care activities" (Taylor 2003, p 1059) |
| Behavioural contract Create a written specification of the behaviour to be performed, agreed by the person, and witnesses by another e.g. Ask the person with diabetes to sign a contract in their self‐management plan or diary, undertaking to attend DRS once | Care guides asked patients to sign a contract (which was scanned into the HHR) agreeing to work toward their disease‐specific goals. (Adair 2013, p 176) |
| Commitment Ask the person to affirm or reaffirm statement indicating commitment to change the behaviour e.g. Ask the person with diabetes to verbally affirm or reaffirm that they are committed to attending DRS at the agreed frequency and location | "The initial goal was toelicit a verbal commitment to schedule an eye examination." (Basch 1999, p 1879) |
| Feedback and monitoring | |
| Monitoring of behaviour by others without feedback Observe or record behaviour with the person’s knowledge as part of a behaviour change strategy e.g. Record the proportion of patients who attend for a DRS exam as part of clinical audit, but the results are not fed back to the healthcare professionals whose practice has been audited | "Foot examinations, blood pressure, and eye examinations were recorded on the reminder by clinic staff, collected after the patient visit and entered manually." (Peterson 2008, p 2239) |
| Feedback on behaviour Monitor and provide information or evaluative feedback on performance of the behaviour (e.g. form, frequency, duration, intensity) e.g. Provide a feedback report to healthcare professionals, stating the proportion of their patients who have attended a DRS exam, had their blood pressure taken, and had a foot examination | "In addition, diabetic members who did not have a record of a diabetic retinopathy exam received educational materials and a report of their current DRE status directly from the HMO 2 weeks later." (Halbert 1999, p 753) |
| Self‐monitoring of behaviour Establish a method for the person to monitor and record their behaviour(s) as part of a behaviour change strategy e.g. A person with diabetes maintains a self‐management diary in which they record their daily food intake and exercise, and tick off a checklist when they have attended their annual DRS exam | "We prepared feedback sheets for adherence to these eight indicators using data from thephysicians’ self‐report forms, as the physicians monitored and promoted these indicators to improve adherence." (Hayashino 2015, p 601) |
| Self‐monitoring of outcomes of behaviour Establish a method for the person to monitor and record the outcome(s) of their behaviour as part of a behaviour change strategy e.g. A person with diabetes records in their self‐management diary the results of their latest HbA1C result and DRS exam | "In general, case managers were directed to encourage patient self‐management, including diet and exercise, provide reminders for recommended screening/tests,help with appointment scheduling;monitoring home glucose and blood pressure levels…" (Krein 2004, p 734) |
| Monitoring of outcomes of behaviour by others without feedback Observe or record outcomes of behaviour with the person’s knowledge as part of a behaviour change strategy e.g. A person attends a DRS exam, but is not provided with the results of the examination | "The nurse case manager used behavioural goals setting, established individualized care plan, provide patient self‐management education and surveillance of patients…ordered protocol‐driven laboratory tests, tracked the outcomes using the computerized data registry…" (Gabbay 2006, p 30) |
| Feedback on outcomes of behaviour Monitor and provide feedback on the outcome of performance of the behaviour e.g. Informing the person with diabetes of the results of DRS exam [i.e. presence/absence of retinopathy] | "…all persons who attended the screening clinics received a dilated eye exam by a volunteer community‐based ophthalmologist. The eye exam included visual acuity, intraocular pressure, and a fundus examination through a dilated pupil…immediately after receiving the dilated eye exam, the patient was told the results by the examination ophthalmologist." (Anderson 2003, p 41) |
| Biofeedback Provide feedback about the body (e.g. physiological or biochemical state) using an external monitoring device as part of a behaviour change strategy | " … immediately after receiving the dilated eye exam, the patient was told the results by the examination ophthalmologist." (Anderson 2003, p 41) |
| Social Support | |
| Social Support (unspecified) Advise on, arrange or provide social support (e.g. from friends, relatives, colleagues, ‘buddies’ or staff) or non‐contingent praise or reward for performance of the behaviour. In includes encouragement and counselling e.g. Provide general encouragement or reassurance to a person with diabetes to attend their DRS appointment | "Overall, the intervention included …and self‐management support (provided by the practice nurse)." (Frei 2014, p 1041) |
| Social Support (practical) Advise on, arrange, or provide practical help (e.g. from friends, relatives, colleagues, ‘buddies’ or staff) for performance of the behaviour e.g. Provide practical help for a patient with diabetes to attend DRS. This can include, for example: arranging a referral to DRS, arranging or providing transport to the clinic | "Referrals were facilitated to other clinicians when indicated, including ophthalmology, podiatry, nutrition and primary care for follow‐up of acute or other chronic issues or when requested by patients." (Jacobs 2012, p 616) |
| Shaping knowledge | |
| Instruction on how to perform behaviour Advise or agree on how to perform the behaviour (includes ‘skills training’) e.g. Provide advice to a person with diabetes on how often guidelines recommend attending DRS, where they can obtain a DRS, and how to schedule an eye exam | "A direct mail reminder was sent to patients to reinforce the importance of annual eye exams and included the following text: If you don’t have an eye doctor, ask you regular doctor to refer you to one." (Prela 2000, p 258) |
| Natural consequences | |
| Information about health consequences Provide information (e.g. written, verbal, visual) about health consequences of performing the behaviour e.g. Provide advice to the person with diabetes, on the negative health consequences of retinopathy, and the benefits of early detection | "A tailored telephone intervention was delivered by bilingual interventionists and included: Risk communications, such as the frequency lack of symptoms of retinopathy and that early treatment for retinopathy decreases the risk of blindness, were included." (Walker 2008, p 187) |
| Salience of consequences Use methods specifically designed to emphasise the consequences of performing the behaviour with the aim of making them more memorable e.g. Give a person with diabetes a leaflet containing testimonials from other persons with diabetes who suffer from retinopathy to emphasise the benefits of attending DRS and early detection | "The videotape used emotional appeals through storytelling to increase motivation to have a yearly dilated retinal examination." (Basch 1999, p 1879) |
| Information about social & environmental consequences Provide information (e.g. written, verbal, visual) about social and environmental consequences of performing the behaviour e.g. Provide information on the costs of having a DRS exam | "A take‐home reminder (aimed at patients, to remind them to make an appointment for an eye exam), to be given to patients by their Family Practitioner, included the following text: OKIP covers annual eye checks for patients with diabetes so you will not have to pay" (Zwarenstein 2014, p 90) |
| Information about emotional consequences Provide information (e.g. written, verbal, visual) about emotional consequences of performing the behaviour e.g. Provide a leaflet recognising the potential negative effects on emotional and mental health of managing a chronic illness, such as diabetes | "Group visit content, though patient‐guided, was physician‐directed to cover educational topics…and the emotional aspects of diabetes." (Clancy 2007, p 621) |
| Comparison of behaviour | |
| Demonstration of the behaviour Provide an observable sample of the performance of the behaviour, directly in person or indirectly (e.g. by film, picture, for the person to aspire to or imitate) e.g. Play a video demonstrating the DRS procedure | "The newsletter consisted of six sections, including a testimonial designed to model eye examination behaviour" (Ellish 2011, p 1593) |
| Social comparison Draw attention to others’ performance to allow comparison with the person’s own performance e.g. Provide healthcare professionals with feedback on the proportion of their patients who have had a DRS exam, and benchmark this in comparison to other hospitals or healthcare professionals | "The system presented register data on their’ Type 2 diabetes population, giving them the option either to use the data during individual diabetes consultations or to gain an overview of the quality of their diabetes care and compare it with the corresponding quality in their colleagues’ practices." (Guldberg 2011, p 326) |
| Information about others’ approval Provide information about what other people think about their behaviour. The information clarifies whether others will like, approve or disapprove of what the person is doing or will do e.g. Tell the person with diabetes that their family members would likely be keen for them to attend their DRS appointment | "One of the message in the targeted newsletter read: Even though you’ve been thinking about getting a dilated eye exam, we hope you’ll make the call now"(Ellish 2011, Additional information provided by the author) |
| Associations | |
| Prompts/Cues Introduce or define environmental or social stimulus with the purpose of prompting or cueing the behaviour e.g. Phone the person with diabetes to remind them of their upcoming DRS appointment | "For those who made an appointment, a reminder letter was mailed 3 weeks prior to the scheduled appointment. Additionally, there was an automated reminder call the day before the scheduled appointment" (Pizzi 2015, p 255) |
| Reduce prompts/cues Withdraw gradually prompts to perform the behaviour e.g. Decrease the frequency with which a person with diabetes is sent a reminder of their DRS attendance (i.e. from weekly, to fornightly, to monthly, to quarterly reminders) | "Recommendations for regular telephone follow‐ups for diabetes patients, which will be monthly in the 1st half year and then will probably decrease" (Jansink 2013 (coded from protocol 2009) |
| Repetition and substitution | |
| Behavioural practice/rehearsal Prompt practice or rehearsal of the performance of the behaviour one or more times in a context or at a time when the performance may not be necessary, in order to increase habit and skill e.g. Provide an opportunity for trainee healthcare professionals to practise delivering a DRS exam to an actor role‐playing a patient with diabetes | "During a 2‐day training session, case managers received instruction on collaborative goal setting, with case examples and role‐playing used to familiarize them with the treatment algorithms"( Krein 2004, p 734) |
| Graded tasks Set easy‐to‐perform tasks, making them increasingly difficult, but achievable, until the behaviour is performed e.g. Initially allocate a healthcare professional responsibility for one component of DRS exam and progressively increase their responsibility | "Theoretically, this form of facilitation should be necessary for only a relatively short period of time, with the practice improvement team progressively assuming responsibility for the ongoing improvement efforts after the initial facilitation." (Dickinson 2014, p 10) |
| Comparison of outcomes | |
| Credible source Present verbal or visual communication from a credible source in favour of or against the behaviour e.g. Include the logos for national health institutes, or cite published clinical guidelines, to endorse information provided in leaflets regarding DRS | "Participants in the print‐intervention group received a mailing of a colourful, 14‐page booklet on preventing diabetes eye problems called Keep Your Eyes Healthy, in English or Spanish,developed b y the National Institutes of Health." (Walker 2008, p 187) |
| Reward and threat | |
| Material incentive (behaviour) Inform that money, vouchers or other valued objects will be delivered if and only if there has been effort and/or progress in performing the behaviour e.g. Advise the person with diabetes that they will receive a shopping voucher if they attend their upcoming DRS appointment | "The automated system offered a live telephone call back to assist in scheduling test and alsooffered to send participants the following items: 1) a voucher that would allow the provider to waive the co‐payment for a dilated eye examination…" (Simon 2010, p 1452) |
| Social reward Arrange verbal or non‐verbal reward if and only if there has been effort and/or progress in performing the behaviour e.g. Verbally praise the person with diabetes if they attend their DRS appointment | "When a subject reported having a dilated retinal examination a congratulatory letter was sent." (Basch 1999, p 1879) |
| Non‐specific reward Inform that a reward will be delivered if and only if there has been effort and/or progress in performing the behaviour e.g. Inform the healthcare professional that they will be rewarded for conducting a DRS exam with a target proportion of their patients | "CME credits were given to the participating physicians in the workshops" (Vidal‐Pardo 2013, p 752) |
| Antecedents | |
| Restructuring the physical environment Change or advise to change the physical environment in order to facilitate performance of the wanted behaviour or create barriers to the unwanted behaviour e.g. Introduce mobile DRS vans in geographically remote areas to increase access to screening facilities | "Care guide workstations were located in the clinic waiting rooms, to facilitate face‐to‐face interactions with patients, providers, and nurses." (Adair 2013, p 177) |
| Restructuring the social environment Change or advise to change the social environment in order to facilitate performance of the wanted behaviour or create barriers to the unwanted behaviour e.g. Change a healthcare team and team working, such as introducing a new specialist diabetes nurse role responsible for monitoring screening rates and phoning people with diabetes to remind them to attend their DRS appointment | "Three multi‐lingual Link Workers already employed by Coventry Primary Care Trust (PCT) were trained in diabetes management and care and assigned to work with specific intervention GP surgeries" (Bush 2014, p 295) |
| Adding objects to the environment Add objects to the environment in order to facilitate performance of the behaviour e.g. Introduce new computerised software to a general practice to help monitor and remind healthcare professionals as to which patients need to be prompted to attend DRS | "In addition 4500 diabetes passports were made available at the four hospitals…" (Dijkstra 2005, p 128) |
| Scheduled consequences | |
| Behaviour cost Arrange for withdrawal of something valued if and only if an unwanted behaviour is performed e.g. Charging people with diabetes a fee for failing to attend a DRS exam | "We were interested to find out whether a small copayment would be an important deterrent to the uptake of screening for diabetic retinopathy (DR)…We conducted a randomized trial in which one group was charged a small fee for DR screening and the other was provided with free access." (Lian 2013, p 1247) |
| Self‐belief | |
| Verbal persuasion about capability Tell the person that they can successfully perform the wanted behaviour, arguing against self‐doubts and asserting that they can and will succeed e.g. Encourage or reassure the patient to attend a DRS exam, providing information as needed to address any concerns or self‐doubts they may have about attending for a DRS exam | "Diabetes is a serious, lifelong condition, but there is so much that you can do to protect your health. Take charge of your health, not only for today, but also for the years to come" (Lafata 2002, p 523) |
| Focus on past success Advise to think about or list previous successes in performing the behaviour (or parts of it) e.g. Help the person with diabetes to remember the last time they attended a DRS exam, and use this as an opportunity to reassure them of the benefits of attending | A comprehensive programme that integrated lifestyle: counselling based on motivational interviewing principles was integrated into structured diabetes care. [In description of motivational interviewing] "Self‐efficacy can be strengthened by affirming past success (i.e. reinforcement)…" (Jansink 2013 , additional information from protocol) |
DRS: diabetic retinopathy screening
Coding of resource requirement needed to deliver interventions
We developed an ordered ranking scale to quantify the level of resource needed to deliver each intervention, based on the description of the intervention components in each included study. To determine the feasibility of this approach, we initially piloted the scale on a sample of 10 included studies, using two members of the review team. We graded each intervention initially between one (least resource‐intensive) and five (most resource‐intensive), or zero (unable to determine), together with a record as to how the review author graded each study.
We incorporated the following resource components into the algorithm:
• Face‐to‐face minutes
• Phone calls
• Patient home visits
• Printed materials/software
• Training
The resource categories and levels with their corresponding weights were as follows:
| Face‐to‐face or care planning minutes/patient/6 months | Phone calls to patients | Additional outreach visits to patients (travel time) | Use of materials/ letters/software | Training of health professionals other than reading material |
| None (0) | No (0) | No (0) | None (0) | None (0) |
| Low 1 ‐ 40 mins (1) | Yes (1) | Yes (2) | Printed materials (1) | Low (1) |
| Moderate 40 ‐ 100 (2) | ‐ | ‐ | Software (2) | High (2) |
| High > 100 (3) | ‐ | ‐ | ‐ | ‐ |
We defined a priori a criterion of success of the ranking scale as review author scores from nine out of 10 studies being within one grade of each other, following discussion. This criterion was achieved and we used the notes about how we graded each study to generate a reproducible description of the resource input associated with each grade on the ranking scale. We then used the resource components and their intensity levels to extract resource use required to deliver the interventions in all included studies. Two review authors (JGL and EGR) did this independently.
Assessment of risk of bias in included studies
Two review authors (JGL and EGR) independently assessed study quality using the Cochrane EPOC 'Risk of bias' tool (EPOC 2012). We based the choice of the EPOC 'Risk of bias' tool on the expectation that the included studies would be similar to those included in EPOC reviews, e.g. a large number of cluster trials, complex interventions and routine data used to assess outcomes.
The EPOC criteria for assessing risk of bias uses nine standard criteria:
-
Was the allocation sequence adequately generated?
-
Was the allocation adequately concealed?
-
Were baseline outcome measurements similar?
-
Were baseline characteristics similar?
-
Were incomplete outcome data adequately addressed?
-
Was knowledge of the allocated interventions adequately prevented during the study?
-
Was the study adequately protected against contamination?
-
Was the study free from selective outcome reporting?
-
Was the study free from other risks of bias?
For cluster‐RCTs, we considered particular biases, including: (i) recruitment bias; (ii) baseline imbalance; (iii) loss of clusters, and (iv) incorrect analysis; as described in Chapter 16 of the Cochrane Handbook for Systematic Reviews of Interventions (Higgins 2011). For each domain, two review authors performed the 'Risk of bias' assessment independently and assigned a judgement of ’low risk’ ’high risk’ or ’unclear risk’ of bias. The review authors resolved any discrepancies between them by discussion.
The reliability of data outputs from any full economic evaluation are in part predicated on the reliability of the data for the estimates of the relative treatment effects (for benefits or harms) of the alternative courses of action (i.e. intervention(s) and comparator(s)) under investigation). As the identified economic studies were a subset of the studies included in the review, the risk of bias was already assessed. However, assessment of the overall methodological quality of the economic component was still required and was carried out by one review author (PA) using the Consolidated Health Economic Evaluation Reporting Standard (CHEERS) statement, together with the Consensus on Health Economic Criteria (CHEC) (Evers 2005; Husereau 2013). In assessing the methodological quality of economic evaluations, the main objective is to assess the applicability of the scope of the analysis in terms of costs and outcomes. This helps to highlight the applicability and relevance of each economic evaluation.
Measures of treatment effect
Attendance at screening post‐intervention is a dichotomous outcome and we have reported the intervention effect as the risk difference (RD), i.e. the actual difference in the observed events between experimental and control interventions. Our choice of RD was based on the fact that relative effect sizes (e.g. risk ratios) are highly dependent on the baseline/control compliance, i.e. a similar risk ratio if screening attendance increase from 10% to 20% or from 50% to 100%. During the development of the protocol for the review, we received advice from the Cochrane EPOC group who have found that RDs are much more interpretable, and it is also possible to explore whether baseline compliance is an effect modifier.
Unit of analysis issues
For individual randomised trials the unit of analysis was the individual participant. For cluster‐RCTs, we analysed data after adjustment for clustering. In case of cluster‐RCTs, where outcomes were presented at patient level, we used an established method to adjust for clustering (Higgins 2011).This involved dividing the original sample size by the design effect, which was calculated from the average cluster size and the intra‐cluster correlation coefficient (ICC). Where the ICC was not reported, we imputed the most commonly‐reported value from studies where it was reported.
Dealing with missing data
We contacted authors of included studies if important data were not available. Where we were not able to obtain these data, we reported the available results and did not impute missing data.
Assessment of heterogeneity
We assessed heterogeneity between studies by visual inspection of forest plots and by formal statistical tests of heterogeneity (Chi2 test and the I2 statistic), and explored the possible reasons for heterogeneity using subgroup and random‐effects meta‐regression analyses.
Assessment of reporting biases
We explored publication bias using a funnel plot for the main comparison of any intervention versus usual care.
Data synthesis
We conducted meta‐analyses in Review Manager 5 (Review Manager 2014), using a random‐effects model to estimate the pooled RD across studies. We included data from RCTs randomised by individual and from cluster‐adjusted RCTs in the same meta‐analysis. In the case of multiple intervention groups, we combined groups to create a single pair‐wise comparison as recommended in the Cochrane Handbook for Systematic Reviews of Interventions (Higgins 2011).
A summary of the results of included economic evaluations is available as an additional table (Table 2) and is supplemented by a narrative description in the Results and Discussion sections. Costs for each study were adjusted to 2016 British pound value (GBP) using a web‐based conversion tool based on implicit price deflators for gross domestic product (GDP, a measure of the wealth of a country) and GDP Purchasing Power Parities. Table 2 presents the original currency and price year used in each included study. Users of this review who might want to adjust costs to another currency and price year suitable for their needs should use costs for each study presented in Table 2 and not the adjusted costs presented in the main text of the review.
| QI Component | Study | DRS or GQI | Estimated costs of resources used | Resources used |
| Promotion of self‐management | N = 85 participants | GQI | Staff cost per person = GBP 625.25; costs of the other resources used = GBP 476.35 over 12 months Direct cost per person = GBP 1101 | 13 x 15‐minute sessions (3 individuals and 10 group session) with nurses and 4 hours with health educator per person |
| N = 14 clinics, 278 participants | GQI | Not reported | 1‐hour group session with relevant health professional every 3 ‐ 6 months | |
| Team changes | N = 15 practices, 164 participants | GQI | Not reported | 6‐day training for nurses, 2 x 4‐hour workshops for physicians and nurses |
| N = 14 clinics, 278 participants | GQI | Not reported | 1‐hour group session with relevant health professional every 3 ‐ 6 months | |
| N = 79 participants | GQI | Mean personnel costs for the intervention per month per patient = GBP 130.15 Total additional personnel costs = GBP 10281.97 | An average of 180 minutes with participants | |
| Case management | N = 123 participants | GQI | Not reported | 2 days training for case managers, 20 hours/week time spent with participants. Quarterly profiling and subsequently every 6 months |
| Patient education | N = 90 participants | GQI | Physician cost = GBP 48.76/hour Community health worker = GBP 12.91/hour Cost of intervention over 20 years = GBP 3646.10 per patient | 7 sessions per participants, 1 hour physician supervision for health workers |
| N = 117 participants for mailed intervention, 120 for telephone intervention | DRS | Staff time for 120 participants = GBP 501.13 for telephone over 1 month Staff time for 117 participants = GBP 173.17 for mailed intervention over 1 month GBP 85.24/hour for the physician, GBP 29.32/hr for health services manager, GBP 16.72/hour for medical assistant Cost of materials for telephone = GBP 30.25, cost of materials for mailed intervention Total cost of intervention = GBP 577.64 for 120 participants in telephone group, GBP 335.48 for 117 participants in mailed group over a month Total cost when appointment is made and kept per participant; Telephone intervention = GBP 9.47 Mailed intervention = GBP 8.83 | 1‐hour supervision for every 20‐hour intervention delivered 2 x 1‐hour meetings with medical assistants, health services manage and ophthalmologist | |
| N = 930 participants | GQI | Care guide cost for 120 participants = GBP 375,917 at the rate of GBP 11.77/hour over a year 2 supervisory nurses = GBP 85,847.24 Training cost = GBP 2228.99 modular furniture and equipment for 12 stations = GBP 79,422.81 Total cost = GBP 463,993 Total cost of intervention per participant = GBP 326 | 12 care guides, 2 weeks training, 2 supervisory nurses, 5 visits on average to clinics, 4 contacts with participants, furniture and modular equipment | |
| N = approximately 20,000 participants | GQI | Not reported | Not reported | |
| N = 96 participants | GQI | Deposit fee for group visit = GBP 13.4/visit, for 12 visits = GBP 160.60 | Monthly meeting for a year for 2 hours which includes 1 primary care internal medicine physician, 1 registered nurse per visit Training for physicians and nurses 3‐ hour training for clinic staff 12 group visits for 1 year | |
| Schechter 2008 (Walker 2008) N = 305 participants for telephone intervention, 298 for print intervention | DRS | Costs of health educator = GBP 14,890.83 Training and supervision = GBP 2756.44 Telephone charges = GBP 679.67 for 305 participants Costs of printing and mailing = GBP 465.99 for 298 participants | Average of 3.2 calls for about 20 minutes +5 minutes call preparation per participant over 6 months 20 hours training, 1 hour supervision by diabetes nurse educator, telephone calls | |
| Electronic patient register | N = 30 practices, 1674 participants | GQI | Cost of developing the guidelines = GBP 10,208 Cost of software development = GBP 12519.36 Cost of educational activities = GBP 2148.11 Additional cost of running the system = GBP 9964.46 Annual cost per participant = GBP 68.21 | Cost of guidelines and software development. Average of 2 follow‐up contacts |
| Patient reminders | Schechter 2008 (Walker 2008) N = 305 participants for telephone intervention, 298 for print intervention | DRS | Costs of health educator = GBP 14,890.83 Training and supervision = GBP 2756.44 Telephone charges = GBP 679.67 for 305 participants Costs of printing and mailing = GBP 465.99 for 298 participants | Average of 3.2 calls for about 20 minutes + 5 minutes call preparation per participant over 6 months 20 hours training, 1 hour supervision by diabetes nurse educator, telephone calls |
| N = 117 participants for mailed intervention, 120 for telephone intervention | DRS | Staff time for 120 participants = GBP 501.13 for telephone over 1 month Staff time for 117 participants = GBP 173.17 for mailed intervention over 1 month GBP 85.24/hour for the physician, GBP 29.32/hour for health services manager, GBP 16.72/hour for medical assistant Cost of materials for telephone = GBP 30.25, cost of materials for mailed intervention Total cost of intervention = GBP 577.64 for 120 participants in telephone group, GBP 335.48 for 117 participants in mailed group over a month | 1 hour supervision for every 20‐hour intervention delivered 2 x 1‐hour meetings with medical assistants, health services manager and ophthalmologist | |
| Audit and feedback | N = 62 clusters, 703 participants | GQI | Cost of clinical decision‐making per practice = GBP 341.51 | 80 hours training for facilitator, 15 x 1‐hour visits to practice clinic, 3 hours GP time for implementation of feedback |
| Clinician reminders | N = 79 participants | GQI | Mean personnel costs for the intervention per month = GBP 130.15 Total additional personnel costs = GBP 10,281.97 | An average of 180 minutes with participants over 12 months |
| Continuous quality improvements | N = 146 participants | GQI | Approximately GBP 14 ‐ GBP 24 per year for automated calls. | 13 nurses spending an average of 3.8 hours per participant, 15 automated calls |
DRS: diabetic retinopathy screening
GQI: general quality improvement
Subgroup analysis and investigation of heterogeneity
We planned to perform the following prespecified subgroup analyses to investigate whether the presence or absence of a particular covariant explained the variability in effect size:
-
QI intervention components/BCTs
-
Resource requirements to deliver the intervention
-
Population subgroups: type 1, type 2 diabetes mellitus, participant characteristics across PROGRESS categories
In our analyses, we assessed QI components (coded using the modified EPOC taxonomy) and BCTs of each intervention separately. Where a study used multiple QI components or BCTs or both, we applied the same effect size to each component for the analysis. We compared effect estimates for subsets of studies that used a particular QI component/BCT or resource intensity and calculated a pooled effect size. We included BCTs/QI components in the analysis when 10 more studies were available for each BCT/QI component.
We further investigated associations between DRS attendance and effect size by meta‐regression for a number of covariates, including: type of study design (individual/cluster‐RCT), baseline DRS attendance and QI component/BCT used in the intervention. For meta‐regression we used a prespecified random‐effects model and compared the risk difference of studies containing a particular explanatory variable to studies in which the variable was absent. For metaregression we followed the guidance in the Cochrane Handbook for Systematic Reviews of Interventions (Higgins 2011), and only included covariates for which 10 or more studies were available.
We conducted subgroup analyses and meta‐regression using Stata 14, deploying the metan and metareg commands.
Sensitivity analysis
We performed a sensitivity analysis to determine the impact on the pooled effect estimate of imputing the lower and upper range values for the ICC.
'Summary of findings' Tables
We prepared 'Summary of findings' tables for the main comparisons (1. effect of any QI intervention versus usual care on DRS attendance and 2. effect of a more intensive (stepped) invertion versus a less intensive intervention). We assessed certainty of evidence (GRADE) for each outcome using customised software (GRADEpro GTD). One author (JGL) did the initial assessment which was then checked by other review authors. We considered risk of bias, inconsistency, indirectness, imprecision and publication bias when judging the certainty of the evidence.
Results
Description of studies
Results of the search
The electronic searches yielded 9030 records (Figure 1). The Cochrane Information Specialist removed 1786 duplicate records and we screened the remaining 7244 records plus 33 records identified from additional sources (Tricco 2012). We rejected 7152 records after reading the abstracts and obtained full‐text reports of 125 references for further assessment. We identified 81 reports of 66 studies that met the inclusion criteria (see Characteristics of included studies) and excluded 34 reports of 34 studies (see Characteristics of excluded studies). We also identified nine reports of eight ongoing trials (see Characteristics of ongoing studies), and will assess these when results become available.

Study flow diagram.
Included studies
The included studies were conducted between 1988 and 2013. Thirty‐five studies (53%) were parallel‐group patient RCTs enrolling 237,025 patients, and 31 (47%) were cluster‐RCTs in which the healthcare professional or the healthcare setting was the unit of randomisation. These included 6126 clusters (range 6 to 4125). Fifty‐nine studies (89.4%) had two arms, six studies (9.1%) had three arms and one study (1.5%) had more than three arms. For further details see Characteristics of included studies.
Types of participants
Participant characteristics are reported in Table 3. Most of the studies (57.6%) recruited participants with type 2 diabetes, 15.2% of studies included those with either type 1 or type 2 diabetes, and in 12.1% of studies the type of diabetes was not reported.
| Study characteristics | Target: diabetic retinopathy screening attendance N = 16 | Target: general quality improvement in diabetes care N = 50 | TOTAL N = 66 |
| Study design | Individual RCT: n = 14 (87.5%) Cluster‐RCT: n = 2 (12.5%) 2 arms n = 13 (81.3%) 3 arms n = 2 (12.5%) > 3 arms n = 1 (6.3%) | Individual RCT: n = 21 (42%) Cluster‐RCT: n = 29 (58%) 2 arms n = 46 (92%) 3 arms n = 4 (8%) | Individual RCT n = 35 (53%) Cluster‐RCT n = 31 (47%) 2 arms n = 59 (89.4%) 3 arms n = 6 (9.1%) > 3 arms n = 1 (1.5%) |
| Location | USA: n = 12 (75%) Canada: n = 1 (6.3%) China: n = 1 (6.3%) Germany: n = 1 (6.3%) UK: n = 1 (6.3%) Conducted between 1995 and 2013 | USA: n = 29 (58%) Canada: n = 2 (4%) Netherlands: n = 4 (8%) Australia: n = 3 (6%) UK: n = 2 (4%) Other n = 10 (20%) Conducted between 1988 and 2013 | USA: n = 41 (62.1%) Canada: n = 3 (4.6%) Netherlands: n = 4 (6.1%) Australia: n = 3 (4.6%) UK: n = 3 (4.6%) Other: n = 12 (18.2%) Conducted between 1988 and 2013 |
| Setting | Primary care: n = 11 (68.8%) Outpatient clinics: n = 4 (25%) Unclear: n = 1 (6.3%) | Primary care: n = 40 (80%) Outpatient n = 3 (6%) Unclear: n = 7 (14%) | Primary care: n = 51 (77.3%) Outpatient clinics n = 7 (10.6%) Unclear n = 8 (12.1%) |
| Diabetes type | Type 2: n = 4 (25%) Type 1 and Type 2: n = 3 (18.8%) Not reported: n = 9 (56.3%) | Type 2: n = 34 (68%) Type 1 and Type 2 n = 7 (14%) Not reported: n = 9 (18%) | Type 2 : n = 38 (57.6%) Type 1 and 2 n = 10 (15.2%) Not reported n = 18 (27.3%) |
| Number of participants recruited | Individual RCT = 38,273 Cluster RCT = 4135 clusters, 182,513 participants Total: 220,786 participants included | Individual RCT = 198,752 Cluster RCT = 1991 clusters, 78,276 participants Total: 277,028 participants included | Individual RCT = 237,025 Cluster RCT = 6126 clusters, 260,789 participants Total: 497,814 participants included |
| Median age | Median 60.7 yrs (range 51.1 ‐ 72.7) | Median 60.6 yrs (range 46.8 ‐ 74) Number reporting n = 34 | Median 60.7 yrs (46.8 ‐ 74) Number reporting n = 43 |
| Gender (% male) | Median 38.9% (range 25% ‐ 98%) Number reporting n = 12 | Median 49.8% (range 25% ‐ 97%): Number reporting n = 35 | Median 48% (25% ‐ 98%) Number reporting n = 47 |
| Type of screening | Retinal exam n = 12 (75%) Grading of digital retinal images: n = 4 (25%) | Retinal exam n = 49 (98%) Grading of retinal images n = 1 (2%) | Retinal exam n = 61 (92.4%) Grading of retinal images n = 5 (7.6%) |
| Baseline screening attendance (in previous 12 or 24 m) | Median 0% (range 0% ‐ 48.4%) Reported in 7 studies | Median 37.1% (range 0% ‐ 88%) Reported in 36 studies | Median 35.4% (range 0% ‐ 87.8%) Reported in 43 studies |
| Longest duration of follow‐up (median)* | Median 6 months (range 3 ‐ 48) Number reporting n = 14 | Median 12 months (range 1 ‐ 30): Number reporting n = 49 | Median 12 months (range 1 ‐ 48) Number reporting n = 63 |
| Intervention target (modified EPOC classification) | Median number of targets in intervention arm = 2 Participant n = 14 (87.5%) Healthcare professional n = 4 (25%) Healthcare system n = 4 (25%) | Median number of targets in intervention arm = 3 Participant n = 31 (62%) Healthcare professional n = 31 (62%) Healthcare system n = 37 (74%) | Median number of targets in intervention arm = 3 Participant n = 45 (68.2%) Healthcare professional n = 35 (53%) Healthcare system n = 41 (62.1%) |
Mansberger 2015 reported follow‐up data to 48 months but intervention offered to intervention and control group after 18 months and data reported at 12 and 24 months.
We used PROGRESS elements to describe the characteristics of participants in the included studies that could have an impact on equity of access to health services. With the exception of gender (reported in 93.9% of studies) and ethnicity (reported in 56.1% of studies), the characteristics of participants were poorly described, and the relative effectiveness of the interventions for subgroups in terms of PROGRESS elements was never reported. Seventeen studies (25.8%) were conducted in disadvantaged populations and none were carried out in low‐ or middle‐income countries.
Types of setting
Details of study location and setting are given in Table 3. Most of the studies (62.1%) were conducted in the USA, 21.2% in Europe and 16.7% elsewhere. The setting was primary care in 77.7%, secondary care in 10.6% and unclear in 12.1%.
Intervention content in terms of QI components (coded using the modified EPOC taxonomy)
Interventions were either specifically targeted at improving attendance for DRS (N = 16) or were part of a general QI intervention to improve diabetes care (N = 50). For studies comparing any intervention to usual care, most studies provided no description of usual care, which precluded coding of the comparator arm.
All 12 QI intervention components, as defined by the modified EPOC taxonomy, were used in at least one study (Figure 2). Generally, interventions were multifaceted, with several QI components per intervention arm (median 3, range 1 ‐ 7). For interventions specifically targeting DRS attendance, the most commonly used QI components were ‘Patient reminders (56% of studies)’ and ‘Patient education (75%) (Figure 3). For general QI interventions, a greater number and range of strategies were used, including: ‘Patient education’ (48% of studies), ‘Promotion of self‐management’ (40%), ‘Case management’ (40%), ‘Clinician education’ (38%) and ‘Team changes’ (36%).
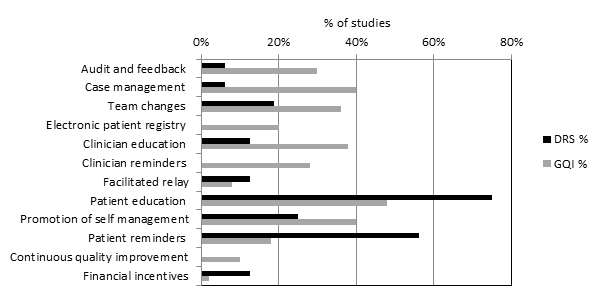
Quality improvement components used in intervention arm of included studies. (DRS=diabetic retinopathy screening, GQI=general quality improvement).

Risk of bias summary: review authors' judgements about each risk of bias item for each included study.
Intervention content in terms of BCTs (coded using the BCT taxonomy)
Overall, 39 out of the possible 93 BCTs (42%) were identified as targeting change in patient or healthcare professional behaviour in at least one trial. Interventions specifically targeting DRS primarily used techniques aimed at patients, particularly ‘Instruction on how to perform the behaviour’ (75% of studies), ‘Prompts/cues’ (69%) and ‘Information about consequences’ (56%) (Figure 4). Relatively few of these studies used BCTs that were aimed at healthcare professionals (Figure 5). By contrast, these healthcare professional‐directed strategies were more widely used in general QI interventions, in particular: ‘Instruction on how to perform the behaviour’ (66%), ‘Restructuring the social environment’ (52%) and ‘Feedback on outcomes of behaviour/Biofeedback’ (36%). Table 1 provides illustrative quotations for each BCT.

Behaviour change techniques (BCTs) targeting patients used in intervention arm. of included studies (DRS=diabetic retinopathy screening, GQI=general quality improvement).

Behaviour change techniques (BCTs) targeting healthcare professionals used in intervention arm of included studies (DRS=diabetic retinopathy screening, GQI=general quality improvement).
For studies comparing any intervention to usual care, most studies provided no description of usual care, which precluded coding of the comparator arm.
Outcome measures
In 12 (75%) of the 16 studies where the primary target of the intervention was to improve attendance for DRS, the outcome was a dilated fundus examination conducted by an ophthalmologist or optometrist during the follow‐up period post‐intervention (median follow‐up 12 months). The fundus examination was confirmed by a medical record audit, health claims database, or an eye‐care professional confirmed examination. In four studies (25%) DRS consisted of screening of digital retinal images.
Of the 50 studies where DRS attendance was reported as part of a general QI intervention, DRS was usually listed as part of a number of processes of care based on diabetes guideline recommendations. DRS was variously described as a dilated fundus examination/diabetic eye exam/retinal exam/eye exam in 49 studies (98%) and involved grading of retinal images in one study. DRS was confirmed by medical record audit, from claims databases or patient self‐reports (both validated and unvalidated by an eye‐care professional). The median duration of follow‐up was 12 months (range 1 ‐ 48 months).
In terms of economic outcomes, five studies reported a full economic evaluation (Davis 2010; Eccles 2007; Pizzi 2015; Prezio 2014; Walker 2008).Three of these were cost‐effectiveness analyses (Davis 2010; Prezio 2014; Walker 2008) and two were cost‐consequence analyses (Eccles 2007; Pizzi 2015). Nine studies were partial economic evaluations; five were resource‐utilisation studies, (Clancy 2007; Frei 2014; Krein 2004; McCall 2011; Piette 2001), while four were cost‐outcome descriptions (Adair 2013; Frijling 2002; Litaker 2003; Wagner 2001). We could not retrieve the full text of one of the cost‐effectiveness studies, but the abstract provided some information required for the review alongside the clinical‐effectiveness report (Davis 2010).
Excluded studies
Risk of bias in included studies
We conducted 'Risk of bias' assessment using the Cochrane EPOC 'Risk of bias' tool. Figure 3 and Figure 6 summarise the risks of bias. Overall, we judged trials to be at low or unclear risk of bias for most of the bias domains. We provide support for each judgement in the Characteristics of included studies tables.

Risk of bias graph: review authors' judgements about each risk of bias item presented as percentages across all included studies.
The studies that reported economic outcomes are a subset of the studies included in the review, and the risks of bias of these studies were very similar to the main body of included studies. With respect to the economic methodological quality, only five of the 14 included studies reported full economic evaluations (Davis 2010; Eccles 2007; Pizzi 2015; Prezio 2014; Walker 2008). One of these studies (Davis 2010) was published as an abstract and lacked important methodological details. Only three of the studies with full economic evaluations (Pizzi 2015; Prezio 2014; Walker 2008) reported a sensitivity analysis to explore changes in the costs and outcomes under different scenarios. Discounting in economic evaluations is necessary to adjust future costs and outcomes of an intervention to its present value, but was reported in only one of the full economic outcomes (Prezio 2014). Its use would have been appropriate in those other studies which had a stated follow‐up of longer than 12 months (Eccles 2007; Frijling 2002; Krein 2004; Wagner 2008). We considered the methodological quality of the full economic evaluations to be moderate, while the partial economic evaluations by their nature lacked the methodological characteristics expected of an economic evaluation. Full details of the methodological quality assessment for each of the included economic evaluations are available in Table 4 and Table 5.
| CHEC criteria checklists | Adair 2013 | Clancy 2007 | Davis 2011 | Eccles 2007 | Frei 2014 | Frijling 2002 | Krein 2004 | Litaker 2003 | McCall 2011 | Piette 2001 | Pizzi 2015 | Prezio 2014 | Schechter 2008 | Wagner 2001 |
| Is the study population clearly described? | Y | Y | Y | Y | Y | Y | Y | Y | Y | Y | Y | Y | Y | Y |
| Are competing alternatives clearly described? | Y | Y | Y | N | N | Y | Y | Y | N | N | Y | Y | Y | N |
| Is a well‐defined research question posed in answerable form? | Y | Y | Y | Y | Y | Y | Y | Y | Y | N | Y | Y | Y | Y |
| Is the economic study design appropriate to the stated objective? | N | N | Y | N | N | N | N | Y | N | N | Y | Y | Y | N |
| Is the chosen time horizon appropriate to include relevant costs and consequences? | Y | N | U | N | N | N | N | Y | N | N | Y | Y | Y | N |
| Is the actual perspective chosen appropriate? | Y | N | Y | Y | Y | Y | Y | Y | Y | Y | Y | Y | Y | Y |
| Are all important and relevant costs for each alternative identified? | Y | N | Y | Y | N | N | N | N | N | N | Y | Y | Y | N |
| Are all costs measured appropriately in physical units? | Y | N | U | Y | N | Y | N | Y | Y | N | Y | Y | Y | N |
| Are costs valued appropriately? | Y | N | N | Y | N | Y | N | Y | N | N | Y | Y | Y | N |
| Are all important and relevant outcomes for each alternative identified? | Y | N | Y | Y | Y | Y | N | Y | N | Y | Y | Y | Y | N |
| Are all outcomes measured appropriately? | Y | Y | Y | Y | N | Y | N | Y | Y | N | Y | Y | Y | N |
| Are outcomes valued appropriately? | N | N | N | Y | N | N | N | N | N | N | Y | Y | N | N |
| Is an incremental analysis of costs and outcomes of alternatives performed? | N | N | Y | N | N | N | N | N | N | N | Y | Y | Y | N |
| Are all future costs and outcomes discounted appropriately? | N | N | N | N | N | N | N | N | N | N | Y | Y | N | N |
| Are all important variables, whose values are uncertain, appropriately subjected to sensitivity analysis? | N | N | N | Y | N | N | N | N | N | N | Y | Y | Y | N |
| Do the conclusions follow from the data reported? | Y | Y | Y | N | Y | Y | Y | N | N | Y | Y | Y | Y | Y |
| Does the study discuss the generalizability of the results to other settings patient/client groups? | Y | Y | Y | Y | Y | Y | Y | Y | N | Y | Y | Y | Y | Y |
| Does the article indicate that there is no potential conflict of interest of study researcher(s) and funder(s)? | Y | Y | Y | Y | Y | Y | Y | Y | N | Y | Y | Y | Y | Y |
| Are ethical and distributional issues discussed appropriately? | Y | Y | Y | Y | Y | Y | Y | Y | Y | Y | Y | Y | Y | Y |
N: no
U: unclear
Y: yes
| Section of paper | Component | Reported on page number |
| Adair 2013 | ||
| Abstract | Provide a structured summary of objectives, perspective, setting, methods (including study design and inputs), results (including base case and uncertainty analyses), and conclusions | Not reported |
| Introduction | ‐ | |
| Background and objectives | Provide an explicit statement of the broader context for the study | 176 |
| Present the study question and its relevance for health policy or practice decisions | 176 | |
| Methods | ||
| Target population and subgroups | Describe characteristics of the base case population and subgroups analysed, including why they were chosen | 177 |
| Setting and location | State relevant aspects of the system(s) in which the decision(s) need(s) to be made | 177 |
| Study perspective | Describe the perspective of the study and relate this to the costs being evaluated | 178 ‐ 179 |
| Comparators | Describe the interventions or strategies being compared and state why they were chosen | Not reported |
| Time horizon | State the time horizon(s) over which costs and consequences are being evaluated and say why appropriate | Not reported |
| Discount rate | Report the choice of discount rate(s) used for costs and outcomes and say why appropriate | Not reported |
| Choice of health outcomes | Describe what outcomes were used as the measure(s) of benefit in the evaluation and their relevance for the type of analysis performed | Not reported |
| Measurement of effectiveness | Single study‐based estimates: Describe fully the design features of the single effectiveness study and why the single study was a sufficient source of clinical effectiveness data | Not reported |
| Synthesis‐based estimates: Describe fully the methods used for identification of included studies and synthesis of clinical effectiveness data | Not reported | |
| Measurement and valuation of preference based outcomes | If applicable, describe the population and methods used to elicit preferences for outcomes | Not reported |
| Estimating resources and costs | Single study‐based economic evaluation: Describe approaches used to estimate resource use associated with the alternative interventions. Describe primary or secondary research methods for valuing each resource item in terms of its unit cost. Describe any adjustments made to approximate to opportunity costs | 179 |
| Currency, price date, and conversion | Report the dates of the estimated resource quantities and unit costs. Describe methods for adjusting estimated unit costs to the year of reported costs if necessary. Describe methods for converting costs into a common currency base and the exchange rate | 179 |
| Choice of model | Describe and give reasons for the specific type of decision‐analytical model used. Providing a figure to show model structure is strongly recommended | Not reported |
| Assumptions | Describe all structural or other assumptions underpinning the decision‐analytical model | Not reported |
| Analytical methods | Describe all analytical methods supporting the evaluation. This could include methods for dealing with skewed, missing, or censored data; extrapolation methods; methods for pooling data; approaches to validate or make adjustments (such as half cycle corrections) to a model; and methods for handling population heterogeneity and uncertainty | Not reported |
| Results | ||
| Study parameters | Report the values, ranges, references, and, if used, probability distributions for all parameters. Report reasons or sources for distributions used to represent uncertainty where appropriate. Providing a table to show the input values is strongly recommended | Appendices w65 |
| Incremental costs and outcomes | For each intervention, report mean values for the main categories of estimated costs and outcomes of interest, as well as mean differences between the comparator groups. If applicable, report incremental cost‐effectiveness ratios | Appendices w65 |
| Characterising uncertainty | Single study‐based economic evaluation: Describe the effects of sampling uncertainty for the estimated incremental cost and incremental effectiveness parameters, together with the impact of methodological assumptions (such as discount rate, study perspective) | Not reported |
| Model‐based economic evaluation: Describe the effects on the results of uncertainty for all input parameters, and uncertainty related to the structure of the model and assumptions | Not reported | |
| Characterising heterogeneity | If applicable, report differences in costs, outcomes, or cost‐effectiveness that can be explained by variations between subgroups of patients with different baseline characteristics or other observed variability in effects that are not reducible by more information | Not reported |
| Discussion | ||
| Study findings, limitations, generalisability, and current knowledge | Summarise key study findings and describe how they support the conclusions reached. Discuss limitations and the generalisability of the findings and how the findings fit with current knowledge | 183 |
| Other | ||
| Source of funding | Describe how the study was funded and the role of the funder in the identification, design, conduct, and reporting of the analysis. Describe other non‐monetary sources of support | 183 |
| Conflicts of interest | Describe any potential for conflict of interest of study contributors in accordance with journal policy. In the absence of a journal policy, we recommend authors comply with International Committee of Medical Journal Editors recommendations | 183 |
| Clancy 2007 | ||
| Title | Identify the study as an economic evaluation or use more specific terms such as “cost‐effectiveness analysis”, and describe the interventions compared. | Not reported |
| Abstract | Provide a structured summary of objectives, perspective, setting, methods (including study design and inputs), results (including base case and uncertainty analyses), and conclusions. | Not reported |
| Introduction | ||
| Background and objectives | Provide an explicit statement of the broader context for the study. | Not reported |
| Present the study question and its relevance for health policy or practice decisions. | 620 | |
| Methods | Not reported | |
| Target population and subgroups | Describe characteristics of the base case population and subgroups analysed, including why they were chosen. | 621 |
| Setting and location | State relevant aspects of the system(s) in which the decision(s) need(s) to be made. | Not reported |
| Study perspective | Describe the perspective of the study and relate this to the costs being evaluated. | Not reported |
| Comparators | Describe the interventions or strategies being compared and state why they were chosen. | 620 ‐ 621 |
| Time horizon | State the time horizon(s) over which costs and consequences are being evaluated and say why appropriate. | Not reported |
| Discount rate | Report the choice of discount rate(s) used for costs and outcomes and say why appropriate. | Not reported |
| Choice of health outcomes | Describe what outcomes were used as the measure(s) of benefit in the evaluation and their relevance for the type of analysis performed. | Not reported |
| Measurement of effectiveness | Single study‐based estimates: Describe fully the design features of the single effectiveness study and why the single study was a sufficient source of clinical effectiveness data. | 620 |
| Synthesis‐based estimates: Describe fully the methods used for identification of included studies and synthesis of clinical effectiveness data. | Not reported | |
| Measurement and valuation of preference based outcomes | If applicable, describe the population and methods used to elicit preferences for outcomes. | Not reported |
| Estimating resources and costs | Single study‐based economic evaluation: Describe approaches used to estimate resource use associated with the alternative interventions. Describe primary or secondary research methods for valuing each resource item in terms of its unit cost. Describe any adjustments made to approximate to opportunity costs. | Not reported |
| Currency, price date, and conversion | Report the dates of the estimated resource quantities and unit costs. Describe methods for adjusting estimated unit costs to the year of reported costs if necessary. Describe methods for converting costs into a common currency base and the exchange rate. | Not reported |
| Choice of model | Describe and give reasons for the specific type of decision‐analytical model used. Providing a figure to show model structure is strongly recommended. | Not reported |
| Assumptions | Describe all structural or other assumptions underpinning the decision‐analytical model. | Not reported |
| Analytical methods | Describe all analytical methods supporting the evaluation. This could include methods for dealing with skewed, missing, or censored data; extrapolation methods; methods for pooling data; approaches to validate or make adjustments (such as half cycle corrections) to a model; and methods for handling population heterogeneity and uncertainty. | 622 |
| Results | ||
| Study parameters | Report the values, ranges, references, and, if used, probability distributions for all parameters. Report reasons or sources for distributions used to represent uncertainty where appropriate. Providing a table to show the input values is strongly recommended. | Not reported |
| Incremental costs and outcomes | For each intervention, report mean values for the main categories of estimated costs and outcomes of interest, as well as mean differences between the comparator groups. If applicable, report incremental cost‐effectiveness ratios. | Not reported |
| Characterising uncertainty | Single study‐based economic evaluation: Describe the effects of sampling uncertainty for the estimated incremental cost and incremental effectiveness parameters, together with the impact of methodological assumptions (such as discount rate, study perspective). | Not reported |
| Model‐based economic evaluation: Describe the effects on the results of uncertainty for all input parameters, and uncertainty related to the structure of the model and assumptions | Not reported | |
| Characterising heterogeneity | If applicable, report differences in costs, outcomes, or cost‐effectiveness that can be explained by variations between subgroups of patients with different baseline characteristics or other observed variability in effects that are not reducible by more information. | Not reported |
| Discussion | ||
| Study findings, limitations, generalisability, and current knowledge | Summarise key study findings and describe how they support the conclusions reached. Discuss limitations and the generalisability of the findings and how the findings fit with current knowledge. | Not reported |
| Other | ||
| Source of funding | Describe how the study was funded and the role of the funder in the identification, design, conduct, and reporting of the analysis. Describe other non‐monetary sources of support. | 624 |
| Conflicts of interest | Describe any potential for conflict of interest of study contributors in accordance with journal policy. In the absence of a journal policy, we recommend authors comply with International Committee of Medical Journal Editors recommendations. | 624 |
| Davis 2010 | ||
| Title | Identify the study as an economic evaluation or use more specific terms such as “cost‐effectiveness analysis”, and describe the interventions compared. | Abstract A325 |
| Abstract | Provide a structured summary of objectives, perspective, setting, methods (including study design and inputs), results (including base case and uncertainty analyses), and conclusions. | Abstract A325 |
| Introduction | ||
| Background and objectives | Provide an explicit statement of the broader context for the study. | Abstract A325 |
| Present the study question and its relevance for health policy or practice decisions. | 1712 of effectiveness report | |
| Methods | ||
| Target population and subgroups | Describe characteristics of the base case population and subgroups analysed, including why they were chosen. | 1714 of effectiveness report |
| Setting and location | State relevant aspects of the system(s) in which the decision(s) need(s) to be made. | Abstract A325 |
| Study perspective | Describe the perspective of the study and relate this to the costs being evaluated. | Not reported |
| Comparators | Describe the interventions or strategies being compared and state why they were chosen. | Abstract A325 |
| Time horizon | State the time horizon(s) over which costs and consequences are being evaluated and say why appropriate. | Abstract A325 |
| Discount rate | Report the choice of discount rate(s) used for costs and outcomes and say why appropriate. | Not reported |
| Choice of health outcomes | Describe what outcomes were used as the measure(s) of benefit in the evaluation and their relevance for the type of analysis performed. | 1713 |
| Measurement of effectiveness | Single study‐based estimates: Describe fully the design features of the single effectiveness study and why the single study was a sufficient source of clinical effectiveness data. | Abstract A325 |
| Synthesis‐based estimates: Describe fully the methods used for identification of included studies and synthesis of clinical effectiveness data. | Not applicable | |
| Measurement and valuation of preference based outcomes | If applicable, describe the population and methods used to elicit preferences for outcomes. | Not reported |
| Estimating resources and costs | Single study‐based economic evaluation: Describe approaches used to estimate resource use associated with the alternative interventions. Describe primary or secondary research methods for valuing each resource item in terms of its unit cost. Describe any adjustments made to approximate to opportunity costs. | Not reported |
| Currency, price date, and conversion | Report the dates of the estimated resource quantities and unit costs. Describe methods for adjusting estimated unit costs to the year of reported costs if necessary. Describe methods for converting costs into a common currency base and the exchange rate. | Not reported |
| Choice of model | Describe and give reasons for the specific type of decision‐analytical model used. Providing a figure to show model structure is strongly recommended. | Not applicable |
| Assumptions | Describe all structural or other assumptions underpinning the decision‐analytical model. | Not applicable |
| Analytical methods | Describe all analytical methods supporting the evaluation. This could include methods for dealing with skewed, missing, or censored data; extrapolation methods; methods for pooling data; approaches to validate or make adjustments (such as half cycle corrections) to a model; and methods for handling population heterogeneity and uncertainty. | Not applicable |
| Results | ||
| Study parameters | Report the values, ranges, references, and, if used, probability distributions for all parameters. Report reasons or sources for distributions used to represent uncertainty where appropriate. Providing a table to show the input values is strongly recommended. | Not reported |
| Incremental costs and outcomes | For each intervention, report mean values for the main categories of estimated costs and outcomes of interest, as well as mean differences between the comparator groups. If applicable, report incremental cost‐effectiveness ratios. | Abstract A325 |
| Characterising uncertainty | Single study‐based economic evaluation: Describe the effects of sampling uncertainty for the estimated incremental cost and incremental effectiveness parameters, together with the impact of methodological assumptions (such as discount rate, study perspective). | Not reported |
| Model‐based economic evaluation: Describe the effects on the results of uncertainty for all input parameters, and uncertainty related to the structure of the model and assumptions. | Not applicable | |
| Characterising heterogeneity | If applicable, report differences in costs, outcomes, or cost‐effectiveness that can be explained by variations between subgroups of patients with different baseline characteristics or other observed variability in effects that are not reducible by more information. | Not reported |
| Discussion | ||
| Study findings, limitations, generalisability, and current knowledge | Summarise key study findings and describe how they support the conclusions reached. Discuss limitations and the generalisability of the findings and how the findings fit with current knowledge. | Not reported |
| Other | ||
| Source of funding | Describe how the study was funded and the role of the funder in the identification, design, conduct, and reporting of the analysis. Describe other non‐monetary sources of support. | 1716 |
| Conflicts of interest | Describe any potential for conflict of interest of study contributors in accordance with journal policy. In the absence of a journal policy, we recommend authors comply with International Committee of Medical Journal Editors recommendations. | 1716 |
| Eccles 2007 | ||
| Title | Identify the study as an economic evaluation or use more specific terms such as “cost‐effectiveness analysis”, and describe the interventions compared. | Not reported |
| Abstract | Provide a structured summary of objectives, perspective, setting, methods (including study design and inputs), results (including base case and uncertainty analyses), and conclusions. | Not reported |
| Introduction | ||
| Background and objectives | Provide an explicit statement of the broader context for the study. | 2 |
| Present the study question and its relevance for health policy or practice decisions. | 2 | |
| Methods | ||
| Target population and subgroups | Describe characteristics of the base case population and subgroups analysed, including why they were chosen. | 2 |
| Setting and location | State relevant aspects of the system(s) in which the decision(s) need(s) to be made. | 2 |
| Study perspective | Describe the perspective of the study and relate this to the costs being evaluated. | 4 |
| Comparators | Describe the interventions or strategies being compared and state why they were chosen. | 4 |
| Time horizon | State the time horizon(s) over which costs and consequences are being evaluated and say why appropriate. | 4 |
| Discount rate | Report the choice of discount rate(s) used for costs and outcomes and say why appropriate. | |
| Choice of health outcomes | Describe what outcomes were used as the measure(s) of benefit in the evaluation and their relevance for the type of analysis performed. | 3 |
| Measurement of effectiveness | Single study‐based estimates: Describe fully the design features of the single effectiveness study and why the single study was a sufficient source of clinical effectiveness data. | Not reported |
| Synthesis‐based estimates: Describe fully the methods used for identification of included studies and synthesis of clinical effectiveness data. | Not reported | |
| Measurement and valuation of preference based outcomes | If applicable, describe the population and methods used to elicit preferences for outcomes. | 3 |
| Estimating resources and costs | Single study‐based economic evaluation: Describe approaches used to estimate resource use associated with the alternative interventions. Describe primary or secondary research methods for valuing each resource item in terms of its unit cost. Describe any adjustments made to approximate to opportunity costs. | 3 |
| Currency, price date, and conversion | Report the dates of the estimated resource quantities and unit costs. Describe methods for adjusting estimated unit costs to the year of reported costs if necessary. Describe methods for converting costs into a common currency base and the exchange rate. | 4 |
| Choice of model | Describe and give reasons for the specific type of decision‐analytical model used. Providing a figure to show model structure is strongly recommended. | Not reported |
| Assumptions | Describe all structural or other assumptions underpinning the decision‐analytical model. | Not reported |
| Analytical methods | Describe all analytical methods supporting the evaluation. This could include methods for dealing with skewed, missing, or censored data; extrapolation methods; methods for pooling data; approaches to validate or make adjustments (such as half cycle corrections) to a model; and methods for handling population heterogeneity and uncertainty. | Not reported |
| Results | ||
| Study parameters | Report the values, ranges, references, and, if used, probability distributions for all parameters. Report reasons or sources for distributions used to represent uncertainty where appropriate. Providing a table to show the input values is strongly recommended. | Not reportted |
| Incremental costs and outcomes | For each intervention, report mean values for the main categories of estimated costs and outcomes of interest, as well as mean differences between the comparator groups. If applicable, report incremental cost‐effectiveness ratios. | 8 ‐ 12 |
| Characterising uncertainty | Single study‐based economic evaluation: Describe the effects of sampling uncertainty for the estimated incremental cost and incremental effectiveness parameters, together with the impact of methodological assumptions (such as discount rate, study perspective). | Not reported |
| Model‐based economic evaluation: Describe the effects on the results of uncertainty for all input parameters, and uncertainty related to the structure of the model and assumptions. | Not reported | |
| Characterising heterogeneity | If applicable, report differences in costs, outcomes, or cost‐effectiveness that can be explained by variations between subgroups of patients with different baseline characteristics or other observed variability in effects that are not reducible by more information. | Not reported |
| Discussion | ||
| Study findings, limitations, generalisability, and current knowledge | Summarise key study findings and describe how they support the conclusions reached. Discuss limitations and the generalisability of the findings and how the findings fit with current knowledge. | 6, 10 |
| Other | ||
| Source of funding | Describe how the study was funded and the role of the funder in the identification, design, conduct, and reporting of the analysis. Describe other non‐monetary sources of support. | 11 |
| Conflicts of interest | Describe any potential for conflict of interest of study contributors in accordance with journal policy. In the absence of a journal policy, we recommend authors comply with International Committee of Medical Journal Editors recommendations. | 11 |
| Frei 2014 | ||
| Title | Identify the study as an economic evaluation or use more specific terms such as “cost‐effectiveness analysis”, and describe the interventions compared. | Not reported |
| Abstract | Provide a structured summary of objectives, perspective, setting, methods (including study design and inputs), results (including base case and uncertainty analyses), and conclusions. | Not reported |
| Introduction | ||
| Background and objectives | Provide an explicit statement of the broader context for the study. | 1040 |
| Present the study question and its relevance for health policy or practice decisions. | 1040 | |
| Methods | ||
| Target population and subgroups | Describe characteristics of the base case population and subgroups analysed, including why they were chosen. | 1043 |
| Setting and location | State relevant aspects of the system(s) in which the decision(s) need(s) to be made. | 1040 |
| Study perspective | Describe the perspective of the study and relate this to the costs being evaluated. | Not reported |
| Comparators | Describe the interventions or strategies being compared and state why they were chosen. | 1040 |
| Time horizon | State the time horizon(s) over which costs and consequences are being evaluated and say why appropriate. | Not reported |
| Discount rate | Report the choice of discount rate(s) used for costs and outcomes and say why appropriate. | Not reported |
| Choice of health outcomes | Describe what outcomes were used as the measure(s) of benefit in the evaluation and their relevance for the type of analysis performed. | Not reported |
| Measurement of effectiveness | Single study‐based estimates: Describe fully the design features of the single effectiveness study and why the single study was a sufficient source of clinical effectiveness data. | Not reported |
| Synthesis‐based estimates: Describe fully the methods used for identification of included studies and synthesis of clinical effectiveness data. | Not applicable | |
| Measurement and valuation of preference based outcomes | If applicable, describe the population and methods used to elicit preferences for outcomes. | Not reported |
| Estimating resources and costs | Single study‐based economic evaluation: Describe approaches used to estimate resource use associated with the alternative interventions. Describe primary or secondary research methods for valuing each resource item in terms of its unit cost. Describe any adjustments made to approximate to opportunity costs. | Not reported |
| Currency, price date, and conversion | Report the dates of the estimated resource quantities and unit costs. Describe methods for adjusting estimated unit costs to the year of reported costs if necessary. Describe methods for converting costs into a common currency base and the exchange rate. | Not reported |
| Choice of model | Describe and give reasons for the specific type of decision‐analytical model used. Providing a figure to show model structure is strongly recommended. | Not applicable |
| Assumptions | Describe all structural or other assumptions underpinning the decision‐analytical model. | Not applicable |
| Analytical methods | Describe all analytical methods supporting the evaluation. This could include methods for dealing with skewed, missing, or censored data; extrapolation methods; methods for pooling data; approaches to validate or make adjustments (such as half cycle corrections) to a model; and methods for handling population heterogeneity and uncertainty. | Not applicable |
| Results | ||
| Study parameters | Report the values, ranges, references, and, if used, probability distributions for all parameters. Report reasons or sources for distributions used to represent uncertainty where appropriate. Providing a table to show the input values is strongly recommended. | Not reported |
| Incremental costs and outcomes | For each intervention, report mean values for the main categories of estimated costs and outcomes of interest, as well as mean differences between the comparator groups. If applicable, report incremental cost‐effectiveness ratios. | Not reported |
| Characterising uncertainty | Single study‐based economic evaluation: Describe the effects of sampling uncertainty for the estimated incremental cost and incremental effectiveness parameters, together with the impact of methodological assumptions (such as discount rate, study perspective). | Not reported |
| Model‐based economic evaluation: Describe the effects on the results of uncertainty for all input parameters, and uncertainty related to the structure of the model and assumptions. | Not applicable | |
| Characterising heterogeneity | If applicable, report differences in costs, outcomes, or cost‐effectiveness that can be explained by variations between subgroups of patients with different baseline characteristics or other observed variability in effects that are not reducible by more information. | Not reported |
| Discussion | ||
| Study findings, limitations, generalisability, and current knowledge | Summarise key study findings and describe how they support the conclusions reached. Discuss limitations and the generalisability of the findings and how the findings fit with current knowledge. | 1045 |
| Other | ||
| Source of funding | Describe how the study was funded and the role of the funder in the identification, design, conduct, and reporting of the analysis. Describe other non‐monetary sources of support. | 1045 |
| Conflicts of interest | Describe any potential for conflict of interest of study contributors in accordance with journal policy. In the absence of a journal policy, we recommend authors comply with International Committee of Medical Journal Editors recommendations. | 1045 |
| Frijling 2002 | ||
| Title | Identify the study as an economic evaluation or use more specific terms such as “cost‐effectiveness analysis”, and describe the interventions compared. | Not reported |
| Abstract | Provide a structured summary of objectives, perspective, setting, methods (including study design and inputs), results (including base case and uncertainty analyses), and conclusions. | Not reported |
| Introduction | ||
| Background and objectives | Provide an explicit statement of the broader context for the study. | 837 |
| Present the study question and its relevance for health policy or practice decisions. | 837 | |
| Methods | ||
| Target population and subgroups | Describe characteristics of the base case population and subgroups analysed, including why they were chosen. | 838 |
| Setting and location | State relevant aspects of the system(s) in which the decision(s) need(s) to be made. | 838 |
| Study perspective | Describe the perspective of the study and relate this to the costs being evaluated. | Not reported |
| Comparators | Describe the interventions or strategies being compared and state why they were chosen. | 837 |
| Time horizon | State the time horizon(s) over which costs and consequences are being evaluated and say why appropriate. | Not reported |
| Discount rate | Report the choice of discount rate(s) used for costs and outcomes and say why appropriate. | Not reported |
| Choice of health outcomes | Describe what outcomes were used as the measure(s) of benefit in the evaluation and their relevance for the type of analysis performed. | Not reported |
| Measurement of effectiveness | Single study‐based estimates: Describe fully the design features of the single effectiveness study and why the single study was a sufficient source of clinical effectiveness data. | Not reported |
| Synthesis‐based estimates: Describe fully the methods used for identification of included studies and synthesis of clinical effectiveness data. | Not applicable | |
| Measurement and valuation of preference based outcomes | If applicable, describe the population and methods used to elicit preferences for outcomes. | Not reported |
| Estimating resources and costs | Single study‐based economic evaluation: Describe approaches used to estimate resource use associated with the alternative interventions. Describe primary or secondary research methods for valuing each resource item in terms of its unit cost. Describe any adjustments made to approximate to opportunity costs. | Not reported |
| Currency, price date, and conversion | Report the dates of the estimated resource quantities and unit costs. Describe methods for adjusting estimated unit costs to the year of reported costs if necessary. Describe methods for converting costs into a common currency base and the exchange rate. | Not reported |
| Choice of model | Describe and give reasons for the specific type of decision‐analytical model used. Providing a figure to show model structure is strongly recommended. | Not applicable |
| Assumptions | Describe all structural or other assumptions underpinning the decision‐analytical model. | Not applicable |
| Analytical methods | Describe all analytical methods supporting the evaluation. This could include methods for dealing with skewed, missing, or censored data; extrapolation methods; methods for pooling data; approaches to validate or make adjustments (such as half cycle corrections) to a model; and methods for handling population heterogeneity and uncertainty. | Not reported |
| Results | ||
| Study parameters | Report the values, ranges, references, and, if used, probability distributions for all parameters. Report reasons or sources for distributions used to represent uncertainty where appropriate. Providing a table to show the input values is strongly recommended. | Not reported |
| Incremental costs and outcomes | For each intervention, report mean values for the main categories of estimated costs and outcomes of interest, as well as mean differences between the comparator groups. If applicable, report incremental cost‐effectiveness ratios. | Not reported |
| Characterising uncertainty | Single study‐based economic evaluation: Describe the effects of sampling uncertainty for the estimated incremental cost and incremental effectiveness parameters, together with the impact of methodological assumptions (such as discount rate, study perspective). | Not reported |
| Model‐based economic evaluation: Describe the effects on the results of uncertainty for all input parameters, and uncertainty related to the structure of the model and assumptions. | Not applicable | |
| Characterising heterogeneity | If applicable, report differences in costs, outcomes, or cost‐effectiveness that can be explained by variations between subgroups of patients with different baseline characteristics or other observed variability in effects that are not reducible by more information. | Not applicable |
| Discussion | ||
| Study findings, limitations, generalisability, and current knowledge | Summarise key study findings and describe how they support the conclusions reached. Discuss limitations and the generalisability of the findings and how the findings fit with current knowledge. | 841 |
| Other | ||
| Source of funding | Describe how the study was funded and the role of the funder in the identification, design, conduct, and reporting of the analysis. Describe other non‐monetary sources of support. | 841 |
| Conflicts of interest | Describe any potential for conflict of interest of study contributors in accordance with journal policy. In the absence of a journal policy, we recommend authors comply with International Committee of Medical Journal Editors recommendations. | Not reported |
| Krein 2004 | ||
| Title | Identify the study as an economic evaluation or use more specific terms such as “cost‐effectiveness analysis”, and describe the interventions compared. | Not reported |
| Abstract | Provide a structured summary of objectives, perspective, setting, methods (including study design and inputs), results (including base case and uncertainty analyses), and conclusions. | Not reported |
| Introduction | ||
| Background and objectives | Provide an explicit statement of the broader context for the study. | 732 |
| Present the study question and its relevance for health policy or practice decisions. | 732 | |
| Methods | ||
| Target population and subgroups | Describe characteristics of the base case population and subgroups analysed, including why they were chosen. | 733 |
| Setting and location | State relevant aspects of the system(s) in which the decision(s) need(s) to be made. | 733 |
| Study perspective | Describe the perspective of the study and relate this to the costs being evaluated. | Not reported |
| Comparators | Describe the interventions or strategies being compared and state why they were chosen. | 733 |
| Time horizon | State the time horizon(s) over which costs and consequences are being evaluated and say why appropriate. | Not reported |
| Discount rate | Report the choice of discount rate(s) used for costs and outcomes and say why appropriate. | Not reported |
| Choice of health outcomes | Describe what outcomes were used as the measure(s) of benefit in the evaluation and their relevance for the type of analysis performed. | Not reported |
| Measurement of effectiveness | Single study‐based estimates: Describe fully the design features of the single effectiveness study and why the single study was a sufficient source of clinical effectiveness data. | Not reported |
| Synthesis‐based estimates: Describe fully the methods used for identification of included studies and synthesis of clinical effectiveness data. | ||
| Measurement and valuation of preference based outcomes | If applicable, describe the population and methods used to elicit preferences for outcomes. | Not reported |
| Estimating resources and costs | Single study‐based economic evaluation: Describe approaches used to estimate resource use associated with the alternative interventions. Describe primary or secondary research methods for valuing each resource item in terms of its unit cost. Describe any adjustments made to approximate to opportunity costs. | Not reported |
| Currency, price date, and conversion | Report the dates of the estimated resource quantities and unit costs. Describe methods for adjusting estimated unit costs to the year of reported costs if necessary. Describe methods for converting costs into a common currency base and the exchange rate. | Not reported |
| Choice of model | Describe and give reasons for the specific type of decision‐analytical model used. Providing a figure to show model structure is strongly recommended. | |
| Assumptions | Describe all structural or other assumptions underpinning the decision‐analytical model. | Not reported |
| Analytical methods | Describe all analytical methods supporting the evaluation. This could include methods for dealing with skewed, missing, or censored data; extrapolation methods; methods for pooling data; approaches to validate or make adjustments (such as half cycle corrections) to a model; and methods for handling population heterogeneity and uncertainty. | Not reported |
| Results | ||
| Study parameters | Report the values, ranges, references, and, if used, probability distributions for all parameters. Report reasons or sources for distributions used to represent uncertainty where appropriate. Providing a table to show the input values is strongly recommended. | Not reported |
| Incremental costs and outcomes | For each intervention, report mean values for the main categories of estimated costs and outcomes of interest, as well as mean differences between the comparator groups. If applicable, report incremental cost‐effectiveness ratios. | Not reported |
| Characterising uncertainty | Single study‐based economic evaluation: Describe the effects of sampling uncertainty for the estimated incremental cost and incremental effectiveness parameters, together with the impact of methodological assumptions (such as discount rate, study perspective). | Not reported |
| Model‐based economic evaluation: Describe the effects on the results of uncertainty for all input parameters, and uncertainty related to the structure of the model and assumptions. | Not applicable | |
| Characterising heterogeneity | If applicable, report differences in costs, outcomes, or cost‐effectiveness that can be explained by variations between subgroups of patients with different baseline characteristics or other observed variability in effects that are not reducible by more information. | Not applicable |
| Discussion | ||
| Study findings, limitations, generalisability, and current knowledge | Summarise key study findings and describe how they support the conclusions reached. Discuss limitations and the generalisability of the findings and how the findings fit with current knowledge. | 738 |
| Other | ||
| Source of funding | Describe how the study was funded and the role of the funder in the identification, design, conduct, and reporting of the analysis. Describe other non‐monetary sources of support. | 732 |
| Conflicts of interest | Describe any potential for conflict of interest of study contributors in accordance with journal policy. In the absence of a journal policy, we recommend authors comply with International Committee of Medical Journal Editors recommendations. | Not reported |
| Litaker 2003 | ||
| Title | Identify the study as an economic evaluation or use more specific terms such as “cost‐effectiveness analysis”, and describe the interventions compared. | front page |
| Abstract | Provide a structured summary of objectives, perspective, setting, methods (including study design and inputs), results (including base case and uncertainty analyses), and conclusions. | Not reported |
| Introduction | ||
| Background and objectives | Provide an explicit statement of the broader context for the study. | 224 |
| Present the study question and its relevance for health policy or practice decisions. | 224 | |
| Methods | ||
| Target population and subgroups | Describe characteristics of the base case population and subgroups analysed, including why they were chosen. | 225 |
| Setting and location | State relevant aspects of the system(s) in which the decision(s) need(s) to be made. | 225 |
| Study perspective | Describe the perspective of the study and relate this to the costs being evaluated. | Not reported |
| Comparators | Describe the interventions or strategies being compared and state why they were chosen. | 226 |
| Time horizon | State the time horizon(s) over which costs and consequences are being evaluated and say why appropriate. | Not reported |
| Discount rate | Report the choice of discount rate(s) used for costs and outcomes and say why appropriate. | Not reported |
| Choice of health outcomes | Describe what outcomes were used as the measure(s) of benefit in the evaluation and their relevance for the type of analysis performed. | Not reported |
| Measurement of effectiveness | Single study‐based estimates: Describe fully the design features of the single effectiveness study and why the single study was a sufficient source of clinical effectiveness data. | Not reported |
| Synthesis‐based estimates: Describe fully the methods used for identification of included studies and synthesis of clinical effectiveness data. | Not reported | |
| Measurement and valuation of preference based outcomes | If applicable, describe the population and methods used to elicit preferences for outcomes. | 226 |
| Estimating resources and costs | Single study‐based economic evaluation: Describe approaches used to estimate resource use associated with the alternative interventions. Describe primary or secondary research methods for valuing each resource item in terms of its unit cost. Describe any adjustments made to approximate to opportunity costs. | Not reported |
| Currency, price date, and conversion | Report the dates of the estimated resource quantities and unit costs. Describe methods for adjusting estimated unit costs to the year of reported costs if necessary. Describe methods for converting costs into a common currency base and the exchange rate. | Not reported |
| Choice of model | Describe and give reasons for the specific type of decision‐analytical model used. Providing a figure to show model structure is strongly recommended. | Not applicable |
| Assumptions | Describe all structural or other assumptions underpinning the decision‐analytical model. | Not applicable |
| Analytical methods | Describe all analytical methods supporting the evaluation. This could include methods for dealing with skewed, missing, or censored data; extrapolation methods; methods for pooling data; approaches to validate or make adjustments (such as half cycle corrections) to a model; and methods for handling population heterogeneity and uncertainty. | Not applicable |
| Results | ||
| Study parameters | Report the values, ranges, references, and, if used, probability distributions for all parameters. Report reasons or sources for distributions used to represent uncertainty where appropriate. Providing a table to show the input values is strongly recommended. | Not reported |
| Incremental costs and outcomes | For each intervention, report mean values for the main categories of estimated costs and outcomes of interest, as well as mean differences between the comparator groups. If applicable, report incremental cost‐effectiveness ratios. | Not reported |
| Characterising uncertainty | Single study‐based economic evaluation: Describe the effects of sampling uncertainty for the estimated incremental cost and incremental effectiveness parameters, together with the impact of methodological assumptions (such as discount rate, study perspective). | Not reported |
| Model‐based economic evaluation: Describe the effects on the results of uncertainty for all input parameters, and uncertainty related to the structure of the model and assumptions. | Not applicable | |
| Characterising heterogeneity | If applicable, report differences in costs, outcomes, or cost‐effectiveness that can be explained by variations between subgroups of patients with different baseline characteristics or other observed variability in effects that are not reducible by more information. | 232 |
| Discussion | ||
| Study findings, limitations, generalisability, and current knowledge | Summarise key study findings and describe how they support the conclusions reached. Discuss limitations and the generalisability of the findings and how the findings fit with current knowledge. | 234 |
| Other | ||
| Source of funding | Describe how the study was funded and the role of the funder in the identification, design, conduct, and reporting of the analysis. Describe other non‐monetary sources of support. | 235 |
| Conflicts of interest | Describe any potential for conflict of interest of study contributors in accordance with journal policy. In the absence of a journal policy, we recommend authors comply with International Committee of Medical Journal Editors recommendations. | Not reported |
| McCall 2011 | ||
| Title | Identify the study as an economic evaluation or use more specific terms such as “cost‐effectiveness analysis”, and describe the interventions compared. | Not reported |
| Abstract | Provide a structured summary of objectives, perspective, setting, methods (including study design and inputs), results (including base case and uncertainty analyses), and conclusions. | Not reported |
| Introduction | ||
| Background and objectives | Provide an explicit statement of the broader context for the study. | 1705 |
| Present the study question and its relevance for health policy or practice decisions. | 1706 | |
| Methods | ||
| Target population and subgroups | Describe characteristics of the base case population and subgroups analysed, including why they were chosen. | 1708 |
| Setting and location | State relevant aspects of the system(s) in which the decision(s) need(s) to be made. | 1705 |
| Study perspective | Describe the perspective of the study and relate this to the costs being evaluated. | Not reported |
| Comparators | Describe the interventions or strategies being compared and state why they were chosen. | Not reported |
| Time horizon | State the time horizon(s) over which costs and consequences are being evaluated and say why appropriate. | Not reported |
| Discount rate | Report the choice of discount rate(s) used for costs and outcomes and say why appropriate. | Not reported |
| Choice of health outcomes | Describe what outcomes were used as the measure(s) of benefit in the evaluation and their relevance for the type of analysis performed. | Not reported |
| Measurement of effectiveness | Single study‐based estimates: Describe fully the design features of the single effectiveness study and why the single study was a sufficient source of clinical effectiveness data. | Not reported |
| Synthesis‐based estimates: Describe fully the methods used for identification of included studies and synthesis of clinical effectiveness data. | Not applicable | |
| Measurement and valuation of preference based outcomes | If applicable, describe the population and methods used to elicit preferences for outcomes. | Not applicable |
| Estimating resources and costs | Single study‐based economic evaluation: Describe approaches used to estimate resource use associated with the alternative interventions. Describe primary or secondary research methods for valuing each resource item in terms of its unit cost. Describe any adjustments made to approximate to opportunity costs. | Not reported |
| Currency, price date, and conversion | Report the dates of the estimated resource quantities and unit costs. Describe methods for adjusting estimated unit costs to the year of reported costs if necessary. Describe methods for converting costs into a common currency base and the exchange rate. | Not reported |
| Choice of model | Describe and give reasons for the specific type of decision‐analytical model used. Providing a figure to show model structure is strongly recommended. | Not applicable |
| Assumptions | Describe all structural or other assumptions underpinning the decision‐analytical model. | Not applicable |
| Analytical methods | Describe all analytical methods supporting the evaluation. This could include methods for dealing with skewed, missing, or censored data; extrapolation methods; methods for pooling data; approaches to validate or make adjustments (such as half cycle corrections) to a model; and methods for handling population heterogeneity and uncertainty. | Not applicable |
| Results | ||
| Study parameters | Report the values, ranges, references, and, if used, probability distributions for all parameters. Report reasons or sources for distributions used to represent uncertainty where appropriate. Providing a table to show the input values is strongly recommended. | Not reported |
| Incremental costs and outcomes | For each intervention, report mean values for the main categories of estimated costs and outcomes of interest, as well as mean differences between the comparator groups. If applicable, report incremental cost‐effectiveness ratios. | Not reported |
| Characterising uncertainty | Single study‐based economic evaluation: Describe the effects of sampling uncertainty for the estimated incremental cost and incremental effectiveness parameters, together with the impact of methodological assumptions (such as discount rate, study perspective). | Not reported |
| Model‐based economic evaluation: Describe the effects on the results of uncertainty for all input parameters, and uncertainty related to the structure of the model and assumptions | Not applicable | |
| Characterising heterogeneity | If applicable, report differences in costs, outcomes, or cost‐effectiveness that can be explained by variations between subgroups of patients with different baseline characteristics or other observed variability in effects that are not reducible by more information. | Not applicable |
| Discussion | ||
| Study findings, limitations, generalisability, and current knowledge | Summarise key study findings and describe how they support the conclusions reached. Discuss limitations and the generalisability of the findings and how the findings fit with current knowledge. | 1712 |
| Other | ||
| Source of funding | Describe how the study was funded and the role of the funder in the identification, design, conduct, and reporting of the analysis. Describe other non‐monetary sources of support. | Not reported |
| Conflicts of interest | Describe any potential for conflict of interest of study contributors in accordance with journal policy. In the absence of a journal policy, we recommend authors comply with International Committee of Medical Journal Editors recommendations. | Not reported |
| Piette 2001 | ||
| Title | Identify the study as an economic evaluation or use more specific terms such as “cost‐effectiveness analysis”, and describe the interventions compared. | Not reported |
| Abstract | Provide a structured summary of objectives, perspective, setting, methods (including study design and inputs), results (including base case and uncertainty analyses), and conclusions. | Not reported |
| Introduction | ||
| Background and objectives | Provide an explicit statement of the broader context for the study. | 202 ‐ 203 |
| Present the study question and its relevance for health policy or practice decisions. | Not reported | |
| Methods | ||
| Target population and subgroups | Describe characteristics of the base case population and subgroups analysed, including why they were chosen. | 204 |
| Setting and location | State relevant aspects of the system(s) in which the decision(s) need(s) to be made. | 203 |
| Study perspective | Describe the perspective of the study and relate this to the costs being evaluated. | Not reported |
| Comparators | Describe the interventions or strategies being compared and state why they were chosen. | 177 |
| Time horizon | State the time horizon(s) over which costs and consequences are being evaluated and say why appropriate. | Not reported |
| Discount rate | Report the choice of discount rate(s) used for costs and outcomes and say why appropriate. | Not reported |
| Choice of health outcomes | Describe what outcomes were used as the measure(s) of benefit in the evaluation and their relevance for the type of analysis performed. | Not reported |
| Measurement of effectiveness | Single study‐based estimates: Describe fully the design features of the single effectiveness study and why the single study was a sufficient source of clinical effectiveness data. | Not reported |
| Synthesis‐based estimates: Describe fully the methods used for identification of included studies and synthesis of clinical effectiveness data. | Not applicable | |
| Measurement and valuation of preference based outcomes | If applicable, describe the population and methods used to elicit preferences for outcomes. | Not applicable |
| Estimating resources and costs | Single study‐based economic evaluation: Describe approaches used to estimate resource use associated with the alternative interventions. Describe primary or secondary research methods for valuing each resource item in terms of its unit cost. Describe any adjustments made to approximate to opportunity costs. | Not reported |
| Currency, price date, and conversion | Report the dates of the estimated resource quantities and unit costs. Describe methods for adjusting estimated unit costs to the year of reported costs if necessary. Describe methods for converting costs into a common currency base and the exchange rate. | Not reported |
| Choice of model | Describe and give reasons for the specific type of decision‐analytical model used. Providing a figure to show model structure is strongly recommended. | Not applicable |
| Assumptions | Describe all structural or other assumptions underpinning the decision‐analytical model. | Not applicable |
| Analytical methods | Describe all analytical methods supporting the evaluation. This could include methods for dealing with skewed, missing, or censored data; extrapolation methods; methods for pooling data; approaches to validate or make adjustments (such as half cycle corrections) to a model; and methods for handling population heterogeneity and uncertainty. | Not applicable |
| Results | ||
| Study parameters | Report the values, ranges, references, and, if used, probability distributions for all parameters. Report reasons or sources for distributions used to represent uncertainty where appropriate. Providing a table to show the input values is strongly recommended. | Not reported |
| Incremental costs and outcomes | For each intervention, report mean values for the main categories of estimated costs and outcomes of interest, as well as mean differences between the comparator groups. If applicable, report incremental cost‐effectiveness ratios. | Not reported |
| Characterising uncertainty | Single study‐based economic evaluation: Describe the effects of sampling uncertainty for the estimated incremental cost and incremental effectiveness parameters, together with the impact of methodological assumptions (such as discount rate, study perspective). | Not reported |
| Model‐based economic evaluation: Describe the effects on the results of uncertainty for all input parameters, and uncertainty related to the structure of the model and assumptions. | Not applicable | |
| Characterising heterogeneity | If applicable, report differences in costs, outcomes, or cost‐effectiveness that can be explained by variations between subgroups of patients with different baseline characteristics or other observed variability in effects that are not reducible by more information. | Not reported |
| Discussion | ||
| Study findings, limitations, generalisability, and current knowledge | Summarise key study findings and describe how they support the conclusions reached. Discuss limitations and the generalisability of the findings and how the findings fit with current knowledge. | 207 |
| Other | ||
| Source of funding | Describe how the study was funded and the role of the funder in the identification, design, conduct, and reporting of the analysis. Describe other non‐monetary sources of support. | 207 |
| Conflicts of interest | Describe any potential for conflict of interest of study contributors in accordance with journal policy. In the absence of a journal policy, we recommend authors comply with International Committee of Medical Journal Editors recommendations. | Not reported |
| Pizzi 2015 | ||
| Title | Identify the study as an economic evaluation or use more specific terms such as “cost‐effectiveness analysis”, and describe the interventions compared. | front page |
| Abstract | Provide a structured summary of objectives, perspective, setting, methods (including study design and inputs), results (including base case and uncertainty analyses), and conclusions. | front page |
| Introduction | ||
| Background and objectives | Provide an explicit statement of the broader context for the study. | 254 |
| Present the study question and its relevance for health policy or practice decisions. | 254 | |
| Methods | ||
| Target population and subgroups | Describe characteristics of the base case population and subgroups analysed, including why they were chosen. | 254 |
| Setting and location | State relevant aspects of the system(s) in which the decision(s) need(s) to be made. | 254 |
| Study perspective | Describe the perspective of the study and relate this to the costs being evaluated. | 255 |
| Comparators | Describe the interventions or strategies being compared and state why they were chosen. | 254 |
| Time horizon | State the time horizon(s) over which costs and consequences are being evaluated and say why appropriate. | 256 |
| Discount rate | Report the choice of discount rate(s) used for costs and outcomes and say why appropriate. | 256 |
| Choice of health outcomes | Describe what outcomes were used as the measure(s) of benefit in the evaluation and their relevance for the type of analysis performed. | 255 |
| Measurement of effectiveness | Single study‐based estimates: Describe fully the design features of the single effectiveness study and why the single study was a sufficient source of clinical effectiveness data. | 254 ‐ 255 |
| Synthesis‐based estimates: Describe fully the methods used for identification of included studies and synthesis of clinical effectiveness data. | Not reported | |
| Measurement and valuation of preference based outcomes | If applicable, describe the population and methods used to elicit preferences for outcomes. | Not applicable |
| Estimating resources and costs | Single study‐based economic evaluation: Describe approaches used to estimate resource use associated with the alternative interventions. Describe primary or secondary research methods for valuing each resource item in terms of its unit cost. Describe any adjustments made to approximate to opportunity costs. | 256 |
| Currency, price date, and conversion | Report the dates of the estimated resource quantities and unit costs. Describe methods for adjusting estimated unit costs to the year of reported costs if necessary. Describe methods for converting costs into a common currency base and the exchange rate. | 256 |
| Choice of model | Describe and give reasons for the specific type of decision‐analytical model used. Providing a figure to show model structure is strongly recommended. | 256 |
| Assumptions | Describe all structural or other assumptions underpinning the decision‐analytical model. | 256 ‐ 257 |
| Analytical methods | Describe all analytical methods supporting the evaluation. This could include methods for dealing with skewed, missing, or censored data; extrapolation methods; methods for pooling data; approaches to validate or make adjustments (such as half cycle corrections) to a model; and methods for handling population heterogeneity and uncertainty. | 256 |
| Results | ||
| Study parameters | Report the values, ranges, references, and, if used, probability distributions for all parameters. Report reasons or sources for distributions used to represent uncertainty where appropriate. Providing a table to show the input values is strongly recommended. | 258 ‐ 259 |
| Incremental costs and outcomes | For each intervention, report mean values for the main categories of estimated costs and outcomes of interest, as well as mean differences between the comparator groups. If applicable, report incremental cost‐effectiveness ratios. | 260 |
| Characterising uncertainty | Single study‐based economic evaluation: Describe the effects of sampling uncertainty for the estimated incremental cost and incremental effectiveness parameters, together with the impact of methodological assumptions (such as discount rate, study perspective). | 258 ‐ 260 |
| Model‐based economic evaluation: Describe the effects on the results of uncertainty for all input parameters, and uncertainty related to the structure of the model and assumptions. | Not reported | |
| Characterising heterogeneity | If applicable, report differences in costs, outcomes, or cost‐effectiveness that can be explained by variations between subgroups of patients with different baseline characteristics or other observed variability in effects that are not reducible by more information. | 258 ‐ 260 |
| Discussion | ||
| Study findings, limitations, generalisability, and current knowledge | Summarise key study findings and describe how they support the conclusions reached. Discuss limitations and the generalisability of the findings and how the findings fit with current knowledge. | 261 ‐ 262 |
| Other | ||
| Source of funding | Describe how the study was funded and the role of the funder in the identification, design, conduct, and reporting of the analysis. Describe other non‐monetary sources of support. | 263 |
| Conflicts of interest | Describe any potential for conflict of interest of study contributors in accordance with journal policy. In the absence of a journal policy, we recommend authors comply with International Committee of Medical Journal Editors recommendations. | 263 |
| Prezio 2014 | ||
| Title | Identify the study as an economic evaluation or use more specific terms such as “cost‐effectiveness analysis”, and describe the interventions compared. | 771 |
| Abstract | Provide a structured summary of objectives, perspective, setting, methods (including study design and inputs), results (including base case and uncertainty analyses), and conclusions. | 771 |
| Introduction | ||
| Background and objectives | Provide an explicit statement of the broader context for the study. | 772 |
| Present the study question and its relevance for health policy or practice decisions. | 772 | |
| Methods | ||
| Target population and subgroups | Describe characteristics of the base case population and subgroups analysed, including why they were chosen. | 772 |
| Setting and location | State relevant aspects of the system(s) in which the decision(s) need(s) to be made. | 772 |
| Study perspective | Describe the perspective of the study and relate this to the costs being evaluated. | 772 |
| Comparators | Describe the interventions or strategies being compared and state why they were chosen. | 772 |
| Time horizon | State the time horizon(s) over which costs and consequences are being evaluated and say why appropriate. | 772 |
| Discount rate | Report the choice of discount rate(s) used for costs and outcomes and say why appropriate. | 772 |
| Choice of health outcomes | Describe what outcomes were used as the measure(s) of benefit in the evaluation and their relevance for the type of analysis performed. | 774 |
| Measurement of effectiveness | Single study‐based estimates: Describe fully the design features of the single effectiveness study and why the single study was a sufficient source of clinical effectiveness data. | 772 |
| Synthesis‐based estimates: Describe fully the methods used for identification of included studies and synthesis of clinical effectiveness data. | Not reported | |
| Measurement and valuation of preference based outcomes | If applicable, describe the population and methods used to elicit preferences for outcomes. | Not applicable |
| Estimating resources and costs | Single study‐based economic evaluation: Describe approaches used to estimate resource use associated with the alternative interventions. Describe primary or secondary research methods for valuing each resource item in terms of its unit cost. Describe any adjustments made to approximate to opportunity costs. | 772 |
| Currency, price date, and conversion | Report the dates of the estimated resource quantities and unit costs. Describe methods for adjusting estimated unit costs to the year of reported costs if necessary. Describe methods for converting costs into a common currency base and the exchange rate. | 772 |
| Choice of model | Describe and give reasons for the specific type of decision‐analytical model used. Providing a figure to show model structure is strongly recommended. | 772 |
| Assumptions | Describe all structural or other assumptions underpinning the decision‐analytical model. | 772 ‐ 774 |
| Analytical methods | Describe all analytical methods supporting the evaluation. This could include methods for dealing with skewed, missing, or censored data; extrapolation methods; methods for pooling data; approaches to validate or make adjustments (such as half cycle corrections) to a model; and methods for handling population heterogeneity and uncertainty. | 774 |
| Results | ||
| Study parameters | Report the values, ranges, references, and, if used, probability distributions for all parameters. Report reasons or sources for distributions used to represent uncertainty where appropriate. Providing a table to show the input values is strongly recommended. | 774 ‐ 776 |
| Incremental costs and outcomes | For each intervention, report mean values for the main categories of estimated costs and outcomes of interest, as well as mean differences between the comparator groups. If applicable, report incremental cost‐effectiveness ratios. | 777 |
| Characterising uncertainty | Single study‐based economic evaluation: Describe the effects of sampling uncertainty for the estimated incremental cost and incremental effectiveness parameters, together with the impact of methodological assumptions (such as discount rate, study perspective). | 776 ‐ 777 |
| Model‐based economic evaluation: Describe the effects on the results of uncertainty for all input parameters, and uncertainty related to the structure of the model and assumptions. | Not applicable | |
| Characterising heterogeneity | If applicable, report differences in costs, outcomes, or cost‐effectiveness that can be explained by variations between subgroups of patients with different baseline characteristics or other observed variability in effects that are not reducible by more information. | 777 |
| Discussion | ||
| Study findings, limitations, generalisability, and current knowledge | Summarise key study findings and describe how they support the conclusions reached. Discuss limitations and the generalisability of the findings and how the findings fit with current knowledge. | 775 |
| Other | ||
| Source of funding | Describe how the study was funded and the role of the funder in the identification, design, conduct, and reporting of the analysis. Describe other non‐monetary sources of support. | 778 |
| Conflicts of interest | Describe any potential for conflict of interest of study contributors in accordance with journal policy. In the absence of a journal policy, we recommend authors comply with International Committee of Medical Journal Editors recommendations. | 778 |
| Schechter 2008 | ||
| Title | Identify the study as an economic evaluation or use more specific terms such as “cost‐effectiveness analysis”, and describe the interventions compared. | 763 |
| Abstract | Provide a structured summary of objectives, perspective, setting, methods (including study design and inputs), results (including base case and uncertainty analyses), and conclusions. | 763 |
| Introduction | ||
| Background and objectives | Provide an explicit statement of the broader context for the study. | 763 ‐ 764 |
| Present the study question and its relevance for health policy or practice decisions. | 764 | |
| Methods | ||
| Target population and subgroups | Describe characteristics of the base case population and subgroups analysed, including why they were chosen. | 764 |
| Setting and location | State relevant aspects of the system(s) in which the decision(s) need(s) to be made. | 764 |
| Study perspective | Describe the perspective of the study and relate this to the costs being evaluated. | 764 |
| Comparators | Describe the interventions or strategies being compared and state why they were chosen. | 764 |
| Time horizon | State the time horizon(s) over which costs and consequences are being evaluated and say why appropriate. | 764 |
| Discount rate | Report the choice of discount rate(s) used for costs and outcomes and say why appropriate. | 765 |
| Choice of health outcomes | Describe what outcomes were used as the measure(s) of benefit in the evaluation and their relevance for the type of analysis performed. | 764 |
| Measurement of effectiveness | Single study‐based estimates: Describe fully the design features of the single effectiveness study and why the single study was a sufficient source of clinical effectiveness data. | 764 |
| Synthesis‐based estimates: Describe fully the methods used for identification of included studies and synthesis of clinical effectiveness data. | Not applicable | |
| Measurement and valuation of preference based outcomes | If applicable, describe the population and methods used to elicit preferences for outcomes. | 765 |
| Estimating resources and costs | Single study‐based economic evaluation: Describe approaches used to estimate resource use associated with the alternative interventions. Describe primary or secondary research methods for valuing each resource item in terms of its unit cost. Describe any adjustments made to approximate to opportunity costs. | 764 |
| Currency, price date, and conversion | Report the dates of the estimated resource quantities and unit costs. Describe methods for adjusting estimated unit costs to the year of reported costs if necessary. Describe methods for converting costs into a common currency base and the exchange rate. | 764 |
| Choice of model | Describe and give reasons for the specific type of decision‐analytical model used. Providing a figure to show model structure is strongly recommended. | Not applicable |
| Assumptions | Describe all structural or other assumptions underpinning the decision‐analytical model. | Not applicable |
| Analytical methods | Describe all analytical methods supporting the evaluation. This could include methods for dealing with skewed, missing, or censored data; extrapolation methods; methods for pooling data; approaches to validate or make adjustments (such as half cycle corrections) to a model; and methods for handling population heterogeneity and uncertainty. | 765 |
| Results | ||
| Study parameters | Report the values, ranges, references, and, if used, probability distributions for all parameters. Report reasons or sources for distributions used to represent uncertainty where appropriate. Providing a table to show the input values is strongly recommended. | 766 |
| Incremental costs and outcomes | For each intervention, report mean values for the main categories of estimated costs and outcomes of interest, as well as mean differences between the comparator groups. If applicable, report incremental cost‐effectiveness ratios. | 765 |
| Characterising uncertainty | Single study‐based economic evaluation: Describe the effects of sampling uncertainty for the estimated incremental cost and incremental effectiveness parameters, together with the impact of methodological assumptions (such as discount rate, study perspective) | 766 |
| Model‐based economic evaluation: Describe the effects on the results of uncertainty for all input parameters, and uncertainty related to the structure of the model and assumptions. | Not applicable | |
| Characterising heterogeneity | If applicable, report differences in costs, outcomes, or cost‐effectiveness that can be explained by variations between subgroups of patients with different baseline characteristics or other observed variability in effects that are not reducible by more information. | 765 |
| Discussion | ||
| Study findings, limitations, generalisability, and current knowledge | Summarise key study findings and describe how they support the conclusions reached. Discuss limitations and the generalisability of the findings and how the findings fit with current knowledge. | 767 |
| Other | ||
| Source of funding | Describe how the study was funded and the role of the funder in the identification, design, conduct, and reporting of the analysis. Describe other non‐monetary sources of support. | 767 |
| Conflicts of interest | Describe any potential for conflict of interest of study contributors in accordance with journal policy. In the absence of a journal policy, we recommend authors comply with International Committee of Medical Journal Editors recommendations. | 768 |
| Wagner 2001 | ||
| Title | Identify the study as an economic evaluation or use more specific terms such as “cost‐effectiveness analysis”, and describe the interventions compared. | Not reported |
| Abstract | Provide a structured summary of objectives, perspective, setting, methods (including study design and inputs), results (including base case and uncertainty analyses), and conclusions. | Not reported |
| Introduction | ||
| Background and objectives | Provide an explicit statement of the broader context for the study. | 695 |
| Present the study question and its relevance for health policy or practice decisions. | 695 | |
| Methods | ||
| Target population and subgroups | Describe characteristics of the base case population and subgroups analysed, including why they were chosen. | 697 |
| Setting and location | State relevant aspects of the system(s) in which the decision(s) need(s) to be made. | 695 ‐ 696 |
| Study perspective | Describe the perspective of the study and relate this to the costs being evaluated. | Not reported |
| Comparators | Describe the interventions or strategies being compared and state why they were chosen. | Not reported |
| Time horizon | State the time horizon(s) over which costs and consequences are being evaluated and say why appropriate. | Not reported |
| Discount rate | Report the choice of discount rate(s) used for costs and outcomes and say why appropriate. | Not reported |
| Choice of health outcomes | Describe what outcomes were used as the measure(s) of benefit in the evaluation and their relevance for the type of analysis performed. | Not reported |
| Measurement of effectiveness | Single study‐based estimates: Describe fully the design features of the single effectiveness study and why the single study was a sufficient source of clinical effectiveness data. | Not reported |
| Synthesis‐based estimates: Describe fully the methods used for identification of included studies and synthesis of clinical effectiveness data. | Not applicable | |
| Measurement and valuation of preference based outcomes | If applicable, describe the population and methods used to elicit preferences for outcomes. | Not applicable |
| Estimating resources and costs | Single study‐based economic evaluation: Describe approaches used to estimate resource use associated with the alternative interventions. Describe primary or secondary research methods for valuing each resource item in terms of its unit cost. Describe any adjustments made to approximate to opportunity costs. | Not reported |
| Currency, price date, and conversion | Report the dates of the estimated resource quantities and unit costs. Describe methods for adjusting estimated unit costs to the year of reported costs if necessary. Describe methods for converting costs into a common currency base and the exchange rate. | Not reported |
| Choice of model | Describe and give reasons for the specific type of decision‐analytical model used. Providing a figure to show model structure is strongly recommended. | Not applicable |
| Assumptions | Describe all structural or other assumptions underpinning the decision‐analytical model. | Not applicable |
| Analytical methods | Describe all analytical methods supporting the evaluation. This could include methods for dealing with skewed, missing, or censored data; extrapolation methods; methods for pooling data; approaches to validate or make adjustments (such as half cycle corrections) to a model; and methods for handling population heterogeneity and uncertainty. | Not reported |
| Results | ||
| Study parameters | Report the values, ranges, references, and, if used, probability distributions for all parameters. Report reasons or sources for distributions used to represent uncertainty where appropriate. Providing a table to show the input values is strongly recommended. | 697 ‐ 698 |
| Incremental costs and outcomes | For each intervention, report mean values for the main categories of estimated costs and outcomes of interest, as well as mean differences between the comparator groups. If applicable, report incremental cost‐effectiveness ratios. | Not reported |
| Characterising uncertainty | Single study‐based economic evaluation: Describe the effects of sampling uncertainty for the estimated incremental cost and incremental effectiveness parameters, together with the impact of methodological assumptions (such as discount rate, study perspective). | Not reported |
| Model‐based economic evaluation: Describe the effects on the results of uncertainty for all input parameters, and uncertainty related to the structure of the model and assumptions | Not reported | |
| Characterising heterogeneity | If applicable, report differences in costs, outcomes, or cost‐effectiveness that can be explained by variations between subgroups of patients with different baseline characteristics or other observed variability in effects that are not reducible by more information. | Not reported |
| Discussion | ||
| Study findings, limitations, generalisability, and current knowledge | Summarise key study findings and describe how they support the conclusions reached. Discuss limitations and the generalisability of the findings and how the findings fit with current knowledge. | 698 ‐ 699 |
| Other | ||
| Source of funding | Describe how the study was funded and the role of the funder in the identification, design, conduct, and reporting of the analysis. Describe other non‐monetary sources of support. | 699 |
| Conflicts of interest | Describe any potential for conflict of interest of study contributors in accordance with journal policy. In the absence of a journal policy, we recommend authors comply with International Committee of Medical Journal Editors recommendations. | Not reported |
Allocation
Thirty‐three studies (50%) reported using appropriate methods for random sequence allocation. Two studies (Gabbay 2006; McDermott 2001) described a non‐random component in the sequence generation process and we judged them to be at a high risk of bias for this domain. The rest of the studies provided insufficient information about the sequence‐generation process to judge risk of bias. We rated allocation concealment as adequate in 39 studies (59%), either because the unit of allocation was by institution, team or professional and allocation was performed on all units at the start of the study, or a suitable method was used to conceal allocation.
Blinding
We rated four studies at a high risk of bias; Adair 2013, where retinopathy screening data were extracted from patient records by unmasked extractors, whose knowledge of allocation could have influenced outcome; Franco 2007, in which the general practitioners (GPs) in the intervention group provided the data on retinopathy screening; in Sonnichsen 2010, where masking was not possible and knowledge of being in the intervention or control group may have influenced the outcome; and Ward 1996, where one of the outcome assessors was the research nurse who conducted the interviews to obtain the outcome data in one arm of the trial, and was therefore unmasked.
Incomplete outcome data
We judged 15 studies (22.7%) to be at a high risk of attrition bias, with attrition of 20% or more (Dijkstra 2005; Franco 2007; Gabbay 2013; Harris 2005; Hermans 2013; Ilag 2003; Jacobs 2012; Jansink 2013; Kirwin 2010; Maljanian 2005; O'Connor 2005; Perria 2007; Sonnichsen 2010; Varney 2014; Wagner 2001).The remaining studies were either at low (N = 40) or unclear (N = 11) risk of bias for this domain.
Selective reporting
It was possible to judge if a study was free from selective outcome reporting in only 17 of the included studies (25.8%), as the outcomes were consistent with a prospectively‐published clinical trials registry entry or trial protocol. We were unable to assess selective reporting in the remainder, due to the lack of a study protocol or trial register entry, or in the case of studies where trial registration was performed retrospectively.
Other potential sources of bias
In five studies (7.6%) there was a baseline imbalance in DRS attendance of 10% or more between intervention and control groups, and in seven studies (10.6%) it was not possible to control for the possibility that the control group received the intervention.
Effects of interventions
See: Summary of findings for the main comparison Any quality improvement intervention compared to usual care for diabetic retinopathy screening; Summary of findings 2 Stepped quality improvement intervention compared to intervention alone for diabetic retinopathy screening
For details of the GRADE assessments, see summary of findings Table for the main comparison and summary of findings Table 2.
Primary outcome
See summary of findings Table for the main comparison and summary of findings Table 2.
One or more visits for diabetic retinopathy screening within a two‐year period following implementation of the intervention
All 66 trials provided data for this outcome. These consisted of two types of comparison: 56 of the 66 studies (85%) compared an intervention against “current usual care”, and 10 (15%) compared a more intensive QI intervention or group of QI interventions against a less intensive intervention. Since these were addressing different questions, we conducted separate meta‐analyses on the 56 and the 10 studies.
Thirty‐one of the 66 trials (47%) were cluster‐RCTs. Only nine of these reported an ICC and the ICC reported typically did not relate specifically to DRS outcomes. Of the nine reporting an ICC, the most commonly reported value was 0.05, and so this was the value we imputed for studies with no estimates of ICCs. The smallest value reported was 0.01 and the largest value was 0.2. We ran a sensitivity analysis to investigate the impact on the computed effect estimates of using the lower and upper range values (see table below).
| ICC | 0.05 | 0.01 | 0.2 | ||||||
| Model | RD | LCL | UCL | RD | LCL | UCL | RD | LCL | UCL |
| DRS | 0.17 | 0.11 | 0.22 | 0.17 | 0.11 | 0.22 | 0.17 | 0.11 | 0.22 |
| General | 0.12 | 0.09 | 0.15 | 0.12 | 0.09 | 0.16 | 0.11 | 0.08 | 0.15 |
| Combined | 0.12 | 0.10 | 0.14 | 0.13 | 0.11 | 0.15 | 0.12 | 0.10 | 0.14 |
Abbreviations: RD: risk difference; LCL: lower limit; UCL: upper limit
Comparison 1: Any QI intervention versus usual care
Of the 56 studies which compared any intervention against usual care, 13 (23%) evaluated interventions specifically targeting DRS. The remaining 43 (77%) evaluated interventions directed towards improving the general quality of diabetes care (including DRS attendance). Although there was substantial heterogeneity in intervention effects (I2 = 93%), 48 out of the 56 studies showed an improvement in DRS attendance. Since it may be argued that it is better to examine clinical differences in a meta‐analysis rather than to use them as a reason for not conducting one, we computed pooled estimates for each of these subgroups. We adopted a random‐effects model, which can accommodate statistical heterogeneity between studies by assuming that different studies have different true effect sizes, but we acknowledge that use of the random‐effects model does not in it itself deal with heterogeneity. We assessed whether there was evidence of a subgroup effect and, since there was not (P = 0.15), we conducted all subsequent statistical analyses on the 56 studies. Overall, DRS attendance increased by 12% (risk difference (RD) 0.12, 95% confidence interval (CI) 0.10 to 0.14; low‐certainty evidence) compared with usual care (Analysis 1.1Figure 7).

Forest plot of comparison: 1 Any quality improvement intervention compared to usual care, outcome: 1.1 Proportion of participants attending screening.
There was some evidence of funnel plot asymmetry (Figure 8). Terrin 2003 has suggested, however, that the funnel plot may be inappropriate for heterogeneous meta‐analyses, so we did not downgrade our findings because of this.

Funnel plot of comparison: 1 Any quality improvement intervention compared to usual care, outcome: 1.1 Proportion of patients attending screening.
Comparison 2: More intensive (stepped) intervention versus less intensive intervention
Examples of studies in this comparison included: a tailored (individualised) versus a generic patient education newsletter; a comparison of audit and feedback to the healthcare professional compared to audit and feedback combined with a diabetes team outreach service. Ten studies contributed to this analysis (Analysis 2.1; Figure 9). Three (30%) evaluated interventions specifically targeting DRS, while seven (70%) evaluated interventions directed towards improving the general quality of diabetes care. In these studies DRS attendance increased by 5% (RD 0.05, 95% CI 0.02 to 0.09; moderate‐certainty evidence) (Analysis 2.1).

Forest plot of comparison: 2 Stepped quality improvement intervention compared to intervention alone (control), outcome: 2.1 Proportion of participants attending screening.
Secondary outcomes
Ongoing adherence to DRS based on attendance for screening following the initial screening post‐intervention
It was not possible to extract data on ongoing adherence to DRS (based on attendance for screening following the initial screening post‐intervention), since either it was not possible to identify unique screening episodes from pooled data reported at two time points, or in one study due to the intervention being offered to the comparator arm 18 months post‐randomisation (Mansberger 2015).
Economic outcomes
Resources (staff time, equipment, consumables) required to deliver interventions to increase attendance for DRS
We graded each intervention between one (least resource‐intensive) and five (most resource‐intensive), or as zero (unable to determine), with a record of how the review author graded each study also provided. We developed an algorithm to derive the ordered rank. This mapped resource components and their intensity to the ordered rank. We incorporated the following resource components into the algorithm: face‐to‐face minutes; telephone calls; patient home visits; printed materials/software; training.
We then used the resource components and their intensity levels to extract the resource use required to deliver the interventions in all included studies. Two review authors (JL and EGR) conducted this independently. The percentage of studies for each resource grouping for the 56 studies comparing any intervention with usual care was as follows: 1 = 48.2%; 2 = 10.7%; 3 = 8.9%; 4 = 19.6%; 5 = 12.6%.
Costs of staff used to provide interventions; costs of treatment and care; cost of primary care; lost wages and lost productivity (work output)
We converted all reported costs to the 2016 British pound, and summarise them for each study in Table 2. Only two studies (Eccles 2007; Prezio 2014) reported both the direct and indirect costs (productivity loss) of the interventions. In all other studies, the costs of the interventions reported covered just the direct costs of providing that intervention. Five studies (Adair 2013; Clancy 2007; Frijling 2002; Prezio 2014; Pizzi 2015) reported the total direct costs of the interventions, but the resources they considered relevant and how they combined them to estimate total cost varied between studies. We report components of the total cost for each intervention in Table 2.
The types of resources included in the cost calculations for each study varied; hence, it is difficult to compare directly across the studies. The estimated training cost differed between the few studies that reported this information. In terms of the costs of treatment and care of diabetes, there was no obvious difference in the healthcare costs between the interventions and comparators in the studies that reported these data, primarily reflecting an absence of evidence. Further details on resources and costs from each included studies can be found in Table 2.
Incremental cost‐effectiveness ratio (ICER)
Only three studies conducted in the USA (Davis 2010; Prezio 2014; Walker 2008) reported this outcome. Davis 2010 reported an incremental cost per QALY of GBP 13,154 over one year for a diabetes telecare intervention compared to no intervention. However, it is unclear what tool they used to estimate QALYs. Prezio 2014 used an established whole‐disease model, the Archimedes Model simulator, to estimate the incremental cost per QALY. Using a discount rate of 3% and programme effectiveness at 100%, the incremental cost per QALY was GBP 73,683 over five years, and GBP 261 over 20 years for the intervention (a culturally‐tailored diabetes education programme delivered by community health worker) compared with usual care. Prezio 2014 and Walker 2008 also reported an incremental cost‐effectiveness ratio. In this study, the unit of effectiveness was the number of diabetic fundus examinations gained, which was associated with the number of diabetic retinopathies diagnosed. The incremental cost per dilated fundus examination gained for telephone intervention compared to the mailed/printed intervention was GBP 333. Pizzi 2015 reported a cost‐effectiveness analysis with an incremental cost‐effectiveness ratio for the telephone intervention of GBP 18.77 per additional patient attending a dilated fundus examination, compared with usual care. We did not calculate the ratio for the mailed intervention because it was dominated by usual care.
Exploration of heterogeneity
We detected substantial heterogeneity (I2 > 90%), which we investigated by subgroup analysis and meta‐regression.
Subgroup analysis
Enough studies were available to investigate the effectiveness of nine out of the possible 12 QI components. Insufficient data were available to analyse ‘continuous quality improvement’, ‘financial incentives’ and 'facilitated relay' of information to clinicians. Interventions incorporating all nine QI components evaluated in the subgroup analysis were associated with improvements in DRS attendance, with higher pooled effect estimates for interventions directed at patients (promotion of self‐management and patient education) or the organisation of the health system (team changes or the establishment of an electronic patient registry) (Table 6). Sufficient studies were available to investigate the effectiveness of interventions containing particular BCTs (including 10 BCTs aimed at patients and seven aimed at healthcare professionals). Interventions incorporating all 17 BCTs included in the subgroup analysis were all shown to be effective in improving DRS attendance. For BCTs aimed at patients, we found higher pooled effect estimates for ‘goal setting (outcome)’ and ‘credible source’ and for healthcare professionals ‘restructuring the social environment’ and ‘credible source’ (Table 6). There were insufficient data to conduct the planned analysis on the variability of effect size according to population subgroups, and there were too few studies within each resource category to conduct a subgroup analysis of the relationship between effect size and resource intensity.
| Subgroup category | N studies | RD (95% CI) | I2 % |
| QI Strategy | |||
| Audit and feedback | 11 | 0.12 (0.06 to 0.18) | 89 |
| Case management | 18 | 0.14 (0.07 to 0.21) | 94 |
| Team changes | 19 | 0.20 (0.13 to 0.26) | 88 |
| Electronic patient registry | 10 | 0.18 (0.07 to 0.29) | 94 |
| Clinician education | 16 | 0.13 (0.07 to 0.19) | 95 |
| Clinician reminders | 10 | 0.13 (0.05 to 0.21) | 85 |
| Patient Education | 30 | 0.15 (0.13 to 0.18) | 95 |
| Promotion of self‐management | 21 | 0.19 (0.13 to 0.26) | 96 |
| Patient reminders | 16 | 0.11 (0.07 to 0.14) | 93 |
| BCT (patients) | |||
| Goal setting (Outcome) | 14 | 0.26 (0.16 to 0.36) | 93 |
| Feedback on outcomes of behaviour/biofeedback | 15 | 0.19 (0.13 to 0.25) | 80 |
| Credible source | 10 | 0.22 (0.06 to 0.38) | 95 |
| Prompts/cues | 25 | 0.11 (0.07 to 0.14) | 92 |
| Social support (unspecified) | 14 | 0.19 (0.09 to 0.28) | 93 |
| Problem solving | 10 | 0.17 (0.08 to 0.27) | 89 |
| Restructuring the social environment | 17 | 0.17 (0.10 to 0.24) | 85 |
| Instruction on how to perform behaviour | 34 | 0.13 (0.11 to 0.15) | 94 |
| Social support (practical) | 20 | 0.14 (0.09 to 0.20) | 90 |
| Information about health consequences | 19 | 0.12 (0.07 to 0.16) | 92 |
| BCT (healthcare professionals) | |||
| Restructuring the social environment | 23 | 0.19 (0.12 to 0.26) | 91 |
| Credible source | 13 | 0.16 (0.08 to 0.24) | 95 |
| Adding objects to the environment | 15 | 0.14 (0.07 to 0.20) | 88 |
| Social support (practical) | 10 | 0.13 (0.03 to 0.22) | 87 |
| Instruction on how to perform behaviour | 30 | 0.13 (0.08 to 0.17) | 93 |
| Prompts/cues | 15 | 0.12 (0.06 to 0.17) | 85 |
| Feedback on outcomes of behaviour/biofeedback | 17 | 0.11 (0.07 to 0.16) | 81 |
Metaregressions
Metaregression revealed some evidence of an association between effect size and baseline DRS attendance, with larger effects in studies with poorer screening attendance (Figure 10). The regression coefficient was ‐0.208 (‐0.419 to 0.004). The residual I2 was still very high at 94%. Because of regression to the mean, this association might be spurious, so we conducted a permutation test to allow for this (with 1000 permutations, P = 0.055). A comparison between the effect sizes from studies at high risk of bias (defined for this purpose as high risk of bias in one or more domains) was slightly (but not statistically‐significantly) higher than those at low risk of bias (regression coefficient 0.008 (‐0.136 to 0.094)). Similarly, we found no association between study design (individual or cluster‐RCT) and effect size (regression coefficient ‐ 0.049 (‐0.136 to 0.039), P = 0.268), nor between resource intensity and effect size (regression coefficient 0.013 (‐0.015 0.042), P = 0.356).
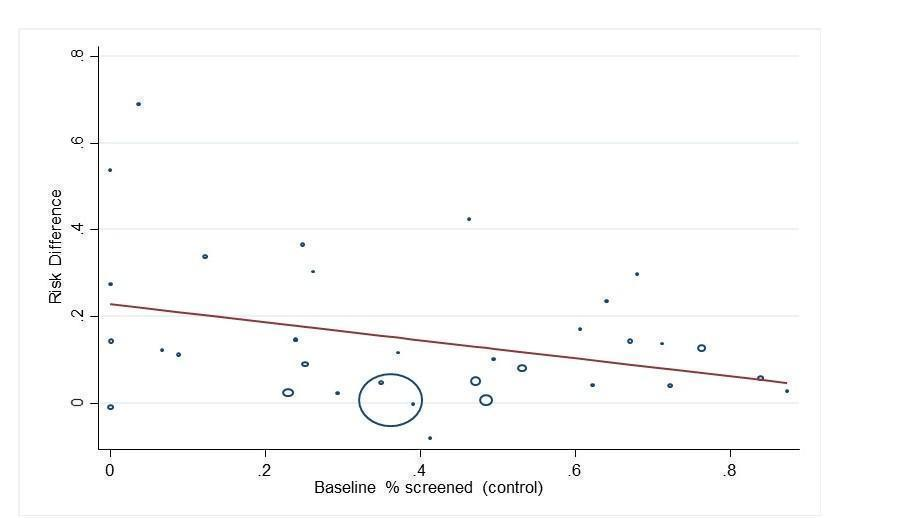
Bubble plot showing the relationship between the risk difference and baseline percentage screened
When component QI/BCTs were explored (comparing studies with the intervention to those studies without), there was some evidence of an association between the patient‐targeted BCT ‘goal setting (outcome)’, with greater improvement in DRS attendance observed in studies with compared to those without this BCT (regression coefficient 0.162 (0.07 to 0.254), P = 0.001). It should be noted that we made no adjustments for multiplicity in these investigations, so that results should be observed as hypothesis‐generating rather than confirmatory.
Discussion
Summary of main results
This review identified 66 RCTs/cluster‐RCTs that investigated the effectiveness of interventions to improve attendance for DRS. Fifty‐six studies (329,164 participants) compared a variety of QI interventions to usual care. A meta‐analysis of these studies found that QI intervention components that were aimed at patients, the healthcare professional or the healthcare system were associated with a 12% absolute increase in DRS attendance. In 13 of these studies, the QI intervention specifically targeted DRS and in 43 studies the intervention consisted of a general QI intervention to improve diabetes care. Although the pooled effect estimate was larger for DRS‐targeted interventions compared to non‐targeted interventions (17% increase in DRS attendance compared to 12%), this difference was not statistically significant.
Ten studies (23,715 participants) compared a less intensive intervention (‘active’ control) to a more intensive intervention. Three of these studies specifically targeted DRS and seven were general QI interventions. The aim of these studies was to determine whether stepping up the intensity of an intervention component, or introducing further components, would increase DRS. The pooled effect estimate for these studies was smaller, with a 5% increase in DRS attendance in favour of the more intensive intervention, suggesting that it is possible to further enhance the effect size by using more intense interventions.
The main comparison in this review (any QI intervention versus usual care) was associated with substantial heterogeneity. We explored this by subgroup analysis and meta‐regression. There was some evidence for larger effect sizes in populations with lower baseline DRS attendance; however, much of the observed heterogeneity was unexplained. Sufficient studies were available to investigate the impact of particular QI components or BCTs, to identify the active ingredients of the interventions. All 12 QI components, as defined by the modified EPOC taxonomy, were used in at least one study, and interventions were generally multifaceted, with two to three QI components per intervention arm. QI components targeting patients, healthcare professionals or the healthcare system were all effective in a subgroup analysis. A meta‐regression comparing studies using particular QI components to those without them showed no statistically‐significant difference between intervention components.
We were able to further describe interventions in terms of their component BCTs, which provides a level of granularity that is better suited to describing the content of the intervention. In a subgroup analysis, all frequently‐used BCTs were effective in improving attendance, with pooled RDs ranging from 0.11 to 0.26. A meta‐regression found that interventions containing certain BCTs were more effective in improving DRS attendance, including: ‘goal setting (outcome)’ (regression coefficient (RC) 0.162, 95% CI 0.070 to 0.254, P = 0.001). There was some evidence for larger effect sizes in populations with lower baseline DRS attendance, (RC ‐0.208, 95% CI ‐0.419 to 0.004, P = 0.054). However much of the observed heterogeneity was unexplained.
We found no studies reporting our secondary outcome measure of ongoing adherence to DRS following the initial screening appointment post‐intervention, and no data on the relative effectiveness of interventions in particular population subgroups, e.g. socioeconomic characteristics.
Fourteen studies reporting economic outcomes were included in the review. However, only five of these were full economic evaluations. Overall, we found that there is insufficient evidence to draw robust conclusions about the relative cost effectiveness of the interventions compared to each other or against usual care. QI components aimed at patients directly appeared to be more resource‐intensive compared with those aimed at healthcare professionals, with the exception of establishing an electronic patient registry, although there would be economies of scale in that there are high set‐up costs but the ongoing running costs would be comparatively low.
Overall completeness and applicability of evidence
To our knowledge only two countries in the world (UK and Iceland) have introduced a nationwide systematic screening programme for diabetic retinopathy. In all other countries screening remains opportunistic. Although an annual or biennial retinal examination is recommended in diabetes clinical practice guidelines in many countries, screening attendance is often suboptimal. Most of the trials included in this review (76%) involved general QI interventions for diabetes care and enrolled patients not achieving diabetes‐relevant quality indicators, including DRS. The pooled analysis for any QI intervention compared to usual care showed that both DRS‐targeted and general QI interventions were effective in improving screening attendance, particularly in populations with poor baseline screening attendance. However, the presence of substantial unexplained heterogeneity and the lack of data on the effect of the intervention on particular population subgroups means that there remains some uncertainty about the size of the anticipated increase in screening attendance.
Although potential harms associated with other forms of health screening are well documented, we did not formally include adverse effects/harms as an outcome in this review, since the risk of an adverse outcome associated with retinopathy screening is low. However, none of the included studies reported adverse outcomes.
Quality of the evidence
Overall we judged the certainty of the evidence to be low, using GRADE. We downgraded the evidence by two levels due to serious inconsistency of findings. We decided a priori to use a random‐effects model to estimate the pooled RDs across studies, which weights studies relatively more equally than in a fixed‐effect model. Given there was some evidence for larger effect sizes in smaller studies, our random‐effects estimate of the intervention effect is more beneficial than would have been obtained using a fixed‐effect model.
For many domains, it was not possible to judge the risk of bias due to poor reporting. For example, since many of the RCTs did not have a prospectively‐published protocol, it was not possible to make a judgement as to whether outcomes were selectively reported. A subgroup analysis found that, although studies at high risk of bias had slightly higher effect estimates compared to those at low risk of bias, this difference was not statistically significant. The consensus of the review team was not to downgrade the certainty of the evidence for risk of bias.
Of the 22 potential ‘economic’ studies identified by the review team, 14 were eligible for the review as partial or full economic evaluations. We judged the certainty of the economic evidence to be low, using GRADE. We downgraded due to inconsistency across different elements of the economic outcomes. We also identified publication bias in two of the eight excluded studies. These studies failed to report the planned economic evaluations, as they found no evidence of intervention effectiveness. Such an approach could be considered as selective outcome reporting, such that potentially negative economic findings are not reported. This phenomenon of a reporting bias has been recognised previously, where studies with unfavourable effectiveness results are not published or are published later in low‐impact journals. Furthermore, analytically such an approach is substandard, as these studies conflate absence of evidence with a finding of evidence of absence (of an effect). We also found evidence of publication bias by inspection of a funnel plot, but this was difficult to assess in the presence of such considerable heterogeneity.
Most of the economic evaluations had limitations in their reporting, with few providing a breakdown of the costs associated with delivering the different components of the intervention. There was also insufficient evidence to show whether part of the direct costs of the intervention and care may be offset by reduced productivity costs. However, it is important to note that an expected finding of an effective intervention would be gains in health and reductions in the costs of treating diabetes. The overall methodological quality of the included economic studies was mixed. The partial economic evaluations identified, by their nature lacked the methodological characteristics expected of an economic evaluation. We rated the methodological quality of the full economic evaluations as moderate.
Many of our studies did not report ICC values. We used the data that were provided to allow an estimation of an “average ICC”, which we then applied to the studies not reporting ICCs. Since this was an imputation, we wished to explore the impact that using other values of ICC would have, and thus repeated our analysis using the upper and lower values of ICC that had been observed. Varying in this fashion did not materially impact upon our estimates of RD.
Potential biases in the review process
We judged many domains as having an ‘unclear’ risk of bias, due to poor reporting. Although we contacted all authors to request further information on intervention content, we did not formally ask for all of the necessary information to make a more informed judgement across all bias domains.
Coding of intervention content was challenging, given the paucity of primary data sources, although in some cases (approximately 17%) this was offset by obtaining further information from researchers on intervention content, who also provided materials used in delivering the interventions. We were not able to assess the impact of some QI intervention components due to too few trials being available for our subgroup and meta‐regression analyses. Furthermore, we could not control for all potential confounding factors. Given the complexity of the interventions which incorporated multiple QI components, it is likely that other covariates may have interacted synergistically or antagonistically with the intervention under investigation. The short duration of the included RCTs (typically 12 months or less) or the failure to report individual screening episodes meant that we were unable to assess the effect of QI interventions on ongoing DRS attendance.
Agreements and disagreements with other studies or reviews
Only one previous systematic review (Zhang 2007) has investigated the effectiveness of interventions to increase the uptake of DRS. Although this review included 48 studies, only 12 of these were RCTs. The authors similarly concluded that a variety of interventions can be effective in improving screening uptake, including; increasing patient and provider awareness of diabetic retinopathy, introducing a computer‐based registration/reminder programme, and developing a community‐based healthcare system.
Compared to the paucity of systematic reviews of the impact of interventions to improve DRS outcomes, many reviews have evaluated the impact of general QI interventions to improve the overall quality of diabetes care (Worswick 2013). A recent systematic review published by members of the current team (Tricco 2012) included 48 cluster‐RCTs and 94 patient RCTs, and found improvements in many important quality outcomes for patients with diabetes. A meta‐analysis of a subset of 23 RCTs reported an increased uptake of retinopathy screening (RR 1.22, 95% CI 1.13 to 1.32).
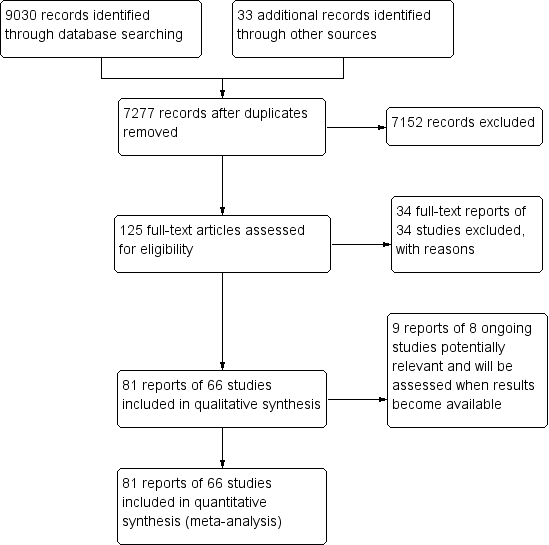
Study flow diagram.

Quality improvement components used in intervention arm of included studies. (DRS=diabetic retinopathy screening, GQI=general quality improvement).

Risk of bias summary: review authors' judgements about each risk of bias item for each included study.

Behaviour change techniques (BCTs) targeting patients used in intervention arm. of included studies (DRS=diabetic retinopathy screening, GQI=general quality improvement).
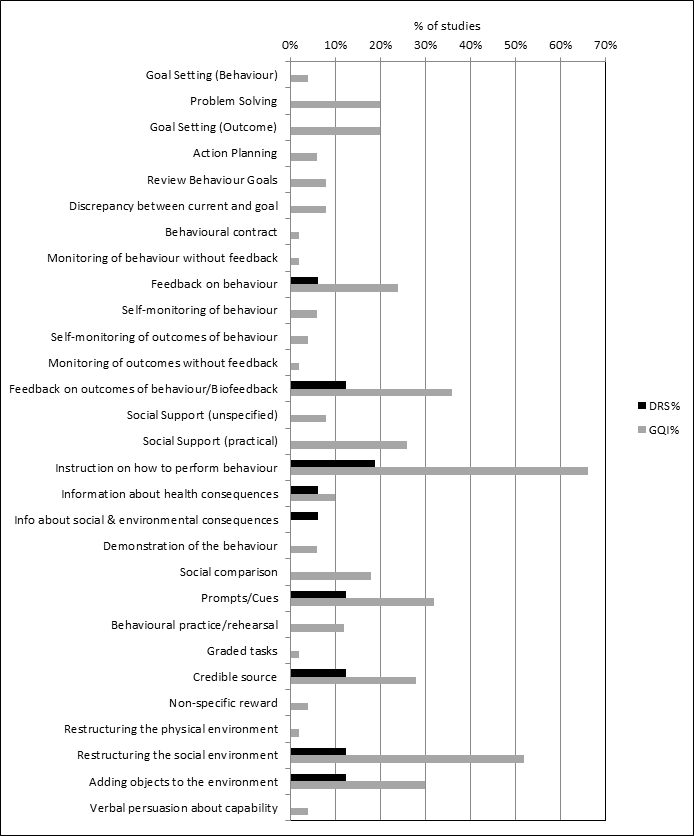
Behaviour change techniques (BCTs) targeting healthcare professionals used in intervention arm of included studies (DRS=diabetic retinopathy screening, GQI=general quality improvement).
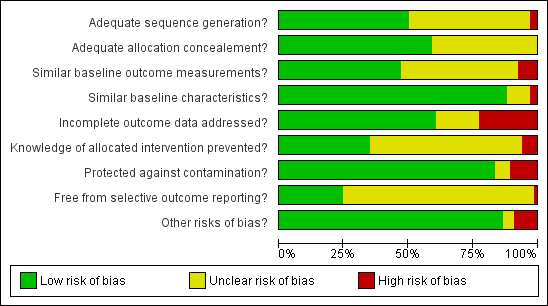
Risk of bias graph: review authors' judgements about each risk of bias item presented as percentages across all included studies.
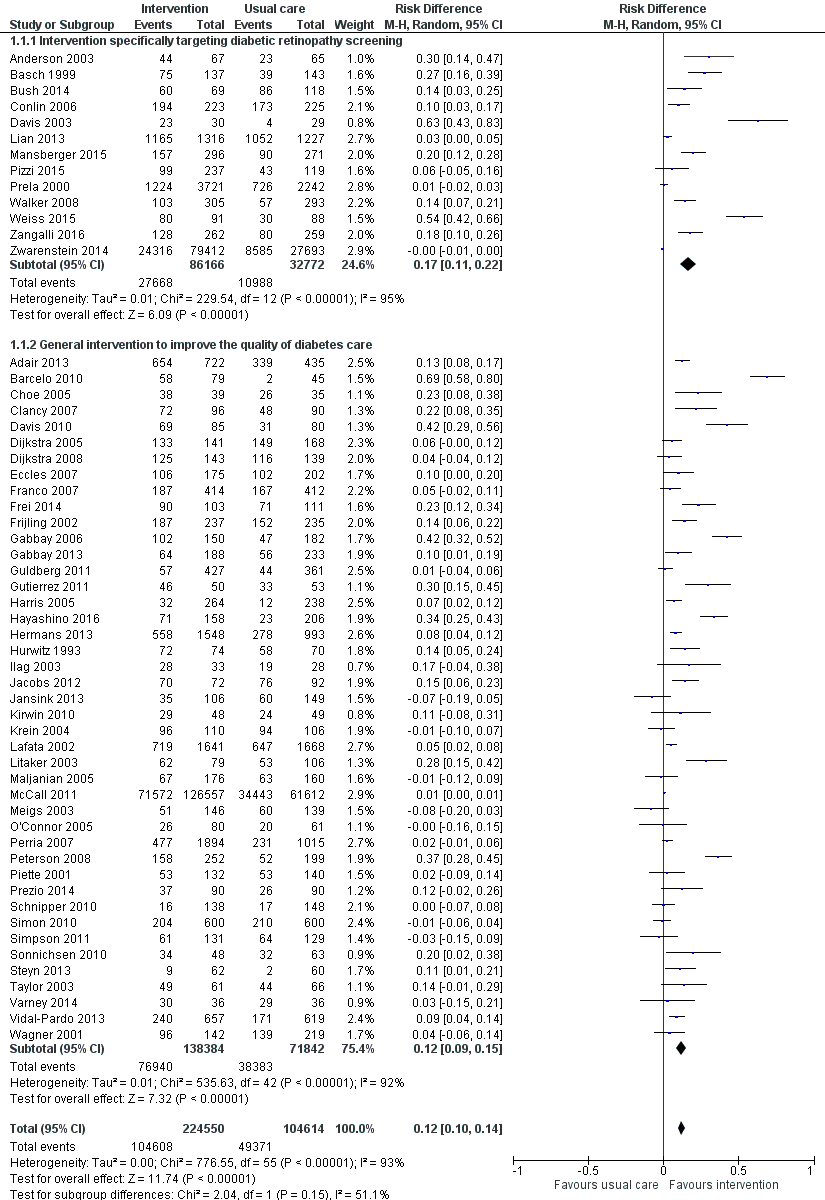
Forest plot of comparison: 1 Any quality improvement intervention compared to usual care, outcome: 1.1 Proportion of participants attending screening.

Funnel plot of comparison: 1 Any quality improvement intervention compared to usual care, outcome: 1.1 Proportion of patients attending screening.

Forest plot of comparison: 2 Stepped quality improvement intervention compared to intervention alone (control), outcome: 2.1 Proportion of participants attending screening.

Bubble plot showing the relationship between the risk difference and baseline percentage screened

Comparison 1 Any quality improvement intervention compared to usual care, Outcome 1 Proportion of participants attending screening.

Comparison 2 Stepped quality improvement intervention compared to intervention alone, Outcome 1 Proportion of participants attending screening.
| Any quality improvement intervention compared to usual care for diabetic retinopathy screening | ||||||
| Patient or population: patients with type 1 or 2 diabetes eligible for diabetic retinopathy screening | ||||||
| Outcomes | Illustrative comparative risks | Risk Difference (95% CI) | No of Participants | Quality of the evidence | Comments | |
| Assumed risk | Corresponding risk (95% CI) | |||||
| Attendance with usual care | Attendance with any QI Intervention | |||||
| Proportion of participants attending screening (median follow‐up 12 months post‐intervention) | 472 per 1000 | 580 per 1000 (557 to 604) | RD 12% (95% CI 10% to 14%) | 329,164 | ⊕⊕⊝⊝ | There was substantial unexplained heterogeneity between studies (I2 = 93%, P < 0.001). The effect appears to be larger when baseline performance is low |
| Ongoing adherence to screening | ‐ | ‐ | ‐ | ‐ | ‐ | Not reported |
| Economic Outcomes Resources used (staff time, equipment, consumables) | Wide variation in resources used for each study, hence difficult to collate the resource used as a single output | ‐ | 85 ‐ 20,000 (13 RCTs) | ⊕⊕⊝⊝ | ‐ | |
| Staff/personnel costs; costs of treatment and care; cost of primary care; lost wages and lost productivity | Wide variation in resources used from different interventions also made it difficult to derive average costs compared with usual care | ‐ | 85 ‐ 20,000 (10 RCTs) | |||
| Incremental Cost effectiveness of interventions | GBP 13,154 for promotion of self‐management; GBP 73,683 for 5 years for face‐to‐face meeting, GBP 18.77 for phone call | ‐ | 85 ‐ 603 (3 RCTs) | |||
| CI: Confidence interval; RD: Risk difference | ||||||
| GRADE Working Group grades of evidence | ||||||
| 1We downgraded the certainty of the evidence by two levels from high to low for inconsistency, due to wide variation in the effect estimates across studies that could not be explained. 2We downgraded the certainty of the evidence for the economic outcomes by two levels from high to low due to inconsistency across different elements of the economic outcomes (see Table 7). | ||||||
| Resources and costs per participant | ||||||||||
| Economic outcomes No of studies with evidence for the economic outcomes | Design | Limitations/risk of bias | Inconsistency | Indirectness | Imprecision | Other factors | No of participants | Any Quality Improvement intervention | Usual care | Overall quality |
| Resources used (staff time, equipment, consumables) (13 studies) Adair 2013Clancy 2007Davis 2010Eccles 2007Frei 2014Frijling 2002Krein 2004Litaker 2003Piette 2001Pizzi 2015Prezio 201Wagner 2001Walker 2008 | RCTs | Yesa | Yes ( there was justification for variation based on setting) | No | No | Resources used varied due to settings and intervention strategy | 85 ‐ 20,000 | Wide variation in resources used for each study, hence difficult to collate the resource used as a single output | ⊕⊕⊖⊖ LOW | |
| Staff/personnel costs; costs of treatment and care; cost of primary care; lost wages and lost productivity Adair 2013Clancy 2007Davis 2010Eccles 2007Frijling 2002Litaker 2003Piette 2001Pizzi 2015Prezio 2014Walker 2008 | RCTs | Yesa | Yes ( there was justification for variation based on setting) | No | No | Costs varied due to settings, level of experience and educational Background of personnel | 85 ‐ 20,000 | Wide variation in resources used from different interventions also made it difficult to derive average costs compared with usual care | ⊕⊕⊖⊖ LOW | |
| Incremental cost effectiveness of interventions. (3 studies) | RCTs | Yesa | No | No | No | None | 85 ‐ 603 | GBP 13,154 for promotion of self‐management GBP 73,683 for 5 years for face‐to‐face meeting GBP 18.77 for phone call | ⊕⊕⊕⊖ LOW | |
| a. Unclear risk from adequate masking (blinding), Unclear sequence generation and allocation concealment | ||||||||||
| Stepped quality improvement intervention compared to intervention alone for diabetic retinopathy screening | ||||||
| Patient or population: patients with type 1 or 2 diabetes eligible for diabetic retinopathy screening | ||||||
| Outcomes | Illustrative comparative risks | Risk Difference (95% CI) | No of Participants | Quality of the evidence | Comments | |
| Assumed risk (95% CI) | Corresponding risk (95% CI) | |||||
| Attendance with usual care | Attendance with stepped QI intervention | |||||
| Proportion of participants attending screening (median follow‐up 12 months post‐intervention) | 361 per 1000 | 405 per 1000 (372 to 437) | RD 5% (95% CI 2% to 9%) | 23,715 | ⊕⊕⊕⊝ | There was unexplained heterogeneity between studies (I2 = 56%, P = 0.02) |
| Ongoing adherence to screening | ‐ | ‐ | ‐ | ‐ | ‐ | ‐ |
| Economic outcomes | ‐ | ‐ | ‐ | ‐ | ‐ | ‐ |
| CI: Confidence interval; RD: Risk difference | ||||||
| GRADE Working Group grades of evidence | ||||||
| 1We downgraded the certainty of the evidence by one level from high to moderate for inconsistency due to variation in the effect estimates across studies that could not be explained. | ||||||
| Behaviour change technique (BCT) and abbreviated definitions | Illustrative quotation |
| Goals and planning | |
| Goal setting (behaviour) Set or agree a goal defined in terms of the behaviour to be achieved e.g. Set targets for how often patients should attend DRS, or general diabetes self‐management, such as frequency of blood glucose testing, amount of carbohydrates to consume at each meal | "Practice nurses planned independent consultations with patients. The monitoring tool guided them through the consultations, and provided the opportunity to help the patient in selecting appropriate, concrete, behavioural goals …. The monitoring tool addressed clinical parameters (e.g., HbA1C, BP and LDL cholesterol levels), examinations (e.g. food control, neurological tests, and eye examinations), adherence to prescribed drugs, self‐care goals, and other recommendations" (Frei 2014 p 1040‐1) |
| Problem solving Analyse, or prompt the person to analyse, factors influencing the behaviour and generate or select strategies that include overcoming barriers and/or increasing facilitators e.g. Support patients to identify reasons for wanting or not wanting to attend DRS, and helping them select potential strategies for overcoming these barriers to screening attendance | "Using a semi structured protocol, the health educator (C.J. H.) offered one‐on‐one, interactive education and counselling. Having established rapport, she worked to identify and understand each subject’s reasons for and /or barriers to having a dilated retinal examination. Focused problem‐solving then guided the subject toward making an informed choice about receiving an ophthalmic examination." (Basch 1999, p 1879) |
| Goal setting (outcome) Set or agree a goal defined in terms of a positive outcome of wanted behaviour e.g. Agree with the patient target HbA1c, blood pressure, or cholesterol level, or target range for blood glucose | "During the case management sessions, patients and providers set management goals that were reasonable to achieve." (Barcelo 2010, p 147) |
| Action planning Prompt detailed planning of performance of the behaviour e.g. Support the patient to develop a plan for how often they will attend DRS, where the DRS will occur, and how they will get to their appointment | "Behavioural activation for diabetic retinopathy prevention combined the principles of education about diabetes mellitus, behavioural therapy, and the health belief model to assist participants in identifying barriers to obtaining dilated fundus examinations, problems‐solving solutions to surmounting barriers, formulating action plans to facilitate dilated retinal examinations, and gauging the success of action plans." (Weiss 2015, p 1007) |
| Review behaviour goals Review behaviour goal(s) jointly with the person and consider modifying goal(s) or behaviour change strategy in light of achievement e.g. During scheduled diabetic review consultations, discuss with patients how they are progressing with their agreed self‐management behavioural goals (e.g. frequency of blood glucose testing, attendance for DRS). Where patients are not meeting agreed goals, either discuss how to adjust goals if needed to increase feasibility, or engage in problem‐solving to overcome any barriers to goal attainment | "Care managers were trained to use a patient‐centred self‐management approach that included review of the medical care needs and self‐care goals that the patient identified and brainstorming additional strategies that patients could use to overcome barriers to their goals." (Glasgow 2005, p 35) |
| Discrepancy between current and goal Draw attention to discrepancies between a person’s current behaviour and the person’s previously set outcome goals, behaviour goals or action plans e.g. Provide feedback to healthcare professionals on the proportion of patients who have received DRS in the previous 12 months, and compare this against a gold standard for clinical practice based on clinical guidelines | "Physicians in the IG [intervention group] received a monthly report of their care quality with the top 10% quality of diabetes care score for all physicians being the achievable benchmark."(Hayashino 2016, p 1) |
| Review outcome goal(s) Review outcome goal(s) jointly with the person and consider modifying goal(s) in light of achievement e.g. Review or alter target blood glucose levels towards a more feasible/achievable intermediate target | "The telephone call was structured to first review the patient’s goals, followed by medication use, symptoms, glucose monitoring, blood pressure monitoring and self‐management /care activities" (Taylor 2003, p 1059) |
| Behavioural contract Create a written specification of the behaviour to be performed, agreed by the person, and witnesses by another e.g. Ask the person with diabetes to sign a contract in their self‐management plan or diary, undertaking to attend DRS once | Care guides asked patients to sign a contract (which was scanned into the HHR) agreeing to work toward their disease‐specific goals. (Adair 2013, p 176) |
| Commitment Ask the person to affirm or reaffirm statement indicating commitment to change the behaviour e.g. Ask the person with diabetes to verbally affirm or reaffirm that they are committed to attending DRS at the agreed frequency and location | "The initial goal was toelicit a verbal commitment to schedule an eye examination." (Basch 1999, p 1879) |
| Feedback and monitoring | |
| Monitoring of behaviour by others without feedback Observe or record behaviour with the person’s knowledge as part of a behaviour change strategy e.g. Record the proportion of patients who attend for a DRS exam as part of clinical audit, but the results are not fed back to the healthcare professionals whose practice has been audited | "Foot examinations, blood pressure, and eye examinations were recorded on the reminder by clinic staff, collected after the patient visit and entered manually." (Peterson 2008, p 2239) |
| Feedback on behaviour Monitor and provide information or evaluative feedback on performance of the behaviour (e.g. form, frequency, duration, intensity) e.g. Provide a feedback report to healthcare professionals, stating the proportion of their patients who have attended a DRS exam, had their blood pressure taken, and had a foot examination | "In addition, diabetic members who did not have a record of a diabetic retinopathy exam received educational materials and a report of their current DRE status directly from the HMO 2 weeks later." (Halbert 1999, p 753) |
| Self‐monitoring of behaviour Establish a method for the person to monitor and record their behaviour(s) as part of a behaviour change strategy e.g. A person with diabetes maintains a self‐management diary in which they record their daily food intake and exercise, and tick off a checklist when they have attended their annual DRS exam | "We prepared feedback sheets for adherence to these eight indicators using data from thephysicians’ self‐report forms, as the physicians monitored and promoted these indicators to improve adherence." (Hayashino 2015, p 601) |
| Self‐monitoring of outcomes of behaviour Establish a method for the person to monitor and record the outcome(s) of their behaviour as part of a behaviour change strategy e.g. A person with diabetes records in their self‐management diary the results of their latest HbA1C result and DRS exam | "In general, case managers were directed to encourage patient self‐management, including diet and exercise, provide reminders for recommended screening/tests,help with appointment scheduling;monitoring home glucose and blood pressure levels…" (Krein 2004, p 734) |
| Monitoring of outcomes of behaviour by others without feedback Observe or record outcomes of behaviour with the person’s knowledge as part of a behaviour change strategy e.g. A person attends a DRS exam, but is not provided with the results of the examination | "The nurse case manager used behavioural goals setting, established individualized care plan, provide patient self‐management education and surveillance of patients…ordered protocol‐driven laboratory tests, tracked the outcomes using the computerized data registry…" (Gabbay 2006, p 30) |
| Feedback on outcomes of behaviour Monitor and provide feedback on the outcome of performance of the behaviour e.g. Informing the person with diabetes of the results of DRS exam [i.e. presence/absence of retinopathy] | "…all persons who attended the screening clinics received a dilated eye exam by a volunteer community‐based ophthalmologist. The eye exam included visual acuity, intraocular pressure, and a fundus examination through a dilated pupil…immediately after receiving the dilated eye exam, the patient was told the results by the examination ophthalmologist." (Anderson 2003, p 41) |
| Biofeedback Provide feedback about the body (e.g. physiological or biochemical state) using an external monitoring device as part of a behaviour change strategy | " … immediately after receiving the dilated eye exam, the patient was told the results by the examination ophthalmologist." (Anderson 2003, p 41) |
| Social Support | |
| Social Support (unspecified) Advise on, arrange or provide social support (e.g. from friends, relatives, colleagues, ‘buddies’ or staff) or non‐contingent praise or reward for performance of the behaviour. In includes encouragement and counselling e.g. Provide general encouragement or reassurance to a person with diabetes to attend their DRS appointment | "Overall, the intervention included …and self‐management support (provided by the practice nurse)." (Frei 2014, p 1041) |
| Social Support (practical) Advise on, arrange, or provide practical help (e.g. from friends, relatives, colleagues, ‘buddies’ or staff) for performance of the behaviour e.g. Provide practical help for a patient with diabetes to attend DRS. This can include, for example: arranging a referral to DRS, arranging or providing transport to the clinic | "Referrals were facilitated to other clinicians when indicated, including ophthalmology, podiatry, nutrition and primary care for follow‐up of acute or other chronic issues or when requested by patients." (Jacobs 2012, p 616) |
| Shaping knowledge | |
| Instruction on how to perform behaviour Advise or agree on how to perform the behaviour (includes ‘skills training’) e.g. Provide advice to a person with diabetes on how often guidelines recommend attending DRS, where they can obtain a DRS, and how to schedule an eye exam | "A direct mail reminder was sent to patients to reinforce the importance of annual eye exams and included the following text: If you don’t have an eye doctor, ask you regular doctor to refer you to one." (Prela 2000, p 258) |
| Natural consequences | |
| Information about health consequences Provide information (e.g. written, verbal, visual) about health consequences of performing the behaviour e.g. Provide advice to the person with diabetes, on the negative health consequences of retinopathy, and the benefits of early detection | "A tailored telephone intervention was delivered by bilingual interventionists and included: Risk communications, such as the frequency lack of symptoms of retinopathy and that early treatment for retinopathy decreases the risk of blindness, were included." (Walker 2008, p 187) |
| Salience of consequences Use methods specifically designed to emphasise the consequences of performing the behaviour with the aim of making them more memorable e.g. Give a person with diabetes a leaflet containing testimonials from other persons with diabetes who suffer from retinopathy to emphasise the benefits of attending DRS and early detection | "The videotape used emotional appeals through storytelling to increase motivation to have a yearly dilated retinal examination." (Basch 1999, p 1879) |
| Information about social & environmental consequences Provide information (e.g. written, verbal, visual) about social and environmental consequences of performing the behaviour e.g. Provide information on the costs of having a DRS exam | "A take‐home reminder (aimed at patients, to remind them to make an appointment for an eye exam), to be given to patients by their Family Practitioner, included the following text: OKIP covers annual eye checks for patients with diabetes so you will not have to pay" (Zwarenstein 2014, p 90) |
| Information about emotional consequences Provide information (e.g. written, verbal, visual) about emotional consequences of performing the behaviour e.g. Provide a leaflet recognising the potential negative effects on emotional and mental health of managing a chronic illness, such as diabetes | "Group visit content, though patient‐guided, was physician‐directed to cover educational topics…and the emotional aspects of diabetes." (Clancy 2007, p 621) |
| Comparison of behaviour | |
| Demonstration of the behaviour Provide an observable sample of the performance of the behaviour, directly in person or indirectly (e.g. by film, picture, for the person to aspire to or imitate) e.g. Play a video demonstrating the DRS procedure | "The newsletter consisted of six sections, including a testimonial designed to model eye examination behaviour" (Ellish 2011, p 1593) |
| Social comparison Draw attention to others’ performance to allow comparison with the person’s own performance e.g. Provide healthcare professionals with feedback on the proportion of their patients who have had a DRS exam, and benchmark this in comparison to other hospitals or healthcare professionals | "The system presented register data on their’ Type 2 diabetes population, giving them the option either to use the data during individual diabetes consultations or to gain an overview of the quality of their diabetes care and compare it with the corresponding quality in their colleagues’ practices." (Guldberg 2011, p 326) |
| Information about others’ approval Provide information about what other people think about their behaviour. The information clarifies whether others will like, approve or disapprove of what the person is doing or will do e.g. Tell the person with diabetes that their family members would likely be keen for them to attend their DRS appointment | "One of the message in the targeted newsletter read: Even though you’ve been thinking about getting a dilated eye exam, we hope you’ll make the call now"(Ellish 2011, Additional information provided by the author) |
| Associations | |
| Prompts/Cues Introduce or define environmental or social stimulus with the purpose of prompting or cueing the behaviour e.g. Phone the person with diabetes to remind them of their upcoming DRS appointment | "For those who made an appointment, a reminder letter was mailed 3 weeks prior to the scheduled appointment. Additionally, there was an automated reminder call the day before the scheduled appointment" (Pizzi 2015, p 255) |
| Reduce prompts/cues Withdraw gradually prompts to perform the behaviour e.g. Decrease the frequency with which a person with diabetes is sent a reminder of their DRS attendance (i.e. from weekly, to fornightly, to monthly, to quarterly reminders) | "Recommendations for regular telephone follow‐ups for diabetes patients, which will be monthly in the 1st half year and then will probably decrease" (Jansink 2013 (coded from protocol 2009) |
| Repetition and substitution | |
| Behavioural practice/rehearsal Prompt practice or rehearsal of the performance of the behaviour one or more times in a context or at a time when the performance may not be necessary, in order to increase habit and skill e.g. Provide an opportunity for trainee healthcare professionals to practise delivering a DRS exam to an actor role‐playing a patient with diabetes | "During a 2‐day training session, case managers received instruction on collaborative goal setting, with case examples and role‐playing used to familiarize them with the treatment algorithms"( Krein 2004, p 734) |
| Graded tasks Set easy‐to‐perform tasks, making them increasingly difficult, but achievable, until the behaviour is performed e.g. Initially allocate a healthcare professional responsibility for one component of DRS exam and progressively increase their responsibility | "Theoretically, this form of facilitation should be necessary for only a relatively short period of time, with the practice improvement team progressively assuming responsibility for the ongoing improvement efforts after the initial facilitation." (Dickinson 2014, p 10) |
| Comparison of outcomes | |
| Credible source Present verbal or visual communication from a credible source in favour of or against the behaviour e.g. Include the logos for national health institutes, or cite published clinical guidelines, to endorse information provided in leaflets regarding DRS | "Participants in the print‐intervention group received a mailing of a colourful, 14‐page booklet on preventing diabetes eye problems called Keep Your Eyes Healthy, in English or Spanish,developed b y the National Institutes of Health." (Walker 2008, p 187) |
| Reward and threat | |
| Material incentive (behaviour) Inform that money, vouchers or other valued objects will be delivered if and only if there has been effort and/or progress in performing the behaviour e.g. Advise the person with diabetes that they will receive a shopping voucher if they attend their upcoming DRS appointment | "The automated system offered a live telephone call back to assist in scheduling test and alsooffered to send participants the following items: 1) a voucher that would allow the provider to waive the co‐payment for a dilated eye examination…" (Simon 2010, p 1452) |
| Social reward Arrange verbal or non‐verbal reward if and only if there has been effort and/or progress in performing the behaviour e.g. Verbally praise the person with diabetes if they attend their DRS appointment | "When a subject reported having a dilated retinal examination a congratulatory letter was sent." (Basch 1999, p 1879) |
| Non‐specific reward Inform that a reward will be delivered if and only if there has been effort and/or progress in performing the behaviour e.g. Inform the healthcare professional that they will be rewarded for conducting a DRS exam with a target proportion of their patients | "CME credits were given to the participating physicians in the workshops" (Vidal‐Pardo 2013, p 752) |
| Antecedents | |
| Restructuring the physical environment Change or advise to change the physical environment in order to facilitate performance of the wanted behaviour or create barriers to the unwanted behaviour e.g. Introduce mobile DRS vans in geographically remote areas to increase access to screening facilities | "Care guide workstations were located in the clinic waiting rooms, to facilitate face‐to‐face interactions with patients, providers, and nurses." (Adair 2013, p 177) |
| Restructuring the social environment Change or advise to change the social environment in order to facilitate performance of the wanted behaviour or create barriers to the unwanted behaviour e.g. Change a healthcare team and team working, such as introducing a new specialist diabetes nurse role responsible for monitoring screening rates and phoning people with diabetes to remind them to attend their DRS appointment | "Three multi‐lingual Link Workers already employed by Coventry Primary Care Trust (PCT) were trained in diabetes management and care and assigned to work with specific intervention GP surgeries" (Bush 2014, p 295) |
| Adding objects to the environment Add objects to the environment in order to facilitate performance of the behaviour e.g. Introduce new computerised software to a general practice to help monitor and remind healthcare professionals as to which patients need to be prompted to attend DRS | "In addition 4500 diabetes passports were made available at the four hospitals…" (Dijkstra 2005, p 128) |
| Scheduled consequences | |
| Behaviour cost Arrange for withdrawal of something valued if and only if an unwanted behaviour is performed e.g. Charging people with diabetes a fee for failing to attend a DRS exam | "We were interested to find out whether a small copayment would be an important deterrent to the uptake of screening for diabetic retinopathy (DR)…We conducted a randomized trial in which one group was charged a small fee for DR screening and the other was provided with free access." (Lian 2013, p 1247) |
| Self‐belief | |
| Verbal persuasion about capability Tell the person that they can successfully perform the wanted behaviour, arguing against self‐doubts and asserting that they can and will succeed e.g. Encourage or reassure the patient to attend a DRS exam, providing information as needed to address any concerns or self‐doubts they may have about attending for a DRS exam | "Diabetes is a serious, lifelong condition, but there is so much that you can do to protect your health. Take charge of your health, not only for today, but also for the years to come" (Lafata 2002, p 523) |
| Focus on past success Advise to think about or list previous successes in performing the behaviour (or parts of it) e.g. Help the person with diabetes to remember the last time they attended a DRS exam, and use this as an opportunity to reassure them of the benefits of attending | A comprehensive programme that integrated lifestyle: counselling based on motivational interviewing principles was integrated into structured diabetes care. [In description of motivational interviewing] "Self‐efficacy can be strengthened by affirming past success (i.e. reinforcement)…" (Jansink 2013 , additional information from protocol) |
| DRS: diabetic retinopathy screening | |
| QI Component | Study | DRS or GQI | Estimated costs of resources used | Resources used |
| Promotion of self‐management | N = 85 participants | GQI | Staff cost per person = GBP 625.25; costs of the other resources used = GBP 476.35 over 12 months Direct cost per person = GBP 1101 | 13 x 15‐minute sessions (3 individuals and 10 group session) with nurses and 4 hours with health educator per person |
| N = 14 clinics, 278 participants | GQI | Not reported | 1‐hour group session with relevant health professional every 3 ‐ 6 months | |
| Team changes | N = 15 practices, 164 participants | GQI | Not reported | 6‐day training for nurses, 2 x 4‐hour workshops for physicians and nurses |
| N = 14 clinics, 278 participants | GQI | Not reported | 1‐hour group session with relevant health professional every 3 ‐ 6 months | |
| N = 79 participants | GQI | Mean personnel costs for the intervention per month per patient = GBP 130.15 Total additional personnel costs = GBP 10281.97 | An average of 180 minutes with participants | |
| Case management | N = 123 participants | GQI | Not reported | 2 days training for case managers, 20 hours/week time spent with participants. Quarterly profiling and subsequently every 6 months |
| Patient education | N = 90 participants | GQI | Physician cost = GBP 48.76/hour Community health worker = GBP 12.91/hour Cost of intervention over 20 years = GBP 3646.10 per patient | 7 sessions per participants, 1 hour physician supervision for health workers |
| N = 117 participants for mailed intervention, 120 for telephone intervention | DRS | Staff time for 120 participants = GBP 501.13 for telephone over 1 month Staff time for 117 participants = GBP 173.17 for mailed intervention over 1 month GBP 85.24/hour for the physician, GBP 29.32/hr for health services manager, GBP 16.72/hour for medical assistant Cost of materials for telephone = GBP 30.25, cost of materials for mailed intervention Total cost of intervention = GBP 577.64 for 120 participants in telephone group, GBP 335.48 for 117 participants in mailed group over a month Total cost when appointment is made and kept per participant; Telephone intervention = GBP 9.47 Mailed intervention = GBP 8.83 | 1‐hour supervision for every 20‐hour intervention delivered 2 x 1‐hour meetings with medical assistants, health services manage and ophthalmologist | |
| N = 930 participants | GQI | Care guide cost for 120 participants = GBP 375,917 at the rate of GBP 11.77/hour over a year 2 supervisory nurses = GBP 85,847.24 Training cost = GBP 2228.99 modular furniture and equipment for 12 stations = GBP 79,422.81 Total cost = GBP 463,993 Total cost of intervention per participant = GBP 326 | 12 care guides, 2 weeks training, 2 supervisory nurses, 5 visits on average to clinics, 4 contacts with participants, furniture and modular equipment | |
| N = approximately 20,000 participants | GQI | Not reported | Not reported | |
| N = 96 participants | GQI | Deposit fee for group visit = GBP 13.4/visit, for 12 visits = GBP 160.60 | Monthly meeting for a year for 2 hours which includes 1 primary care internal medicine physician, 1 registered nurse per visit Training for physicians and nurses 3‐ hour training for clinic staff 12 group visits for 1 year | |
| Schechter 2008 (Walker 2008) N = 305 participants for telephone intervention, 298 for print intervention | DRS | Costs of health educator = GBP 14,890.83 Training and supervision = GBP 2756.44 Telephone charges = GBP 679.67 for 305 participants Costs of printing and mailing = GBP 465.99 for 298 participants | Average of 3.2 calls for about 20 minutes +5 minutes call preparation per participant over 6 months 20 hours training, 1 hour supervision by diabetes nurse educator, telephone calls | |
| Electronic patient register | N = 30 practices, 1674 participants | GQI | Cost of developing the guidelines = GBP 10,208 Cost of software development = GBP 12519.36 Cost of educational activities = GBP 2148.11 Additional cost of running the system = GBP 9964.46 Annual cost per participant = GBP 68.21 | Cost of guidelines and software development. Average of 2 follow‐up contacts |
| Patient reminders | Schechter 2008 (Walker 2008) N = 305 participants for telephone intervention, 298 for print intervention | DRS | Costs of health educator = GBP 14,890.83 Training and supervision = GBP 2756.44 Telephone charges = GBP 679.67 for 305 participants Costs of printing and mailing = GBP 465.99 for 298 participants | Average of 3.2 calls for about 20 minutes + 5 minutes call preparation per participant over 6 months 20 hours training, 1 hour supervision by diabetes nurse educator, telephone calls |
| N = 117 participants for mailed intervention, 120 for telephone intervention | DRS | Staff time for 120 participants = GBP 501.13 for telephone over 1 month Staff time for 117 participants = GBP 173.17 for mailed intervention over 1 month GBP 85.24/hour for the physician, GBP 29.32/hour for health services manager, GBP 16.72/hour for medical assistant Cost of materials for telephone = GBP 30.25, cost of materials for mailed intervention Total cost of intervention = GBP 577.64 for 120 participants in telephone group, GBP 335.48 for 117 participants in mailed group over a month | 1 hour supervision for every 20‐hour intervention delivered 2 x 1‐hour meetings with medical assistants, health services manager and ophthalmologist | |
| Audit and feedback | N = 62 clusters, 703 participants | GQI | Cost of clinical decision‐making per practice = GBP 341.51 | 80 hours training for facilitator, 15 x 1‐hour visits to practice clinic, 3 hours GP time for implementation of feedback |
| Clinician reminders | N = 79 participants | GQI | Mean personnel costs for the intervention per month = GBP 130.15 Total additional personnel costs = GBP 10,281.97 | An average of 180 minutes with participants over 12 months |
| Continuous quality improvements | N = 146 participants | GQI | Approximately GBP 14 ‐ GBP 24 per year for automated calls. | 13 nurses spending an average of 3.8 hours per participant, 15 automated calls |
| DRS: diabetic retinopathy screening | ||||
| Study characteristics | Target: diabetic retinopathy screening attendance N = 16 | Target: general quality improvement in diabetes care N = 50 | TOTAL N = 66 |
| Study design | Individual RCT: n = 14 (87.5%) Cluster‐RCT: n = 2 (12.5%) 2 arms n = 13 (81.3%) 3 arms n = 2 (12.5%) > 3 arms n = 1 (6.3%) | Individual RCT: n = 21 (42%) Cluster‐RCT: n = 29 (58%) 2 arms n = 46 (92%) 3 arms n = 4 (8%) | Individual RCT n = 35 (53%) Cluster‐RCT n = 31 (47%) 2 arms n = 59 (89.4%) 3 arms n = 6 (9.1%) > 3 arms n = 1 (1.5%) |
| Location | USA: n = 12 (75%) Canada: n = 1 (6.3%) China: n = 1 (6.3%) Germany: n = 1 (6.3%) UK: n = 1 (6.3%) Conducted between 1995 and 2013 | USA: n = 29 (58%) Canada: n = 2 (4%) Netherlands: n = 4 (8%) Australia: n = 3 (6%) UK: n = 2 (4%) Other n = 10 (20%) Conducted between 1988 and 2013 | USA: n = 41 (62.1%) Canada: n = 3 (4.6%) Netherlands: n = 4 (6.1%) Australia: n = 3 (4.6%) UK: n = 3 (4.6%) Other: n = 12 (18.2%) Conducted between 1988 and 2013 |
| Setting | Primary care: n = 11 (68.8%) Outpatient clinics: n = 4 (25%) Unclear: n = 1 (6.3%) | Primary care: n = 40 (80%) Outpatient n = 3 (6%) Unclear: n = 7 (14%) | Primary care: n = 51 (77.3%) Outpatient clinics n = 7 (10.6%) Unclear n = 8 (12.1%) |
| Diabetes type | Type 2: n = 4 (25%) Type 1 and Type 2: n = 3 (18.8%) Not reported: n = 9 (56.3%) | Type 2: n = 34 (68%) Type 1 and Type 2 n = 7 (14%) Not reported: n = 9 (18%) | Type 2 : n = 38 (57.6%) Type 1 and 2 n = 10 (15.2%) Not reported n = 18 (27.3%) |
| Number of participants recruited | Individual RCT = 38,273 Cluster RCT = 4135 clusters, 182,513 participants Total: 220,786 participants included | Individual RCT = 198,752 Cluster RCT = 1991 clusters, 78,276 participants Total: 277,028 participants included | Individual RCT = 237,025 Cluster RCT = 6126 clusters, 260,789 participants Total: 497,814 participants included |
| Median age | Median 60.7 yrs (range 51.1 ‐ 72.7) | Median 60.6 yrs (range 46.8 ‐ 74) Number reporting n = 34 | Median 60.7 yrs (46.8 ‐ 74) Number reporting n = 43 |
| Gender (% male) | Median 38.9% (range 25% ‐ 98%) Number reporting n = 12 | Median 49.8% (range 25% ‐ 97%): Number reporting n = 35 | Median 48% (25% ‐ 98%) Number reporting n = 47 |
| Type of screening | Retinal exam n = 12 (75%) Grading of digital retinal images: n = 4 (25%) | Retinal exam n = 49 (98%) Grading of retinal images n = 1 (2%) | Retinal exam n = 61 (92.4%) Grading of retinal images n = 5 (7.6%) |
| Baseline screening attendance (in previous 12 or 24 m) | Median 0% (range 0% ‐ 48.4%) Reported in 7 studies | Median 37.1% (range 0% ‐ 88%) Reported in 36 studies | Median 35.4% (range 0% ‐ 87.8%) Reported in 43 studies |
| Longest duration of follow‐up (median)* | Median 6 months (range 3 ‐ 48) Number reporting n = 14 | Median 12 months (range 1 ‐ 30): Number reporting n = 49 | Median 12 months (range 1 ‐ 48) Number reporting n = 63 |
| Intervention target (modified EPOC classification) | Median number of targets in intervention arm = 2 Participant n = 14 (87.5%) Healthcare professional n = 4 (25%) Healthcare system n = 4 (25%) | Median number of targets in intervention arm = 3 Participant n = 31 (62%) Healthcare professional n = 31 (62%) Healthcare system n = 37 (74%) | Median number of targets in intervention arm = 3 Participant n = 45 (68.2%) Healthcare professional n = 35 (53%) Healthcare system n = 41 (62.1%) |
| Mansberger 2015 reported follow‐up data to 48 months but intervention offered to intervention and control group after 18 months and data reported at 12 and 24 months. | |||
| CHEC criteria checklists | Adair 2013 | Clancy 2007 | Davis 2011 | Eccles 2007 | Frei 2014 | Frijling 2002 | Krein 2004 | Litaker 2003 | McCall 2011 | Piette 2001 | Pizzi 2015 | Prezio 2014 | Schechter 2008 | Wagner 2001 |
| Is the study population clearly described? | Y | Y | Y | Y | Y | Y | Y | Y | Y | Y | Y | Y | Y | Y |
| Are competing alternatives clearly described? | Y | Y | Y | N | N | Y | Y | Y | N | N | Y | Y | Y | N |
| Is a well‐defined research question posed in answerable form? | Y | Y | Y | Y | Y | Y | Y | Y | Y | N | Y | Y | Y | Y |
| Is the economic study design appropriate to the stated objective? | N | N | Y | N | N | N | N | Y | N | N | Y | Y | Y | N |
| Is the chosen time horizon appropriate to include relevant costs and consequences? | Y | N | U | N | N | N | N | Y | N | N | Y | Y | Y | N |
| Is the actual perspective chosen appropriate? | Y | N | Y | Y | Y | Y | Y | Y | Y | Y | Y | Y | Y | Y |
| Are all important and relevant costs for each alternative identified? | Y | N | Y | Y | N | N | N | N | N | N | Y | Y | Y | N |
| Are all costs measured appropriately in physical units? | Y | N | U | Y | N | Y | N | Y | Y | N | Y | Y | Y | N |
| Are costs valued appropriately? | Y | N | N | Y | N | Y | N | Y | N | N | Y | Y | Y | N |
| Are all important and relevant outcomes for each alternative identified? | Y | N | Y | Y | Y | Y | N | Y | N | Y | Y | Y | Y | N |
| Are all outcomes measured appropriately? | Y | Y | Y | Y | N | Y | N | Y | Y | N | Y | Y | Y | N |
| Are outcomes valued appropriately? | N | N | N | Y | N | N | N | N | N | N | Y | Y | N | N |
| Is an incremental analysis of costs and outcomes of alternatives performed? | N | N | Y | N | N | N | N | N | N | N | Y | Y | Y | N |
| Are all future costs and outcomes discounted appropriately? | N | N | N | N | N | N | N | N | N | N | Y | Y | N | N |
| Are all important variables, whose values are uncertain, appropriately subjected to sensitivity analysis? | N | N | N | Y | N | N | N | N | N | N | Y | Y | Y | N |
| Do the conclusions follow from the data reported? | Y | Y | Y | N | Y | Y | Y | N | N | Y | Y | Y | Y | Y |
| Does the study discuss the generalizability of the results to other settings patient/client groups? | Y | Y | Y | Y | Y | Y | Y | Y | N | Y | Y | Y | Y | Y |
| Does the article indicate that there is no potential conflict of interest of study researcher(s) and funder(s)? | Y | Y | Y | Y | Y | Y | Y | Y | N | Y | Y | Y | Y | Y |
| Are ethical and distributional issues discussed appropriately? | Y | Y | Y | Y | Y | Y | Y | Y | Y | Y | Y | Y | Y | Y |
| N: no | ||||||||||||||
| Section of paper | Component | Reported on page number |
| Adair 2013 | ||
| Abstract | Provide a structured summary of objectives, perspective, setting, methods (including study design and inputs), results (including base case and uncertainty analyses), and conclusions | Not reported |
| Introduction | ‐ | |
| Background and objectives | Provide an explicit statement of the broader context for the study | 176 |
| Present the study question and its relevance for health policy or practice decisions | 176 | |
| Methods | ||
| Target population and subgroups | Describe characteristics of the base case population and subgroups analysed, including why they were chosen | 177 |
| Setting and location | State relevant aspects of the system(s) in which the decision(s) need(s) to be made | 177 |
| Study perspective | Describe the perspective of the study and relate this to the costs being evaluated | 178 ‐ 179 |
| Comparators | Describe the interventions or strategies being compared and state why they were chosen | Not reported |
| Time horizon | State the time horizon(s) over which costs and consequences are being evaluated and say why appropriate | Not reported |
| Discount rate | Report the choice of discount rate(s) used for costs and outcomes and say why appropriate | Not reported |
| Choice of health outcomes | Describe what outcomes were used as the measure(s) of benefit in the evaluation and their relevance for the type of analysis performed | Not reported |
| Measurement of effectiveness | Single study‐based estimates: Describe fully the design features of the single effectiveness study and why the single study was a sufficient source of clinical effectiveness data | Not reported |
| Synthesis‐based estimates: Describe fully the methods used for identification of included studies and synthesis of clinical effectiveness data | Not reported | |
| Measurement and valuation of preference based outcomes | If applicable, describe the population and methods used to elicit preferences for outcomes | Not reported |
| Estimating resources and costs | Single study‐based economic evaluation: Describe approaches used to estimate resource use associated with the alternative interventions. Describe primary or secondary research methods for valuing each resource item in terms of its unit cost. Describe any adjustments made to approximate to opportunity costs | 179 |
| Currency, price date, and conversion | Report the dates of the estimated resource quantities and unit costs. Describe methods for adjusting estimated unit costs to the year of reported costs if necessary. Describe methods for converting costs into a common currency base and the exchange rate | 179 |
| Choice of model | Describe and give reasons for the specific type of decision‐analytical model used. Providing a figure to show model structure is strongly recommended | Not reported |
| Assumptions | Describe all structural or other assumptions underpinning the decision‐analytical model | Not reported |
| Analytical methods | Describe all analytical methods supporting the evaluation. This could include methods for dealing with skewed, missing, or censored data; extrapolation methods; methods for pooling data; approaches to validate or make adjustments (such as half cycle corrections) to a model; and methods for handling population heterogeneity and uncertainty | Not reported |
| Results | ||
| Study parameters | Report the values, ranges, references, and, if used, probability distributions for all parameters. Report reasons or sources for distributions used to represent uncertainty where appropriate. Providing a table to show the input values is strongly recommended | Appendices w65 |
| Incremental costs and outcomes | For each intervention, report mean values for the main categories of estimated costs and outcomes of interest, as well as mean differences between the comparator groups. If applicable, report incremental cost‐effectiveness ratios | Appendices w65 |
| Characterising uncertainty | Single study‐based economic evaluation: Describe the effects of sampling uncertainty for the estimated incremental cost and incremental effectiveness parameters, together with the impact of methodological assumptions (such as discount rate, study perspective) | Not reported |
| Model‐based economic evaluation: Describe the effects on the results of uncertainty for all input parameters, and uncertainty related to the structure of the model and assumptions | Not reported | |
| Characterising heterogeneity | If applicable, report differences in costs, outcomes, or cost‐effectiveness that can be explained by variations between subgroups of patients with different baseline characteristics or other observed variability in effects that are not reducible by more information | Not reported |
| Discussion | ||
| Study findings, limitations, generalisability, and current knowledge | Summarise key study findings and describe how they support the conclusions reached. Discuss limitations and the generalisability of the findings and how the findings fit with current knowledge | 183 |
| Other | ||
| Source of funding | Describe how the study was funded and the role of the funder in the identification, design, conduct, and reporting of the analysis. Describe other non‐monetary sources of support | 183 |
| Conflicts of interest | Describe any potential for conflict of interest of study contributors in accordance with journal policy. In the absence of a journal policy, we recommend authors comply with International Committee of Medical Journal Editors recommendations | 183 |
| Clancy 2007 | ||
| Title | Identify the study as an economic evaluation or use more specific terms such as “cost‐effectiveness analysis”, and describe the interventions compared. | Not reported |
| Abstract | Provide a structured summary of objectives, perspective, setting, methods (including study design and inputs), results (including base case and uncertainty analyses), and conclusions. | Not reported |
| Introduction | ||
| Background and objectives | Provide an explicit statement of the broader context for the study. | Not reported |
| Present the study question and its relevance for health policy or practice decisions. | 620 | |
| Methods | Not reported | |
| Target population and subgroups | Describe characteristics of the base case population and subgroups analysed, including why they were chosen. | 621 |
| Setting and location | State relevant aspects of the system(s) in which the decision(s) need(s) to be made. | Not reported |
| Study perspective | Describe the perspective of the study and relate this to the costs being evaluated. | Not reported |
| Comparators | Describe the interventions or strategies being compared and state why they were chosen. | 620 ‐ 621 |
| Time horizon | State the time horizon(s) over which costs and consequences are being evaluated and say why appropriate. | Not reported |
| Discount rate | Report the choice of discount rate(s) used for costs and outcomes and say why appropriate. | Not reported |
| Choice of health outcomes | Describe what outcomes were used as the measure(s) of benefit in the evaluation and their relevance for the type of analysis performed. | Not reported |
| Measurement of effectiveness | Single study‐based estimates: Describe fully the design features of the single effectiveness study and why the single study was a sufficient source of clinical effectiveness data. | 620 |
| Synthesis‐based estimates: Describe fully the methods used for identification of included studies and synthesis of clinical effectiveness data. | Not reported | |
| Measurement and valuation of preference based outcomes | If applicable, describe the population and methods used to elicit preferences for outcomes. | Not reported |
| Estimating resources and costs | Single study‐based economic evaluation: Describe approaches used to estimate resource use associated with the alternative interventions. Describe primary or secondary research methods for valuing each resource item in terms of its unit cost. Describe any adjustments made to approximate to opportunity costs. | Not reported |
| Currency, price date, and conversion | Report the dates of the estimated resource quantities and unit costs. Describe methods for adjusting estimated unit costs to the year of reported costs if necessary. Describe methods for converting costs into a common currency base and the exchange rate. | Not reported |
| Choice of model | Describe and give reasons for the specific type of decision‐analytical model used. Providing a figure to show model structure is strongly recommended. | Not reported |
| Assumptions | Describe all structural or other assumptions underpinning the decision‐analytical model. | Not reported |
| Analytical methods | Describe all analytical methods supporting the evaluation. This could include methods for dealing with skewed, missing, or censored data; extrapolation methods; methods for pooling data; approaches to validate or make adjustments (such as half cycle corrections) to a model; and methods for handling population heterogeneity and uncertainty. | 622 |
| Results | ||
| Study parameters | Report the values, ranges, references, and, if used, probability distributions for all parameters. Report reasons or sources for distributions used to represent uncertainty where appropriate. Providing a table to show the input values is strongly recommended. | Not reported |
| Incremental costs and outcomes | For each intervention, report mean values for the main categories of estimated costs and outcomes of interest, as well as mean differences between the comparator groups. If applicable, report incremental cost‐effectiveness ratios. | Not reported |
| Characterising uncertainty | Single study‐based economic evaluation: Describe the effects of sampling uncertainty for the estimated incremental cost and incremental effectiveness parameters, together with the impact of methodological assumptions (such as discount rate, study perspective). | Not reported |
| Model‐based economic evaluation: Describe the effects on the results of uncertainty for all input parameters, and uncertainty related to the structure of the model and assumptions | Not reported | |
| Characterising heterogeneity | If applicable, report differences in costs, outcomes, or cost‐effectiveness that can be explained by variations between subgroups of patients with different baseline characteristics or other observed variability in effects that are not reducible by more information. | Not reported |
| Discussion | ||
| Study findings, limitations, generalisability, and current knowledge | Summarise key study findings and describe how they support the conclusions reached. Discuss limitations and the generalisability of the findings and how the findings fit with current knowledge. | Not reported |
| Other | ||
| Source of funding | Describe how the study was funded and the role of the funder in the identification, design, conduct, and reporting of the analysis. Describe other non‐monetary sources of support. | 624 |
| Conflicts of interest | Describe any potential for conflict of interest of study contributors in accordance with journal policy. In the absence of a journal policy, we recommend authors comply with International Committee of Medical Journal Editors recommendations. | 624 |
| Davis 2010 | ||
| Title | Identify the study as an economic evaluation or use more specific terms such as “cost‐effectiveness analysis”, and describe the interventions compared. | Abstract A325 |
| Abstract | Provide a structured summary of objectives, perspective, setting, methods (including study design and inputs), results (including base case and uncertainty analyses), and conclusions. | Abstract A325 |
| Introduction | ||
| Background and objectives | Provide an explicit statement of the broader context for the study. | Abstract A325 |
| Present the study question and its relevance for health policy or practice decisions. | 1712 of effectiveness report | |
| Methods | ||
| Target population and subgroups | Describe characteristics of the base case population and subgroups analysed, including why they were chosen. | 1714 of effectiveness report |
| Setting and location | State relevant aspects of the system(s) in which the decision(s) need(s) to be made. | Abstract A325 |
| Study perspective | Describe the perspective of the study and relate this to the costs being evaluated. | Not reported |
| Comparators | Describe the interventions or strategies being compared and state why they were chosen. | Abstract A325 |
| Time horizon | State the time horizon(s) over which costs and consequences are being evaluated and say why appropriate. | Abstract A325 |
| Discount rate | Report the choice of discount rate(s) used for costs and outcomes and say why appropriate. | Not reported |
| Choice of health outcomes | Describe what outcomes were used as the measure(s) of benefit in the evaluation and their relevance for the type of analysis performed. | 1713 |
| Measurement of effectiveness | Single study‐based estimates: Describe fully the design features of the single effectiveness study and why the single study was a sufficient source of clinical effectiveness data. | Abstract A325 |
| Synthesis‐based estimates: Describe fully the methods used for identification of included studies and synthesis of clinical effectiveness data. | Not applicable | |
| Measurement and valuation of preference based outcomes | If applicable, describe the population and methods used to elicit preferences for outcomes. | Not reported |
| Estimating resources and costs | Single study‐based economic evaluation: Describe approaches used to estimate resource use associated with the alternative interventions. Describe primary or secondary research methods for valuing each resource item in terms of its unit cost. Describe any adjustments made to approximate to opportunity costs. | Not reported |
| Currency, price date, and conversion | Report the dates of the estimated resource quantities and unit costs. Describe methods for adjusting estimated unit costs to the year of reported costs if necessary. Describe methods for converting costs into a common currency base and the exchange rate. | Not reported |
| Choice of model | Describe and give reasons for the specific type of decision‐analytical model used. Providing a figure to show model structure is strongly recommended. | Not applicable |
| Assumptions | Describe all structural or other assumptions underpinning the decision‐analytical model. | Not applicable |
| Analytical methods | Describe all analytical methods supporting the evaluation. This could include methods for dealing with skewed, missing, or censored data; extrapolation methods; methods for pooling data; approaches to validate or make adjustments (such as half cycle corrections) to a model; and methods for handling population heterogeneity and uncertainty. | Not applicable |
| Results | ||
| Study parameters | Report the values, ranges, references, and, if used, probability distributions for all parameters. Report reasons or sources for distributions used to represent uncertainty where appropriate. Providing a table to show the input values is strongly recommended. | Not reported |
| Incremental costs and outcomes | For each intervention, report mean values for the main categories of estimated costs and outcomes of interest, as well as mean differences between the comparator groups. If applicable, report incremental cost‐effectiveness ratios. | Abstract A325 |
| Characterising uncertainty | Single study‐based economic evaluation: Describe the effects of sampling uncertainty for the estimated incremental cost and incremental effectiveness parameters, together with the impact of methodological assumptions (such as discount rate, study perspective). | Not reported |
| Model‐based economic evaluation: Describe the effects on the results of uncertainty for all input parameters, and uncertainty related to the structure of the model and assumptions. | Not applicable | |
| Characterising heterogeneity | If applicable, report differences in costs, outcomes, or cost‐effectiveness that can be explained by variations between subgroups of patients with different baseline characteristics or other observed variability in effects that are not reducible by more information. | Not reported |
| Discussion | ||
| Study findings, limitations, generalisability, and current knowledge | Summarise key study findings and describe how they support the conclusions reached. Discuss limitations and the generalisability of the findings and how the findings fit with current knowledge. | Not reported |
| Other | ||
| Source of funding | Describe how the study was funded and the role of the funder in the identification, design, conduct, and reporting of the analysis. Describe other non‐monetary sources of support. | 1716 |
| Conflicts of interest | Describe any potential for conflict of interest of study contributors in accordance with journal policy. In the absence of a journal policy, we recommend authors comply with International Committee of Medical Journal Editors recommendations. | 1716 |
| Eccles 2007 | ||
| Title | Identify the study as an economic evaluation or use more specific terms such as “cost‐effectiveness analysis”, and describe the interventions compared. | Not reported |
| Abstract | Provide a structured summary of objectives, perspective, setting, methods (including study design and inputs), results (including base case and uncertainty analyses), and conclusions. | Not reported |
| Introduction | ||
| Background and objectives | Provide an explicit statement of the broader context for the study. | 2 |
| Present the study question and its relevance for health policy or practice decisions. | 2 | |
| Methods | ||
| Target population and subgroups | Describe characteristics of the base case population and subgroups analysed, including why they were chosen. | 2 |
| Setting and location | State relevant aspects of the system(s) in which the decision(s) need(s) to be made. | 2 |
| Study perspective | Describe the perspective of the study and relate this to the costs being evaluated. | 4 |
| Comparators | Describe the interventions or strategies being compared and state why they were chosen. | 4 |
| Time horizon | State the time horizon(s) over which costs and consequences are being evaluated and say why appropriate. | 4 |
| Discount rate | Report the choice of discount rate(s) used for costs and outcomes and say why appropriate. | |
| Choice of health outcomes | Describe what outcomes were used as the measure(s) of benefit in the evaluation and their relevance for the type of analysis performed. | 3 |
| Measurement of effectiveness | Single study‐based estimates: Describe fully the design features of the single effectiveness study and why the single study was a sufficient source of clinical effectiveness data. | Not reported |
| Synthesis‐based estimates: Describe fully the methods used for identification of included studies and synthesis of clinical effectiveness data. | Not reported | |
| Measurement and valuation of preference based outcomes | If applicable, describe the population and methods used to elicit preferences for outcomes. | 3 |
| Estimating resources and costs | Single study‐based economic evaluation: Describe approaches used to estimate resource use associated with the alternative interventions. Describe primary or secondary research methods for valuing each resource item in terms of its unit cost. Describe any adjustments made to approximate to opportunity costs. | 3 |
| Currency, price date, and conversion | Report the dates of the estimated resource quantities and unit costs. Describe methods for adjusting estimated unit costs to the year of reported costs if necessary. Describe methods for converting costs into a common currency base and the exchange rate. | 4 |
| Choice of model | Describe and give reasons for the specific type of decision‐analytical model used. Providing a figure to show model structure is strongly recommended. | Not reported |
| Assumptions | Describe all structural or other assumptions underpinning the decision‐analytical model. | Not reported |
| Analytical methods | Describe all analytical methods supporting the evaluation. This could include methods for dealing with skewed, missing, or censored data; extrapolation methods; methods for pooling data; approaches to validate or make adjustments (such as half cycle corrections) to a model; and methods for handling population heterogeneity and uncertainty. | Not reported |
| Results | ||
| Study parameters | Report the values, ranges, references, and, if used, probability distributions for all parameters. Report reasons or sources for distributions used to represent uncertainty where appropriate. Providing a table to show the input values is strongly recommended. | Not reportted |
| Incremental costs and outcomes | For each intervention, report mean values for the main categories of estimated costs and outcomes of interest, as well as mean differences between the comparator groups. If applicable, report incremental cost‐effectiveness ratios. | 8 ‐ 12 |
| Characterising uncertainty | Single study‐based economic evaluation: Describe the effects of sampling uncertainty for the estimated incremental cost and incremental effectiveness parameters, together with the impact of methodological assumptions (such as discount rate, study perspective). | Not reported |
| Model‐based economic evaluation: Describe the effects on the results of uncertainty for all input parameters, and uncertainty related to the structure of the model and assumptions. | Not reported | |
| Characterising heterogeneity | If applicable, report differences in costs, outcomes, or cost‐effectiveness that can be explained by variations between subgroups of patients with different baseline characteristics or other observed variability in effects that are not reducible by more information. | Not reported |
| Discussion | ||
| Study findings, limitations, generalisability, and current knowledge | Summarise key study findings and describe how they support the conclusions reached. Discuss limitations and the generalisability of the findings and how the findings fit with current knowledge. | 6, 10 |
| Other | ||
| Source of funding | Describe how the study was funded and the role of the funder in the identification, design, conduct, and reporting of the analysis. Describe other non‐monetary sources of support. | 11 |
| Conflicts of interest | Describe any potential for conflict of interest of study contributors in accordance with journal policy. In the absence of a journal policy, we recommend authors comply with International Committee of Medical Journal Editors recommendations. | 11 |
| Frei 2014 | ||
| Title | Identify the study as an economic evaluation or use more specific terms such as “cost‐effectiveness analysis”, and describe the interventions compared. | Not reported |
| Abstract | Provide a structured summary of objectives, perspective, setting, methods (including study design and inputs), results (including base case and uncertainty analyses), and conclusions. | Not reported |
| Introduction | ||
| Background and objectives | Provide an explicit statement of the broader context for the study. | 1040 |
| Present the study question and its relevance for health policy or practice decisions. | 1040 | |
| Methods | ||
| Target population and subgroups | Describe characteristics of the base case population and subgroups analysed, including why they were chosen. | 1043 |
| Setting and location | State relevant aspects of the system(s) in which the decision(s) need(s) to be made. | 1040 |
| Study perspective | Describe the perspective of the study and relate this to the costs being evaluated. | Not reported |
| Comparators | Describe the interventions or strategies being compared and state why they were chosen. | 1040 |
| Time horizon | State the time horizon(s) over which costs and consequences are being evaluated and say why appropriate. | Not reported |
| Discount rate | Report the choice of discount rate(s) used for costs and outcomes and say why appropriate. | Not reported |
| Choice of health outcomes | Describe what outcomes were used as the measure(s) of benefit in the evaluation and their relevance for the type of analysis performed. | Not reported |
| Measurement of effectiveness | Single study‐based estimates: Describe fully the design features of the single effectiveness study and why the single study was a sufficient source of clinical effectiveness data. | Not reported |
| Synthesis‐based estimates: Describe fully the methods used for identification of included studies and synthesis of clinical effectiveness data. | Not applicable | |
| Measurement and valuation of preference based outcomes | If applicable, describe the population and methods used to elicit preferences for outcomes. | Not reported |
| Estimating resources and costs | Single study‐based economic evaluation: Describe approaches used to estimate resource use associated with the alternative interventions. Describe primary or secondary research methods for valuing each resource item in terms of its unit cost. Describe any adjustments made to approximate to opportunity costs. | Not reported |
| Currency, price date, and conversion | Report the dates of the estimated resource quantities and unit costs. Describe methods for adjusting estimated unit costs to the year of reported costs if necessary. Describe methods for converting costs into a common currency base and the exchange rate. | Not reported |
| Choice of model | Describe and give reasons for the specific type of decision‐analytical model used. Providing a figure to show model structure is strongly recommended. | Not applicable |
| Assumptions | Describe all structural or other assumptions underpinning the decision‐analytical model. | Not applicable |
| Analytical methods | Describe all analytical methods supporting the evaluation. This could include methods for dealing with skewed, missing, or censored data; extrapolation methods; methods for pooling data; approaches to validate or make adjustments (such as half cycle corrections) to a model; and methods for handling population heterogeneity and uncertainty. | Not applicable |
| Results | ||
| Study parameters | Report the values, ranges, references, and, if used, probability distributions for all parameters. Report reasons or sources for distributions used to represent uncertainty where appropriate. Providing a table to show the input values is strongly recommended. | Not reported |
| Incremental costs and outcomes | For each intervention, report mean values for the main categories of estimated costs and outcomes of interest, as well as mean differences between the comparator groups. If applicable, report incremental cost‐effectiveness ratios. | Not reported |
| Characterising uncertainty | Single study‐based economic evaluation: Describe the effects of sampling uncertainty for the estimated incremental cost and incremental effectiveness parameters, together with the impact of methodological assumptions (such as discount rate, study perspective). | Not reported |
| Model‐based economic evaluation: Describe the effects on the results of uncertainty for all input parameters, and uncertainty related to the structure of the model and assumptions. | Not applicable | |
| Characterising heterogeneity | If applicable, report differences in costs, outcomes, or cost‐effectiveness that can be explained by variations between subgroups of patients with different baseline characteristics or other observed variability in effects that are not reducible by more information. | Not reported |
| Discussion | ||
| Study findings, limitations, generalisability, and current knowledge | Summarise key study findings and describe how they support the conclusions reached. Discuss limitations and the generalisability of the findings and how the findings fit with current knowledge. | 1045 |
| Other | ||
| Source of funding | Describe how the study was funded and the role of the funder in the identification, design, conduct, and reporting of the analysis. Describe other non‐monetary sources of support. | 1045 |
| Conflicts of interest | Describe any potential for conflict of interest of study contributors in accordance with journal policy. In the absence of a journal policy, we recommend authors comply with International Committee of Medical Journal Editors recommendations. | 1045 |
| Frijling 2002 | ||
| Title | Identify the study as an economic evaluation or use more specific terms such as “cost‐effectiveness analysis”, and describe the interventions compared. | Not reported |
| Abstract | Provide a structured summary of objectives, perspective, setting, methods (including study design and inputs), results (including base case and uncertainty analyses), and conclusions. | Not reported |
| Introduction | ||
| Background and objectives | Provide an explicit statement of the broader context for the study. | 837 |
| Present the study question and its relevance for health policy or practice decisions. | 837 | |
| Methods | ||
| Target population and subgroups | Describe characteristics of the base case population and subgroups analysed, including why they were chosen. | 838 |
| Setting and location | State relevant aspects of the system(s) in which the decision(s) need(s) to be made. | 838 |
| Study perspective | Describe the perspective of the study and relate this to the costs being evaluated. | Not reported |
| Comparators | Describe the interventions or strategies being compared and state why they were chosen. | 837 |
| Time horizon | State the time horizon(s) over which costs and consequences are being evaluated and say why appropriate. | Not reported |
| Discount rate | Report the choice of discount rate(s) used for costs and outcomes and say why appropriate. | Not reported |
| Choice of health outcomes | Describe what outcomes were used as the measure(s) of benefit in the evaluation and their relevance for the type of analysis performed. | Not reported |
| Measurement of effectiveness | Single study‐based estimates: Describe fully the design features of the single effectiveness study and why the single study was a sufficient source of clinical effectiveness data. | Not reported |
| Synthesis‐based estimates: Describe fully the methods used for identification of included studies and synthesis of clinical effectiveness data. | Not applicable | |
| Measurement and valuation of preference based outcomes | If applicable, describe the population and methods used to elicit preferences for outcomes. | Not reported |
| Estimating resources and costs | Single study‐based economic evaluation: Describe approaches used to estimate resource use associated with the alternative interventions. Describe primary or secondary research methods for valuing each resource item in terms of its unit cost. Describe any adjustments made to approximate to opportunity costs. | Not reported |
| Currency, price date, and conversion | Report the dates of the estimated resource quantities and unit costs. Describe methods for adjusting estimated unit costs to the year of reported costs if necessary. Describe methods for converting costs into a common currency base and the exchange rate. | Not reported |
| Choice of model | Describe and give reasons for the specific type of decision‐analytical model used. Providing a figure to show model structure is strongly recommended. | Not applicable |
| Assumptions | Describe all structural or other assumptions underpinning the decision‐analytical model. | Not applicable |
| Analytical methods | Describe all analytical methods supporting the evaluation. This could include methods for dealing with skewed, missing, or censored data; extrapolation methods; methods for pooling data; approaches to validate or make adjustments (such as half cycle corrections) to a model; and methods for handling population heterogeneity and uncertainty. | Not reported |
| Results | ||
| Study parameters | Report the values, ranges, references, and, if used, probability distributions for all parameters. Report reasons or sources for distributions used to represent uncertainty where appropriate. Providing a table to show the input values is strongly recommended. | Not reported |
| Incremental costs and outcomes | For each intervention, report mean values for the main categories of estimated costs and outcomes of interest, as well as mean differences between the comparator groups. If applicable, report incremental cost‐effectiveness ratios. | Not reported |
| Characterising uncertainty | Single study‐based economic evaluation: Describe the effects of sampling uncertainty for the estimated incremental cost and incremental effectiveness parameters, together with the impact of methodological assumptions (such as discount rate, study perspective). | Not reported |
| Model‐based economic evaluation: Describe the effects on the results of uncertainty for all input parameters, and uncertainty related to the structure of the model and assumptions. | Not applicable | |
| Characterising heterogeneity | If applicable, report differences in costs, outcomes, or cost‐effectiveness that can be explained by variations between subgroups of patients with different baseline characteristics or other observed variability in effects that are not reducible by more information. | Not applicable |
| Discussion | ||
| Study findings, limitations, generalisability, and current knowledge | Summarise key study findings and describe how they support the conclusions reached. Discuss limitations and the generalisability of the findings and how the findings fit with current knowledge. | 841 |
| Other | ||
| Source of funding | Describe how the study was funded and the role of the funder in the identification, design, conduct, and reporting of the analysis. Describe other non‐monetary sources of support. | 841 |
| Conflicts of interest | Describe any potential for conflict of interest of study contributors in accordance with journal policy. In the absence of a journal policy, we recommend authors comply with International Committee of Medical Journal Editors recommendations. | Not reported |
| Krein 2004 | ||
| Title | Identify the study as an economic evaluation or use more specific terms such as “cost‐effectiveness analysis”, and describe the interventions compared. | Not reported |
| Abstract | Provide a structured summary of objectives, perspective, setting, methods (including study design and inputs), results (including base case and uncertainty analyses), and conclusions. | Not reported |
| Introduction | ||
| Background and objectives | Provide an explicit statement of the broader context for the study. | 732 |
| Present the study question and its relevance for health policy or practice decisions. | 732 | |
| Methods | ||
| Target population and subgroups | Describe characteristics of the base case population and subgroups analysed, including why they were chosen. | 733 |
| Setting and location | State relevant aspects of the system(s) in which the decision(s) need(s) to be made. | 733 |
| Study perspective | Describe the perspective of the study and relate this to the costs being evaluated. | Not reported |
| Comparators | Describe the interventions or strategies being compared and state why they were chosen. | 733 |
| Time horizon | State the time horizon(s) over which costs and consequences are being evaluated and say why appropriate. | Not reported |
| Discount rate | Report the choice of discount rate(s) used for costs and outcomes and say why appropriate. | Not reported |
| Choice of health outcomes | Describe what outcomes were used as the measure(s) of benefit in the evaluation and their relevance for the type of analysis performed. | Not reported |
| Measurement of effectiveness | Single study‐based estimates: Describe fully the design features of the single effectiveness study and why the single study was a sufficient source of clinical effectiveness data. | Not reported |
| Synthesis‐based estimates: Describe fully the methods used for identification of included studies and synthesis of clinical effectiveness data. | ||
| Measurement and valuation of preference based outcomes | If applicable, describe the population and methods used to elicit preferences for outcomes. | Not reported |
| Estimating resources and costs | Single study‐based economic evaluation: Describe approaches used to estimate resource use associated with the alternative interventions. Describe primary or secondary research methods for valuing each resource item in terms of its unit cost. Describe any adjustments made to approximate to opportunity costs. | Not reported |
| Currency, price date, and conversion | Report the dates of the estimated resource quantities and unit costs. Describe methods for adjusting estimated unit costs to the year of reported costs if necessary. Describe methods for converting costs into a common currency base and the exchange rate. | Not reported |
| Choice of model | Describe and give reasons for the specific type of decision‐analytical model used. Providing a figure to show model structure is strongly recommended. | |
| Assumptions | Describe all structural or other assumptions underpinning the decision‐analytical model. | Not reported |
| Analytical methods | Describe all analytical methods supporting the evaluation. This could include methods for dealing with skewed, missing, or censored data; extrapolation methods; methods for pooling data; approaches to validate or make adjustments (such as half cycle corrections) to a model; and methods for handling population heterogeneity and uncertainty. | Not reported |
| Results | ||
| Study parameters | Report the values, ranges, references, and, if used, probability distributions for all parameters. Report reasons or sources for distributions used to represent uncertainty where appropriate. Providing a table to show the input values is strongly recommended. | Not reported |
| Incremental costs and outcomes | For each intervention, report mean values for the main categories of estimated costs and outcomes of interest, as well as mean differences between the comparator groups. If applicable, report incremental cost‐effectiveness ratios. | Not reported |
| Characterising uncertainty | Single study‐based economic evaluation: Describe the effects of sampling uncertainty for the estimated incremental cost and incremental effectiveness parameters, together with the impact of methodological assumptions (such as discount rate, study perspective). | Not reported |
| Model‐based economic evaluation: Describe the effects on the results of uncertainty for all input parameters, and uncertainty related to the structure of the model and assumptions. | Not applicable | |
| Characterising heterogeneity | If applicable, report differences in costs, outcomes, or cost‐effectiveness that can be explained by variations between subgroups of patients with different baseline characteristics or other observed variability in effects that are not reducible by more information. | Not applicable |
| Discussion | ||
| Study findings, limitations, generalisability, and current knowledge | Summarise key study findings and describe how they support the conclusions reached. Discuss limitations and the generalisability of the findings and how the findings fit with current knowledge. | 738 |
| Other | ||
| Source of funding | Describe how the study was funded and the role of the funder in the identification, design, conduct, and reporting of the analysis. Describe other non‐monetary sources of support. | 732 |
| Conflicts of interest | Describe any potential for conflict of interest of study contributors in accordance with journal policy. In the absence of a journal policy, we recommend authors comply with International Committee of Medical Journal Editors recommendations. | Not reported |
| Litaker 2003 | ||
| Title | Identify the study as an economic evaluation or use more specific terms such as “cost‐effectiveness analysis”, and describe the interventions compared. | front page |
| Abstract | Provide a structured summary of objectives, perspective, setting, methods (including study design and inputs), results (including base case and uncertainty analyses), and conclusions. | Not reported |
| Introduction | ||
| Background and objectives | Provide an explicit statement of the broader context for the study. | 224 |
| Present the study question and its relevance for health policy or practice decisions. | 224 | |
| Methods | ||
| Target population and subgroups | Describe characteristics of the base case population and subgroups analysed, including why they were chosen. | 225 |
| Setting and location | State relevant aspects of the system(s) in which the decision(s) need(s) to be made. | 225 |
| Study perspective | Describe the perspective of the study and relate this to the costs being evaluated. | Not reported |
| Comparators | Describe the interventions or strategies being compared and state why they were chosen. | 226 |
| Time horizon | State the time horizon(s) over which costs and consequences are being evaluated and say why appropriate. | Not reported |
| Discount rate | Report the choice of discount rate(s) used for costs and outcomes and say why appropriate. | Not reported |
| Choice of health outcomes | Describe what outcomes were used as the measure(s) of benefit in the evaluation and their relevance for the type of analysis performed. | Not reported |
| Measurement of effectiveness | Single study‐based estimates: Describe fully the design features of the single effectiveness study and why the single study was a sufficient source of clinical effectiveness data. | Not reported |
| Synthesis‐based estimates: Describe fully the methods used for identification of included studies and synthesis of clinical effectiveness data. | Not reported | |
| Measurement and valuation of preference based outcomes | If applicable, describe the population and methods used to elicit preferences for outcomes. | 226 |
| Estimating resources and costs | Single study‐based economic evaluation: Describe approaches used to estimate resource use associated with the alternative interventions. Describe primary or secondary research methods for valuing each resource item in terms of its unit cost. Describe any adjustments made to approximate to opportunity costs. | Not reported |
| Currency, price date, and conversion | Report the dates of the estimated resource quantities and unit costs. Describe methods for adjusting estimated unit costs to the year of reported costs if necessary. Describe methods for converting costs into a common currency base and the exchange rate. | Not reported |
| Choice of model | Describe and give reasons for the specific type of decision‐analytical model used. Providing a figure to show model structure is strongly recommended. | Not applicable |
| Assumptions | Describe all structural or other assumptions underpinning the decision‐analytical model. | Not applicable |
| Analytical methods | Describe all analytical methods supporting the evaluation. This could include methods for dealing with skewed, missing, or censored data; extrapolation methods; methods for pooling data; approaches to validate or make adjustments (such as half cycle corrections) to a model; and methods for handling population heterogeneity and uncertainty. | Not applicable |
| Results | ||
| Study parameters | Report the values, ranges, references, and, if used, probability distributions for all parameters. Report reasons or sources for distributions used to represent uncertainty where appropriate. Providing a table to show the input values is strongly recommended. | Not reported |
| Incremental costs and outcomes | For each intervention, report mean values for the main categories of estimated costs and outcomes of interest, as well as mean differences between the comparator groups. If applicable, report incremental cost‐effectiveness ratios. | Not reported |
| Characterising uncertainty | Single study‐based economic evaluation: Describe the effects of sampling uncertainty for the estimated incremental cost and incremental effectiveness parameters, together with the impact of methodological assumptions (such as discount rate, study perspective). | Not reported |
| Model‐based economic evaluation: Describe the effects on the results of uncertainty for all input parameters, and uncertainty related to the structure of the model and assumptions. | Not applicable | |
| Characterising heterogeneity | If applicable, report differences in costs, outcomes, or cost‐effectiveness that can be explained by variations between subgroups of patients with different baseline characteristics or other observed variability in effects that are not reducible by more information. | 232 |
| Discussion | ||
| Study findings, limitations, generalisability, and current knowledge | Summarise key study findings and describe how they support the conclusions reached. Discuss limitations and the generalisability of the findings and how the findings fit with current knowledge. | 234 |
| Other | ||
| Source of funding | Describe how the study was funded and the role of the funder in the identification, design, conduct, and reporting of the analysis. Describe other non‐monetary sources of support. | 235 |
| Conflicts of interest | Describe any potential for conflict of interest of study contributors in accordance with journal policy. In the absence of a journal policy, we recommend authors comply with International Committee of Medical Journal Editors recommendations. | Not reported |
| McCall 2011 | ||
| Title | Identify the study as an economic evaluation or use more specific terms such as “cost‐effectiveness analysis”, and describe the interventions compared. | Not reported |
| Abstract | Provide a structured summary of objectives, perspective, setting, methods (including study design and inputs), results (including base case and uncertainty analyses), and conclusions. | Not reported |
| Introduction | ||
| Background and objectives | Provide an explicit statement of the broader context for the study. | 1705 |
| Present the study question and its relevance for health policy or practice decisions. | 1706 | |
| Methods | ||
| Target population and subgroups | Describe characteristics of the base case population and subgroups analysed, including why they were chosen. | 1708 |
| Setting and location | State relevant aspects of the system(s) in which the decision(s) need(s) to be made. | 1705 |
| Study perspective | Describe the perspective of the study and relate this to the costs being evaluated. | Not reported |
| Comparators | Describe the interventions or strategies being compared and state why they were chosen. | Not reported |
| Time horizon | State the time horizon(s) over which costs and consequences are being evaluated and say why appropriate. | Not reported |
| Discount rate | Report the choice of discount rate(s) used for costs and outcomes and say why appropriate. | Not reported |
| Choice of health outcomes | Describe what outcomes were used as the measure(s) of benefit in the evaluation and their relevance for the type of analysis performed. | Not reported |
| Measurement of effectiveness | Single study‐based estimates: Describe fully the design features of the single effectiveness study and why the single study was a sufficient source of clinical effectiveness data. | Not reported |
| Synthesis‐based estimates: Describe fully the methods used for identification of included studies and synthesis of clinical effectiveness data. | Not applicable | |
| Measurement and valuation of preference based outcomes | If applicable, describe the population and methods used to elicit preferences for outcomes. | Not applicable |
| Estimating resources and costs | Single study‐based economic evaluation: Describe approaches used to estimate resource use associated with the alternative interventions. Describe primary or secondary research methods for valuing each resource item in terms of its unit cost. Describe any adjustments made to approximate to opportunity costs. | Not reported |
| Currency, price date, and conversion | Report the dates of the estimated resource quantities and unit costs. Describe methods for adjusting estimated unit costs to the year of reported costs if necessary. Describe methods for converting costs into a common currency base and the exchange rate. | Not reported |
| Choice of model | Describe and give reasons for the specific type of decision‐analytical model used. Providing a figure to show model structure is strongly recommended. | Not applicable |
| Assumptions | Describe all structural or other assumptions underpinning the decision‐analytical model. | Not applicable |
| Analytical methods | Describe all analytical methods supporting the evaluation. This could include methods for dealing with skewed, missing, or censored data; extrapolation methods; methods for pooling data; approaches to validate or make adjustments (such as half cycle corrections) to a model; and methods for handling population heterogeneity and uncertainty. | Not applicable |
| Results | ||
| Study parameters | Report the values, ranges, references, and, if used, probability distributions for all parameters. Report reasons or sources for distributions used to represent uncertainty where appropriate. Providing a table to show the input values is strongly recommended. | Not reported |
| Incremental costs and outcomes | For each intervention, report mean values for the main categories of estimated costs and outcomes of interest, as well as mean differences between the comparator groups. If applicable, report incremental cost‐effectiveness ratios. | Not reported |
| Characterising uncertainty | Single study‐based economic evaluation: Describe the effects of sampling uncertainty for the estimated incremental cost and incremental effectiveness parameters, together with the impact of methodological assumptions (such as discount rate, study perspective). | Not reported |
| Model‐based economic evaluation: Describe the effects on the results of uncertainty for all input parameters, and uncertainty related to the structure of the model and assumptions | Not applicable | |
| Characterising heterogeneity | If applicable, report differences in costs, outcomes, or cost‐effectiveness that can be explained by variations between subgroups of patients with different baseline characteristics or other observed variability in effects that are not reducible by more information. | Not applicable |
| Discussion | ||
| Study findings, limitations, generalisability, and current knowledge | Summarise key study findings and describe how they support the conclusions reached. Discuss limitations and the generalisability of the findings and how the findings fit with current knowledge. | 1712 |
| Other | ||
| Source of funding | Describe how the study was funded and the role of the funder in the identification, design, conduct, and reporting of the analysis. Describe other non‐monetary sources of support. | Not reported |
| Conflicts of interest | Describe any potential for conflict of interest of study contributors in accordance with journal policy. In the absence of a journal policy, we recommend authors comply with International Committee of Medical Journal Editors recommendations. | Not reported |
| Piette 2001 | ||
| Title | Identify the study as an economic evaluation or use more specific terms such as “cost‐effectiveness analysis”, and describe the interventions compared. | Not reported |
| Abstract | Provide a structured summary of objectives, perspective, setting, methods (including study design and inputs), results (including base case and uncertainty analyses), and conclusions. | Not reported |
| Introduction | ||
| Background and objectives | Provide an explicit statement of the broader context for the study. | 202 ‐ 203 |
| Present the study question and its relevance for health policy or practice decisions. | Not reported | |
| Methods | ||
| Target population and subgroups | Describe characteristics of the base case population and subgroups analysed, including why they were chosen. | 204 |
| Setting and location | State relevant aspects of the system(s) in which the decision(s) need(s) to be made. | 203 |
| Study perspective | Describe the perspective of the study and relate this to the costs being evaluated. | Not reported |
| Comparators | Describe the interventions or strategies being compared and state why they were chosen. | 177 |
| Time horizon | State the time horizon(s) over which costs and consequences are being evaluated and say why appropriate. | Not reported |
| Discount rate | Report the choice of discount rate(s) used for costs and outcomes and say why appropriate. | Not reported |
| Choice of health outcomes | Describe what outcomes were used as the measure(s) of benefit in the evaluation and their relevance for the type of analysis performed. | Not reported |
| Measurement of effectiveness | Single study‐based estimates: Describe fully the design features of the single effectiveness study and why the single study was a sufficient source of clinical effectiveness data. | Not reported |
| Synthesis‐based estimates: Describe fully the methods used for identification of included studies and synthesis of clinical effectiveness data. | Not applicable | |
| Measurement and valuation of preference based outcomes | If applicable, describe the population and methods used to elicit preferences for outcomes. | Not applicable |
| Estimating resources and costs | Single study‐based economic evaluation: Describe approaches used to estimate resource use associated with the alternative interventions. Describe primary or secondary research methods for valuing each resource item in terms of its unit cost. Describe any adjustments made to approximate to opportunity costs. | Not reported |
| Currency, price date, and conversion | Report the dates of the estimated resource quantities and unit costs. Describe methods for adjusting estimated unit costs to the year of reported costs if necessary. Describe methods for converting costs into a common currency base and the exchange rate. | Not reported |
| Choice of model | Describe and give reasons for the specific type of decision‐analytical model used. Providing a figure to show model structure is strongly recommended. | Not applicable |
| Assumptions | Describe all structural or other assumptions underpinning the decision‐analytical model. | Not applicable |
| Analytical methods | Describe all analytical methods supporting the evaluation. This could include methods for dealing with skewed, missing, or censored data; extrapolation methods; methods for pooling data; approaches to validate or make adjustments (such as half cycle corrections) to a model; and methods for handling population heterogeneity and uncertainty. | Not applicable |
| Results | ||
| Study parameters | Report the values, ranges, references, and, if used, probability distributions for all parameters. Report reasons or sources for distributions used to represent uncertainty where appropriate. Providing a table to show the input values is strongly recommended. | Not reported |
| Incremental costs and outcomes | For each intervention, report mean values for the main categories of estimated costs and outcomes of interest, as well as mean differences between the comparator groups. If applicable, report incremental cost‐effectiveness ratios. | Not reported |
| Characterising uncertainty | Single study‐based economic evaluation: Describe the effects of sampling uncertainty for the estimated incremental cost and incremental effectiveness parameters, together with the impact of methodological assumptions (such as discount rate, study perspective). | Not reported |
| Model‐based economic evaluation: Describe the effects on the results of uncertainty for all input parameters, and uncertainty related to the structure of the model and assumptions. | Not applicable | |
| Characterising heterogeneity | If applicable, report differences in costs, outcomes, or cost‐effectiveness that can be explained by variations between subgroups of patients with different baseline characteristics or other observed variability in effects that are not reducible by more information. | Not reported |
| Discussion | ||
| Study findings, limitations, generalisability, and current knowledge | Summarise key study findings and describe how they support the conclusions reached. Discuss limitations and the generalisability of the findings and how the findings fit with current knowledge. | 207 |
| Other | ||
| Source of funding | Describe how the study was funded and the role of the funder in the identification, design, conduct, and reporting of the analysis. Describe other non‐monetary sources of support. | 207 |
| Conflicts of interest | Describe any potential for conflict of interest of study contributors in accordance with journal policy. In the absence of a journal policy, we recommend authors comply with International Committee of Medical Journal Editors recommendations. | Not reported |
| Pizzi 2015 | ||
| Title | Identify the study as an economic evaluation or use more specific terms such as “cost‐effectiveness analysis”, and describe the interventions compared. | front page |
| Abstract | Provide a structured summary of objectives, perspective, setting, methods (including study design and inputs), results (including base case and uncertainty analyses), and conclusions. | front page |
| Introduction | ||
| Background and objectives | Provide an explicit statement of the broader context for the study. | 254 |
| Present the study question and its relevance for health policy or practice decisions. | 254 | |
| Methods | ||
| Target population and subgroups | Describe characteristics of the base case population and subgroups analysed, including why they were chosen. | 254 |
| Setting and location | State relevant aspects of the system(s) in which the decision(s) need(s) to be made. | 254 |
| Study perspective | Describe the perspective of the study and relate this to the costs being evaluated. | 255 |
| Comparators | Describe the interventions or strategies being compared and state why they were chosen. | 254 |
| Time horizon | State the time horizon(s) over which costs and consequences are being evaluated and say why appropriate. | 256 |
| Discount rate | Report the choice of discount rate(s) used for costs and outcomes and say why appropriate. | 256 |
| Choice of health outcomes | Describe what outcomes were used as the measure(s) of benefit in the evaluation and their relevance for the type of analysis performed. | 255 |
| Measurement of effectiveness | Single study‐based estimates: Describe fully the design features of the single effectiveness study and why the single study was a sufficient source of clinical effectiveness data. | 254 ‐ 255 |
| Synthesis‐based estimates: Describe fully the methods used for identification of included studies and synthesis of clinical effectiveness data. | Not reported | |
| Measurement and valuation of preference based outcomes | If applicable, describe the population and methods used to elicit preferences for outcomes. | Not applicable |
| Estimating resources and costs | Single study‐based economic evaluation: Describe approaches used to estimate resource use associated with the alternative interventions. Describe primary or secondary research methods for valuing each resource item in terms of its unit cost. Describe any adjustments made to approximate to opportunity costs. | 256 |
| Currency, price date, and conversion | Report the dates of the estimated resource quantities and unit costs. Describe methods for adjusting estimated unit costs to the year of reported costs if necessary. Describe methods for converting costs into a common currency base and the exchange rate. | 256 |
| Choice of model | Describe and give reasons for the specific type of decision‐analytical model used. Providing a figure to show model structure is strongly recommended. | 256 |
| Assumptions | Describe all structural or other assumptions underpinning the decision‐analytical model. | 256 ‐ 257 |
| Analytical methods | Describe all analytical methods supporting the evaluation. This could include methods for dealing with skewed, missing, or censored data; extrapolation methods; methods for pooling data; approaches to validate or make adjustments (such as half cycle corrections) to a model; and methods for handling population heterogeneity and uncertainty. | 256 |
| Results | ||
| Study parameters | Report the values, ranges, references, and, if used, probability distributions for all parameters. Report reasons or sources for distributions used to represent uncertainty where appropriate. Providing a table to show the input values is strongly recommended. | 258 ‐ 259 |
| Incremental costs and outcomes | For each intervention, report mean values for the main categories of estimated costs and outcomes of interest, as well as mean differences between the comparator groups. If applicable, report incremental cost‐effectiveness ratios. | 260 |
| Characterising uncertainty | Single study‐based economic evaluation: Describe the effects of sampling uncertainty for the estimated incremental cost and incremental effectiveness parameters, together with the impact of methodological assumptions (such as discount rate, study perspective). | 258 ‐ 260 |
| Model‐based economic evaluation: Describe the effects on the results of uncertainty for all input parameters, and uncertainty related to the structure of the model and assumptions. | Not reported | |
| Characterising heterogeneity | If applicable, report differences in costs, outcomes, or cost‐effectiveness that can be explained by variations between subgroups of patients with different baseline characteristics or other observed variability in effects that are not reducible by more information. | 258 ‐ 260 |
| Discussion | ||
| Study findings, limitations, generalisability, and current knowledge | Summarise key study findings and describe how they support the conclusions reached. Discuss limitations and the generalisability of the findings and how the findings fit with current knowledge. | 261 ‐ 262 |
| Other | ||
| Source of funding | Describe how the study was funded and the role of the funder in the identification, design, conduct, and reporting of the analysis. Describe other non‐monetary sources of support. | 263 |
| Conflicts of interest | Describe any potential for conflict of interest of study contributors in accordance with journal policy. In the absence of a journal policy, we recommend authors comply with International Committee of Medical Journal Editors recommendations. | 263 |
| Prezio 2014 | ||
| Title | Identify the study as an economic evaluation or use more specific terms such as “cost‐effectiveness analysis”, and describe the interventions compared. | 771 |
| Abstract | Provide a structured summary of objectives, perspective, setting, methods (including study design and inputs), results (including base case and uncertainty analyses), and conclusions. | 771 |
| Introduction | ||
| Background and objectives | Provide an explicit statement of the broader context for the study. | 772 |
| Present the study question and its relevance for health policy or practice decisions. | 772 | |
| Methods | ||
| Target population and subgroups | Describe characteristics of the base case population and subgroups analysed, including why they were chosen. | 772 |
| Setting and location | State relevant aspects of the system(s) in which the decision(s) need(s) to be made. | 772 |
| Study perspective | Describe the perspective of the study and relate this to the costs being evaluated. | 772 |
| Comparators | Describe the interventions or strategies being compared and state why they were chosen. | 772 |
| Time horizon | State the time horizon(s) over which costs and consequences are being evaluated and say why appropriate. | 772 |
| Discount rate | Report the choice of discount rate(s) used for costs and outcomes and say why appropriate. | 772 |
| Choice of health outcomes | Describe what outcomes were used as the measure(s) of benefit in the evaluation and their relevance for the type of analysis performed. | 774 |
| Measurement of effectiveness | Single study‐based estimates: Describe fully the design features of the single effectiveness study and why the single study was a sufficient source of clinical effectiveness data. | 772 |
| Synthesis‐based estimates: Describe fully the methods used for identification of included studies and synthesis of clinical effectiveness data. | Not reported | |
| Measurement and valuation of preference based outcomes | If applicable, describe the population and methods used to elicit preferences for outcomes. | Not applicable |
| Estimating resources and costs | Single study‐based economic evaluation: Describe approaches used to estimate resource use associated with the alternative interventions. Describe primary or secondary research methods for valuing each resource item in terms of its unit cost. Describe any adjustments made to approximate to opportunity costs. | 772 |
| Currency, price date, and conversion | Report the dates of the estimated resource quantities and unit costs. Describe methods for adjusting estimated unit costs to the year of reported costs if necessary. Describe methods for converting costs into a common currency base and the exchange rate. | 772 |
| Choice of model | Describe and give reasons for the specific type of decision‐analytical model used. Providing a figure to show model structure is strongly recommended. | 772 |
| Assumptions | Describe all structural or other assumptions underpinning the decision‐analytical model. | 772 ‐ 774 |
| Analytical methods | Describe all analytical methods supporting the evaluation. This could include methods for dealing with skewed, missing, or censored data; extrapolation methods; methods for pooling data; approaches to validate or make adjustments (such as half cycle corrections) to a model; and methods for handling population heterogeneity and uncertainty. | 774 |
| Results | ||
| Study parameters | Report the values, ranges, references, and, if used, probability distributions for all parameters. Report reasons or sources for distributions used to represent uncertainty where appropriate. Providing a table to show the input values is strongly recommended. | 774 ‐ 776 |
| Incremental costs and outcomes | For each intervention, report mean values for the main categories of estimated costs and outcomes of interest, as well as mean differences between the comparator groups. If applicable, report incremental cost‐effectiveness ratios. | 777 |
| Characterising uncertainty | Single study‐based economic evaluation: Describe the effects of sampling uncertainty for the estimated incremental cost and incremental effectiveness parameters, together with the impact of methodological assumptions (such as discount rate, study perspective). | 776 ‐ 777 |
| Model‐based economic evaluation: Describe the effects on the results of uncertainty for all input parameters, and uncertainty related to the structure of the model and assumptions. | Not applicable | |
| Characterising heterogeneity | If applicable, report differences in costs, outcomes, or cost‐effectiveness that can be explained by variations between subgroups of patients with different baseline characteristics or other observed variability in effects that are not reducible by more information. | 777 |
| Discussion | ||
| Study findings, limitations, generalisability, and current knowledge | Summarise key study findings and describe how they support the conclusions reached. Discuss limitations and the generalisability of the findings and how the findings fit with current knowledge. | 775 |
| Other | ||
| Source of funding | Describe how the study was funded and the role of the funder in the identification, design, conduct, and reporting of the analysis. Describe other non‐monetary sources of support. | 778 |
| Conflicts of interest | Describe any potential for conflict of interest of study contributors in accordance with journal policy. In the absence of a journal policy, we recommend authors comply with International Committee of Medical Journal Editors recommendations. | 778 |
| Schechter 2008 | ||
| Title | Identify the study as an economic evaluation or use more specific terms such as “cost‐effectiveness analysis”, and describe the interventions compared. | 763 |
| Abstract | Provide a structured summary of objectives, perspective, setting, methods (including study design and inputs), results (including base case and uncertainty analyses), and conclusions. | 763 |
| Introduction | ||
| Background and objectives | Provide an explicit statement of the broader context for the study. | 763 ‐ 764 |
| Present the study question and its relevance for health policy or practice decisions. | 764 | |
| Methods | ||
| Target population and subgroups | Describe characteristics of the base case population and subgroups analysed, including why they were chosen. | 764 |
| Setting and location | State relevant aspects of the system(s) in which the decision(s) need(s) to be made. | 764 |
| Study perspective | Describe the perspective of the study and relate this to the costs being evaluated. | 764 |
| Comparators | Describe the interventions or strategies being compared and state why they were chosen. | 764 |
| Time horizon | State the time horizon(s) over which costs and consequences are being evaluated and say why appropriate. | 764 |
| Discount rate | Report the choice of discount rate(s) used for costs and outcomes and say why appropriate. | 765 |
| Choice of health outcomes | Describe what outcomes were used as the measure(s) of benefit in the evaluation and their relevance for the type of analysis performed. | 764 |
| Measurement of effectiveness | Single study‐based estimates: Describe fully the design features of the single effectiveness study and why the single study was a sufficient source of clinical effectiveness data. | 764 |
| Synthesis‐based estimates: Describe fully the methods used for identification of included studies and synthesis of clinical effectiveness data. | Not applicable | |
| Measurement and valuation of preference based outcomes | If applicable, describe the population and methods used to elicit preferences for outcomes. | 765 |
| Estimating resources and costs | Single study‐based economic evaluation: Describe approaches used to estimate resource use associated with the alternative interventions. Describe primary or secondary research methods for valuing each resource item in terms of its unit cost. Describe any adjustments made to approximate to opportunity costs. | 764 |
| Currency, price date, and conversion | Report the dates of the estimated resource quantities and unit costs. Describe methods for adjusting estimated unit costs to the year of reported costs if necessary. Describe methods for converting costs into a common currency base and the exchange rate. | 764 |
| Choice of model | Describe and give reasons for the specific type of decision‐analytical model used. Providing a figure to show model structure is strongly recommended. | Not applicable |
| Assumptions | Describe all structural or other assumptions underpinning the decision‐analytical model. | Not applicable |
| Analytical methods | Describe all analytical methods supporting the evaluation. This could include methods for dealing with skewed, missing, or censored data; extrapolation methods; methods for pooling data; approaches to validate or make adjustments (such as half cycle corrections) to a model; and methods for handling population heterogeneity and uncertainty. | 765 |
| Results | ||
| Study parameters | Report the values, ranges, references, and, if used, probability distributions for all parameters. Report reasons or sources for distributions used to represent uncertainty where appropriate. Providing a table to show the input values is strongly recommended. | 766 |
| Incremental costs and outcomes | For each intervention, report mean values for the main categories of estimated costs and outcomes of interest, as well as mean differences between the comparator groups. If applicable, report incremental cost‐effectiveness ratios. | 765 |
| Characterising uncertainty | Single study‐based economic evaluation: Describe the effects of sampling uncertainty for the estimated incremental cost and incremental effectiveness parameters, together with the impact of methodological assumptions (such as discount rate, study perspective) | 766 |
| Model‐based economic evaluation: Describe the effects on the results of uncertainty for all input parameters, and uncertainty related to the structure of the model and assumptions. | Not applicable | |
| Characterising heterogeneity | If applicable, report differences in costs, outcomes, or cost‐effectiveness that can be explained by variations between subgroups of patients with different baseline characteristics or other observed variability in effects that are not reducible by more information. | 765 |
| Discussion | ||
| Study findings, limitations, generalisability, and current knowledge | Summarise key study findings and describe how they support the conclusions reached. Discuss limitations and the generalisability of the findings and how the findings fit with current knowledge. | 767 |
| Other | ||
| Source of funding | Describe how the study was funded and the role of the funder in the identification, design, conduct, and reporting of the analysis. Describe other non‐monetary sources of support. | 767 |
| Conflicts of interest | Describe any potential for conflict of interest of study contributors in accordance with journal policy. In the absence of a journal policy, we recommend authors comply with International Committee of Medical Journal Editors recommendations. | 768 |
| Wagner 2001 | ||
| Title | Identify the study as an economic evaluation or use more specific terms such as “cost‐effectiveness analysis”, and describe the interventions compared. | Not reported |
| Abstract | Provide a structured summary of objectives, perspective, setting, methods (including study design and inputs), results (including base case and uncertainty analyses), and conclusions. | Not reported |
| Introduction | ||
| Background and objectives | Provide an explicit statement of the broader context for the study. | 695 |
| Present the study question and its relevance for health policy or practice decisions. | 695 | |
| Methods | ||
| Target population and subgroups | Describe characteristics of the base case population and subgroups analysed, including why they were chosen. | 697 |
| Setting and location | State relevant aspects of the system(s) in which the decision(s) need(s) to be made. | 695 ‐ 696 |
| Study perspective | Describe the perspective of the study and relate this to the costs being evaluated. | Not reported |
| Comparators | Describe the interventions or strategies being compared and state why they were chosen. | Not reported |
| Time horizon | State the time horizon(s) over which costs and consequences are being evaluated and say why appropriate. | Not reported |
| Discount rate | Report the choice of discount rate(s) used for costs and outcomes and say why appropriate. | Not reported |
| Choice of health outcomes | Describe what outcomes were used as the measure(s) of benefit in the evaluation and their relevance for the type of analysis performed. | Not reported |
| Measurement of effectiveness | Single study‐based estimates: Describe fully the design features of the single effectiveness study and why the single study was a sufficient source of clinical effectiveness data. | Not reported |
| Synthesis‐based estimates: Describe fully the methods used for identification of included studies and synthesis of clinical effectiveness data. | Not applicable | |
| Measurement and valuation of preference based outcomes | If applicable, describe the population and methods used to elicit preferences for outcomes. | Not applicable |
| Estimating resources and costs | Single study‐based economic evaluation: Describe approaches used to estimate resource use associated with the alternative interventions. Describe primary or secondary research methods for valuing each resource item in terms of its unit cost. Describe any adjustments made to approximate to opportunity costs. | Not reported |
| Currency, price date, and conversion | Report the dates of the estimated resource quantities and unit costs. Describe methods for adjusting estimated unit costs to the year of reported costs if necessary. Describe methods for converting costs into a common currency base and the exchange rate. | Not reported |
| Choice of model | Describe and give reasons for the specific type of decision‐analytical model used. Providing a figure to show model structure is strongly recommended. | Not applicable |
| Assumptions | Describe all structural or other assumptions underpinning the decision‐analytical model. | Not applicable |
| Analytical methods | Describe all analytical methods supporting the evaluation. This could include methods for dealing with skewed, missing, or censored data; extrapolation methods; methods for pooling data; approaches to validate or make adjustments (such as half cycle corrections) to a model; and methods for handling population heterogeneity and uncertainty. | Not reported |
| Results | ||
| Study parameters | Report the values, ranges, references, and, if used, probability distributions for all parameters. Report reasons or sources for distributions used to represent uncertainty where appropriate. Providing a table to show the input values is strongly recommended. | 697 ‐ 698 |
| Incremental costs and outcomes | For each intervention, report mean values for the main categories of estimated costs and outcomes of interest, as well as mean differences between the comparator groups. If applicable, report incremental cost‐effectiveness ratios. | Not reported |
| Characterising uncertainty | Single study‐based economic evaluation: Describe the effects of sampling uncertainty for the estimated incremental cost and incremental effectiveness parameters, together with the impact of methodological assumptions (such as discount rate, study perspective). | Not reported |
| Model‐based economic evaluation: Describe the effects on the results of uncertainty for all input parameters, and uncertainty related to the structure of the model and assumptions | Not reported | |
| Characterising heterogeneity | If applicable, report differences in costs, outcomes, or cost‐effectiveness that can be explained by variations between subgroups of patients with different baseline characteristics or other observed variability in effects that are not reducible by more information. | Not reported |
| Discussion | ||
| Study findings, limitations, generalisability, and current knowledge | Summarise key study findings and describe how they support the conclusions reached. Discuss limitations and the generalisability of the findings and how the findings fit with current knowledge. | 698 ‐ 699 |
| Other | ||
| Source of funding | Describe how the study was funded and the role of the funder in the identification, design, conduct, and reporting of the analysis. Describe other non‐monetary sources of support. | 699 |
| Conflicts of interest | Describe any potential for conflict of interest of study contributors in accordance with journal policy. In the absence of a journal policy, we recommend authors comply with International Committee of Medical Journal Editors recommendations. | Not reported |
| Subgroup category | N studies | RD (95% CI) | I2 % |
| QI Strategy | |||
| Audit and feedback | 11 | 0.12 (0.06 to 0.18) | 89 |
| Case management | 18 | 0.14 (0.07 to 0.21) | 94 |
| Team changes | 19 | 0.20 (0.13 to 0.26) | 88 |
| Electronic patient registry | 10 | 0.18 (0.07 to 0.29) | 94 |
| Clinician education | 16 | 0.13 (0.07 to 0.19) | 95 |
| Clinician reminders | 10 | 0.13 (0.05 to 0.21) | 85 |
| Patient Education | 30 | 0.15 (0.13 to 0.18) | 95 |
| Promotion of self‐management | 21 | 0.19 (0.13 to 0.26) | 96 |
| Patient reminders | 16 | 0.11 (0.07 to 0.14) | 93 |
| BCT (patients) | |||
| Goal setting (Outcome) | 14 | 0.26 (0.16 to 0.36) | 93 |
| Feedback on outcomes of behaviour/biofeedback | 15 | 0.19 (0.13 to 0.25) | 80 |
| Credible source | 10 | 0.22 (0.06 to 0.38) | 95 |
| Prompts/cues | 25 | 0.11 (0.07 to 0.14) | 92 |
| Social support (unspecified) | 14 | 0.19 (0.09 to 0.28) | 93 |
| Problem solving | 10 | 0.17 (0.08 to 0.27) | 89 |
| Restructuring the social environment | 17 | 0.17 (0.10 to 0.24) | 85 |
| Instruction on how to perform behaviour | 34 | 0.13 (0.11 to 0.15) | 94 |
| Social support (practical) | 20 | 0.14 (0.09 to 0.20) | 90 |
| Information about health consequences | 19 | 0.12 (0.07 to 0.16) | 92 |
| BCT (healthcare professionals) | |||
| Restructuring the social environment | 23 | 0.19 (0.12 to 0.26) | 91 |
| Credible source | 13 | 0.16 (0.08 to 0.24) | 95 |
| Adding objects to the environment | 15 | 0.14 (0.07 to 0.20) | 88 |
| Social support (practical) | 10 | 0.13 (0.03 to 0.22) | 87 |
| Instruction on how to perform behaviour | 30 | 0.13 (0.08 to 0.17) | 93 |
| Prompts/cues | 15 | 0.12 (0.06 to 0.17) | 85 |
| Feedback on outcomes of behaviour/biofeedback | 17 | 0.11 (0.07 to 0.16) | 81 |
| Outcome or subgroup title | No. of studies | No. of participants | Statistical method | Effect size |
| 1 Proportion of participants attending screening Show forest plot | 56 | 329164 | Risk Difference (M‐H, Random, 95% CI) | 0.12 [0.10, 0.14] |
| 1.1 Intervention specifically targeting diabetic retinopathy screening | 13 | 118938 | Risk Difference (M‐H, Random, 95% CI) | 0.17 [0.11, 0.22] |
| 1.2 General intervention to improve the quality of diabetes care | 43 | 210226 | Risk Difference (M‐H, Random, 95% CI) | 0.12 [0.09, 0.15] |
| Outcome or subgroup title | No. of studies | No. of participants | Statistical method | Effect size |
| 1 Proportion of participants attending screening Show forest plot | 10 | 23715 | Risk Difference (M‐H, Random, 95% CI) | 0.05 [0.02, 0.09] |
| 1.1 Intervention specifically targeting diabetic retinopathy screening | 3 | 19698 | Risk Difference (M‐H, Random, 95% CI) | 0.04 [‐0.11, 0.19] |
| 1.2 General intervention to improve the quality of diabetes care | 7 | 4017 | Risk Difference (M‐H, Random, 95% CI) | 0.06 [0.02, 0.11] |