Interventions for preventing oral mucositis in patients with cancer receiving treatment: cytokines and growth factors
Abstract
Background
Oral mucositis is a side effect of chemotherapy, head and neck radiotherapy, and targeted therapy, affecting over 75% of high‐risk patients. Ulceration can lead to severe pain and difficulty with eating and drinking, which may necessitate opioid analgesics, hospitalisation and supplemental nutrition. These complications may disrupt cancer therapy, which may reduce survival. There is also a risk of death from sepsis if pathogens enter the ulcers of immunocompromised patients. Ulcerative oral mucositis can be costly to healthcare systems, yet there are few preventive interventions proven to be beneficial. Cytokines and growth factors may help the regeneration of cells lining of the mouth, thus preventing or reducing oral mucositis and its negative effects.
Objectives
To assess the effects of cytokines and growth factors for preventing oral mucositis in patients with cancer who are receiving treatment.
Search methods
Cochrane Oral Health's Information Specialist searched the following databases: Cochrane Oral Health's Trials Register (searched 10 May 2017); the Cochrane Central Register of Controlled Trials (CENTRAL; 2017, Issue 4) in the Cochrane Library (searched 10 May 2017); MEDLINE Ovid (1946 to 10 May 2017); Embase Ovid (7 December 2015 to 10 May 2017); CINAHL EBSCO (Cumulative Index to Nursing and Allied Health Literature; 1937 to 10 May 2017); and CANCERLIT PubMed (1950 to 10 May 2017). The US National Institutes of Health Ongoing Trials Register (ClinicalTrials.gov) and the World Health Organization International Clinical Trials Registry Platform were searched for ongoing trials.
Selection criteria
We included parallel‐design randomised controlled trials (RCTs) assessing the effects of cytokines and growth factors in patients with cancer receiving treatment.
Data collection and analysis
Two review authors independently screened the results of electronic searches, extracted data and assessed risk of bias. For dichotomous outcomes, we reported risk ratios (RR) and 95% confidence intervals (CI). For continuous outcomes, we reported mean differences (MD) and 95% CIs. We pooled similar studies in random‐effects meta‐analyses. We reported adverse effects in a narrative format.
Main results
We included 35 RCTs analysing 3102 participants. Thirteen studies were at low risk of bias, 12 studies were at unclear risk of bias, and 10 studies were at high risk of bias.
Our main findings were regarding keratinocyte growth factor (KGF) and are summarised as follows.
There might be a reduction in the risk of moderate to severe oral mucositis in adults receiving bone marrow/stem cell transplantation after conditioning therapy for haematological cancers (RR 0.89, 95% CI 0.80 to 0.99; 6 studies; 852 participants; low‐quality evidence). We would need to treat 11 adults with KGF in order to prevent one additional adult from developing this outcome (95% CI 6 to 112). There might be a reduction in the risk of severe oral mucositis in this population, but there is also some possibility of an increase in risk (RR 0.85, 95% CI 0.65 to 1.11; 6 studies; 852 participants; low‐quality evidence). We would need to treat 10 adults with KGF in order to prevent one additional adult from developing this outcome (95% CI 5 to prevent the outcome to 14 to cause the outcome).
There is probably a reduction in the risk of moderate to severe oral mucositis in adults receiving radiotherapy to the head and neck with cisplatin or fluorouracil (RR 0.91, 95% CI 0.83 to 1.00; 3 studies; 471 participants; moderate‐quality evidence). We would need to treat 12 adults with KGF in order to prevent one additional adult from developing this outcome (95% CI 7 to infinity). It is very likely that there is a reduction in the risk of severe oral mucositis in this population (RR 0.79, 95% CI 0.69 to 0.90; 3 studies; 471 participants; high‐quality evidence). We would need to treat 7 adults with KGF in order to prevent one additional adult from developing this outcome (95% CI 5 to 15).
It is likely that there is a reduction in the risk of moderate to severe oral mucositis in adults receiving chemotherapy alone for mixed solid and haematological cancers (RR 0.56, 95% CI 0.45 to 0.70; 4 studies; 344 participants; moderate‐quality evidence). We would need to treat 4 adults with KGF in order to prevent one additional adult from developing this outcome (95% CI 3 to 6). There might be a reduction in the risk of severe oral mucositis in this population (RR 0.30, 95% CI 0.14 to 0.65; 3 studies; 263 participants; low ‐quality evidence). We would need to treat 10 adults with KGF in order to prevent one additional adult from developing this outcome (95% CI 8 to 19).
Due to the low volume of evidence, single‐study comparisons and insufficient sample sizes, we found no compelling evidence of a benefit for any other cytokines or growth factors and there was no evidence on children. There did not appear to be any serious adverse effects of any of the interventions assessed in this review.
Authors' conclusions
We are confident that KGF is beneficial in the prevention of oral mucositis in adults who are receiving: a) radiotherapy to the head and neck with cisplatin or fluorouracil; or b) chemotherapy alone for mixed solid and haematological cancers. We are less confident about a benefit for KGF in adults receiving bone marrow/stem cell transplant after conditioning therapy for haematological cancers because of multiple factors involved in that population, such as whether or not they received total body irradiation (TBI) and whether the transplant was autologous (the patients' own cells) or allogeneic (cells from a donor). KGF appears to be a relatively safe intervention.
Due to limited research, we are not confident that there are any beneficial effects of other cytokines and growth factors. There is currently insufficient evidence to draw any conclusions about the use of cytokines and growth factors in children.
PICO
Plain language summary
Can cytokines and growth factors help prevent mouth soreness and ulcers (oral mucositis) in patients being treated for cancer?
Review question
This review has been produced to assess whether or not the use of cytokines and growth factors during cancer treatment, can help prevent mouth soreness and ulcers.
Background
Sore mouth and ulcers (oral mucositis) is a side effect of treatment for cancer including chemotherapy, head and neck radiotherapy, and targeted therapy, affecting over 75% of high‐risk patients. Ulcers can lead to severe pain and difficulty with eating and drinking. Sufferers may need strong painkillers, possibly have to go into hospital and even be fed through a tube into their stomach or their veins.
These complications may disrupt their cancer therapy, meaning they are not receiving the best treatment, which may reduce survival. Cancer patients have weakened immune systems due to their treatment and are less able to fight infections. An ulcer is an open wound and there is a risk that bacteria can enter the body leading to infection or sepsis (a dangerous inflammatory reaction of the body to infection).
Mouth soreness and ulcers can be costly to healthcare systems, yet there are few preventive interventions or treatments proven to be beneficial. Cytokines and growth factors may help the regeneration of cells lining the mouth, thus preventing or reducing oral mucositis and its negative effects.
Study characteristics
Authors from Cochrane Oral Health carried out this review of existing studies and the evidence is current up to 10 May 2017. It includes 35 studies (published between 1993 and 2017) with 3102 participants, all patients being treated for cancer, aged from 1 to 87 years old. Review authors included studies comparing cytokines and growth factors for the prevention of oral mucositis. The studies were carried out all over the world and often featured multiple sites, although most took place in high‐income countries.
Main results
The main findings were regarding keratinocyte growth factor (KGF). KGF is likely to reduce the risk of oral mucositis in adults who are receiving either radiotherapy to the head and neck with chemotherapy (cisplatin or fluorouracil), or chemotherapy alone for mixed solid and blood cancers. KGF may also reduce the risk of oral mucositis in adults receiving bone marrow/stem cell transplant after conditioning therapy for blood cancers, but these results are less clear because of multiple complicating factors. KGF appears to be a relatively safe intervention. There did not appear to be any serious adverse effects of any of the interventions assessed in this review.
Due to limited research, review authors are uncertain of any beneficial effects of other cytokines and growth factors. There is currently insufficient evidence to draw any conclusions about the use of cytokines and growth factors in children.
Quality of the evidence
For reducing oral mucositis in adults receiving radiotherapy to the head and neck with chemotherapy, review authors rated the evidence for KGF as moderate to high quality. For reducing oral mucositis in adults receiving chemotherapy alone for mixed solid and blood cancers, they rated the evidence for KGF as low to moderate quality. This evidence was downgraded due to there not being enough data and because some results have not yet been published. For reducing oral mucositis in adults receiving bone marrow/stem cell transplant after conditioning therapy for blood cancers, they rated the evidence for KGF as low quality because results were not similar across the studies and some results have not yet been published. Evidence on side effects of KGF was poorly reported and inconsistent.
Authors' conclusions
Summary of findings
| KGF compared to placebo for preventing oral mucositis in adults with cancer receiving treatment | ||||||
| Patient or population: adults** receiving treatment for cancer (see subgroup for treatment type) | ||||||
| Outcomes | Anticipated absolute effects* (95% CI) | Relative effect | Number of participants | Quality of the evidence | Comments | |
| Risk with placebo | Risk with KGF | |||||
| Oral mucositis (moderate + severe) | BMT/SCT after conditioning for haematological cancers | RR 0.89 | 852 | ⊕⊕⊝⊝ | There might be a benefit for KGF in this population NNTB = 11 (95% CI 6 to 112) | |
| 848 per 1000 | 755 per 1000 | |||||
| RT to head and neck with cisplatin/5FU | RR 0.91 | 471 | ⊕⊕⊕⊝ | There is probably a benefit for KGF in this population NNTB = 12 (95% CI 7 to ∞) | ||
| 932 per 1000 | 848 per 1000 | |||||
| CT alone for mixed cancers | RR 0.56 | 344 | ⊕⊕⊕⊝ | It is likely that there is a benefit for KGF in this population NNTB = 4 (95% CI 3 to 6) | ||
| 631 per 1000 | 353 per 1000 | |||||
| Oral mucositis (severe) | BMT/SCT after conditioning for haematological cancers | RR 0.85 | 852 | ⊕⊕⊝⊝ | There might be a benefit for KGF in this population, but there is also some possibility of an increase in risk NNTB = 10 (95% CI 5 NNTB to 14 NNTH) | |
| 677 per 1000 | 575 per 1000 | |||||
| RT to head and neck with cisplatin/5FU | RR 0.79 | 471 | ⊕⊕⊕⊕ | It is very likely that there is a benefit for KGF in this population NNTB = 7 (95% CI 5 to 15) | ||
| 700 per 1000 | 553 per 1000 | |||||
| CT alone for mixed cancers | RR 0.30 | 263 | ⊕⊕⊝⊝ | There might be a benefit for KGF in this population NNTB = 10 (95% CI 8 to 19) | ||
| 154 per 1000 | 46 per 1000 | |||||
| Adverse events | Adverse events that were attributed to the study drugs rather than the cancer therapy were typically oral‐related or skin‐related. Events were mostly mild to moderate with very few incidences of serious events. However, reporting was poor and inconsistent, meaning that it was not appropriate to meta‐analyse data | |||||
| *The risk in the intervention group (and its 95% confidence interval) is based on the assumed risk in the comparison group and the relative effect of the intervention (and its 95% CI). ***The number of people that would need to receive KGF in order to prevent 1 additional person from developing the outcome. Calculated as 1 divided by the absolute risk reduction (which is the control arm event rate minus the experimental arm event rate). NNTH means the number of people that would need to receive KGF to cause 1 additional person to develop the outcome. All decimal places have been rounded up to the nearest whole number (i.e. 6.1 = 7). | ||||||
| GRADE Working Group grades of evidence | ||||||
| 1Downgraded by 1 level for inconsistency (substantial heterogeneity: I2 = 50% to 90%, P < 0.1); downgraded 1 further level for publication bias as there are 2 references in Studies awaiting classification that would be included in the conditioning/transplant subgroup, but the data are not available (NCT02313792; Spielberger 2001). | ||||||
| GM‐CSF compared to placebo/no treatment for preventing oral mucositis in adults with cancer receiving treatment | ||||||
| Patient or population: adults** receiving treatment for cancer (see subgroup for treatment type) | ||||||
| Outcomes | Anticipated absolute effects* (95% CI) | Relative effect | Number of participants | Quality of the evidence | Comments | |
| Risk with placebo/no treatment | Risk with GM‐CSF | |||||
| Oral mucositis (moderate + severe) | BMT/SCT after conditioning for haematological cancers | RR 0.94 | 109 | ⊕⊝⊝⊝ | There is insufficient evidence to determine a benefit for GM‐CSF in this population NNTB = 20 (95% CI 6 NNTB to 10 NNTH) | |
| 839 per 1000 | 789 per 1000 | |||||
| RT to head and neck | RR 0.72 | 29 | ⊕⊝⊝⊝ | There is insufficient evidence to determine a benefit for GM‐CSF in this population NNTB = 4 (95% CI 3 NNTB to 14 NNTH) | ||
| 929 per 1000 | 669 per 1000 | |||||
| Oral mucositis (severe) | BMT/SCT after conditioning for mixed cancers | RR 0.74 | 235 | ⊕⊕⊝⊝ | There is insufficient evidence to determine a benefit for GM‐CSF in this population NNTB = 12 (95% CI 5 NNTB to 5 NNTH) | |
| 347 per 1000 | 257 per 1000 | |||||
| RT to head and neck | RR 0.31 | 29 | ⊕⊝⊝⊝ | There is insufficient evidence to determine a benefit for GM‐CSF in this population NNTB = 21 (95% CI 15 NNTB to 3 NNTH) | ||
| 71 per 1000 | 22 per 1000 | |||||
| CT alone for mixed cancers | RR 0.59 | 65 | ⊕⊝⊝⊝ | There is insufficient evidence to determine a benefit for GM‐CSF in this population NNTB = 5 (95% CI 3 NNTB to 2 NNTH) | ||
| 500 per 1000 | 295 per 1000 | |||||
| Adverse events | Adverse events that were attributed to the study drugs rather than the cancer therapy were typically bone pain, nausea, fever and headache. Events were not reported as being serious. Some studies did not report adverse events and 1 even reported that there were none. However, reporting was poor and inconsistent, meaning that it was not appropriate to meta‐analyse data | |||||
| *The risk in the intervention group (and its 95% confidence interval) is based on the assumed risk in the comparison group and the relative effect of the intervention (and its 95% CI). ***The number of people that would need to receive GM‐CSF in order to prevent 1 additional person from developing the outcome. Calculated as 1 divided by the absolute risk reduction (which is the control arm event rate minus the experimental arm event rate). NNTH means the number of people that would need to receive GM‐CSF to cause 1 additional person to develop the outcome. All decimal places have been rounded up to the nearest whole number (i.e. 6.1 = 7). | ||||||
| GRADE Working Group grades of evidence | ||||||
| 1Downgraded by 2 levels for imprecision (single study with a small sample size and the confidence interval includes a possible increase in risk that is of a similar magnitude to the possible reduction in risk); downgraded 1 further level for indirectness (single study so not widely generalisable). | ||||||
| G‐CSF compared to placebo/no treatment for preventing oral mucositis in patients with cancer receiving treatment | ||||||
| Patient or population: adults** receiving treatment for cancer (see subgroup for treatment type) | ||||||
| Outcomes | Anticipated absolute effects* (95% CI) | Relative effect | Number of participants | Quality of the evidence | Comments | |
| Risk with placebo/no treatment | Risk with G‐CSF | |||||
| Oral mucositis (moderate + severe) | CT alone for breast cancer | RR 0.33 | 14 | ⊕⊝⊝⊝ | There is very weak evidence that there might be a benefit for G‐CSF in this population NNTB = 2 (95% CI 2 to 20) | |
| 1000 per 1000 | 330 per 1000 | |||||
| Oral mucositis (severe) | RT to head and neck | RR 0.37 | 54 | ⊕⊕⊝⊝ | There is weak evidence that there might be a benefit for G‐CSF in this population NNTB = 3 (95% CI 3 to 15) | |
| 519 per 1000 | 192 per 1000 | |||||
| Adverse events | There was limited evidence of adverse events for G‐CSF. 2 of the 6 studies did not report adverse events. There were low rates of mild to moderate events, the most common of which appeared to be bone pain. However, reporting was poor and inconsistent, meaning that it was not appropriate to meta‐analyse data | |||||
| *The risk in the intervention group (and its 95% confidence interval) is based on the assumed risk in the comparison group and the relative effect of the intervention (and its 95% CI). ***The number of people that would need to receive G‐CSF in order to prevent 1 additional person from developing the outcome. Calculated as 1 divided by the absolute risk reduction (which is the control arm event rate minus the experimental arm event rate). NNTH means the number of people that would need to receive G‐CSF to cause 1 additional person to develop the outcome. All decimal places have been rounded up to the nearest whole number (i.e. 6.1 = 7). | ||||||
| GRADE Working Group grades of evidence | ||||||
| 1Downgraded by 2 levels for imprecision (wide confidence interval and very small sample size); downgraded by 1 further level for high risk of performance bias; downgraded by 1 further level for indirectness (single study so not widely generalisable). | ||||||
Background
Description of the condition
Treating cancer with chemotherapy, radiotherapy of the head and neck, or targeted therapy can cause toxic oral side effects (Al‐Dasooqi 2013; Scully 2006; Sonis 2004). Perhaps the most widely researched of these side effects is oral mucositis (Al‐Dasooqi 2013), which affects at least 75% of high risk patients (those receiving head and neck radiotherapy or high‐dose chemotherapy) (Scully 2006). Oral mucositis may be under‐reported in lower risk groups for various reasons: their tendency to be outpatients with less observation; less reporting of moderate mucositis; or patients and clinicians wishing to avoid any disruption to optimal cancer treatment (Scully 2006).
Simply put, oral mucositis affects the oral mucosa (the mucous membrane of moist tissue lining the oral cavity) and can lead to the development of lesions (ulcers). However, the process that leads to oral mucositis is complex and multifactorial, with Sonis' five‐phase model being a widely accepted description of the sequence of events underlying the condition (Sonis 2004; Sonis 2009).
-
Initiation: DNA damage caused by chemotherapy or radiotherapy results in the loss of ability to proliferate in the basal cells of the epithelium (the external layers of cells lining the oral mucosa). This produces reactive oxygen species (ROS).
-
Primary damage response: radiotherapy, chemotherapy, ROS, and DNA strand breaks all contribute to the activation of transcription factors such as nuclear factor kappa beta (NF‐Kβ), and sphingomyelinases. All this leads to the upregulation of pro‐inflammatory cytokines (e.g. tumour necrosis factor alpha ‐ TNF‐α), nitric oxide, ceramide, and matrix metalloproteinases, resulting in the thinning of the epithelium through tissue injury and cell death, culminating with the destruction of the oral mucosa.
-
Signal amplification: some of the molecules in the previous phase can lead to the exacerbation and prolonging of tissue injury through positive or negative feedback (e.g. TNF‐α can positively feedback on NF‐Kβ thus inducing more pro‐inflammatory cytokine production).
-
Ulceration: bacteria colonise ulcers and their cell wall products infiltrate the submucosa (the connective tissues beneath the oral mucosa), activating tissue macrophages (white blood cells that respond to infection or damaged/dead cells), which results in further production of pro‐inflammatory cytokines, inflammation, and pain.
-
Healing: signalling from the extracellular matrix of the submucosa results in epithelial proliferation and differentiation, and thus a thickening of the epithelium. The local oral flora are reinstated.
However, there remains a lack of clarity around mechanisms and risk factors for oral mucositis, particularly areas such as genetic predisposition and microbial effects. Understanding of the pathobiology leading to mucosal toxicity as a result of targeted therapies (e.g. mammalian target of rapamycin (mTOR) inhibitor‐associated stomatitis ‐ mIAS) is also currently limited, but it is thought to differ from chemotherapy‐ and radiotherapy‐induced mucositis, and the clinical presentation of the ulcers is more similar to aphthous stomatitis (Al‐Dasooqi 2013; Boers‐Doets 2013; Peterson 2015).
Oral mucositis is an acute condition and, when caused by chemotherapy, ulceration normally occurs one week after treatment and resolves within three weeks of treatment (Sonis 2009). Radiotherapy‐induced oral mucositis takes longer both to develop and to heal, with ulceration normally occurring around two weeks into a seven‐week treatment cycle, and resolving three to four weeks after treatment has ended (Sonis 2009).
Ulceration is the most significant phase as it leads to pain of varying severity, and difficulties with eating, swallowing, and talking (Scully 2006). This in turn leads to the consumption of pain relief medication, nutritional support (i.e. nasogastric or intravenous feeding), treatment of the oral mucositis, specialist oral hygiene care, increased medical appointments and use of staff and resources, and, in some instances, hospitalisation (Jensen 2014; Miller 2001; Trotti 2003). Thus the negative impact on the quality of life of cancer patients, when they are already suffering, is severe (Elting 2008; Epstein 1999). Further problems can occur in immunosuppressed patients if whole bacteria on the ulcer surface cross into the underlying submucosa, potentially leading to bacteraemia and sepsis, which require antibiotics and hospitalisation, and can cause death (Jensen 2014; Peterson 2015; Scully 2006).
Therefore, oral mucositis can be a dose‐limiting condition, disrupting a patient's optimal cancer treatment plan (Jensen 2014; Peterson 2015; Sonis 2004). The additional costs associated with oral mucositis are significant, with one study reporting a median incremental cost of USD 18,515 per patient (Nonzee 2008). These costs have been reported to be as much as USD 42,749 more per patient when ulcerative oral mucositis is present (Sonis 2001).
Description of the intervention
As described above, oral mucositis occurs partly as result of the loss of regenerative ability of the oral epithelial cells. Growth factors and anti‐inflammatory cytokines are used to counteract the biological processes leading to this loss of proliferative ability. Growth factors and anti‐inflammatory cytokines include (Raber‐Durlacher 2013):
-
keratinocyte growth factor;
-
colony‐stimulating factors;
-
epidermal growth factor;
-
transforming growth factor‐beta;
-
whey‐derived growth factor;
-
interleukin‐11;
-
ATL‐104;
-
trefoil factor.
How the intervention might work
The growth factors described here are proteins that bind to receptors of target cells and either increase the proliferation of the epithelial cells that form the mucous membrane lining of the oral cavity, or promote the recovery of the white blood cells that contribute to the maintenance of oral health following conventional or high dose chemotherapy (with or without radiotherapy) (Raber‐Durlacher 2013). Anti‐inflammatory cytokines are also proteins or glycoproteins that bind to receptors of target cells, and are thought to alter the complex balance of pro‐ and anti‐inflammatory cytokines involved in the pathogenesis of oral mucositis (Raber‐Durlacher 2013).
Currently, evidence‐based guidelines recommend growth factors for the prevention of oral mucositis in patients with haematological cancers undergoing high‐dose chemotherapy and total body irradiation prior to haematopoietic stem cell transplantation (Lalla 2008). It has been postulated that tumour cells may also have receptors accommodating cytokines and growth factors, thus encouraging the proliferation of cancer cells in solid tumours (Lalla 2008; von Bültzingslöwen 2006). A 2010 systematic review suggested that the risk of acute myeloid leukaemia (AML) or myelodysplastic syndrome (MDS) is increased in people with various cancers receiving chemotherapy with granulocyte colony‐stimulating factor (G‐CSF) when compared to those receiving chemotherapy without G‐CSF (Lyman 2010). The authors concluded that it was not clear whether the increased AML/MDS risk was due to G‐CSF or due to the increased chemotherapy dose‐intensity in those patients. However, the review also reported a reduction in overall mortality for those receiving G‐CSF.
Why it is important to do this review
This Cochrane Review is part of a series that will replace the previously published Cochrane Review covering all interventions for the prevention of oral mucositis in patients with cancer receiving treatment (Worthington 2011). The Mucositis Study Group (MSG) of the Multinational Association of Supportive Care in Cancer/International Society of Oral Oncology (MASCC/ISOO) is a group that was set up in 1998 for the purpose of producing international evidence‐based clinical practice guidelines for managing mucositis (both oral and gastrointestinal), which they first published in 2004, with the latest update published in 2014 (Lalla 2014). In order to facilitate the future updating of Cochrane Reviews on this topic, and also to make them more usable to clinicians, guideline developers, and consumers, we have decided to divide the original Cochrane Review into the same intervention categories as those used by MASCC/ISOO, which are as follows:
-
basic oral care/good clinical practice;
-
growth factors and cytokines;
-
anti‐inflammatory agents;
-
antimicrobials, mucosal coating agents, anaesthetics, and analgesics;
-
laser and other light therapy;
-
cryotherapy;
-
natural and miscellaneous agents;
-
amifostine.
We believe that following the MASCC/ISOO structure will better enable the Cochrane Reviews to feed into such guidelines. We can also be more thorough and rigorous in our assessment and summarising of the evidence in each of the categories, which was not feasible in a single Cochrane Review approaching 150 included studies.
It is also important to do this review as it is consistently shown to be the most used review produced by Cochrane Oral Health (in terms of full‐text downloads). It was also ranked by an expert panel of oral medicine specialists as being the most important topic in the field of oral medicine in an international prioritisation exercise carried out by Cochrane Oral Health in 2014 (Worthington 2015).
Objectives
To assess the effects of cytokines and growth factors for preventing oral mucositis in patients with cancer who are receiving treatment.
Methods
Criteria for considering studies for this review
Types of studies
We included all randomised controlled trials (RCTs) of parallel design. It is possible to conduct cross‐over studies in this area as patients may receive several treatment sessions/cycles, with any mucositis completely healing in the periods between the sessions. However, we did not include cross‐over data as we could not discount any period effects, with mucositis risk increasing as patients receive further cycles of treatment (Scully 2006; Sonis 2009). Instead, we used the first‐period data only and treated such studies as parallel group studies.
Types of participants
We included all patients with cancer who were receiving treatment.
Types of interventions
We included studies comparing growth factors and cytokines for the prevention of oral mucositis (we would also have included targeted therapy‐induced stomatitis had such studies been identified) against usual care, no treatment, or any other treatment to prevent oral mucositis. We also included studies comparing different growth factors and cytokines or different regimens of growth factors and cytokines against each other (head‐to‐head studies).
We excluded studies with 'complex' interventions for the prevention of mucositis, such as lasers plus growth factors and cytokines versus lasers. This is because it is difficult to attribute any effect shown to any particular component of the intervention. We excluded studies assessing different cancer treatments where the primary outcome was survival/cure, with mucositis as a toxicity.
Types of outcome measures
We are in agreement with Williamson 2012 that, if clinical trials and systematic reviews are to be utilised, the outcomes assessed should be those considered important to patients, healthcare professionals, and other key stakeholders. If outcomes and outcome measures are inconsistent across studies, it will not be possible to compare and summarise research, and there is potential for outcome reporting bias, with the selective reporting of results based on statistical significance and favourability (Clarke 2007; Dwan 2008; Williamson 2005). This can lead to exaggerated estimates of effect in systematic reviews of interventions, leading to an incorrect belief that an intervention is more beneficial that it truly is (Clarke 2007). It is thought that the way to address this problem is to develop disease‐ or condition‐specific core outcome sets to be used as a minimum when conducting and reporting clinical trials (Clarke 2007; Williamson 2012).
Therefore we used the core outcome set produced by Bellm 2002, which is registered on the COMET (Core Outcome Measures in Effectiveness Trials) Initiative's website (www.comet‐initiative.org), and is the only core outcome set for oral mucositis known to us. We added the outcomes 'interruptions to cancer treatment' and 'adverse events'.
Primary outcomes
Mucositis incidence of any severity. We used mucositis measured on a 0 to 4 point scale (none to severe) and dichotomised it as any mucositis (0 versus 1+), moderate to severe mucositis (0 to 1 versus 2+), and severe mucositis (0 to 2 versus 3+).
Some studies measure the effects of mucositis using a composite scale. If it was possible to extract the 'mucositis only' data from the total score, we would have included the data in the analyses. If it was not possible, we would have recorded the composite data in an additional table.
Secondary outcomes
-
Interruptions to cancer treatment.
-
Oral pain.
-
Quality of life.
-
Normalcy of diet (including use of percutaneous endoscopic gastrostomy (PEG) feeding tubes or total parenteral nutrition (TPN)).
-
Adverse events.
-
Number of days in hospital.
-
Number of days of treatment with opioid analgesics.
-
Number of days unable to take medicine orally.
Search methods for identification of studies
Electronic searches
Cochrane Oral Health's Information Specialist conducted systematic searches in the following databases for randomised controlled trials and controlled clinical trials without language or publication status restrictions:
-
Cochrane Oral Health's Trials Register (searched 10 May 2017) (Appendix 1);
-
Cochrane Central Register of Controlled Trials (CENTRAL; 2017, Issue 4) in the Cochrane Library (searched 10 May 2017) (Appendix 2);
-
MEDLINE Ovid (1946 to 10 May 2017) (Appendix 3);
-
Embase Ovid (7 December 2015 to 10 May 2017) (Appendix 4);
-
CINAHL EBSCO (Cumulative Index to Nursing and Allied Health Literature; 1937 to 10 May 2017) (Appendix 5);
-
CANCERLIT (Cancer subset within PubMed; 1950 to 10 May 2017) (Appendix 6).
Subject strategies were modelled on the search strategy designed for MEDLINE Ovid. Where appropriate, they were combined with subject strategy adaptations of the highly sensitive search strategy designed by Cochrane for identifying randomised controlled trials and controlled clinical trials as described in the Cochrane Handbook for Systematic Reviews of Interventions Chapter 6 (Lefebvre 2011).
Due to the Cochrane Embase Project to identify all clinical trials in the database and add them to CENTRAL, only most recent months of the Embase database were searched. See the searching page on the Cochrane Oral Health website for more information. No other restrictions were placed on the date of publication when searching the electronic databases.
Searching other resources
We searched the following trial registries for ongoing studies:
-
US National Institutes of Health Ongoing Trials Register ClinicalTrials.gov (clinicaltrials.gov; searched 10 May 2017) (Appendix 7);
-
World Health Organization International Clinical Trials Registry Platform (apps.who.int/trialsearch; searched 10 May 2017) (Appendix 8).
We included only handsearching done as part of the Cochrane Worldwide Handsearching Programme and uploaded to CENTRAL.
We searched the reference lists of included studies and relevant systematic reviews for further studies.
We did not perform a separate search for adverse effects of interventions used, we considered adverse effects described in included studies only.
Data collection and analysis
Selection of studies
Two review authors independently screened the titles and abstracts retrieved from the electronic searches. We obtained full‐text copies of all studies that appeared to meet the inclusion criteria of the review, or where there was insufficient information in the title or abstract to make a clear judgement. Two review authors independently assessed the full‐text copies for eligibility and attempted to resolve any disagreements through discussion. We consulted a third review author when we were unable to resolve disagreements.
On assessing the full‐text article, we discarded any studies that clearly did not meet the inclusion criteria. We recorded all other studies that did not meet the inclusion criteria, along with reasons for exclusion, in the Characteristics of excluded studies table.
Data extraction and management
Two review authors independently extracted the data from each included study using a specially designed data extraction form, which we first piloted on a small sample of studies. We contacted study authors for clarification or missing data where necessary and feasible. We resolved any disagreements through discussion, consulting a third review author to achieve consensus when necessary.
We recorded the following data for each included study in the Characteristics of included studies table.
-
Trial design, location, number of centres, recruitment period.
-
Inclusion/exclusion criteria, age and gender of participants, number randomised/analysed, any other potentially important prognostic factors (e.g. cancer type, cancer treatment, etc.).
-
Detailed description of the intervention and comparator, including timing and duration. Information on compliance with the intervention.
-
Details of the outcomes reported, including method of assessment and time(s) assessed.
-
Details of sample size calculations, adverse effects, funding sources, declarations/conflicts of interest.
Assessment of risk of bias in included studies
Two review authors independently assessed the risk of bias of each included study using the Cochrane domain‐based, two‐part tool as described in Chapter 8 of the Cochrane Handbook for Systematic Reviews of Interventions (Higgins 2011). We contacted study authors for clarification or missing information where necessary and feasible. We resolved any disagreements through discussion, consulting a third review author to achieve consensus when necessary.
We completed a 'Risk of bias' table for each included study. For each domain of risk of bias, we first described what was reported to have happened in the study. This provided the rationale for our judgement of whether that domain was at low, high, or unclear risk of bias.
We assessed the following domains:
-
sequence generation (selection bias);
-
allocation concealment (selection bias);
-
blinding of participants and personnel (performance bias);
-
blinding of outcome assessment (detection bias);
-
incomplete outcome data (attrition bias);
-
selective outcome reporting (reporting bias);
-
other bias.
We categorised the overall risk of bias of individual studies. Studies were categorised as being at low, high, or unclear risk of bias according to the following criteria:
-
low risk of bias (plausible bias unlikely to seriously alter the results) if all domains were at low risk of bias;
-
high risk of bias (plausible bias that seriously weakens confidence in the results) if one or more domains were at high risk of bias; or
-
unclear risk of bias (plausible bias that raises some doubt about the results) if one or more domains were at unclear risk of bias.
We also presented the 'Risk of bias' summary graphically.
Measures of treatment effect
For continuous outcomes (e.g. oral pain on a visual analogue scale) where studies used the same scale, we used the mean values and standard deviations (SDs) reported in the studies in order to express the estimate of effect as mean difference (MD) with 95% confidence interval (CI). Where different scales were used, we expressed the treatment effect as standardised mean difference (SMD) with 95% CI.
For dichotomous outcomes (e.g. mucositis of any severity/no mucositis), we expressed the estimate of effect as a risk ratio (RR) with 95% CI.
We did not use area under the curve (AUC) data due to variation in length of follow‐up for outcome assessment, variation in the length of the scale used to measure the outcome and also variation or lack of clarity whether the results were reported in terms of total area under the curve or average over the time period.
Unit of analysis issues
The participant was the unit of analysis.
Dealing with missing data
We attempted to contact the author(s) of all included studies, where feasible, for clarification, and missing data. We would have used the methods described in Section 7.7.3 of the Cochrane Handbook for Systematic Reviews of Interventions to estimate missing SDs (Higgins 2011). We did not use any other statistical methods or perform any further imputation to account for missing data.
Assessment of heterogeneity
When a sufficient number of studies were included in any meta‐analyses, we assessed clinical heterogeneity by examining the characteristics of the studies, the similarity between the types of participants, the interventions, and the outcomes. We also assessed heterogeneity statistically using a Chi2 test, where a P value < 0.1 indicates statistically significant heterogeneity. We quantified heterogeneity using the I2 statistic. A guide to interpretation of the I2 statistic given in Section 9.5.2 of the Cochrane Handbook for Systematic Reviews of Interventions is as follows (Higgins 2011):
-
0% to 40%: might not be important;
-
30% to 60%: may represent moderate heterogeneity;
-
50% to 90%: may represent substantial heterogeneity;
-
75% to 100%: considerable heterogeneity.
Assessment of reporting biases
If at least 10 studies were included in a meta‐analysis, we planned to assess publication bias according to the recommendations on testing for funnel plot asymmetry (Egger 1997), as described in Section 10.4 of the Cochrane Handbook for Systematic Reviews of Interventions (Higgins 2011). If asymmetry were identified, we would have examined possible causes. We were not able to assess publication bias in this way because, although we had a sufficient number of studies in our meta‐analyses for the primary outcome in one comparison, they were split into subgroups containing less than 10 studies, with no pooling of the subgroup totals.
Data synthesis
We only carried out meta‐analyses where there were studies of similar comparisons reporting the same outcomes. We combined MDs for continuous data, and RRs for dichotomous data. Our general approach was to use a random‐effects model. With this approach, the CIs for the average intervention effect were wider than those that would have been obtained using a fixed‐effect approach, leading to a more conservative interpretation.
We used an additional table to report the results from studies not suitable for inclusion in a meta‐analysis, but only for the primary outcome.
Subgroup analysis and investigation of heterogeneity
We carried out subgroup analyses according to type of cancer treatment. We also would have considered age group (children versus adults) as a category for subgroup analyses, if there had been sufficient numbers of studies with these differing populations.
Sensitivity analysis
If there had been sufficient numbers of studies in the meta‐analyses, we would have tested the robustness of our results by performing sensitivity analyses based on excluding the studies at unclear or high risk of bias from the analyses.
If any meta‐analyses had included several small studies and a single very large study, we would have carried out a sensitivity analysis comparing the effect estimates from both random‐effects and fixed‐effect models. If these were different we would have reported on both analyses as part of the results section, and considered possible interpretation.
Presentation of main results
We produced a 'Summary of findings' table for each comparison in which there was more than one study in at least one of the subgroups based on cancer treatment. We included the incidence of moderate to severe oral mucositis, the incidence of severe oral mucositis and adverse events. We used GRADE methods (GRADE 2004), and the GRADEpro GDT online tool for developing 'Summary of findings' tables (www.guidelinedevelopment.org). We assessed the quality of the body of evidence for each comparison and outcome by considering the overall risk of bias of the included studies, the directness of the evidence, the inconsistency of the results, the precision of the estimates, and the risk of publication bias. We categorised the quality of each body of evidence as high, moderate, low, or very low.
Results
Description of studies
Results of the search
Our electronic searches identified 5125 records. After removing duplicates, this number was reduced to 3145. We examined the titles and abstracts of these records and discarded 3042, leaving 103 records to examine in more detail. Where possible, we obtained full‐text copies of these potentially relevant records and linked any references pertaining to the same study under a single study ID. These 103 records represented 73 studies. We excluded 24 studies at this stage. The remaining 49 studies met our inclusion criteria and we included 35 of these studies in the review. The remaining 14 studies are awaiting assessment because we do not have enough information to be able to include them in the review. We present this process as a study flow chart in Figure 1.

Study flow diagram.
RCT = randomised controlled trial.
Included studies
We included 35 studies in this review. For further information see the Characteristics of included studies tables.
Characteristics of the trials
Study design
One study was a cross‐over design that reported the first‐period data separately (Chi 1995), whilst the remaining studies all used a parallel design.
Number of arms
Twenty‐seven studies had two arms, three studies had three arms (Blijlevens 2013; Freytes 2004; Peterson 2009), one study had four arms (Wu 2009), two studies had five arms (Cartee 1995; Linch 1993), and two studies had seven arms (Blazar 2006; Meropol 2003). Where studies had more than two arms, this was because they tested a range of doses of the cytokine/growth factor. In such instances we combined the arms testing different doses to make pairwise comparisons against the control group. Where possible, we also made head‐to‐head comparisons of doses (Blijlevens 2013; Cartee 1995; Freytes 2004; Meropol 2003; Peterson 2009).
Country
Nine studies were conducted in the USA (Blazar 2006; Cartee 1995; Crawford 1999; Freytes 2004; Meropol 2003; Schneider 1999; Spielberger 2004; Su 2006; Vadhan‐Raj 2010), four in Italy (Cesaro 2013; Dazzi 2003; Lucchese 2016a; Lucchese 2016b), two in each of South Korea (Kim 2017; Wu 2009), the UK (Linch 1993; McAleese 2006), Iran (Gholizadeh 2016; Hosseinjani 2017), Finland (Makkonen 2000; Saarilahti 2002), and one in each of the Netherlands (van der Lelie 2001), Russia (Peterson 2009), Japan (Katano 1995), Germany (Fink 2011), China (Chi 1995), Australia (Bradstock 2014), and France (Antoun 2009). The remaining seven studies were conducted across more than one country: USA and Australia (Jagasia 2012; Rosen 2006); USA and Canada (Nemunaitis 1995); Australia, Canada and the USA (Brizel 2008); Australia, Canada and Europe (Henke 2011); Canada, USA and Europe (Le 2011); and 14 European countries (Blijlevens 2013).
Number of centres
Fifteen studies were conducted at a single‐centre (Antoun 2009; Cartee 1995; Chi 1995; Dazzi 2003; Fink 2011; Hosseinjani 2017; Katano 1995; Kim 2017; Lucchese 2016a; Lucchese 2016b; McAleese 2006; Saarilahti 2002; Su 2006; Vadhan‐Raj 2010; van der Lelie 2001). Eighteen studies were multicentric, ranging from two sites (Blazar 2006; Makkonen 2000) to 46 sites (Le 2011). It was unclear how many centres were involved in the remaining two studies (Gholizadeh 2016; Schneider 1999).
Trials registries
We were able to find a trials registry number for 13 studies (Blijlevens 2013; Bradstock 2014; Cesaro 2013; Fink 2011; Gholizadeh 2016; Henke 2011; Hosseinjani 2017; Jagasia 2012; Kim 2017; Le 2011; McAleese 2006; Spielberger 2004; Vadhan‐Raj 2010), although only six studies mentioned it in the study report (Bradstock 2014; Cesaro 2013; Gholizadeh 2016; Hosseinjani 2017; Kim 2017; Vadhan‐Raj 2010), whilst a further study mentioned an obsolete number (Jagasia 2012).
Sample size calculation
Twenty‐one studies reported details of sample size calculations, but four of these were not based on oral mucositis (Cesaro 2013; Crawford 1999; Jagasia 2012; Su 2006). One further study stated that 36 participants "should be enough to demonstrate a clinically significant difference", with no details reported (van der Lelie 2001).
Funding and conflicts of interest
This information is difficult to summarise as it was not always adequately reported.
Nineteen studies appeared to be funded by industry alone i.e. it was explicitly stated that they received industry funding or that industry supplied the interventions or both. Five studies appeared to be funded by government/public sector alone and did not state whether or not the interventions were supplied by industry (Cartee 1995; Lucchese 2016a; Lucchese 2016b; Su 2006; Wu 2009). Four studies reported both government and industry funding, three of which stated that industry provided the interventions (Bradstock 2014; Chi 1995; Kim 2017), and one of which was not clear (Blazar 2006). Two studies stated that there was no funding for the study (Cesaro 2013; Hosseinjani 2017). The remaining five studies did not mention funding (Dazzi 2003; Freytes 2004; Gholizadeh 2016; McAleese 2006; Saarilahti 2002).
Ten studies, all industry funded, declared conflicts of interest for reasons such as board membership of the funder, employment or leadership roles with the funder, receipt of lecture fees or consultancy fees or research funding or honoraria from the funder (Antoun 2009; Blijlevens 2013; Brizel 2008; Henke 2011; Jagasia 2012; Le 2011; Peterson 2009; Rosen 2006; Spielberger 2004; Vadhan‐Raj 2010). Six of those studies also declared that some authors owned equity/stock with the funder (Brizel 2008; Henke 2011; Jagasia 2012; Le 2011; Rosen 2006; Spielberger 2004). Three studies did not explicitly declare conflicts of interest, but some authors were employed by the funder (Crawford 1999; Linch 1993; Nemunaitis 1995). Eight studies stated that there were no conflicts of interest (Bradstock 2014; Cesaro 2013; Gholizadeh 2016; Hosseinjani 2017; Kim 2017; Lucchese 2016a; Lucchese 2016b; Su 2006). The remaining 14 studies did not mention conflicts of interest.
Characteristics of the participants
Number randomised/analysed
The studies randomised 3218 participants, of whom 3102 were included in the studies' analyses (the latter number does not include any participants from Makkonen 2000, as this study did not report how many of the 40 randomised participants were analysed).
Age and sex
The age of the participants ranged from 1 to 87 years, with four studies only including children and young adults (i.e. up to 18 years) (Cesaro 2013; Gholizadeh 2016; Lucchese 2016a; Lucchese 2016b). Of the 31 studies including adult participants, one had a median age of 29 (Dazzi 2003), two had mean or median ages in their 30s (Linch 1993; Nemunaitis 1995), nine in their 40s (Blazar 2006; Bradstock 2014; Cartee 1995; Chi 1995; Hosseinjani 2017; Jagasia 2012; Spielberger 2004; Vadhan‐Raj 2010; van der Lelie 2001), 11 in their 50s (Blijlevens 2013; Brizel 2008; Fink 2011; Freytes 2004; Henke 2011; Katano 1995; Kim 2017; Le 2011; Peterson 2009; Saarilahti 2002; Wu 2009), seven in their 60s (Antoun 2009; Crawford 1999; Makkonen 2000; McAleese 2006; Meropol 2003; Rosen 2006; Su 2006), and one study did not report the age, although the inclusion criteria stated that they must be at least 18 years old (Schneider 1999). In 24 studies, there was a clear majority of male participants, whilst the male to female ratio was roughly equal in seven studies. In three studies there were more female participants, although two of these exclusively included breast cancer patients (Cartee 1995; Katano 1995), whilst the third included colorectal cancer patients (Peterson 2009).
Cancer type
Fourteen studies enrolled participants with haematological cancers (Blazar 2006; Blijlevens 2013; Bradstock 2014; Fink 2011; Freytes 2004; Gholizadeh 2016; Hosseinjani 2017; Jagasia 2012; Kim 2017; Lucchese 2016a; Lucchese 2016b; Nemunaitis 1995; Spielberger 2004; van der Lelie 2001). Eighteen studies enrolled participants with solid cancers: head and neck (Brizel 2008; Chi 1995; Henke 2011; Le 2011; Makkonen 2000; McAleese 2006; Saarilahti 2002; Schneider 1999; Su 2006; Wu 2009); colorectal (Antoun 2009; Meropol 2003; Peterson 2009; Rosen 2006); breast (Cartee 1995; Katano 1995); lung (Crawford 1999); and sarcoma (Vadhan‐Raj 2010). The remaining three studies enrolled a mixture of participants with solid cancers and participants with haematological cancers, two of which were 80% to 90% solid (Cesaro 2013; Dazzi 2003), and the other study only 3% solid (Linch 1993).
Cancer treatment
In 11 studies, the participants received chemotherapy only (Antoun 2009; Bradstock 2014; Cartee 1995; Chi 1995; Crawford 1999; Gholizadeh 2016; Katano 1995; Meropol 2003; Peterson 2009; Rosen 2006; Vadhan‐Raj 2010). Of the 15 studies in which the participants received conditioning therapy prior to stem cell or bone marrow transplantation, five of these involved chemotherapy only (Blijlevens 2013; Dazzi 2003; Fink 2011; Hosseinjani 2017; Kim 2017), and one involved total body irradiation (TBI) only (Lucchese 2016b). In the remaining nine transplant studies, all the participants had chemotherapy, but the proportion of participants also receiving TBI differed: 100% (Lucchese 2016a; Nemunaitis 1995; Spielberger 2004); around 50% (Blazar 2006; Jagasia 2012; van der Lelie 2001); 29% (Linch 1993); 10% or less (Cesaro 2013; Freytes 2004). The remaining nine studies were all on head and neck cancer patients where the participants either had radiotherapy to the head and neck alone (Makkonen 2000; McAleese 2006; Saarilahti 2002; Schneider 1999; Su 2006), or radiotherapy to the head and neck plus chemotherapy (Brizel 2008; Henke 2011; Le 2011; Wu 2009), although in one of those studies only 50% of participants had the chemotherapy (Wu 2009).
Of the 15 transplant studies, four involved allogeneic transplants (Blazar 2006; Jagasia 2012; Lucchese 2016b; Nemunaitis 1995), nine involved autologous transplants (Blijlevens 2013; Cesaro 2013; Dazzi 2003; Fink 2011; Freytes 2004; Hosseinjani 2017; Kim 2017; Lucchese 2016a; Spielberger 2004), with the remaining two involving a mixture (Linch 1993; van der Lelie 2001).
In six studies, all participants received granulocyte‐colony stimulating factor (a growth factor) as part of the cancer treatment to prevent neutropenia. Four of these studies were investigating keratinocyte growth factor (Blazar 2006; Bradstock 2014; Spielberger 2004; Vadhan‐Raj 2010), and two were investigating granulocyte‐macrophage colony‐stimulating factor (Cartee 1995; Dazzi 2003). Giving all participants this growth factor would have the potential to lessen the impact of the study intervention.
Characteristics of the interventions and comparisons
Keratinocyte growth factor (KGF)
Of the 16 studies investigating KGF, one study assessed KGF‐2 (repifermin) (Freytes 2004), whilst the remaining studies assessed KGF‐1 (palifermin).
Fourteen studies used a placebo comparator (Blazar 2006; Blijlevens 2013; Bradstock 2014; Brizel 2008; Freytes 2004; Henke 2011; Jagasia 2012; Le 2011; Lucchese 2016a; Lucchese 2016b; Meropol 2003; Rosen 2006; Spielberger 2004; Vadhan‐Raj 2010), one was KGF plus standard care versus standard care alone (Fink 2011), and the remaining study used a chlorhexidine mouthwash comparator (Gholizadeh 2016).
In all studies, KGF was given intravenously. The most common total dosage received was 360 µg/kg in seven studies (Bradstock 2014; Fink 2011; Gholizadeh 2016; Jagasia 2012; Lucchese 2016a; Lucchese 2016b; Spielberger 2004). The dosage varied greatly in the other studies: 120 µg/kg (Rosen 2006); 180 µg/kg (Vadhan‐Raj 2010); 600 µg/kg (Brizel 2008); 840 μg/kg to 960 µg/kg depending on resection type (Henke 2011); 1440 µg/kg (Le 2011). The dosages varied within the remaining studies due to multiple arms receiving different doses: 3 μg/kg to 240 µg/kg (Meropol 2003); 180 μg/kg to 360 µg/kg (Blijlevens 2013); 240 μg/kg to 720 µg/kg (Blazar 2006); 325 μg/kg to 650 µg/kg (Freytes 2004).
The number of doses received ranged from one (Vadhan‐Raj 2010) to 13 (Freytes 2004), but the most common was six (Blijlevens 2013; Bradstock 2014; Fink 2011; Gholizadeh 2016; Lucchese 2016a; Lucchese 2016b; Spielberger 2004).
Reporting of compliance varied too greatly to summarise succinctly but compliance was generally high (see Characteristics of included studies).
Granulocyte‐macrophage colony‐stimulating factor (GM‐CSF)
Of the eight studies investigating GM‐CSF, four used a placebo comparator (Cartee 1995; Dazzi 2003; Nemunaitis 1995; van der Lelie 2001), two used a no‐treatment comparator (Chi 1995; McAleese 2006), one was GM‐CSF plus sucralfate versus sucralfate alone (Makkonen 2000), and the remaining study used a sucralfate comparator (Saarilahti 2002).
In three studies, GM‐CSF was given by subcutaneous injection (Chi 1995; Makkonen 2000; McAleese 2006). In Makkonen 2000, both arms received sucralfate mouthwash that was swallowed after rinsing. In three studies, GM‐CSF was taken as a mouthwash (Cartee 1995; Dazzi 2003; Saarilahti 2002). In Saarilahti 2002, both the GM‐CSF and sucralfate comparator mouthwashes were swallowed after rinsing. In one study, GM‐CSF was given as an oral gel and swallowed after holding in the mouth (van der Lelie 2001). In the remaining study, GM‐CSF was given intravenously (Nemunaitis 1995).
Total dosage varied greatly: 40 µg (Chi 1995); 2100 µg (McAleese 2006); 5250 µg/m2 (Nemunaitis 1995). The dosages ranged from 12.6 µg to 12,600 µg within one study due to multiple arms receiving different doses (Cartee 1995). Another study reported a mean total dosage of 3398 µg, but this total ranged from 300 µg to 7200 µg depending on the participant's weight and the length of radiotherapy course (Makkonen 2000). In two studies, the dose was 150 µg per day but the total received varied depending on neutrophil recovery (Dazzi 2003), and the length of radiotherapy course (Saarilahti 2002). In the remaining study, the dose was 300 µg per day but the total received varied depending on neutrophil recovery (van der Lelie 2001).
As is obvious from the variation in total dosage, the number of doses received varied greatly both between studies and within studies. Compliance was also reported inconsistently but was generally high (see Characteristics of included studies).
Granulocyte‐colony stimulating factor (G‐CSF)
Of the six studies investigating G‐CSF, four used a placebo comparator (Crawford 1999; Linch 1993; Schneider 1999; Su 2006), one used a no‐treatment comparator (Katano 1995), and the remaining study compared a type of G‐CSF that is given as a single dose (pegfilgrastim) with the standard G‐CSF that is given in multiple doses (filgrastim) (Cesaro 2013).
Four studies reported that G‐CSF was given by subcutaneous injection (Crawford 1999; Katano 1995; Schneider 1999; Su 2006), whilst one did not specify, but was probably subcutaneous (Cesaro 2013), and the remaining study was intravenous delivery (Linch 1993).
Total dosage varied: 3220 µg/m2 (Crawford 1999); 3 µg/kg per day with the total dependent on neutrophil counts and the length of radiotherapy course (Schneider 1999; Su 2006); 2 µg/kg to 15 µg/kg per day due to multiple arms receiving different dosages with the total was depending on neutrophil recovery (Linch 1993); 125 µg per day with total depending on neutrophil recovery (Katano 1995); 100 µg/kg in the pegfilgrastim arm and at least 45 µg/kg in the filgrastim arm (Cesaro 2013).
The number of doses received varied both between studies and within studies. Compliance was reported as being 100% in one study (Cesaro 2013), whilst one study only reported that the interventions were well tolerated (Schneider 1999), and the remaining four studies did not report on compliance.
Epidermal growth factor (EGF)
Two studies investigated an oral spray of EGF, both using a placebo comparator (Kim 2017; Wu 2009). Total dosage was unclear in both studies but the daily dose was 50 µg/mL (six sprays twice daily) in one study (Kim 2017), and 10 µg to 100 µg per day (due to multiple arms receiving different dosages) in the other study (Wu 2009). The number of doses varied depending on neutrophil recovery and resolution of oral mucositis in Kim 2017, whilst participants in Wu 2009 received the interventions daily for five weeks but it was not clear if that meant only on the radiotherapy days (five days per week) or seven days per week. Compliance was reported as a median of 93% and 92% in the EGF and placebo groups respectively in Kim 2017, but compliance was not reported in Wu 2009.
Intestinal trefoil factor (ITF)
One study investigated an oral spray of ITF using a placebo comparator (Peterson 2009). The ITF was not expectorated. The study included two ITF arms with total dosages of 336 mg and 2688 mg. The mode of administration was three sprays to the oral mucosa eight times daily for 14 days. Patient‐reported compliance was 97%.
Erythropoietin
One study investigated a mouthwash of erythropoietin using a placebo comparator (Hosseinjani 2017). Neither swallowing nor expectoration was reported. The mouthwash was taken as 15 mL (50 IU/mL) four times daily (daily dosage of 3000 IU) for 14 days or until neutrophil recovery, whichever occurred first. Compliance was reported narratively as being low but no reason was stated.
Transforming growth factor (TGF)
One study investigated TGF‐beta(2) using a placebo comparator (Antoun 2009). The dosage was 2 ng of TGF per mg protein mixed with cool boiled water at 0.23 g/mL (100 kcl/100 mL). During each cycle participants received 750 mL to 1000 mL per day plus any other food desired. The formula was administered for two days before, two days during, and three days after chemotherapy (seven days/cycle), for one to eight cycles. Compliance was poor i.e. nine participants did not eat the formula and were excluded.
Characteristics of the outcomes
Primary outcome
For the primary outcome of oral mucositis, we were interested in both the presence/absence of oral mucositis, and also different levels of severity. All 35 studies assessed and reported the incidence of oral mucositis. Twenty‐two studies primarily used the WHO (World Health Organization) 0 to 4 scale, whilst four used the NCI‐CTC (National Cancer Institute common toxicity criteria) 0 to 4 scale (Brizel 2008; Dazzi 2003; Freytes 2004; Kim 2017), four used the RTOG (Radiation Therapy Oncology Group) 0 to 4 scale (Chi 1995; McAleese 2006; Saarilahti 2002; Wu 2009), one used the CALGB (Cancer and Leukemia Group B) 0 to 4 scale (Cartee 1995), one used an unnamed 0 to 2 scale (Makkonen 2000), one used an unnamed 0 to 3 scale (Su 2006), one used an unnamed 0 to 4 scale (Nemunaitis 1995), and the remaining study did not mention a scale and only reported the incidence of stomatitis (Linch 1993). The different oral mucositis assessment scales are described in Appendix 9.
Twelve studies reported the data in our preferred format which was the maximum oral mucositis score experienced by each participant over the length of the study, allowing us to dichotomise the data into various levels of severity as described in the section Primary outcomes. Eighteen studies reported a particular level of severity (e.g. grade 3 or above). One study reported the incidence of each oral mucositis grade on multiple assessment days. We were unable to use the data from the remaining four studies for analysis due to unclear or lack of reporting (Linch 1993; Lucchese 2016a; Lucchese 2016b; Makkonen 2000).
The frequency of oral mucositis assessment and the duration for which it was assessed varied greatly across the studies, often depending on whether the participants received radiotherapy, and often depending on the speed of neutrophil recovery, resolution of oral mucositis, or duration of hospitalisation. Four studies did not report the frequency of assessment (Antoun 2009; Cesaro 2013; Linch 1993; Nemunaitis 1995), whilst a further study was unclearly reported (Lucchese 2016b). Twelve studies reported daily assessments, eight reported weekly assessments, with the remainder falling somewhere in between these two frequencies. Where participants had multiple cycles of treatment, we only reported the results for the first cycle if these data were available separately.
Secondary outcomes
Interruptions to cancer treatment
Six studies reported data that we were able to use in analyses (Brizel 2008; Henke 2011; Le 2011; Saarilahti 2002; Su 2006; Wu 2009), whilst a further two studies assessed this outcome but either did not report the interruption by treatment arm (Makkonen 2000), or narratively reported that there were no differences, with no numerical data (Schneider 1999).
Two studies reported this outcome as the incidence of unscheduled radiotherapy breaks of five or more days (Brizel 2008; Henke 2011; Le 2011). Two of those studies also reported on chemotherapy delays/discontinuations (Henke 2011; Le 2011). The remaining studies all reported on the incidence of interruptions to radiotherapy treatment, one of which stated that interruptions were specifically due to oral mucositis (Saarilahti 2002), and another reporting the incidence of three or more consecutive days of interruption (Wu 2009).
Oral pain
Four studies reported data that we were able to use in analyses (Dazzi 2003; Freytes 2004; Henke 2011; Le 2011). Two of these studies used a 0 to 4 scale and reported the mean (Henke 2011; Le 2011), whilst the other two studies used a 0 to 10 scale and reported the mean worst score experienced (Dazzi 2003; Freytes 2004).
Of the 11 other studies that reported that oral pain was an outcome of the study, five reported the results as area under the curve (AUC) but, for reasons stated in the section Measures of treatment effect, we did not meta‐analyse these data (Blijlevens 2013; Kim 2017; Lucchese 2016a; Rosen 2006; Spielberger 2004). Two studies reported medians, which are not suitable for meta‐analysis (Vadhan‐Raj 2010; van der Lelie 2001). One study reported the data graphically as a mean over time with no standard deviation (Saarilahti 2002). One study narratively reported that there were no differences, with no numerical data (Wu 2009). The remaining two studies used two different scales: one reported as "no difference" and another reported on a graph with no standard deviation (Makkonen 2000); both reported on a graph over time, with one also reported as AUC (Meropol 2003).
Quality of life
Four studies assessed quality of life using various assessment scales: European Quality Of Life Utility Scale ‐ EQ‐5D (Blijlevens 2013); modified Oral Mucositis Daily Questionnaire ‐ OMDQ (Kim 2017); Functional Assessment of Cancer Therapy ‐ FACT (Spielberger 2004); an unnamed 1 to 7 scale (Vadhan‐Raj 2010). We did not use the data in our analyses as they were either reported as AUC (Kim 2017; Spielberger 2004), as a median (Vadhan‐Raj 2010), or the mean was reported at one very early time point with no standard deviation (Blijlevens 2013).
Normalcy of diet ‐ including use of percutaneous endoscopic gastrostomy (PEG) feeding tubes or total parenteral nutrition (TPN)
Fourteen studies reported data that we were able to use in analyses in the form of: incidence of TPN (Blijlevens 2013; Cesaro 2013; Fink 2011; Jagasia 2012; Kim 2017; Spielberger 2004; van der Lelie 2001); incidence of PEG (Brizel 2008; Saarilahti 2002; Su 2006); incidence of TPN, PEG, nasogastric tube or intravenous (IV) hydration (Henke 2011; Le 2011); incidence of "tube feeding" (McAleese 2006); ability to eat using a 1 to 4 scale (Freytes 2004). Only one of these studies explicitly stated that supplemental feeding was due to oral mucositis (Henke 2011).
Two further studies only reported the duration of TPN (Lucchese 2016a; Lucchese 2016b), and another study used 0 to 4 scales to assess difficulty in eating and drinking, but reported median scores (Vadhan‐Raj 2010).
We combined studies reporting incidence of TPN, PEG, etc., in meta‐analyses of 'supplemental feeding'.
Adverse events
This outcome was very poorly reported with some studies reporting numerical data and some reporting narratively. Some studies only reported adverse events if there was a minimum incidence (which varied between studies) or if there was a specified difference in incidence between treatment arms. It was also difficult to determine whether or not many adverse effects were due to the study interventions, or due to the underlying cancer treatment. We presented adverse event data/information only in an additional table.
Number of days in hospital
Two studies reported data that we were able to use in analyses i.e. mean and standard deviations (Blijlevens 2013; Hosseinjani 2017).
Five further studies reported medians (Cesaro 2013; Fink 2011; Linch 1993; Nemunaitis 1995; van der Lelie 2001). One study reported data graphically with no standard deviation or P value (Crawford 1999). One study listed this as an outcome of the study but did not actually report it (Kim 2017). One study reported the incidence of hospitalisation (Saarilahti 2002).
Number of days of treatment with opioid analgesics
Two studies reported data that we were able to use in analyses i.e. mean and standard deviations (Blijlevens 2013; Dazzi 2003; Freytes 2004). Only one study specified that the opioid use was due to oral mucositis (Freytes 2004).
Four further studies reported medians (Fink 2011; Kim 2017; Lucchese 2016a; Spielberger 2004), whilst another study did not state whether the data were means or medians, and there were no standard deviations or P value (Lucchese 2016b). Three studies reported total dose of opioid analgesic (Henke 2011; Le 2011; Vadhan‐Raj 2010), whilst four studies reported the incidence of its use (Hosseinjani 2017; Jagasia 2012; Saarilahti 2002; van der Lelie 2001). One study stated that it assessed the use of opioid analgesics, but did not specify whether this was in terms of duration, quantity or incidence, and did not actually report any data (Wu 2009).
Number of days unable to take medicine orally
No studies reported this outcome.
Excluded studies
We excluded 24 studies from this review for the following reasons.
-
Not a randomised controlled trial or unclear (Foncuberta 2001; Gordon 1993; Horsley 2007; Hunter 2009; Iwase 1997; Limaye 2013; Throuvalas 1995; Vitale 2014).
-
Stomatitis incidence reported in adverse events table (Kubo 2016; Lee 2016; Nabholtz 2002; Tsurusawa 2016).
-
Unclear if mucositis was oral or gastrointestinal (Jones 1996; Legros 1997; Pettengell 1992).
-
Study stopped early with very few participants enrolled (Antin 2002; NCT00360971; NCT00626639).
-
Oral mucositis not mentioned and unknown if measured (Gebbia 1994; Gladkov 2013).
-
Some participants had oral mucositis at baseline (Ryu 2007).
-
Cross‐over study with no reporting of first‐period data (de Koning 2007).
-
Results reported by cycle assuming independence (Karthaus 1998).
-
Survival/cure was primary outcome with mucositis (unclear if oral or gastrointestinal) as a toxicity (Ifrah 1999).
Risk of bias in included studies
Allocation
Random sequence generation
Nineteen studies described an adequate method of generating a random sequence, so we assessed these as at low risk of bias. The remaining 16 studies stated that they were randomised without providing a description of how the random sequence was generated, so we assessed these as at unclear risk of bias.
Allocation concealment
Seventeen studies described a process that would have concealed the random sequence from those involved in the study, thus allowing it to be applied as it was generated. We assessed these 17 studies as at low risk of bias. The remaining 18 studies did not describe any methods used to conceal the random sequence, so we assessed them as at unclear risk of bias.
In total, 16 studies are at low risk of selection bias, meaning that we assessed both of the above domains as low risk of bias. The remaining 19 studies are at unclear risk of selection bias because one or both of the above domains were rated as unclear.
Most studies were carried out in middle‐income and high‐income countries with strict controls and regulations and we feel that many of them probably had adequate randomisation, and that the unclear ratings for these two domains were probably due to reporting issues rather than actual bias. Therefore, when incorporating risk of bias into our GRADE assessments, we did not downgrade any evidence based on selection bias.
Blinding
Blinding of participants and personnel (performance bias)
We assessed 28 studies as at low risk of bias. Twenty‐seven of these studies used a placebo comparator and this ensured that blinding was performed successfully. One further study compared GM‐CSF with sucralfate, but the interventions were supplied as identical‐looking mouthwashes, the study was described as double‐blind, and there was no reason to suspect that participants or personnel were not blinded (Saarilahti 2002).
We assessed seven studies as at high risk of bias. Three of these studies used a no‐treatment comparator, so blinding was not possible (Chi 1995; Katano 1995; McAleese 2006). Two other studies were similar in that they compared KGF plus best supportive care with best supportive care alone (Fink 2011), and GM‐CSF plus sucralfate with sucralfate alone (Makkonen 2000). One study compared intravenous KGF with a chlorhexidine mouthwash (Gholizadeh 2016). The remaining study compared two types of G‐CSF, but the dosing schedule was very different, ensuring that blinding was not possible (Cesaro 2013).
Blinding of outcome assessment (detection bias)
We assessed 29 studies as at low risk of bias. We assessed four studies as at unclear risk of bias because blinding of outcome assessment was not mentioned, but we judged that it would have been possible to achieve (Cesaro 2013; Chi 1995; Katano 1995; Makkonen 2000). We assessed the remaining two studies as at high risk of bias because they either stated that there was no blinding of outcome assessors (Fink 2011), or it was implied by the description "single‐blind" (Linch 1993).
Incomplete outcome data
Attrition was generally very low and we assessed 31 studies as at low risk of bias. We assessed two studies as at unclear risk of bias because one did not report how many of the randomised participants were included in the analyses (Makkonen 2000), and the other did not report the attrition by treatment arm but there was potential for bias if the dropouts were mostly from one arm and had developed the outcome of severe oral mucositis (Cartee 1995). We assessed two studies as at high risk of bias because one had very high attrition (Antoun 2009), and the other had 19% attrition in one arm compared to none in the other arm (Fink 2011).
Selective reporting
It is important to note that we have perhaps been quite lenient when rating bias under this domain. We have tended to focus on the primary outcome because the vast majority of the data are for this outcome. Many studies have only reported a particular level of oral mucositis severity, for example grade 2 to 4 (ulcerative/moderate to severe), when they could have reported more usable data by reporting the maximum grade experienced per patient, allowing us to dichotomise this into all severities. Some readers may consider this to be bias but we have reported all this information transparently in the Characteristics of included studies tables, thus allowing the reader to decide if they would judge the risk of bias differently. Furthermore, many secondary outcomes were reported poorly or in a way that was not amenable to meta‐analysis, which in most cases is a reporting issue rather than a bias issue. This highlighted the problem with the current Cochrane risk of bias tool in that meta‐analyses are being biased due to missing information, but this is not being accounted for in the meta‐analysis. It does not seem appropriate to rate a study at high risk of bias due to a secondary outcome when it is contributing data to the meta‐analysis for the primary outcome, and it is the meta‐analysis for the secondary outcome that is affected by bias. Again, all this information is clearly reported in the Characteristics of included studies tables.
We assessed 32 studies as at low risk of bias. We assessed the remaining three studies as at high risk of bias, two because there were no usable data for the primary outcome (Linch 1993; Makkonen 2000), and one because several outcomes were assessed but not reported (Wu 2009).
Other potential sources of bias
We did not consider there to be any issues arising from other potential sources of bias in any of the studies and we therefore assessed them all as at low risk of other bias.
Overall risk of bias
-
Thirteen studies (37%) were at low overall risk of bias (Blijlevens 2013; Dazzi 2003; Freytes 2004; Henke 2011; Hosseinjani 2017; Kim 2017; Le 2011; Lucchese 2016a; Lucchese 2016b; Saarilahti 2002; Schneider 1999; Su 2006; Vadhan‐Raj 2010).
-
Twelve studies (34%) were at unclear overall risk of bias (Blazar 2006; Bradstock 2014; Brizel 2008; Cartee 1995; Crawford 1999; Jagasia 2012; Meropol 2003; Nemunaitis 1995; Peterson 2009; Rosen 2006; Spielberger 2004; van der Lelie 2001).
-
Ten studies (29%) were at high overall risk of bias (Antoun 2009; Cesaro 2013; Chi 1995; Fink 2011; Gholizadeh 2016; Katano 1995; Linch 1993; Makkonen 2000; McAleese 2006; Wu 2009).
Risk of bias can be viewed graphically in Figure 2.
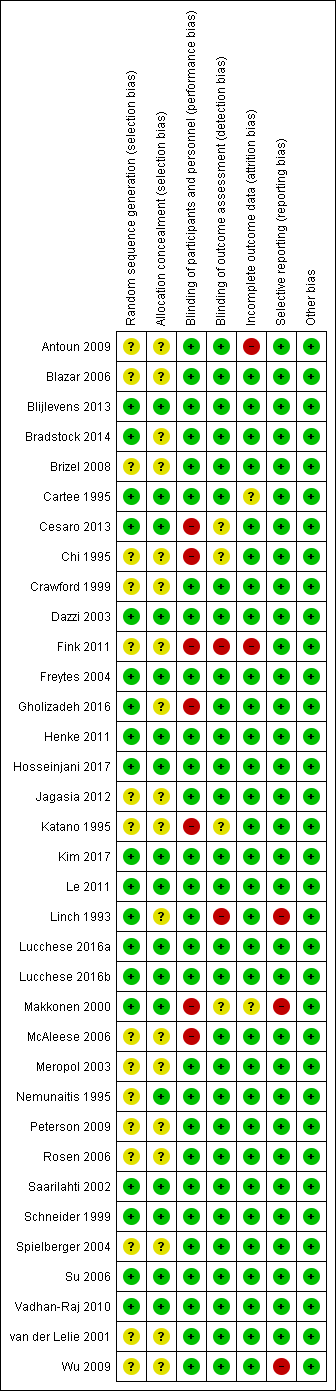
Risk of bias summary: review authors' judgements about each risk of bias item for each included study.
Effects of interventions
See: Summary of findings for the main comparison Keratinocyte growth factor (KGF) compared to placebo for preventing oral mucositis in adults with cancer receiving treatment; Summary of findings 2 Granulocyte‐macrophage colony‐stimulating factor (GM‐CSF) compared to placebo/no treatment for preventing oral mucositis in adults with cancer receiving treatment; Summary of findings 3 Granulocyte‐colony stimulating factor (G‐CSF) compared to placebo/no treatment for preventing oral mucositis in adults with cancer receiving treatment
We used GRADE methods to assess the quality of the body of evidence for each comparison in which there was more than one study in at least one of the subgroups based on cancer treatment. We included the incidence of moderate to severe oral mucositis, the incidence of severe oral mucositis and adverse events. These assessments are presented in summary of findings Table for the main comparison; summary of findings Table 2; summary of findings Table 3.
Keratinocyte growth factor (KGF) versus placebo
Oral mucositis
Adults receiving bone marrow/stem cell transplantation after conditioning therapy for haematological cancers
There was insufficient evidence from four studies, one at low (Blijlevens 2013), two at unclear (Blazar 2006; Spielberger 2004), and one at high risk of bias (Fink 2011), to determine whether or not KGF reduces the risk of any level of oral mucositis: risk ratio (RR) 0.96, 95% confidence interval (CI) 0.88 to 1.05; 655 participants (Analysis 1.1).
Six studies, two at low (Blijlevens 2013; Freytes 2004), three at unclear (Blazar 2006; Jagasia 2012; Spielberger 2004), and one at high risk of bias (Fink 2011), showed a reduction in the risk of moderate to severe oral mucositis in favour of KGF: RR 0.89, 95% CI 0.80 to 0.99; 852 participants (Analysis 1.2).
The same six studies showed a possible reduction in the risk of severe oral mucositis in favour of KGF, but there is also some possibility of an increase in risk: RR 0.85, 95% CI 0.65 to 1.11; 852 participants (Analysis 1.3).
Heterogeneity present in these meta‐analyses may partly be due to differences between studies where transplants were autologous or allogeneic.
Adults receiving radiotherapy to the head and neck with cisplatin/fluorouracil (5FU)
Two studies, both at low risk of bias (Henke 2011; Le 2011), showed a reduction in the risk of any level of oral mucositis in favour of KGF: RR 0.95, 95% CI 0.90 to 1.00; P = 0.04; 374 participants (Analysis 1.1).
Three studies, two at low (Henke 2011; Le 2011), and one at unclear risk of bias (Brizel 2008), showed a reduction in the risk of moderate to severe oral mucositis in favour of KGF: RR 0.91, 95% CI 0.83 to 1.00; P = 0.04; 471 participants (Analysis 1.2).
The same three studies showed a reduction in the risk of severe oral mucositis in favour of KGF: RR 0.79, 95% CI 0.69 to 0.90; 471 participants (Analysis 1.3).
Adults receiving chemotherapy alone for mixed cancers
Two studies, both at unclear risk of bias (Bradstock 2014; Rosen 2006), showed a reduction in the risk of any level of oral mucositis in favour of KGF: RR 0.71, 95% CI 0.60 to 0.85; 215 participants (Analysis 1.1).
Four studies, one at low (Vadhan‐Raj 2010), and three at unclear risk of bias (Bradstock 2014; Meropol 2003; Rosen 2006), showed a reduction in the risk of moderate to severe oral mucositis in favour of KGF: RR 0.56, 95% CI 0.45 to 0.70; 344 participants (Analysis 1.2).
Three studies, one at low (Vadhan‐Raj 2010), and two at unclear risk of bias (Bradstock 2014; Rosen 2006), showed a reduction in the risk of severe oral mucositis in favour of KGF: RR 0.30, 95% CI 0.14 to 0.65; 263 participants (Analysis 1.3).
Interruptions to cancer treatment
Adults receiving radiotherapy to the head and neck with cisplatin/fluorouracil (5FU)
There was insufficient evidence from three studies, two at low (Henke 2011; Le 2011), and one at unclear risk of bias (Brizel 2008), to determine whether or not KGF reduces the risk of having unscheduled radiotherapy breaks of five or more days: RR 1.01, 95% CI 0.65 to 1.59; 473 participants (Analysis 1.4).
There was insufficient evidence, from the same two studies at low risk of bias, to determine whether or not KGF reduces the risk of having chemotherapy delays/discontinuations: RR 0.96, 95% CI 0.62 to 1.47; 374 participants (Analysis 1.5).
Oral pain
Adults receiving bone marrow/stem cell transplantation after conditioning therapy for haematological cancers
There was insufficient evidence, from one study at low risk of bias (Freytes 2004), to determine whether or not KGF reduces the mean worst pain experienced on a 0 (no pain) to 10 (worst pain) scale: mean difference (MD) ‐0.85, 95% CI ‐3.00 to 1.30; 42 participants (Analysis 1.6).
Adults receiving radiotherapy to the head and neck with cisplatin
There was some evidence, from two studies at low risk of bias (Henke 2011; Le 2011), that KGF might lead to a reduction in the mean pain score on a 0 (no pain) to 4 (worst pain) scale: MD ‐0.12, 95% CI ‐0.27 to 0.02; 374 participants (Analysis 1.6).
Normalcy of diet
Adults receiving bone marrow/stem cell transplantation after conditioning therapy for haematological cancers
There was insufficient evidence from four studies, one at low (Blijlevens 2013), two at unclear (Jagasia 2012; Spielberger 2004), and one at high risk of bias (Fink 2011), to determine whether or not KGF reduces the risk of total parenteral nutrition: RR 0.89, 95% CI 0.58 to 1.34; 714 participants (Analysis 1.7).
There was further insufficient evidence, from one study at low risk of bias (Freytes 2004), to determine whether or not KGF reduces the mean worst ability to eat score on a 1 (normal) to 4 (no solids or liquids) scale: MD ‐0.50, 95% CI ‐1.21 to 0.21; 42 participants (Analysis 1.8).
Adults receiving radiotherapy to the head and neck with cisplatin/fluorouracil (5FU)
There was insufficient evidence from three studies, two at low (Henke 2011; Le 2011), and one at unclear risk of bias (Brizel 2008), to determine whether or not KGF reduces the risk of receiving supplemental nutrition (total parenteral nutrition, percutaneous endoscopic gastrostomy, nasogastric tube or intravenous (IV) hydration): RR 1.03, 95% CI 0.77 to 1.37; 473 participants (Analysis 1.7).
Adverse events
This outcome was difficult to summarise due to poor and inconsistent reporting, and we did not meta‐analyse any data. However, there do not appear to be any serious concerns regarding adverse effects of KGF. We have tabulated relevant information in Additional Table 1.
| Study ID | Adverse events results |
|
| |
|
| |
| Insufficient evidence of a difference in infection or Grade 3 to 4 (NCI‐CTC 0 to 4 toxicity scale) skin rash/desquamation | |
| The study authors state that most adverse events were considered to be caused by the cancer treatment or the underlying cancer itself and not related to study treatment. 2 participants in the palifermin group had serious adverse events considered to be related to the intervention: 1 had increased sputum production; the other had dehydration, dysphagia, pain (including abdominal), pancreatitis, and subsequently had schistosomiasis | |
| Total of 28 side effects in palifermin group occurring in 11 of 22 patients (50%) who received at least 4 of the 6 doses. Most frequent (90.9%) were cases of erythema or exanthema, often associated with itching (54.5%). Often (54.5%) a swelling of the oral mucosa including the tongue occurred. In 4 out of 6 patients, this was accompanied by taste disturbance. The severity of side effects were classified as mild to moderate. The CTC Grade 3 occurred only once in the form of a strong heat sensation In 1 of the 11 cases, there was premature discontinuation of palifermin due to severe facial swelling with eyelid and laryngeal pain as well as painful swelling of the hands following the second injection | |
| 25 different adverse events were reported and were mostly not KGF‐related. There was insufficient evidence of a difference for diarrhoea, abdominal pain, infection or rash | |
| "..two patients reported knee joint pain, skin rash was observed in one patient, two patients had abnormal taste, and one showed lingual mucosal thickening" (control group was chlorhexidine mouthrinse. The authors do not report the events by treatment group) | |
|
| |
| KGF‐related AEs with incidence ≥ 5% in KGF group: higher rate of gastrointestinal disorders in KGF group (18/78 versus 2/73; RR 8.42, 95% CI 2.02 to 35.04; P = 0.003). Insufficient evidence of a difference in any AE, tongue coating, tongue disorder, skin and subcutaneous tissue disorders, rash, pruritus, or erythema | |
| "Study drug–related AEs were reported for 35% of palifermin and 11% of placebo patients. The most frequent study drug–related AEs (palifermin, placebo) were rash (9%, 2%), flushing (5%, 0%), dysgeusia (5%, 1%), nausea (4%, 1%),and vomiting (3%, 1%). None of these events led to study withdrawal. Serious AEs considered related to study treatment were reported for five palifermin patients (5%; one each with necrotic pancreatitis, hypersensitivity, tracheostomy malfunction, peritoneal carcinoma, and convulsion) and two placebo patients (2%; one each with hepatitis/hepatic enzyme increase and cryptogenic organizing pneumonia)" | |
| "The administration of palifermin was generally safe and without considerable complications. The only adverse reactions were rashes (lasting for 48–72 hours) localized to the face, upper neck and shoulders, erythema, and altered taste (consistent with the pharmacologic action of palifermin of oral epithelium and skin), most of which were of NCI grade 1 or 2 severity" | |
| "The administration of palifermin was mostly safe and without substantial complications. The mean duration of the OM and the number of adverse event was significant less in the palifermin group (Tables II, III, Figure 1). The main adverse episodes were erythema, cutaneous rashes and altered taste and three of the patients in the palifermin group showed a light thickness of the tongue, mouth and palate" | |
| "Although the predefined frequency of DLTs attributable to KGF was not reached with KGF doses between 1 and 80 µg/kg/d, there were three adverse reactions involving the skin that required discontinuation of KGF in the 18 patients treated with 60 or 80 µg/kg (Table 5). Overall, skin and oral adverse events (rash, flushing, pruritis, edema, hypoesthesia, paresthesia, tongue disorder [thickening], and alteration in taste sensation) attributed to KGF occurred in 13 of 18 patients treated with 60 and 80 µg/kg of KGF (eight patients, grade 1; four patients, grade 2; and one patient, grade 3) and in three of 11 patients treated with 40 µg/kg (all grade 1). These events were reported in 16 of 39 patients (41%) dosed with KGF at > 20 µg/kg/d, whereas these symptoms were reported in only two of 21 subjects (10%) treated with placebo. The skin and oral toxicities associated with KGF were generally mild to moderate in severity, with onset approximately 36 hours after the first dose of KGF and resolution 7 to 10 days thereafter" | |
|
| |
| "The incidence, frequency, and severity of adverse events were similar in the two groups, and most were attributable to the underlying cancer, cytotoxic chemotherapy, or total‐body irradiation. Those that occurred with an incidence that was at least 5 percentage points higher in the palifermin group than in the placebo group are listed in Table 3. Most of these adverse events were consistent with the pharmacologic action of palifermin on skin and oral epithelium (e.g., rash, pruritus, erythema, paresthesia, mouth and tongue disorders, and taste alteration). All these events were mild to moderate in severity, transient (occurring approximately three days after the third dose of palifermin and lasting approximately three days), and not a cause for the discontinuation of study drug. Serious adverse events considered to be related to treatment occurred in one palifermin recipient (rash) and one placebo recipient (hypotension)" | |
|
|
AE = adverse event; CI = confidence interval; KGF = keratinocyte growth factor; NCI‐CTC = National Cancer Institute common toxicity criteria; RR = risk ratio; WHO = World Health Organization.
Number of days in hospital
Adults receiving bone marrow/stem cell transplantation after conditioning therapy for haematological cancers
There was insufficient evidence, from one study at low risk of bias (Blijlevens 2013), to determine whether or not KGF reduces the mean number of days in hospital: MD 0.00, 95% CI ‐1.64 to 1.64; 281 participants (Analysis 1.9).
Number of days of treatment with opioid analgesics
Adults receiving bone marrow/stem cell transplantation after conditioning therapy for haematological cancers
There was some imprecise evidence, from two studies at low risk of bias (Blijlevens 2013; Freytes 2004), that KGF might lead to a reduction in the mean number of days of treatment with opioid analgesics: MD ‐1.41, 95% CI ‐3.33 to 0.51; 323 participants (Analysis 1.10). The average effect is around 1.5 days reduction, but the confidence interval is compatible with both a reduction of almost 3.5 days and an increase of half a day.
No studies assessed the outcomes 'quality of life' and 'number of days unable to take medicine orally'.
Keratinocyte growth factor (KGF) dose comparisons
There was some inconsistent evidence from which no conclusions can be drawn regarding different dosages of KGF (Analysis 2.1; Analysis 2.2; Analysis 2.3; Analysis 2.4; Analysis 2.5; Analysis 2.6; Analysis 2.7; Analysis 2.8).
Keratinocyte growth factor (KGF) versus chlorhexidine
One study, at high risk of bias and analysing 90 children receiving mixed chemotherapy alone for acute lymphoblastic leukaemia (Gholizadeh 2016), compared KGF by IV infusion with chlorhexidine mouthwash. There was weak evidence (due to risk of bias and low sample size) that KGF performs better than chlorhexidine in reducing the risk of any level of oral mucositis (RR 0.67, 95% CI 0.54 to 0.85; Analysis 3.1), moderate to severe oral mucositis (RR 0.12, 95% CI 0.05 to 0.28; Analysis 3.2), and severe oral mucositis (RR 0.01, 95% CI 0.00 to 0.19; Analysis 3.3).
Granulocyte‐macrophage colony‐stimulating factor (GM‐CSF) versus placebo/no treatment
Oral mucositis
Adults receiving bone marrow/stem cell transplantation after conditioning therapy for mixed cancers
There was some evidence, from one study at low risk of bias (Dazzi 2003), that GM‐CSF might lead to a reduction in the risk of any level of oral mucositis: RR 0.91, 95% CI 0.80 to 1.04; 90 participants (Analysis 4.1).
There was insufficient evidence, from one study at unclear risk of bias (Nemunaitis 1995), to determine whether or not GM‐CSF reduces the risk of moderate to severe oral mucositis: RR 0.94, 95% CI 0.79 to 1.13; 109 participants (Analysis 4.2).
There was insufficient evidence from three studies, one at low (Dazzi 2003), and two at unclear risk of bias (Nemunaitis 1995; van der Lelie 2001), to determine whether or not GM‐CSF reduces the risk of severe oral mucositis: RR 0.74, 95% CI 0.33 to 1.67; 235 participants (Analysis 4.3).
Adults receiving radiotherapy to the head and neck
There was insufficient evidence, from one study at high risk of bias (McAleese 2006), to determine whether or not GM‐CSF reduces the risk of any level of oral mucositis (RR 1.01, 95% CI 0.82 to 1.23; 29 participants; Analysis 4.1), moderate to severe oral mucositis (RR 0.72, 95% CI 0.49 to 1.06; 29 participants; Analysis 4.2), or severe oral mucositis (RR 0.31, 95% CI 0.01 to 7.09; 29 participants; Analysis 4.3).
Adults receiving chemotherapy alone for mixed cancers
There was insufficient evidence from two studies, one at unclear (Cartee 1995), and one at high risk of bias (Chi 1995), to determine whether or not GM‐CSF reduces the risk of severe oral mucositis: RR 0.59, 95% CI 0.05 to 7.11; 65 participants (Analysis 4.3).
Oral pain
Adults receiving bone marrow/stem cell transplantation after conditioning therapy for mixed cancers
There was insufficient evidence, from one study at low risk of bias (Dazzi 2003), to determine whether or not GM‐CSF reduces the mean pain score on a 0 (no pain) to 10 (worst pain) scale: MD 0.60, 95% CI ‐0.85 to 2.05; 90 participants (Analysis 4.4).
Normalcy of diet
Adults receiving bone marrow/stem cell transplantation after conditioning therapy for haematological cancers
There was insufficient evidence, from one study at unclear risk of bias (van der Lelie 2001), to determine whether or not GM‐CSF reduces the risk of total parenteral nutrition: RR 1.10, 95% CI 0.63 to 1.91; 36 participants (Analysis 4.5).
Adults receiving radiotherapy to the head and neck
There was insufficient evidence, from one study at high risk of bias (McAleese 2006), to determine whether or not GM‐CSF reduces the risk of tube feeding: RR 0.31, 95% CI 0.01 to 7.09; 29 participants (Analysis 4.5).
Adverse events
This outcome was difficult to summarise due to poor and inconsistent reporting, and we did not meta‐analyse any data. However, there do not appear to be any serious concerns regarding adverse effects of GM‐CSF. We have tabulated relevant information in Additional Table 2.
| Study ID | Adverse events results |
| 2 participants (group allocation not reported) withdrew by day 3 due to intolerance to their mouthwash (dry mouth); 1 participant receiving GM‐CSF (1 µg/mL) had mouthwash withdrawn by day 3 due to possible allergic reaction (sensation of fullness in the posterior pharyngeal area) but resolved within 4 hours (the participant was withdrawn but appears to have been included in the analysis) | |
| "One patient had fever and chills, and two patients had general malaise and headache during GM‐CSF treatment. No patient had evidence of fluid retention after GM‐CSF" | |
| Not reported | |
| (Sucralfate given to both groups) "Only 2 of the 20 patients treated with GM‐CSF and sucralfate did not experience any side effects related to the drugs, but most side effects were mild (WHO Grade 1 or 2). The most common side effects were local skin reactions, fever, bone pain, and mild nausea...In the control group only 1 patient complained of nausea possibly related to the use of sucralfate, and another patient interrupted sucralfate treatment because of the same reason" | |
| "12 patients who received GM‐CSF had elevated white cell counts (WCC). The range of maximal WCC was 7.2–30.5 (median 19.7). All WCC had returned to normal within 3 weeks of completing injections (median 2 weeks). Three patients developed influenza‐like symptoms with the GM‐CSF and in one patient the injections were stopped because of this symptom. One patient developed an erythematous rash at his injection sites after completing his course of 14 injections (Figure 3). He had a past history of allergy to radiographic contrast medium" | |
|
| |
| (Comparator was sucralfate) "Both mouthwashes were well tolerated, and none of the patients reported any adverse effects related to the mouthwashes. Adverse effects commonly associated with subcutaneous GM‐CSF administration, such as nausea, vomiting, bone pain, headaches, and fever, were not observed" | |
| Not reported |
GM‐CSF = granulocyte‐macrophage colony‐stimulating factor.
Number of days of treatment with opioid analgesics
Adults receiving bone marrow/stem cell transplantation after conditioning therapy for mixed cancers
There was some evidence, from one study at low risk of bias (Dazzi 2003), that GM‐CSF might lead to a reduction in the mean number of days of treatment with opioid analgesics: MD ‐1.10, 95% CI ‐1.91 to ‐0.29; 90 participants (Analysis 4.6).
No studies assessed the outcomes 'interruptions to cancer treatment', 'quality of life', 'number of days in hospital' and 'number of days unable to take medicine orally'.
Granulocyte‐macrophage colony‐stimulating factor (GM‐CSF) dose comparison
There is some very weak evidence, from one study at unclear risk of bias and analysing 36 adults receiving mixed chemotherapy alone for breast cancer (Cartee 1995), that a higher dose of GM‐CSF (range 1260 µg to 12,600 µg) reduces the risk of severe oral mucositis when compared to a lower dose (range 12.6 µg to 126 µg): RR 2.75, 95% CI 1.07 to 7.04; 36 participants (Analysis 5.1).
Granulocyte‐macrophage colony‐stimulating factor (GM‐CSF) versus sucralfate
One study, at low risk of bias and analysing 40 adults receiving radiotherapy to the head and neck (Saarilahti 2002), compared GM‐CSF with sucralfate, both as a mouthwash. There was insufficient evidence to determine whether GM‐CSF or sucralfate perform better in reducing the risk of moderate to severe oral mucositis (RR 0.96, 95% CI 0.80 to 1.14; Analysis 6.1), severe oral mucositis (RR 0.54, 95% CI 0.24 to 1.21; Analysis 6.2), interruptions to cancer treatment (RR 0.13, 95% CI 0.01 to 2.36; Analysis 6.3), or percutaneous endoscopic gastrostomy (RR 0.18, 95% CI 0.01 to 3.56; Analysis 6.4).
Granulocyte‐colony stimulating factor (G‐CSF) versus placebo/no treatment
Oral mucositis
Adults receiving radiotherapy to the head and neck
There was insufficient evidence, from two studies at low risk of bias (Schneider 1999; Su 2006), to determine whether or not G‐CSF reduces the risk of any level of oral mucositis: RR 1.02, 95% CI 0.86 to 1.22; 54 participants (Analysis 7.1).
The same two studies showed weak evidence (due to a wide confidence interval and low sample size) of a reduction in the risk of severe oral mucositis in favour of G‐CSF: RR 0.37, 95% CI 0.15 to 0.87; 54 participants (Analysis 7.3).
Adults receiving chemotherapy alone for mixed cancers
One study on lung cancer, at unclear risk of bias (Crawford 1999), showed a reduction in the risk of any level of oral mucositis in favour of G‐CSF: RR 0.59, 95% CI 0.40 to 0.87; 195 participants (Analysis 7.1).
One study on breast cancer, at high risk of bias (Katano 1995), showed very weak evidence (due to risk of bias, very low sample size and a wide confidence interval) of a reduction in the risk of moderate to severe oral mucositis in favour of G‐CSF: RR 0.33, 95% CI 0.12 to 0.95; 14 participants (Analysis 7.2).
Adults receiving bone marrow/stem cell transplantation after conditioning therapy for haematological cancers
One study, at high risk of bias and analysing 121 participants (Linch 1993), did not provide any details of how oral mucositis was measured, so it is not clear what severity the information refers to. There were no numerical results reported, only the statement: "There was no difference in the frequency of stomatitis (defined as a sore, infected or ulcerated mouth, lips or pharynx), the incidence being between 29 and 33% in all groups" (Additional Table 3).
| Study ID | Population | Outcome | GM‐CSF | Placebo | Result |
| BMT/SCT after conditioning for haematological cancers | Oral mucositis: no scale described | No data | No data | "There was no difference in the frequency of stomatitis (defined as a sore, infected or ulcerated mouth, lips or pharynx), the incidence being between 29 and 33% in all groups" |
BMT = bone marrow transplantation; G‐CSF: granulocyte‐colony stimulating factor; SCT = stem cell transplantation.
Interruptions to cancer treatment
Adults receiving radiotherapy to the head and neck
There was insufficient evidence, from one study at low risk of bias (Su 2006), to determine whether or not G‐CSF reduces the risk of radiotherapy interruptions: RR 0.22, 95% CI 0.01 to 4.31; 40 participants (Analysis 7.4).
Normalcy of diet
Adults receiving radiotherapy to the head and neck
There was insufficient evidence, from one study at low risk of bias (Su 2006), to determine whether or not G‐CSF reduces the risk of percutaneous endoscopic gastrostomy: RR 0.16, 95% CI 0.01 to 2.86; 40 participants (Analysis 7.5).
Adverse events
This outcome was difficult to summarise due to poor and inconsistent reporting, and we did not meta‐analyse any data. However, there do not appear to be any serious concerns regarding adverse effects of G‐CSF. We have tabulated relevant information in Additional Table 4.
| Study ID | Adverse events results |
| "Both pegfilgrastim and filgrastim were well tolerated and no significant adverse effects were associated with their use" (G‐CSF versus G‐CSF) | |
| Approximately 20% of participants receiving G‐CSF experienced mild to moderate skeletal pain which was resolved by using oral analgesics; 6% of participants in both groups reported mild generalised rash/itching; 3 participants experienced an event thought to be G‐CSF‐related and which caused them to request withdrawal from the study: abdominal pain, diffuse aches and pains, and a flare‐up of pre‐existing eczema | |
| Not reported | |
| "There was no difference in the overall frequency of adverse clinical or laboratory events between the groups or in the frequency of adverse events thought by the clinicians to be possibly or probably due to study medication" | |
| Not reported | |
| "In general, toxicities typical of postoperative RT to the head and neck were observed. Additional toxicities attributable to G‐CSF and/or daily injections were as follows: elevated WBC requiring G‐CSF dose reduction by prospectively planned guidelines occurred in nine patients in the GCSF arm; grade 2–3 bone pain was observed in two patients in the G‐CSF arm; three patients refused injection (2 G‐CSF, 1 placebo)" |
G‐CSF = granulocyte‐colony stimulating factor.
No studies assessed the outcomes 'oral pain', 'quality of life', 'number of days in hospital', 'number of days of treatment with opioid analgesics' and 'number of days unable to take medicine orally'.
G‐CSF (pegfilgrastim) versus G‐CSF (filgrastim)
There was insufficient evidence, from one study at high risk of bias and analysing 61 children receiving bone marrow/stem cell transplantation after conditioning therapy for mixed cancers (Cesaro 2013), to determine whether pegfilgrastim or filgrastim perform better in reducing the risk of any level of oral mucositis (RR 1.02, 95% CI 0.82 to 1.27; Analysis 8.1), moderate to severe oral mucositis (RR 0.78, 95% CI 0.55 to 1.11; Analysis 8.2), or total parenteral nutrition (RR 1.00, 95% CI 0.94 to 1.06; Analysis 8.3).
Epidermal growth factor (EGF) versus placebo
Oral mucositis
Adults receiving bone marrow/stem cell transplantation after conditioning therapy for haematological cancers
There was insufficient evidence, from one study at low risk of bias and analysing 136 participants (Kim 2017), to determine whether or not EGF reduces the risk of moderate to severe oral mucositis (RR 1.06, 95% CI 0.78 to 1.43; Analysis 9.1), or severe oral mucositis (RR 1.03, 95% CI 0.59 to 1.80; Analysis 9.2).
Adults receiving radiotherapy to the head and neck with/without cisplatin
One study, at high risk of bias (Wu 2009), showed weak evidence (due to risk of bias and low sample size) of a reduction in the risk of moderate to severe oral mucositis in favour of EGF: RR 0.67, 95% CI 0.45 to 0.99; 103 participants (Analysis 9.1).
Interruptions to cancer treatment
Adults receiving radiotherapy to the head and neck with/without cisplatin
There was insufficient evidence, from one study at high risk of bias (Wu 2009), to determine whether or not EGF reduces the risk of having radiotherapy breaks longer than two days: RR 4.38, 95% CI 0.25 to 75.44; 113 participants (Analysis 9.3).
Normalcy of diet
Adults receiving bone marrow/stem cell transplantation after conditioning therapy for haematological cancers
There was insufficient evidence, from one study at low risk of bias (Kim 2017), to determine whether or not EGF reduces the risk of total parenteral nutrition: RR 1.03, 95% CI 0.55 to 1.94; 136 participants (Analysis 9.4).
Adverse events
There do not appear to be any serious concerns regarding adverse effects of EGF. We have tabulated relevant information in Additional Table 5.
| Study ID | Adverse events results |
| "Adverse events were similar in both groups (Table 3). The most common adverse event in the rhEGF group was nausea (n = 7, 10.4%). The incidence of other adverse events including oral pain, dry mouth, and taste alteration was low. All the adverse events were mild and transient. No grade 3 or 4 adverse events were noted during the study period" (there were no differences between groups in any adverse event) | |
| "The frequency of minor and serious adverse events was similar in all groups. Most adverse events were related to primary disease status and treatment modalities" |
EGF = epidermal growth factor.
No studies assessed the outcomes 'oral pain', 'quality of life', 'number of days in hospital', 'number of days of treatment with opioid analgesics' and 'number of days unable to take medicine orally'.
Intestinal trefoil factor (ITF) versus placebo
Oral mucositis
Adults receiving chemotherapy alone for colorectal cancer
One study, at unclear risk of bias and analysing 99 participants (Peterson 2009), showed weak evidence (due to low sample size) of a reduction in the risk of any level of oral mucositis (RR 0.52, 95% CI 0.35 to 0.79; Analysis 10.1), and moderate to severe oral mucositis (RR 0.22, 95% CI 0.10 to 0.48; Analysis 10.2), both in favour of ITF.
There was insufficient evidence, from the same study, to determine whether or not EGF reduces the risk of severe oral mucositis: RR 1.52, 95% CI 0.06 to 36.39 (Analysis 10.3).
Adverse events
There do not appear to be any serious concerns regarding adverse effects of ITF. We have tabulated relevant information in Additional Table 6.
| Study ID | Adverse events results |
| "Only a minority of patients (six [6.1%] of 99 patients) reported mild to moderate treatment‐emergent adverse events on the study. The symptoms included abdominal pain, diarrhea, oral pain, headache, and hypertension (Table 2). Of these, four were considered related to study drug: one (3%) was in the placebo group, two (6%) were in the low‐dose rhITF group, and one (3%) was in the high‐dose rhITF group. The events were isolated and resolved spontaneously without sequelae" |
ITF = intestinal trefoil factor.
No studies assessed the outcomes 'interruptions to cancer treatment', 'oral pain', 'quality of life', 'normalcy of diet', 'number of days in hospital', 'number of days of treatment with opioid analgesics' and 'number of days unable to take medicine orally'.
Intestinal trefoil factor (ITF) dose comparison
There was insufficient evidence, from one study at unclear risk of bias and analysing 66 adults receiving chemotherapy alone for colorectal cancer (Peterson 2009), to determine whether a lower dose (336 mg) or a higher dose (2688 mg) perform better in reducing the risk of oral mucositis of any severity (Analysis 11.1; Analysis 11.2; Analysis 11.3).
Erythropoietin versus placebo
Oral mucositis
Adults receiving bone marrow/stem cell transplantation after conditioning therapy for haematological cancers
One study, at low risk of bias and analysing 80 participants (Hosseinjani 2017), showed weak evidence (due to low sample size) of a reduction in the risk of any level of oral mucositis (RR 0.35, 95% CI 0.21 to 0.60; Analysis 12.1), and moderate to severe oral mucositis (RR 0.43, 95% CI 0.24 to 0.79; Analysis 12.2), both in favour of erythropoietin.
The same study showed weak evidence (due to low sample size and a wide confidence interval) that erythropoietin might reduce the risk of severe oral mucositis, but there is also some possibility of an increase in risk: RR 0.40, 95% CI 0.14 to 1.17 (Analysis 12.3).
Number of days in hospital
Adults receiving bone marrow/stem cell transplantation after conditioning therapy for haematological cancers
There was insufficient evidence, from one study at low risk of bias (Hosseinjani 2017), to determine whether or not erythropoietin reduces the mean number of days in hospital: MD ‐2.95, 95% CI ‐7.73 to 1.83; 80 participants (Analysis 12.4).
No studies assessed the outcomes 'interruptions to cancer treatment', 'oral pain', 'quality of life', 'normalcy of diet', 'adverse events', 'number of days of treatment with opioid analgesics' and 'number of days unable to take medicine orally'.
Transforming growth factor (TGF) versus placebo
Oral mucositis
Adults receiving chemotherapy alone for colorectal cancer
There was insufficient evidence, from one study at high risk of bias and analysing 13 participants (Antoun 2009), to determine whether or not TGF reduces the risk of any level of oral mucositis: RR 0.10, 95% CI 0.01 to 1.71 (Additional Table 7).
| Study ID | Population | Outcome | TGF‐beta(2) | Placebo | Result |
| CT alone for colorectal cancer | Oral mucositis (WHO 0 to 4 scale): any oral mucositis | 0/9 | 2/4 | RR 0.10 (95% CI 0.01 to 1.71); P = 0.11 |
CI = confidence interval; CT = chemotherapy; RR = risk ratio; TGF = transforming growth factor; WHO = World Health Organization.
No studies assessed the outcomes 'interruptions to cancer treatment', 'oral pain', 'quality of life', 'normalcy of diet', 'adverse events', 'number of days in hospital', 'number of days of treatment with opioid analgesics' and 'number of days unable to take medicine orally'.
Discussion
Summary of main results
Thirty‐five studies met our eligibility criteria and were included in this review. We used GRADE methodology to assess the quality of the body of evidence for each of the main comparisons and for the primary outcome of incidence and severity of oral mucositis (GRADE 2004). Most of the evidence we found was for keratinocyte growth factor (KGF: summary of findings Table for the main comparison), granulocyte‐macrophage colony‐stimulating factor (GM‐CSF: summary of findings Table 2), and granulocyte‐colony stimulating factor (G‐CSF: summary of findings Table 3).
Our main findings were as follows.
Keratinocyte growth factor (KGF)
Moderate to severe oral mucositis
-
Adults receiving bone marrow/stem cell transplantation after conditioning therapy for haematological cancer: might be a reduction in risk (11% and ranging from 20% to 1%).
-
Adults receiving radiotherapy to the head and neck with cisplatin/fluorouracil (5FU): probably a reduction in risk (9% and ranging from 17% to no reduction).
-
Adults receiving chemotherapy alone for mixed cancers: likely to be a reduction in risk (44% and ranging from 55% to 30%).
Severe oral mucositis
-
Adults receiving bone marrow/stem cell transplantation after conditioning therapy for haematological cancer: might be a reduction in risk, but some possibility of an increase in risk (15% reduction and ranging from 35% reduction to 11% increase).
-
Adults receiving radiotherapy to the head and neck with cisplatin/fluorouracil (5FU): very likely a reduction in risk (21% and ranging from 31% to 10%).
-
Adults receiving chemotherapy alone for mixed cancers: might be a reduction in risk (60% and ranging from 86% to 35%).
Granulocyte‐macrophage colony‐stimulating factor (GM‐CSF)
Moderate to severe oral mucositis
-
Adults receiving bone marrow/stem cell transplantation after conditioning therapy for haematological cancer: insufficient evidence of a benefit.
-
Adults receiving radiotherapy to the head and neck: insufficient evidence of a benefit.
Severe oral mucositis
-
Adults receiving bone marrow/stem cell transplantation after conditioning therapy for mixed cancers: insufficient evidence of a benefit.
-
Adults receiving radiotherapy to the head and neck: insufficient evidence of a benefit.
-
Adults receiving chemotherapy alone for mixed cancers: insufficient evidence of a benefit.
Granulocyte‐colony stimulating factor (G‐CSF)
Moderate to severe oral mucositis
-
Adults receiving chemotherapy alone for breast cancer: very weak evidence of a possible reduction in risk (67% and ranging from 88% to 5%).
Severe oral mucositis
-
Adults receiving radiotherapy to the head and neck: weak evidence of a possible reduction in risk (63% and ranging from 85% to 13%).
The remaining evidence for the primary outcome was from single‐study comparisons.
-
Epidermal growth factor might reduce the risk of moderate to severe oral mucositis in adults receiving radiotherapy to the head and neck with or without cisplatin, but there was insufficient evidence of a reduction in the risk of either moderate to severe, or severe oral mucositis in adults receiving bone marrow/stem cell transplantation after conditioning therapy for haematological cancer.
-
Intestinal trefoil factor might reduce the risk of moderate to severe oral mucositis in adults receiving chemotherapy alone for colorectal cancer.
-
Erythropoietin might reduce the risk of moderate to severe oral mucositis in adults receiving bone marrow/stem cell transplantation after conditioning therapy for haematological cancer.
There was mostly insufficient evidence of a benefit regarding the secondary outcomes of this review. The interventions investigated all appear to be relatively safe, with only mild to moderate adverse effects reported.
Overall completeness and applicability of evidence
The evidence we have presented in this review allows for some conclusions to be made regarding the effects of KGF for preventing oral mucositis in adults receiving certain types of cancer treatment. However, the evidence is lacking for other cytokines and growth factors, and for children. It is unfortunate that the two studies we found on KGF versus placebo in children were unclear in their reporting and we were unable to present any data. All studies reported on our primary outcome, but the evidence for the secondary outcomes of this review is lacking.
The evidence for KGF should have reasonable external validity as most of the adult population were covered in terms of the types of treatment people have for different types of cancer. The studies were also carried out all over the world and often involved multiple sites. One limitation, however, may be the fact that most studies were done in middle‐income and high‐income countries, so may be less generalisable to people in low‐income countries.
Numerous studies reported on some of our secondary outcomes but did not report the data in a suitable format for inclusion in our meta‐analyses e.g. as median with or without range, area under the curve, or as mean (or a graph) but with no standard deviation/standard error/P value. In such cases, the meta‐analysis is biased by missing information. However, the Cochrane risk of bias tool and meta‐analyses do not currently address this issue adequately. The study may be assessed at high risk of selective outcome reporting, but if the study is not included in the meta‐analysis due to having no data, then this is not reflected or accounted for. This highlights the need for standardisation in both 'what to measure' and 'how to measure it' in clinical trials in this area of research. Otherwise there will continue to be research waste, with data that are not able to be pooled in data syntheses. There are initiatives such as COMET (Core Outcome Measures in Effectiveness Trials) and COSMIN (COnsensus‐based Standards for the selection of health Measurement INstruments) that can help with these issues, and future research in these areas would be beneficial.
During the systematic review process, we developed further concerns regarding the usefulness of the secondary outcomes because it was not clear whether or not they were due to oral mucositis. Hospitalisation, the use of supplemental nutrition or opioid analgesics, and interruptions to cancer treatment could all occur due to reasons other than oral mucositis. Furthermore, it was not always clear if adverse effects were due to the interventions given to prevent oral mucositis. These issues could be improved by clearer and more explicit reporting.
Cost is an issue that we did not consider in this review, but it is one that may affect whether or not the evidence can be applied in some settings. Taking KGF as an example, cost per dose is high but there is currently an absence of high quality health economic evaluations, rendering decision making difficult.
Quality of the evidence
We included 35 randomised controlled trials (RCTs) analysing 3102 participants. Despite this large volume of research, we were not able to make robust conclusions about the effects of most cytokines and growth factors. The strongest body of evidence, both in terms of volume and quality, was for the different populations receiving KGF. We assessed the evidence for KGF in preventing severe oral mucositis in adults receiving radiotherapy to the head and neck with or without cisplatin or fluorouracil as high quality. In the same population, we downgraded the evidence for prevention of moderate to severe oral mucositis by one level due to inconsistency in the individual study results (heterogeneity), resulting in moderate‐quality evidence. In adults receiving chemotherapy alone for mixed cancers, we downgraded the evidence for KGF in preventing moderate to severe oral mucositis once due to publication bias, as we found an unpublished study that would be included in the meta‐analysis, resulting in moderate‐quality evidence (NCT00393822). In the same population, we downgraded the evidence for prevention of severe oral mucositis by two levels: one for publication bias and one for imprecision due to a small sample size, low event rates and a wide confidence interval. This resulted in low‐quality evidence. In adults receiving bone marrow/stem cell transplantation after conditioning therapy for haematological cancers, the evidence for KGF in preventing both moderate to severe and severe oral mucositis was assessed as low quality. We downgraded the evidence by two levels: one for heterogeneity and one for publication bias, as there were two studies for which we could not find published full reports (NCT02313792; Spielberger 2001). There were no concerns over risk of bias in the KGF studies as they are often large multicentre trials which are carried out well, mostly using placebos for blinding purposes, and with very low attrition.
The evidence for GM‐CSF and G‐CSF was weaker, and consequently was rated as being low or very low quality. The reasons for downgrading were mostly due to imprecision because the volume of evidence was much lower and the studies often recruited very few participants, leading to very wide confidence intervals that frequently included both the possibility of a decrease in risk and an increase. Further reasons were risk of performance bias due to lack of blinding in some of these studies, inconsistency, and also because some of the evidence was from single studies. When a body of evidence was from a single study, we automatically downgraded a level. The reasoning behind this was because often, when using GRADE methodology, bodies of evidence are downgraded for inconsistency due to different effect estimates in the individual studies. This inconsistency is not possible for a single‐study body of evidence and therefore not downgrading would falsely inflate the rating of quality, whilst at the same time the larger body of evidence is unfairly penalised, in comparison, due to having more studies. In such cases, we downgraded the single‐study evidence due to indirectness as it may only be generalisable to the particular population who took part in the study.
The remaining evidence for other interventions was from single‐study comparisons and therefore was all considered to be of low to very low quality, mainly for indirectness (as described above) and imprecision.
Potential biases in the review process
Although systematic review methodology is designed to minimise biases in the process, decisions are often made out of necessity or for practical reasons, and this can introduce some potential bias.
Once we began to assess the literature identified by the searches, we became concerned that we may have missed some relevant studies because we had not included search terms for other conditions for which cytokines and growth factors have been used to manage (e.g. diarrhoea, graft‐versus‐host disease, and neutropenia). In order to assess the extent of this potential problem, a rough scoping search was run including the search terms. The yield was very high and a single review author assessed a sample of 500 records, but no further studies were identified. Therefore, we decided not to amend the search by adding the new search terms. We acknowledge the possibility that we have missed some studies that have measured and reported on oral mucositis but not mentioned it in the abstract. This could introduce bias if there are relevant data missing from the review.
There were some studies that had multiple treatment arms with different doses of the cytokine or growth factor. In all instances, we combined the arms to make a pairwise comparison against the control arm thus losing some possible subtleties of the data and potentially biasing the results.
Agreements and disagreements with other studies or reviews
The Mucositis Study Group (MSG) of the Multinational Association of Supportive Care in Cancer/International Society of Oral Oncology (MASCC/ISOO) is the leading international group in this area of research. In 2013, they published a series of systematic reviews on the different interventions for managing oral mucositis, including one on cytokines and growth factors (Raber‐Durlacher 2013). These reviews feed into the MASCC/ISOO Clinical Practice Guidelines for the Management of Mucositis Secondary to Cancer Therapy (Lalla 2014). The MASCC/ISOO systematic review is not limited to RCTs. The current guidance from this group is as follows.
-
Recommendations in favour of an intervention (i.e. strong evidence supporting effectiveness): the panel recommends that recombinant human keratinocyte growth factor‐1 (KGF‐1/palifermin) be used to prevent oral mucositis (at a dose of 60 µg/kg per day for three days prior to conditioning treatment and for three days after transplant) in patients receiving high‐dose chemotherapy and total body irradiation, followed by autologous stem cell transplantation, for a haematological malignancy (level II evidence).
-
Suggestions against an intervention (i.e. weaker evidence indicating lack of effectiveness): the panel suggests that granulocyte‐macrophage colony‐stimulating factor mouthwash not be used to prevent oral mucositis in patients receiving high‐dose chemotherapy, for autologous or allogeneic stem cell transplantation (level II evidence).
For our meta‐analyses for KGF in the above mentioned population, we combined studies of all types of KGF, both with autologous and allogeneic transplants, and with total body irradiation (TBI), without TBI or a mixture of TBI/no TBI. The MASCC/ISOO systematic review separated all of these factors. However, looking at the individual studies in our meta‐analyses, the first recommendation appears to be a valid one. Furthermore, the MASCC/ISOO systematic review states "Evidence on the efficacy of palifermin in autologous HSCT without TBI conditioning is conflicting...and these rather small studies did not allow a guideline. In addition, no guideline could be provided for the use of palifermin in the setting of allogeneic HSCT with or without TBI." Despite our meta‐analyses including some further RCTs not included in the other review, these statements also appear to be valid.
The suggestion against GM‐CSF mouthwash is also a valid one as, although we did not separate studies by mode of administration, it is clear that the two mouthwash studies in our analysis (Analysis 4.3) have conflicting results. However, based on one study on GM‐CSF given intravenously in this population (Nemunaitis 1995), there is promising evidence of a benefit, but the MASCC/ISOO systematic review considered this evidence alongside other studies that we did not include, and concluded that there was no guideline possible.
Our results are not in agreement with the following statements from the MASCC/ISOO systematic review regarding other populations receiving KGF.
-
"No guideline could be provided for the use of palifermin in the setting of CT for solid and hematological tumors...due to insufficient evidence."
-
"In addition, no guideline could be provided for the use of palifermin in H&N RT due to insufficient evidence."
We present some moderate‐ to high‐quality evidence of a benefit for KGF in these populations, possibly warranting new guideline statements in their next update. This evidence would equate to level I evidence in the grading system used in the guidelines ("evidence obtained from meta‐analysis of multiple, well‐designed, controlled studies"). In another Cochrane Review on preventing salivary gland dysfunction in patients receiving radiotherapy to the head and neck, with or without chemotherapy, KGF did not appear to have any detrimental effect on overall survival or progression‐free survival (Riley 2017).

Study flow diagram.
RCT = randomised controlled trial.

Risk of bias summary: review authors' judgements about each risk of bias item for each included study.

Comparison 1 KGF versus placebo, Outcome 1 Oral mucositis (any).

Comparison 1 KGF versus placebo, Outcome 2 Oral mucositis (moderate + severe).
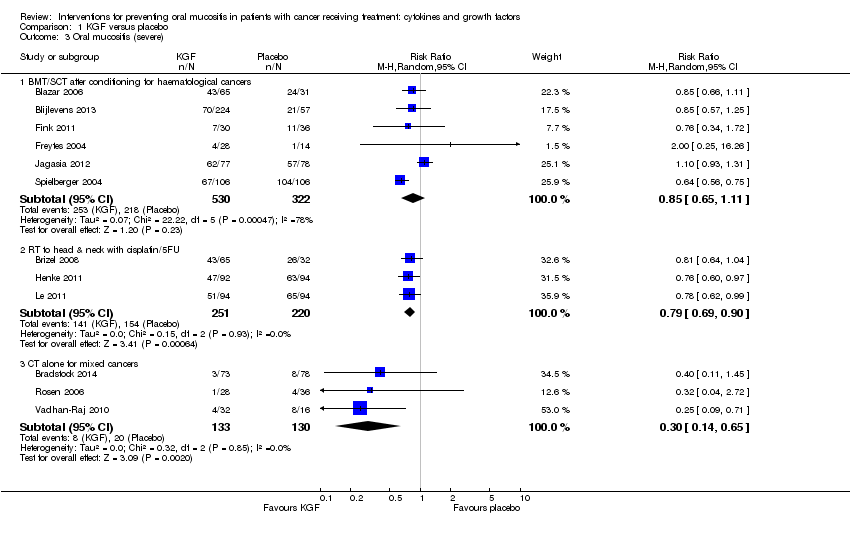
Comparison 1 KGF versus placebo, Outcome 3 Oral mucositis (severe).

Comparison 1 KGF versus placebo, Outcome 4 Interruptions to cancer treatment (unscheduled RT breaks of 5 or more days).

Comparison 1 KGF versus placebo, Outcome 5 Interruptions to cancer treatment (chemotherapy delays/discontinuations).
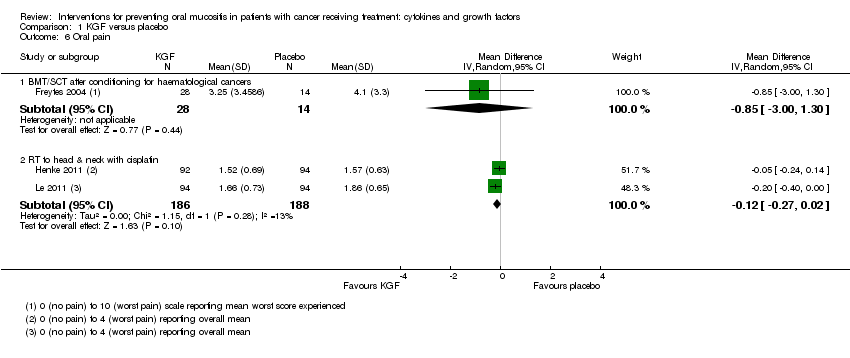
Comparison 1 KGF versus placebo, Outcome 6 Oral pain.
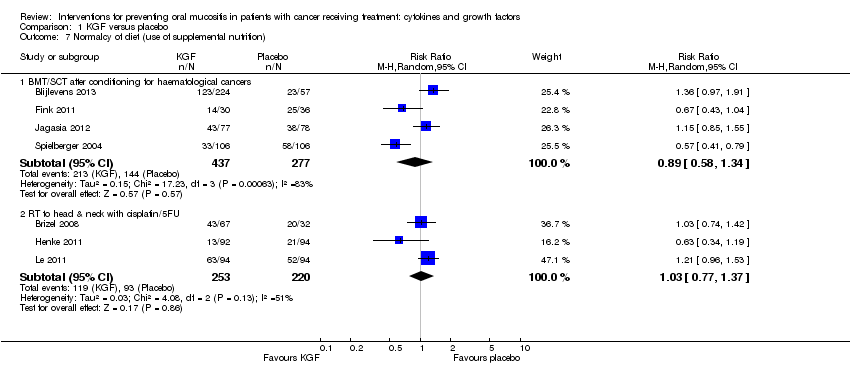
Comparison 1 KGF versus placebo, Outcome 7 Normalcy of diet (use of supplemental nutrition).
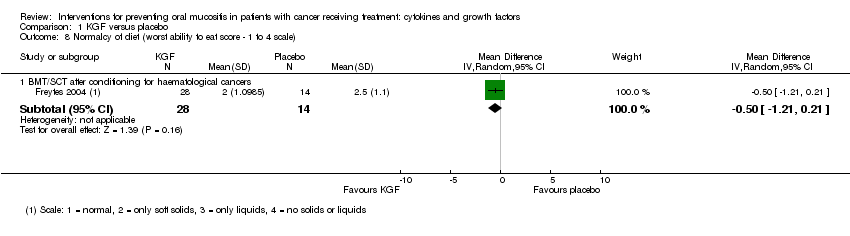
Comparison 1 KGF versus placebo, Outcome 8 Normalcy of diet (worst ability to eat score ‐ 1 to 4 scale).
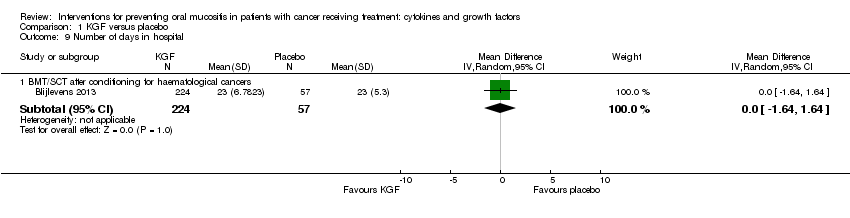
Comparison 1 KGF versus placebo, Outcome 9 Number of days in hospital.
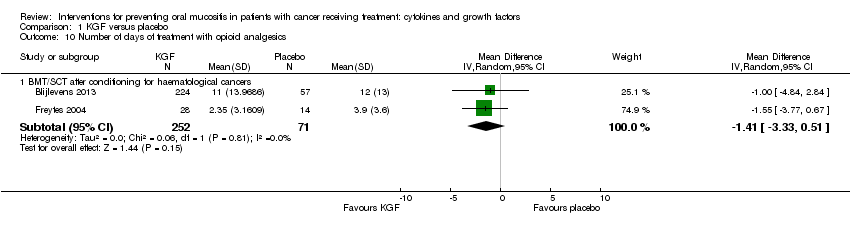
Comparison 1 KGF versus placebo, Outcome 10 Number of days of treatment with opioid analgesics.

Comparison 2 KGF (dose comparison), Outcome 1 Oral mucositis (any).
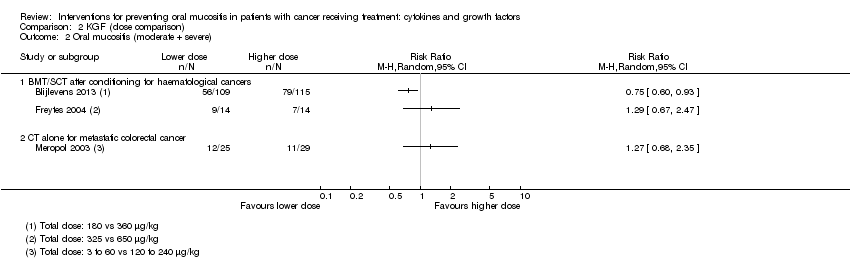
Comparison 2 KGF (dose comparison), Outcome 2 Oral mucositis (moderate + severe).

Comparison 2 KGF (dose comparison), Outcome 3 Oral mucositis (severe).
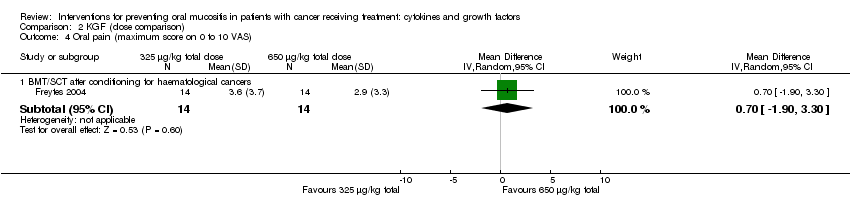
Comparison 2 KGF (dose comparison), Outcome 4 Oral pain (maximum score on 0 to 10 VAS).

Comparison 2 KGF (dose comparison), Outcome 5 Normalcy of diet (use of TPN).
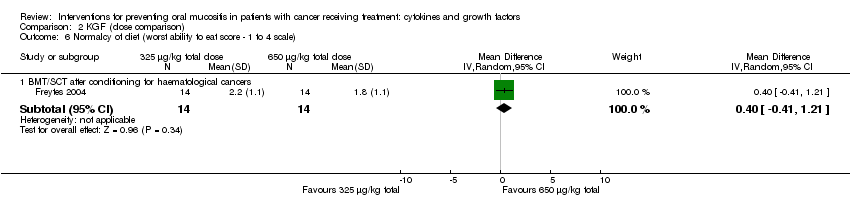
Comparison 2 KGF (dose comparison), Outcome 6 Normalcy of diet (worst ability to eat score ‐ 1 to 4 scale).
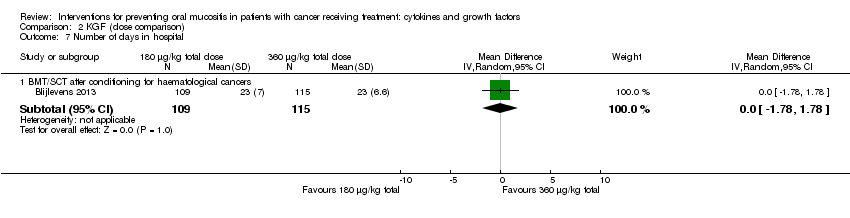
Comparison 2 KGF (dose comparison), Outcome 7 Number of days in hospital.
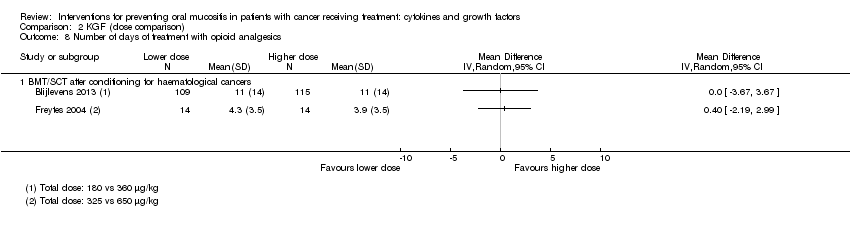
Comparison 2 KGF (dose comparison), Outcome 8 Number of days of treatment with opioid analgesics.
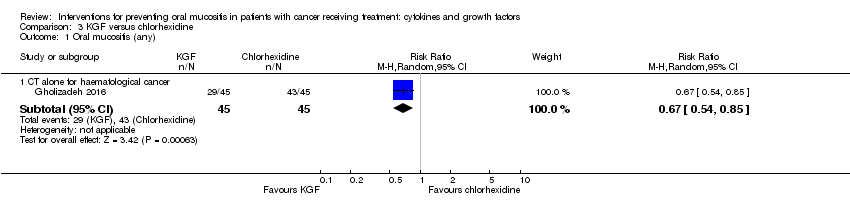
Comparison 3 KGF versus chlorhexidine, Outcome 1 Oral mucositis (any).
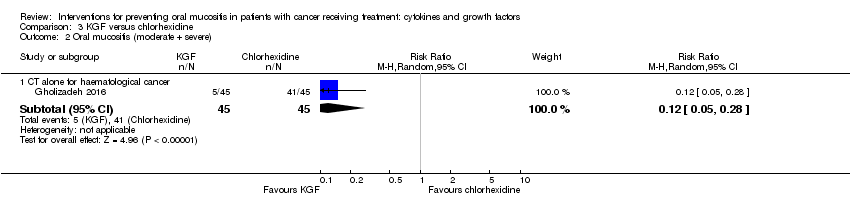
Comparison 3 KGF versus chlorhexidine, Outcome 2 Oral mucositis (moderate + severe).
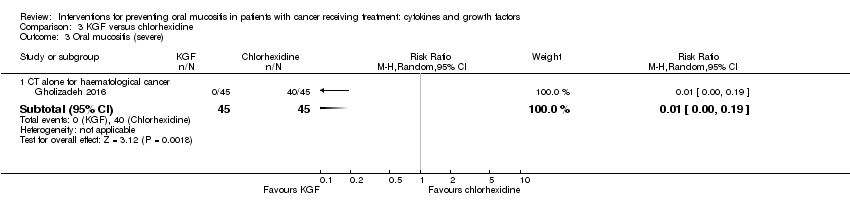
Comparison 3 KGF versus chlorhexidine, Outcome 3 Oral mucositis (severe).

Comparison 4 GM‐CSF versus placebo/no treatment, Outcome 1 Oral mucositis (any).

Comparison 4 GM‐CSF versus placebo/no treatment, Outcome 2 Oral mucositis (moderate + severe).

Comparison 4 GM‐CSF versus placebo/no treatment, Outcome 3 Oral mucositis (severe).
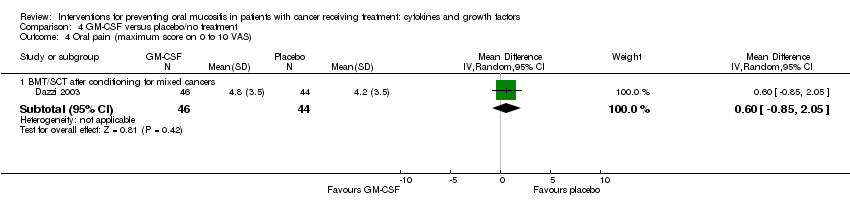
Comparison 4 GM‐CSF versus placebo/no treatment, Outcome 4 Oral pain (maximum score on 0 to 10 VAS).

Comparison 4 GM‐CSF versus placebo/no treatment, Outcome 5 Normalcy of diet (use of feeding tube/parenteral nutrition).

Comparison 4 GM‐CSF versus placebo/no treatment, Outcome 6 Number of days of treatment with opioid analgesics.
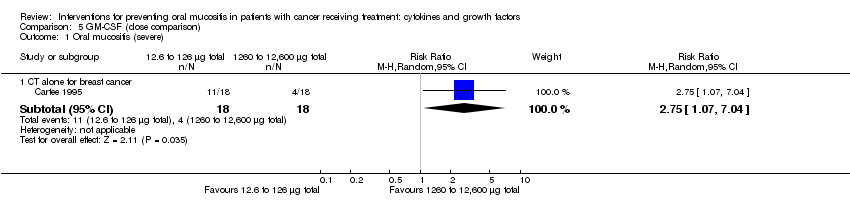
Comparison 5 GM‐CSF (dose comparison), Outcome 1 Oral mucositis (severe).

Comparison 6 GM‐CSF versus sucralfate, Outcome 1 Oral mucositis (moderate + severe).
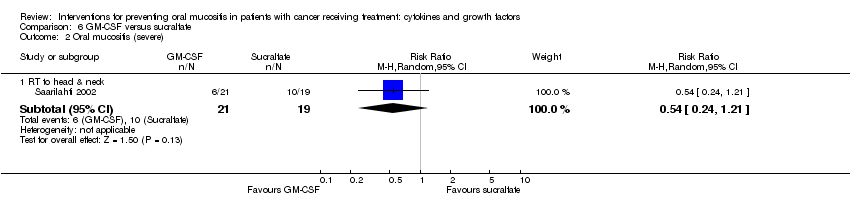
Comparison 6 GM‐CSF versus sucralfate, Outcome 2 Oral mucositis (severe).
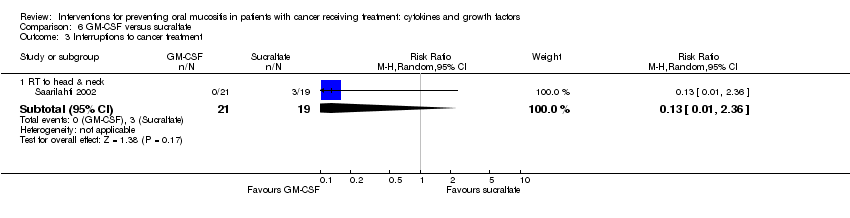
Comparison 6 GM‐CSF versus sucralfate, Outcome 3 Interruptions to cancer treatment.
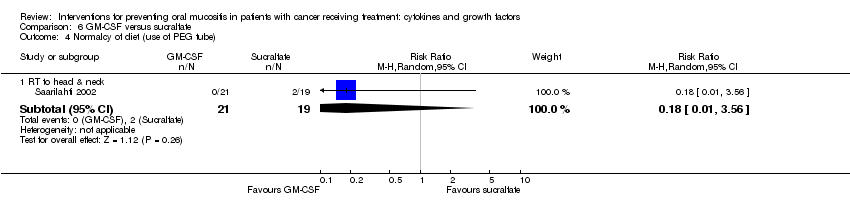
Comparison 6 GM‐CSF versus sucralfate, Outcome 4 Normalcy of diet (use of PEG tube).

Comparison 7 G‐CSF versus placebo/no treatment, Outcome 1 Oral mucositis (any).

Comparison 7 G‐CSF versus placebo/no treatment, Outcome 2 Oral mucositis (moderate + severe).

Comparison 7 G‐CSF versus placebo/no treatment, Outcome 3 Oral mucositis (severe).
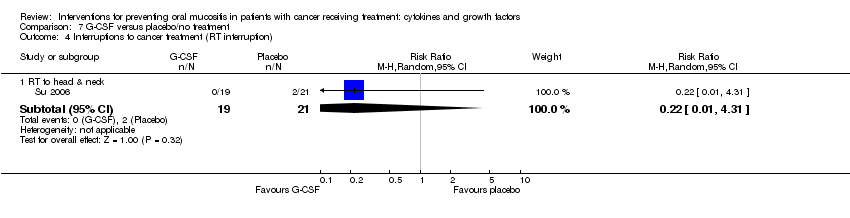
Comparison 7 G‐CSF versus placebo/no treatment, Outcome 4 Interruptions to cancer treatment (RT interruption).
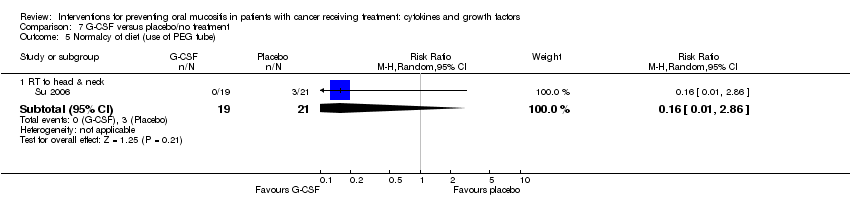
Comparison 7 G‐CSF versus placebo/no treatment, Outcome 5 Normalcy of diet (use of PEG tube).
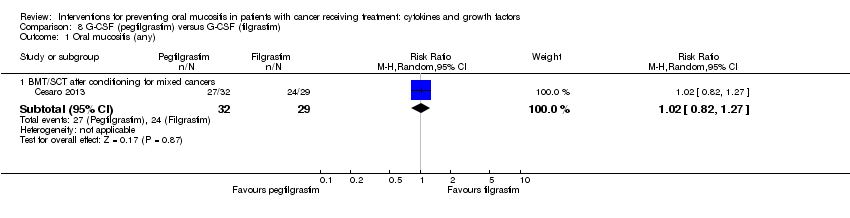
Comparison 8 G‐CSF (pegfilgrastim) versus G‐CSF (filgrastim), Outcome 1 Oral mucositis (any).
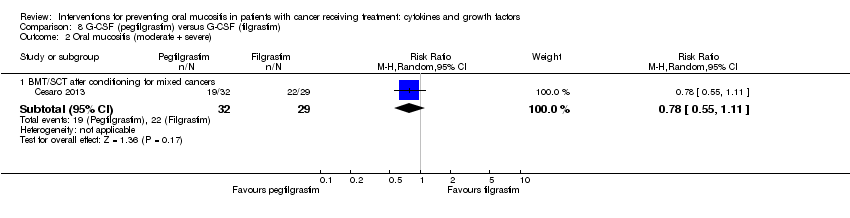
Comparison 8 G‐CSF (pegfilgrastim) versus G‐CSF (filgrastim), Outcome 2 Oral mucositis (moderate + severe).

Comparison 8 G‐CSF (pegfilgrastim) versus G‐CSF (filgrastim), Outcome 3 Normalcy of diet (use of supplemental nutrition).
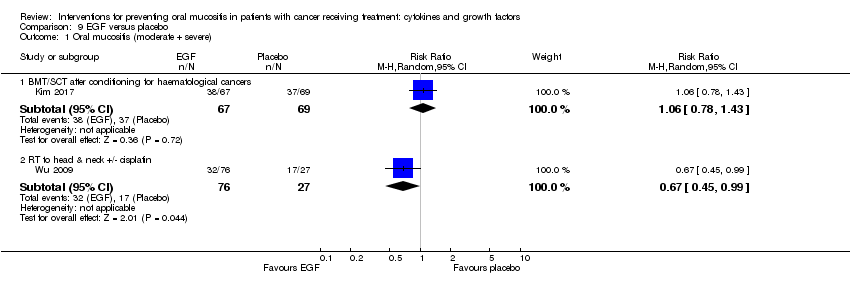
Comparison 9 EGF versus placebo, Outcome 1 Oral mucositis (moderate + severe).

Comparison 9 EGF versus placebo, Outcome 2 Oral mucositis (severe).
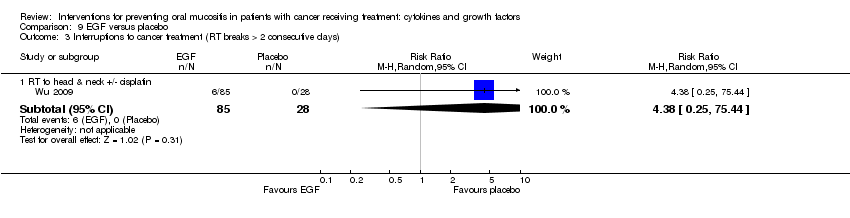
Comparison 9 EGF versus placebo, Outcome 3 Interruptions to cancer treatment (RT breaks > 2 consecutive days).
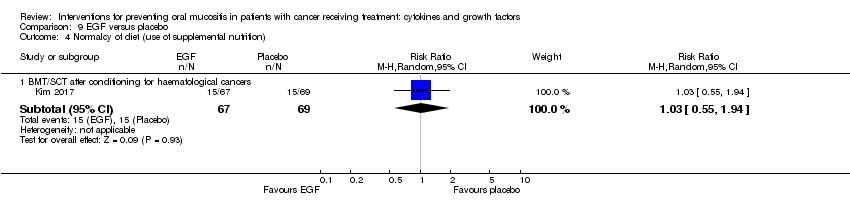
Comparison 9 EGF versus placebo, Outcome 4 Normalcy of diet (use of supplemental nutrition).

Comparison 10 ITF versus placebo, Outcome 1 Oral mucositis (any).

Comparison 10 ITF versus placebo, Outcome 2 Oral mucositis (moderate + severe).
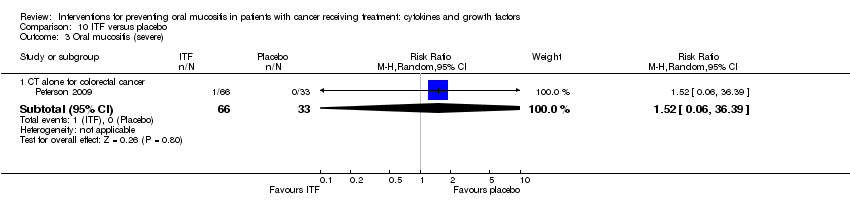
Comparison 10 ITF versus placebo, Outcome 3 Oral mucositis (severe).
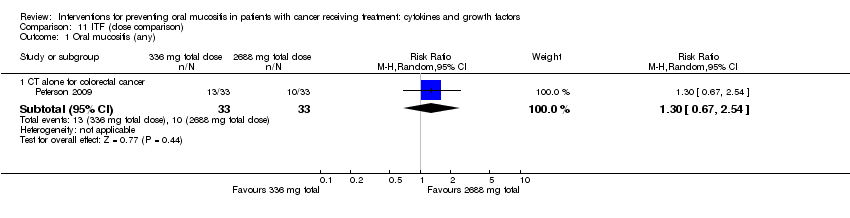
Comparison 11 ITF (dose comparison), Outcome 1 Oral mucositis (any).

Comparison 11 ITF (dose comparison), Outcome 2 Oral mucositis (moderate + severe).

Comparison 11 ITF (dose comparison), Outcome 3 Oral mucositis (severe).
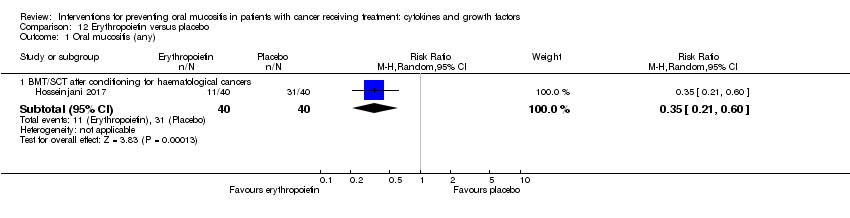
Comparison 12 Erythropoietin versus placebo, Outcome 1 Oral mucositis (any).
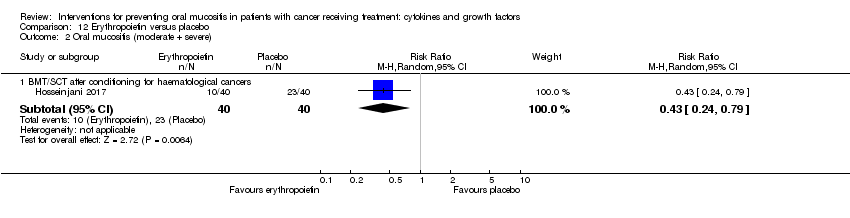
Comparison 12 Erythropoietin versus placebo, Outcome 2 Oral mucositis (moderate + severe).

Comparison 12 Erythropoietin versus placebo, Outcome 3 Oral mucositis (severe).
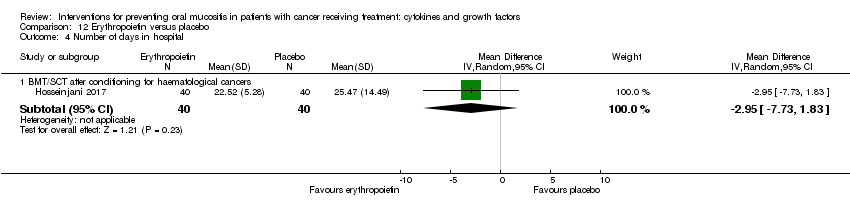
Comparison 12 Erythropoietin versus placebo, Outcome 4 Number of days in hospital.
| KGF compared to placebo for preventing oral mucositis in adults with cancer receiving treatment | ||||||
| Patient or population: adults** receiving treatment for cancer (see subgroup for treatment type) | ||||||
| Outcomes | Anticipated absolute effects* (95% CI) | Relative effect | Number of participants | Quality of the evidence | Comments | |
| Risk with placebo | Risk with KGF | |||||
| Oral mucositis (moderate + severe) | BMT/SCT after conditioning for haematological cancers | RR 0.89 | 852 | ⊕⊕⊝⊝ | There might be a benefit for KGF in this population NNTB = 11 (95% CI 6 to 112) | |
| 848 per 1000 | 755 per 1000 | |||||
| RT to head and neck with cisplatin/5FU | RR 0.91 | 471 | ⊕⊕⊕⊝ | There is probably a benefit for KGF in this population NNTB = 12 (95% CI 7 to ∞) | ||
| 932 per 1000 | 848 per 1000 | |||||
| CT alone for mixed cancers | RR 0.56 | 344 | ⊕⊕⊕⊝ | It is likely that there is a benefit for KGF in this population NNTB = 4 (95% CI 3 to 6) | ||
| 631 per 1000 | 353 per 1000 | |||||
| Oral mucositis (severe) | BMT/SCT after conditioning for haematological cancers | RR 0.85 | 852 | ⊕⊕⊝⊝ | There might be a benefit for KGF in this population, but there is also some possibility of an increase in risk NNTB = 10 (95% CI 5 NNTB to 14 NNTH) | |
| 677 per 1000 | 575 per 1000 | |||||
| RT to head and neck with cisplatin/5FU | RR 0.79 | 471 | ⊕⊕⊕⊕ | It is very likely that there is a benefit for KGF in this population NNTB = 7 (95% CI 5 to 15) | ||
| 700 per 1000 | 553 per 1000 | |||||
| CT alone for mixed cancers | RR 0.30 | 263 | ⊕⊕⊝⊝ | There might be a benefit for KGF in this population NNTB = 10 (95% CI 8 to 19) | ||
| 154 per 1000 | 46 per 1000 | |||||
| Adverse events | Adverse events that were attributed to the study drugs rather than the cancer therapy were typically oral‐related or skin‐related. Events were mostly mild to moderate with very few incidences of serious events. However, reporting was poor and inconsistent, meaning that it was not appropriate to meta‐analyse data | |||||
| *The risk in the intervention group (and its 95% confidence interval) is based on the assumed risk in the comparison group and the relative effect of the intervention (and its 95% CI). ***The number of people that would need to receive KGF in order to prevent 1 additional person from developing the outcome. Calculated as 1 divided by the absolute risk reduction (which is the control arm event rate minus the experimental arm event rate). NNTH means the number of people that would need to receive KGF to cause 1 additional person to develop the outcome. All decimal places have been rounded up to the nearest whole number (i.e. 6.1 = 7). | ||||||
| GRADE Working Group grades of evidence | ||||||
| 1Downgraded by 1 level for inconsistency (substantial heterogeneity: I2 = 50% to 90%, P < 0.1); downgraded 1 further level for publication bias as there are 2 references in Studies awaiting classification that would be included in the conditioning/transplant subgroup, but the data are not available (NCT02313792; Spielberger 2001). | ||||||
| GM‐CSF compared to placebo/no treatment for preventing oral mucositis in adults with cancer receiving treatment | ||||||
| Patient or population: adults** receiving treatment for cancer (see subgroup for treatment type) | ||||||
| Outcomes | Anticipated absolute effects* (95% CI) | Relative effect | Number of participants | Quality of the evidence | Comments | |
| Risk with placebo/no treatment | Risk with GM‐CSF | |||||
| Oral mucositis (moderate + severe) | BMT/SCT after conditioning for haematological cancers | RR 0.94 | 109 | ⊕⊝⊝⊝ | There is insufficient evidence to determine a benefit for GM‐CSF in this population NNTB = 20 (95% CI 6 NNTB to 10 NNTH) | |
| 839 per 1000 | 789 per 1000 | |||||
| RT to head and neck | RR 0.72 | 29 | ⊕⊝⊝⊝ | There is insufficient evidence to determine a benefit for GM‐CSF in this population NNTB = 4 (95% CI 3 NNTB to 14 NNTH) | ||
| 929 per 1000 | 669 per 1000 | |||||
| Oral mucositis (severe) | BMT/SCT after conditioning for mixed cancers | RR 0.74 | 235 | ⊕⊕⊝⊝ | There is insufficient evidence to determine a benefit for GM‐CSF in this population NNTB = 12 (95% CI 5 NNTB to 5 NNTH) | |
| 347 per 1000 | 257 per 1000 | |||||
| RT to head and neck | RR 0.31 | 29 | ⊕⊝⊝⊝ | There is insufficient evidence to determine a benefit for GM‐CSF in this population NNTB = 21 (95% CI 15 NNTB to 3 NNTH) | ||
| 71 per 1000 | 22 per 1000 | |||||
| CT alone for mixed cancers | RR 0.59 | 65 | ⊕⊝⊝⊝ | There is insufficient evidence to determine a benefit for GM‐CSF in this population NNTB = 5 (95% CI 3 NNTB to 2 NNTH) | ||
| 500 per 1000 | 295 per 1000 | |||||
| Adverse events | Adverse events that were attributed to the study drugs rather than the cancer therapy were typically bone pain, nausea, fever and headache. Events were not reported as being serious. Some studies did not report adverse events and 1 even reported that there were none. However, reporting was poor and inconsistent, meaning that it was not appropriate to meta‐analyse data | |||||
| *The risk in the intervention group (and its 95% confidence interval) is based on the assumed risk in the comparison group and the relative effect of the intervention (and its 95% CI). ***The number of people that would need to receive GM‐CSF in order to prevent 1 additional person from developing the outcome. Calculated as 1 divided by the absolute risk reduction (which is the control arm event rate minus the experimental arm event rate). NNTH means the number of people that would need to receive GM‐CSF to cause 1 additional person to develop the outcome. All decimal places have been rounded up to the nearest whole number (i.e. 6.1 = 7). | ||||||
| GRADE Working Group grades of evidence | ||||||
| 1Downgraded by 2 levels for imprecision (single study with a small sample size and the confidence interval includes a possible increase in risk that is of a similar magnitude to the possible reduction in risk); downgraded 1 further level for indirectness (single study so not widely generalisable). | ||||||
| G‐CSF compared to placebo/no treatment for preventing oral mucositis in patients with cancer receiving treatment | ||||||
| Patient or population: adults** receiving treatment for cancer (see subgroup for treatment type) | ||||||
| Outcomes | Anticipated absolute effects* (95% CI) | Relative effect | Number of participants | Quality of the evidence | Comments | |
| Risk with placebo/no treatment | Risk with G‐CSF | |||||
| Oral mucositis (moderate + severe) | CT alone for breast cancer | RR 0.33 | 14 | ⊕⊝⊝⊝ | There is very weak evidence that there might be a benefit for G‐CSF in this population NNTB = 2 (95% CI 2 to 20) | |
| 1000 per 1000 | 330 per 1000 | |||||
| Oral mucositis (severe) | RT to head and neck | RR 0.37 | 54 | ⊕⊕⊝⊝ | There is weak evidence that there might be a benefit for G‐CSF in this population NNTB = 3 (95% CI 3 to 15) | |
| 519 per 1000 | 192 per 1000 | |||||
| Adverse events | There was limited evidence of adverse events for G‐CSF. 2 of the 6 studies did not report adverse events. There were low rates of mild to moderate events, the most common of which appeared to be bone pain. However, reporting was poor and inconsistent, meaning that it was not appropriate to meta‐analyse data | |||||
| *The risk in the intervention group (and its 95% confidence interval) is based on the assumed risk in the comparison group and the relative effect of the intervention (and its 95% CI). ***The number of people that would need to receive G‐CSF in order to prevent 1 additional person from developing the outcome. Calculated as 1 divided by the absolute risk reduction (which is the control arm event rate minus the experimental arm event rate). NNTH means the number of people that would need to receive G‐CSF to cause 1 additional person to develop the outcome. All decimal places have been rounded up to the nearest whole number (i.e. 6.1 = 7). | ||||||
| GRADE Working Group grades of evidence | ||||||
| 1Downgraded by 2 levels for imprecision (wide confidence interval and very small sample size); downgraded by 1 further level for high risk of performance bias; downgraded by 1 further level for indirectness (single study so not widely generalisable). | ||||||
| Study ID | Adverse events results |
|
| |
|
| |
| Insufficient evidence of a difference in infection or Grade 3 to 4 (NCI‐CTC 0 to 4 toxicity scale) skin rash/desquamation | |
| The study authors state that most adverse events were considered to be caused by the cancer treatment or the underlying cancer itself and not related to study treatment. 2 participants in the palifermin group had serious adverse events considered to be related to the intervention: 1 had increased sputum production; the other had dehydration, dysphagia, pain (including abdominal), pancreatitis, and subsequently had schistosomiasis | |
| Total of 28 side effects in palifermin group occurring in 11 of 22 patients (50%) who received at least 4 of the 6 doses. Most frequent (90.9%) were cases of erythema or exanthema, often associated with itching (54.5%). Often (54.5%) a swelling of the oral mucosa including the tongue occurred. In 4 out of 6 patients, this was accompanied by taste disturbance. The severity of side effects were classified as mild to moderate. The CTC Grade 3 occurred only once in the form of a strong heat sensation In 1 of the 11 cases, there was premature discontinuation of palifermin due to severe facial swelling with eyelid and laryngeal pain as well as painful swelling of the hands following the second injection | |
| 25 different adverse events were reported and were mostly not KGF‐related. There was insufficient evidence of a difference for diarrhoea, abdominal pain, infection or rash | |
| "..two patients reported knee joint pain, skin rash was observed in one patient, two patients had abnormal taste, and one showed lingual mucosal thickening" (control group was chlorhexidine mouthrinse. The authors do not report the events by treatment group) | |
|
| |
| KGF‐related AEs with incidence ≥ 5% in KGF group: higher rate of gastrointestinal disorders in KGF group (18/78 versus 2/73; RR 8.42, 95% CI 2.02 to 35.04; P = 0.003). Insufficient evidence of a difference in any AE, tongue coating, tongue disorder, skin and subcutaneous tissue disorders, rash, pruritus, or erythema | |
| "Study drug–related AEs were reported for 35% of palifermin and 11% of placebo patients. The most frequent study drug–related AEs (palifermin, placebo) were rash (9%, 2%), flushing (5%, 0%), dysgeusia (5%, 1%), nausea (4%, 1%),and vomiting (3%, 1%). None of these events led to study withdrawal. Serious AEs considered related to study treatment were reported for five palifermin patients (5%; one each with necrotic pancreatitis, hypersensitivity, tracheostomy malfunction, peritoneal carcinoma, and convulsion) and two placebo patients (2%; one each with hepatitis/hepatic enzyme increase and cryptogenic organizing pneumonia)" | |
| "The administration of palifermin was generally safe and without considerable complications. The only adverse reactions were rashes (lasting for 48–72 hours) localized to the face, upper neck and shoulders, erythema, and altered taste (consistent with the pharmacologic action of palifermin of oral epithelium and skin), most of which were of NCI grade 1 or 2 severity" | |
| "The administration of palifermin was mostly safe and without substantial complications. The mean duration of the OM and the number of adverse event was significant less in the palifermin group (Tables II, III, Figure 1). The main adverse episodes were erythema, cutaneous rashes and altered taste and three of the patients in the palifermin group showed a light thickness of the tongue, mouth and palate" | |
| "Although the predefined frequency of DLTs attributable to KGF was not reached with KGF doses between 1 and 80 µg/kg/d, there were three adverse reactions involving the skin that required discontinuation of KGF in the 18 patients treated with 60 or 80 µg/kg (Table 5). Overall, skin and oral adverse events (rash, flushing, pruritis, edema, hypoesthesia, paresthesia, tongue disorder [thickening], and alteration in taste sensation) attributed to KGF occurred in 13 of 18 patients treated with 60 and 80 µg/kg of KGF (eight patients, grade 1; four patients, grade 2; and one patient, grade 3) and in three of 11 patients treated with 40 µg/kg (all grade 1). These events were reported in 16 of 39 patients (41%) dosed with KGF at > 20 µg/kg/d, whereas these symptoms were reported in only two of 21 subjects (10%) treated with placebo. The skin and oral toxicities associated with KGF were generally mild to moderate in severity, with onset approximately 36 hours after the first dose of KGF and resolution 7 to 10 days thereafter" | |
|
| |
| "The incidence, frequency, and severity of adverse events were similar in the two groups, and most were attributable to the underlying cancer, cytotoxic chemotherapy, or total‐body irradiation. Those that occurred with an incidence that was at least 5 percentage points higher in the palifermin group than in the placebo group are listed in Table 3. Most of these adverse events were consistent with the pharmacologic action of palifermin on skin and oral epithelium (e.g., rash, pruritus, erythema, paresthesia, mouth and tongue disorders, and taste alteration). All these events were mild to moderate in severity, transient (occurring approximately three days after the third dose of palifermin and lasting approximately three days), and not a cause for the discontinuation of study drug. Serious adverse events considered to be related to treatment occurred in one palifermin recipient (rash) and one placebo recipient (hypotension)" | |
|
| |
| AE = adverse event; CI = confidence interval; KGF = keratinocyte growth factor; NCI‐CTC = National Cancer Institute common toxicity criteria; RR = risk ratio; WHO = World Health Organization. | |
| Study ID | Adverse events results |
| 2 participants (group allocation not reported) withdrew by day 3 due to intolerance to their mouthwash (dry mouth); 1 participant receiving GM‐CSF (1 µg/mL) had mouthwash withdrawn by day 3 due to possible allergic reaction (sensation of fullness in the posterior pharyngeal area) but resolved within 4 hours (the participant was withdrawn but appears to have been included in the analysis) | |
| "One patient had fever and chills, and two patients had general malaise and headache during GM‐CSF treatment. No patient had evidence of fluid retention after GM‐CSF" | |
| Not reported | |
| (Sucralfate given to both groups) "Only 2 of the 20 patients treated with GM‐CSF and sucralfate did not experience any side effects related to the drugs, but most side effects were mild (WHO Grade 1 or 2). The most common side effects were local skin reactions, fever, bone pain, and mild nausea...In the control group only 1 patient complained of nausea possibly related to the use of sucralfate, and another patient interrupted sucralfate treatment because of the same reason" | |
| "12 patients who received GM‐CSF had elevated white cell counts (WCC). The range of maximal WCC was 7.2–30.5 (median 19.7). All WCC had returned to normal within 3 weeks of completing injections (median 2 weeks). Three patients developed influenza‐like symptoms with the GM‐CSF and in one patient the injections were stopped because of this symptom. One patient developed an erythematous rash at his injection sites after completing his course of 14 injections (Figure 3). He had a past history of allergy to radiographic contrast medium" | |
|
| |
| (Comparator was sucralfate) "Both mouthwashes were well tolerated, and none of the patients reported any adverse effects related to the mouthwashes. Adverse effects commonly associated with subcutaneous GM‐CSF administration, such as nausea, vomiting, bone pain, headaches, and fever, were not observed" | |
| Not reported | |
| GM‐CSF = granulocyte‐macrophage colony‐stimulating factor. | |
| Study ID | Population | Outcome | GM‐CSF | Placebo | Result |
| BMT/SCT after conditioning for haematological cancers | Oral mucositis: no scale described | No data | No data | "There was no difference in the frequency of stomatitis (defined as a sore, infected or ulcerated mouth, lips or pharynx), the incidence being between 29 and 33% in all groups" | |
| BMT = bone marrow transplantation; G‐CSF: granulocyte‐colony stimulating factor; SCT = stem cell transplantation. | |||||
| Study ID | Adverse events results |
| "Both pegfilgrastim and filgrastim were well tolerated and no significant adverse effects were associated with their use" (G‐CSF versus G‐CSF) | |
| Approximately 20% of participants receiving G‐CSF experienced mild to moderate skeletal pain which was resolved by using oral analgesics; 6% of participants in both groups reported mild generalised rash/itching; 3 participants experienced an event thought to be G‐CSF‐related and which caused them to request withdrawal from the study: abdominal pain, diffuse aches and pains, and a flare‐up of pre‐existing eczema | |
| Not reported | |
| "There was no difference in the overall frequency of adverse clinical or laboratory events between the groups or in the frequency of adverse events thought by the clinicians to be possibly or probably due to study medication" | |
| Not reported | |
| "In general, toxicities typical of postoperative RT to the head and neck were observed. Additional toxicities attributable to G‐CSF and/or daily injections were as follows: elevated WBC requiring G‐CSF dose reduction by prospectively planned guidelines occurred in nine patients in the GCSF arm; grade 2–3 bone pain was observed in two patients in the G‐CSF arm; three patients refused injection (2 G‐CSF, 1 placebo)" | |
| G‐CSF = granulocyte‐colony stimulating factor. | |
| Study ID | Adverse events results |
| "Adverse events were similar in both groups (Table 3). The most common adverse event in the rhEGF group was nausea (n = 7, 10.4%). The incidence of other adverse events including oral pain, dry mouth, and taste alteration was low. All the adverse events were mild and transient. No grade 3 or 4 adverse events were noted during the study period" (there were no differences between groups in any adverse event) | |
| "The frequency of minor and serious adverse events was similar in all groups. Most adverse events were related to primary disease status and treatment modalities" | |
| EGF = epidermal growth factor. | |
| Study ID | Adverse events results |
| "Only a minority of patients (six [6.1%] of 99 patients) reported mild to moderate treatment‐emergent adverse events on the study. The symptoms included abdominal pain, diarrhea, oral pain, headache, and hypertension (Table 2). Of these, four were considered related to study drug: one (3%) was in the placebo group, two (6%) were in the low‐dose rhITF group, and one (3%) was in the high‐dose rhITF group. The events were isolated and resolved spontaneously without sequelae" | |
| ITF = intestinal trefoil factor. | |
| Study ID | Population | Outcome | TGF‐beta(2) | Placebo | Result |
| CT alone for colorectal cancer | Oral mucositis (WHO 0 to 4 scale): any oral mucositis | 0/9 | 2/4 | RR 0.10 (95% CI 0.01 to 1.71); P = 0.11 | |
| CI = confidence interval; CT = chemotherapy; RR = risk ratio; TGF = transforming growth factor; WHO = World Health Organization. | |||||
| Outcome or subgroup title | No. of studies | No. of participants | Statistical method | Effect size |
| 1 Oral mucositis (any) Show forest plot | 8 | Risk Ratio (M‐H, Random, 95% CI) | Subtotals only | |
| 1.1 BMT/SCT after conditioning for haematological cancers | 4 | 655 | Risk Ratio (M‐H, Random, 95% CI) | 0.96 [0.88, 1.05] |
| 1.2 RT to head & neck with cisplatin | 2 | 374 | Risk Ratio (M‐H, Random, 95% CI) | 0.95 [0.90, 1.00] |
| 1.3 CT alone for mixed cancers | 2 | 215 | Risk Ratio (M‐H, Random, 95% CI) | 0.71 [0.60, 0.85] |
| 2 Oral mucositis (moderate + severe) Show forest plot | 13 | Risk Ratio (M‐H, Random, 95% CI) | Subtotals only | |
| 2.1 BMT/SCT after conditioning for haematological cancers | 6 | 852 | Risk Ratio (M‐H, Random, 95% CI) | 0.89 [0.80, 0.99] |
| 2.2 RT to head & neck with cisplatin/5FU | 3 | 471 | Risk Ratio (M‐H, Random, 95% CI) | 0.91 [0.83, 1.00] |
| 2.3 CT alone for mixed cancers | 4 | 344 | Risk Ratio (M‐H, Random, 95% CI) | 0.56 [0.45, 0.70] |
| 3 Oral mucositis (severe) Show forest plot | 12 | Risk Ratio (M‐H, Random, 95% CI) | Subtotals only | |
| 3.1 BMT/SCT after conditioning for haematological cancers | 6 | 852 | Risk Ratio (M‐H, Random, 95% CI) | 0.85 [0.65, 1.11] |
| 3.2 RT to head & neck with cisplatin/5FU | 3 | 471 | Risk Ratio (M‐H, Random, 95% CI) | 0.79 [0.69, 0.90] |
| 3.3 CT alone for mixed cancers | 3 | 263 | Risk Ratio (M‐H, Random, 95% CI) | 0.30 [0.14, 0.65] |
| 4 Interruptions to cancer treatment (unscheduled RT breaks of 5 or more days) Show forest plot | 3 | Risk Ratio (M‐H, Random, 95% CI) | Subtotals only | |
| 4.1 RT to head & neck with cisplatin/5FU | 3 | 473 | Risk Ratio (M‐H, Random, 95% CI) | 1.01 [0.65, 1.59] |
| 5 Interruptions to cancer treatment (chemotherapy delays/discontinuations) Show forest plot | 2 | Risk Ratio (M‐H, Random, 95% CI) | Subtotals only | |
| 5.1 RT to head & neck with cisplatin | 2 | 374 | Risk Ratio (M‐H, Random, 95% CI) | 0.96 [0.62, 1.47] |
| 6 Oral pain Show forest plot | 3 | Mean Difference (IV, Random, 95% CI) | Subtotals only | |
| 6.1 BMT/SCT after conditioning for haematological cancers | 1 | 42 | Mean Difference (IV, Random, 95% CI) | ‐0.85 [‐3.00, 1.30] |
| 6.2 RT to head & neck with cisplatin | 2 | 374 | Mean Difference (IV, Random, 95% CI) | ‐0.12 [‐0.27, 0.02] |
| 7 Normalcy of diet (use of supplemental nutrition) Show forest plot | 7 | Risk Ratio (M‐H, Random, 95% CI) | Subtotals only | |
| 7.1 BMT/SCT after conditioning for haematological cancers | 4 | 714 | Risk Ratio (M‐H, Random, 95% CI) | 0.89 [0.58, 1.34] |
| 7.2 RT to head & neck with cisplatin/5FU | 3 | 473 | Risk Ratio (M‐H, Random, 95% CI) | 1.03 [0.77, 1.37] |
| 8 Normalcy of diet (worst ability to eat score ‐ 1 to 4 scale) Show forest plot | 1 | Mean Difference (IV, Random, 95% CI) | Subtotals only | |
| 8.1 BMT/SCT after conditioning for haematological cancers | 1 | 42 | Mean Difference (IV, Random, 95% CI) | ‐0.5 [‐1.21, 0.21] |
| 9 Number of days in hospital Show forest plot | 1 | Mean Difference (IV, Random, 95% CI) | Subtotals only | |
| 9.1 BMT/SCT after conditioning for haematological cancers | 1 | 281 | Mean Difference (IV, Random, 95% CI) | 0.0 [‐1.64, 1.64] |
| 10 Number of days of treatment with opioid analgesics Show forest plot | 2 | Mean Difference (IV, Random, 95% CI) | Subtotals only | |
| 10.1 BMT/SCT after conditioning for haematological cancers | 2 | 323 | Mean Difference (IV, Random, 95% CI) | ‐1.41 [‐3.33, 0.51] |
| Outcome or subgroup title | No. of studies | No. of participants | Statistical method | Effect size |
| 1 Oral mucositis (any) Show forest plot | 1 | Risk Ratio (M‐H, Random, 95% CI) | Subtotals only | |
| 1.1 BMT/SCT after conditioning for haematological cancers | 1 | 224 | Risk Ratio (M‐H, Random, 95% CI) | 0.88 [0.75, 1.03] |
| 2 Oral mucositis (moderate + severe) Show forest plot | 3 | Risk Ratio (M‐H, Random, 95% CI) | Totals not selected | |
| 2.1 BMT/SCT after conditioning for haematological cancers | 2 | Risk Ratio (M‐H, Random, 95% CI) | 0.0 [0.0, 0.0] | |
| 2.2 CT alone for metastatic colorectal cancer | 1 | Risk Ratio (M‐H, Random, 95% CI) | 0.0 [0.0, 0.0] | |
| 3 Oral mucositis (severe) Show forest plot | 2 | Risk Ratio (M‐H, Random, 95% CI) | Totals not selected | |
| 3.1 BMT/SCT after conditioning for haematological cancers | 2 | Risk Ratio (M‐H, Random, 95% CI) | 0.0 [0.0, 0.0] | |
| 4 Oral pain (maximum score on 0 to 10 VAS) Show forest plot | 1 | Mean Difference (IV, Random, 95% CI) | Subtotals only | |
| 4.1 BMT/SCT after conditioning for haematological cancers | 1 | 28 | Mean Difference (IV, Random, 95% CI) | 0.70 [‐1.90, 3.30] |
| 5 Normalcy of diet (use of TPN) Show forest plot | 1 | Risk Ratio (M‐H, Random, 95% CI) | Subtotals only | |
| 5.1 BMT/SCT after conditioning for haematological cancers | 1 | 224 | Risk Ratio (M‐H, Random, 95% CI) | 0.80 [0.63, 1.02] |
| 6 Normalcy of diet (worst ability to eat score ‐ 1 to 4 scale) Show forest plot | 1 | Mean Difference (IV, Random, 95% CI) | Subtotals only | |
| 6.1 BMT/SCT after conditioning for haematological cancers | 1 | 28 | Mean Difference (IV, Random, 95% CI) | 0.40 [‐0.41, 1.21] |
| 7 Number of days in hospital Show forest plot | 1 | Mean Difference (IV, Random, 95% CI) | Subtotals only | |
| 7.1 BMT/SCT after conditioning for haematological cancers | 1 | 224 | Mean Difference (IV, Random, 95% CI) | 0.0 [‐1.78, 1.78] |
| 8 Number of days of treatment with opioid analgesics Show forest plot | 2 | Mean Difference (IV, Random, 95% CI) | Totals not selected | |
| 8.1 BMT/SCT after conditioning for haematological cancers | 2 | Mean Difference (IV, Random, 95% CI) | 0.0 [0.0, 0.0] | |
| Outcome or subgroup title | No. of studies | No. of participants | Statistical method | Effect size |
| 1 Oral mucositis (any) Show forest plot | 1 | Risk Ratio (M‐H, Random, 95% CI) | Subtotals only | |
| 1.1 CT alone for haematological cancer | 1 | 90 | Risk Ratio (M‐H, Random, 95% CI) | 0.67 [0.54, 0.85] |
| 2 Oral mucositis (moderate + severe) Show forest plot | 1 | Risk Ratio (M‐H, Random, 95% CI) | Subtotals only | |
| 2.1 CT alone for haematological cancer | 1 | 90 | Risk Ratio (M‐H, Random, 95% CI) | 0.12 [0.05, 0.28] |
| 3 Oral mucositis (severe) Show forest plot | 1 | Risk Ratio (M‐H, Random, 95% CI) | Subtotals only | |
| 3.1 CT alone for haematological cancer | 1 | 90 | Risk Ratio (M‐H, Random, 95% CI) | 0.01 [0.00, 0.19] |
| Outcome or subgroup title | No. of studies | No. of participants | Statistical method | Effect size |
| 1 Oral mucositis (any) Show forest plot | 2 | Risk Ratio (M‐H, Random, 95% CI) | Subtotals only | |
| 1.1 BMT/SCT after conditioning for mixed cancers | 1 | 90 | Risk Ratio (M‐H, Random, 95% CI) | 0.91 [0.80, 1.04] |
| 1.2 RT to head & neck | 1 | 29 | Risk Ratio (M‐H, Random, 95% CI) | 1.01 [0.82, 1.23] |
| 2 Oral mucositis (moderate + severe) Show forest plot | 2 | Risk Ratio (M‐H, Random, 95% CI) | Subtotals only | |
| 2.1 BMT/SCT after conditioning for haematological cancers | 1 | 109 | Risk Ratio (M‐H, Random, 95% CI) | 0.94 [0.79, 1.13] |
| 2.2 RT to head & neck | 1 | 29 | Risk Ratio (M‐H, Random, 95% CI) | 0.72 [0.49, 1.06] |
| 3 Oral mucositis (severe) Show forest plot | 6 | Risk Ratio (M‐H, Random, 95% CI) | Subtotals only | |
| 3.1 BMT/SCT after conditioning for mixed cancers | 3 | 235 | Risk Ratio (M‐H, Random, 95% CI) | 0.74 [0.33, 1.67] |
| 3.2 RT to head & neck | 1 | 29 | Risk Ratio (M‐H, Random, 95% CI) | 0.31 [0.01, 7.09] |
| 3.3 CT alone for mixed cancers | 2 | 65 | Risk Ratio (M‐H, Random, 95% CI) | 0.59 [0.05, 7.11] |
| 4 Oral pain (maximum score on 0 to 10 VAS) Show forest plot | 1 | Mean Difference (IV, Random, 95% CI) | Subtotals only | |
| 4.1 BMT/SCT after conditioning for mixed cancers | 1 | 90 | Mean Difference (IV, Random, 95% CI) | 0.60 [‐0.85, 2.05] |
| 5 Normalcy of diet (use of feeding tube/parenteral nutrition) Show forest plot | 2 | Risk Ratio (M‐H, Random, 95% CI) | Subtotals only | |
| 5.1 BMT/SCT after conditioning for haematological cancers | 1 | 36 | Risk Ratio (M‐H, Random, 95% CI) | 1.1 [0.63, 1.91] |
| 5.2 RT to head & neck | 1 | 29 | Risk Ratio (M‐H, Random, 95% CI) | 0.31 [0.01, 7.09] |
| 6 Number of days of treatment with opioid analgesics Show forest plot | 1 | Mean Difference (IV, Random, 95% CI) | Subtotals only | |
| 6.1 BMT/SCT after conditioning for mixed cancers | 1 | 90 | Mean Difference (IV, Random, 95% CI) | ‐1.10 [‐1.91, ‐0.29] |
| Outcome or subgroup title | No. of studies | No. of participants | Statistical method | Effect size |
| 1 Oral mucositis (severe) Show forest plot | 1 | Risk Ratio (M‐H, Random, 95% CI) | Subtotals only | |
| 1.1 CT alone for breast cancer | 1 | 36 | Risk Ratio (M‐H, Random, 95% CI) | 2.75 [1.07, 7.04] |
| Outcome or subgroup title | No. of studies | No. of participants | Statistical method | Effect size |
| 1 Oral mucositis (moderate + severe) Show forest plot | 1 | Risk Ratio (M‐H, Random, 95% CI) | Subtotals only | |
| 1.1 RT to head & neck | 1 | 40 | Risk Ratio (M‐H, Random, 95% CI) | 0.96 [0.80, 1.14] |
| 2 Oral mucositis (severe) Show forest plot | 1 | Risk Ratio (M‐H, Random, 95% CI) | Subtotals only | |
| 2.1 RT to head & neck | 1 | 40 | Risk Ratio (M‐H, Random, 95% CI) | 0.54 [0.24, 1.21] |
| 3 Interruptions to cancer treatment Show forest plot | 1 | Risk Ratio (M‐H, Random, 95% CI) | Subtotals only | |
| 3.1 RT to head & neck | 1 | 40 | Risk Ratio (M‐H, Random, 95% CI) | 0.13 [0.01, 2.36] |
| 4 Normalcy of diet (use of PEG tube) Show forest plot | 1 | Risk Ratio (M‐H, Random, 95% CI) | Subtotals only | |
| 4.1 RT to head & neck | 1 | 40 | Risk Ratio (M‐H, Random, 95% CI) | 0.18 [0.01, 3.56] |
| Outcome or subgroup title | No. of studies | No. of participants | Statistical method | Effect size |
| 1 Oral mucositis (any) Show forest plot | 3 | Risk Ratio (M‐H, Random, 95% CI) | Subtotals only | |
| 1.1 RT to head & neck | 2 | 54 | Risk Ratio (M‐H, Random, 95% CI) | 1.02 [0.86, 1.22] |
| 1.2 CT alone for lung cancer | 1 | 195 | Risk Ratio (M‐H, Random, 95% CI) | 0.59 [0.40, 0.87] |
| 2 Oral mucositis (moderate + severe) Show forest plot | 1 | Risk Ratio (M‐H, Random, 95% CI) | Subtotals only | |
| 2.1 CT alone for breast cancer | 1 | 14 | Risk Ratio (M‐H, Random, 95% CI) | 0.33 [0.12, 0.95] |
| 3 Oral mucositis (severe) Show forest plot | 2 | Risk Ratio (M‐H, Random, 95% CI) | Subtotals only | |
| 3.1 RT to head & neck | 2 | 54 | Risk Ratio (M‐H, Random, 95% CI) | 0.37 [0.15, 0.87] |
| 4 Interruptions to cancer treatment (RT interruption) Show forest plot | 1 | Risk Ratio (M‐H, Random, 95% CI) | Subtotals only | |
| 4.1 RT to head & neck | 1 | 40 | Risk Ratio (M‐H, Random, 95% CI) | 0.22 [0.01, 4.31] |
| 5 Normalcy of diet (use of PEG tube) Show forest plot | 1 | Risk Ratio (M‐H, Random, 95% CI) | Subtotals only | |
| 5.1 RT to head & neck | 1 | 40 | Risk Ratio (M‐H, Random, 95% CI) | 0.16 [0.01, 2.86] |
| Outcome or subgroup title | No. of studies | No. of participants | Statistical method | Effect size |
| 1 Oral mucositis (any) Show forest plot | 1 | Risk Ratio (M‐H, Random, 95% CI) | Subtotals only | |
| 1.1 BMT/SCT after conditioning for mixed cancers | 1 | 61 | Risk Ratio (M‐H, Random, 95% CI) | 1.02 [0.82, 1.27] |
| 2 Oral mucositis (moderate + severe) Show forest plot | 1 | Risk Ratio (M‐H, Random, 95% CI) | Subtotals only | |
| 2.1 BMT/SCT after conditioning for mixed cancers | 1 | 61 | Risk Ratio (M‐H, Random, 95% CI) | 0.78 [0.55, 1.11] |
| 3 Normalcy of diet (use of supplemental nutrition) Show forest plot | 1 | Risk Ratio (M‐H, Random, 95% CI) | Subtotals only | |
| 3.1 BMT/SCT after conditioning for mixed cancers | 1 | 61 | Risk Ratio (M‐H, Random, 95% CI) | 1.0 [0.94, 1.06] |
| Outcome or subgroup title | No. of studies | No. of participants | Statistical method | Effect size |
| 1 Oral mucositis (moderate + severe) Show forest plot | 2 | Risk Ratio (M‐H, Random, 95% CI) | Subtotals only | |
| 1.1 BMT/SCT after conditioning for haematological cancers | 1 | 136 | Risk Ratio (M‐H, Random, 95% CI) | 1.06 [0.78, 1.43] |
| 1.2 RT to head & neck +/‐ cisplatin | 1 | 103 | Risk Ratio (M‐H, Random, 95% CI) | 0.67 [0.45, 0.99] |
| 2 Oral mucositis (severe) Show forest plot | 1 | Risk Ratio (M‐H, Random, 95% CI) | Subtotals only | |
| 2.1 BMT/SCT after conditioning for haematological cancers | 1 | 136 | Risk Ratio (M‐H, Random, 95% CI) | 1.03 [0.59, 1.80] |
| 3 Interruptions to cancer treatment (RT breaks > 2 consecutive days) Show forest plot | 1 | Risk Ratio (M‐H, Random, 95% CI) | Subtotals only | |
| 3.1 RT to head & neck +/‐ cisplatin | 1 | 113 | Risk Ratio (M‐H, Random, 95% CI) | 4.38 [0.25, 75.44] |
| 4 Normalcy of diet (use of supplemental nutrition) Show forest plot | 1 | Risk Ratio (M‐H, Random, 95% CI) | Subtotals only | |
| 4.1 BMT/SCT after conditioning for haematological cancers | 1 | 136 | Risk Ratio (M‐H, Random, 95% CI) | 1.03 [0.55, 1.94] |
| Outcome or subgroup title | No. of studies | No. of participants | Statistical method | Effect size |
| 1 Oral mucositis (any) Show forest plot | 1 | Risk Ratio (M‐H, Random, 95% CI) | Subtotals only | |
| 1.1 CT alone for colorectal cancer | 1 | 99 | Risk Ratio (M‐H, Random, 95% CI) | 0.52 [0.35, 0.79] |
| 2 Oral mucositis (moderate + severe) Show forest plot | 1 | Risk Ratio (M‐H, Random, 95% CI) | Subtotals only | |
| 2.1 CT alone for colorectal cancer | 1 | 99 | Risk Ratio (M‐H, Random, 95% CI) | 0.22 [0.10, 0.48] |
| 3 Oral mucositis (severe) Show forest plot | 1 | Risk Ratio (M‐H, Random, 95% CI) | Subtotals only | |
| 3.1 CT alone for colorectal cancer | 1 | 99 | Risk Ratio (M‐H, Random, 95% CI) | 1.52 [0.06, 36.39] |
| Outcome or subgroup title | No. of studies | No. of participants | Statistical method | Effect size |
| 1 Oral mucositis (any) Show forest plot | 1 | Risk Ratio (M‐H, Random, 95% CI) | Subtotals only | |
| 1.1 CT alone for colorectal cancer | 1 | 66 | Risk Ratio (M‐H, Random, 95% CI) | 1.3 [0.67, 2.54] |
| 2 Oral mucositis (moderate + severe) Show forest plot | 1 | Risk Ratio (M‐H, Random, 95% CI) | Subtotals only | |
| 2.1 CT alone for colorectal cancer | 1 | 66 | Risk Ratio (M‐H, Random, 95% CI) | 0.75 [0.18, 3.09] |
| 3 Oral mucositis (severe) Show forest plot | 1 | Risk Ratio (M‐H, Random, 95% CI) | Subtotals only | |
| 3.1 CT alone for colorectal cancer | 1 | 66 | Risk Ratio (M‐H, Random, 95% CI) | 0.33 [0.01, 7.90] |
| Outcome or subgroup title | No. of studies | No. of participants | Statistical method | Effect size |
| 1 Oral mucositis (any) Show forest plot | 1 | Risk Ratio (M‐H, Random, 95% CI) | Subtotals only | |
| 1.1 BMT/SCT after conditioning for haematological cancers | 1 | 80 | Risk Ratio (M‐H, Random, 95% CI) | 0.35 [0.21, 0.60] |
| 2 Oral mucositis (moderate + severe) Show forest plot | 1 | Risk Ratio (M‐H, Random, 95% CI) | Subtotals only | |
| 2.1 BMT/SCT after conditioning for haematological cancers | 1 | 80 | Risk Ratio (M‐H, Random, 95% CI) | 0.43 [0.24, 0.79] |
| 3 Oral mucositis (severe) Show forest plot | 1 | Risk Ratio (M‐H, Random, 95% CI) | Subtotals only | |
| 3.1 BMT/SCT after conditioning for haematological cancers | 1 | 80 | Risk Ratio (M‐H, Random, 95% CI) | 0.4 [0.14, 1.17] |
| 4 Number of days in hospital Show forest plot | 1 | Mean Difference (IV, Random, 95% CI) | Subtotals only | |
| 4.1 BMT/SCT after conditioning for haematological cancers | 1 | 80 | Mean Difference (IV, Random, 95% CI) | ‐2.95 [‐7.73, 1.83] |