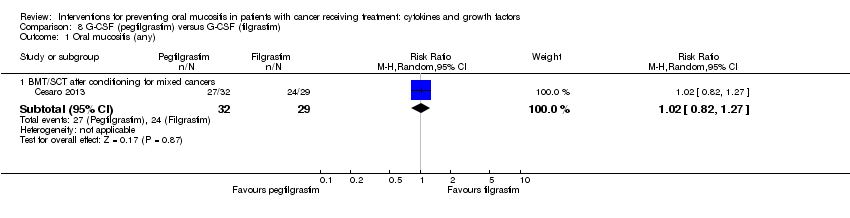
| 1 Oral mucositis (any) Show forest plot | 8 | | Risk Ratio (M‐H, Random, 95% CI) | Subtotals only |
|
| 1.1 BMT/SCT after conditioning for haematological cancers | 4 | 655 | Risk Ratio (M‐H, Random, 95% CI) | 0.96 [0.88, 1.05] |
| 1.2 RT to head & neck with cisplatin | 2 | 374 | Risk Ratio (M‐H, Random, 95% CI) | 0.95 [0.90, 1.00] |
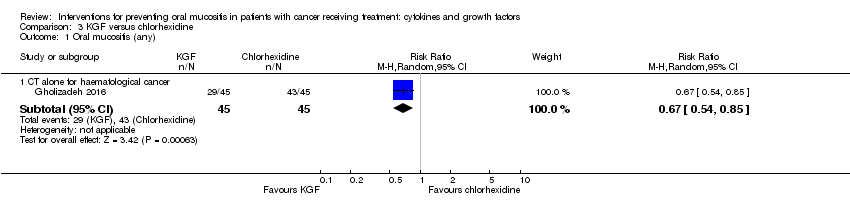
| 1.3 CT alone for mixed cancers | 2 | 215 | Risk Ratio (M‐H, Random, 95% CI) | 0.71 [0.60, 0.85] |
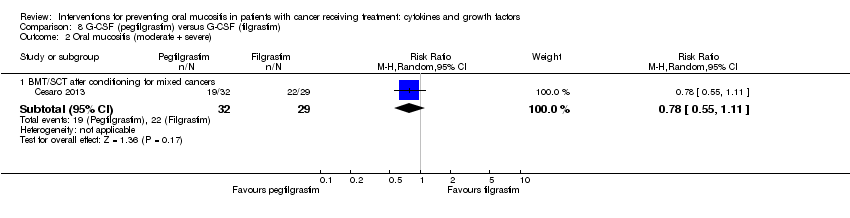
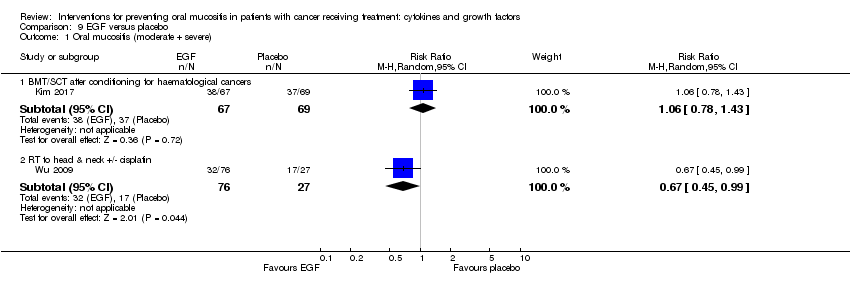
| 2 Oral mucositis (moderate + severe) Show forest plot | 13 | | Risk Ratio (M‐H, Random, 95% CI) | Subtotals only |
|
| 2.1 BMT/SCT after conditioning for haematological cancers | 6 | 852 | Risk Ratio (M‐H, Random, 95% CI) | 0.89 [0.80, 0.99] |
| 2.2 RT to head & neck with cisplatin/5FU | 3 | 471 | Risk Ratio (M‐H, Random, 95% CI) | 0.91 [0.83, 1.00] |
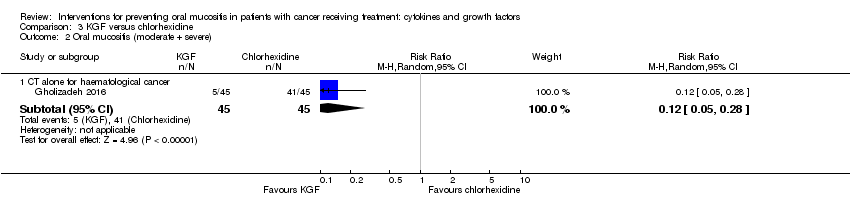
| 2.3 CT alone for mixed cancers | 4 | 344 | Risk Ratio (M‐H, Random, 95% CI) | 0.56 [0.45, 0.70] |
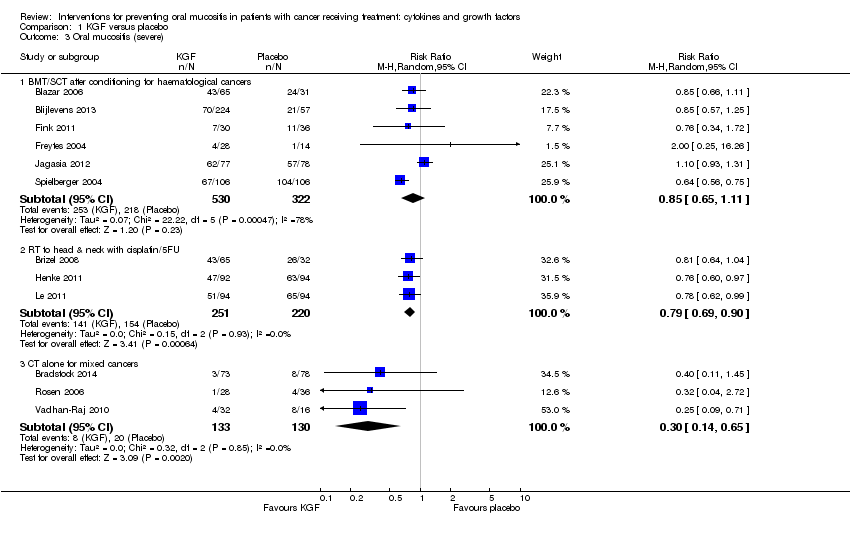
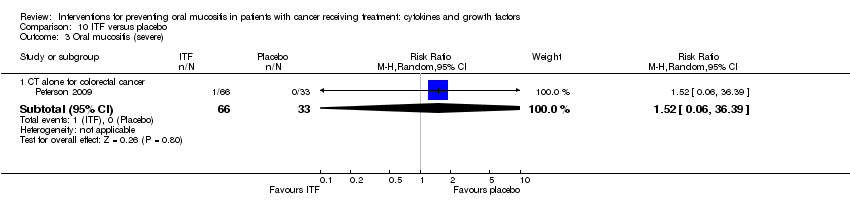
| 3 Oral mucositis (severe) Show forest plot | 12 | | Risk Ratio (M‐H, Random, 95% CI) | Subtotals only |
|
| 3.1 BMT/SCT after conditioning for haematological cancers | 6 | 852 | Risk Ratio (M‐H, Random, 95% CI) | 0.85 [0.65, 1.11] |
| 3.2 RT to head & neck with cisplatin/5FU | 3 | 471 | Risk Ratio (M‐H, Random, 95% CI) | 0.79 [0.69, 0.90] |
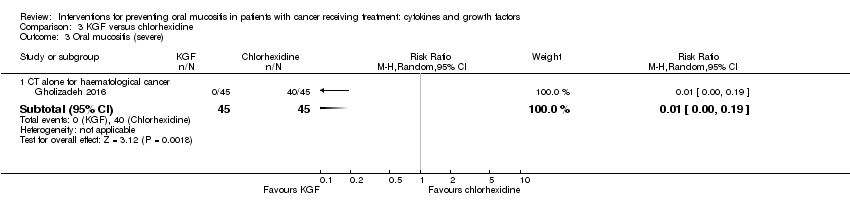
| 3.3 CT alone for mixed cancers | 3 | 263 | Risk Ratio (M‐H, Random, 95% CI) | 0.30 [0.14, 0.65] |
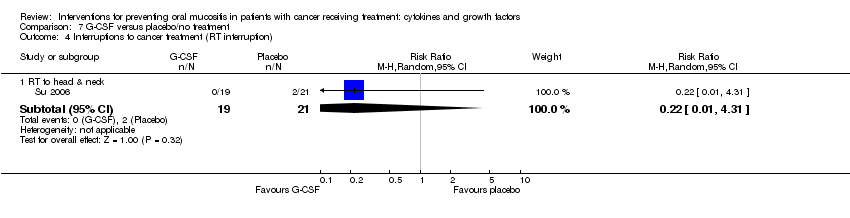
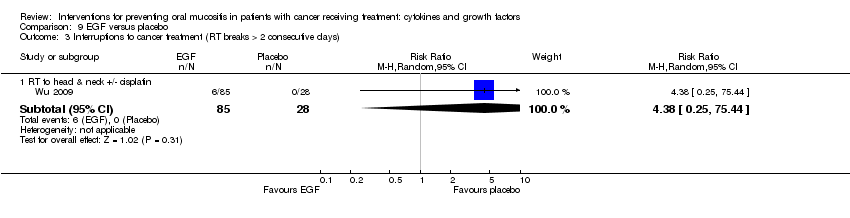
| 4 Interruptions to cancer treatment (unscheduled RT breaks of 5 or more days) Show forest plot | 3 | | Risk Ratio (M‐H, Random, 95% CI) | Subtotals only |
|
| 4.1 RT to head & neck with cisplatin/5FU | 3 | 473 | Risk Ratio (M‐H, Random, 95% CI) | 1.01 [0.65, 1.59] |
| 5 Interruptions to cancer treatment (chemotherapy delays/discontinuations) Show forest plot | 2 | | Risk Ratio (M‐H, Random, 95% CI) | Subtotals only |
|
| 5.1 RT to head & neck with cisplatin | 2 | 374 | Risk Ratio (M‐H, Random, 95% CI) | 0.96 [0.62, 1.47] |
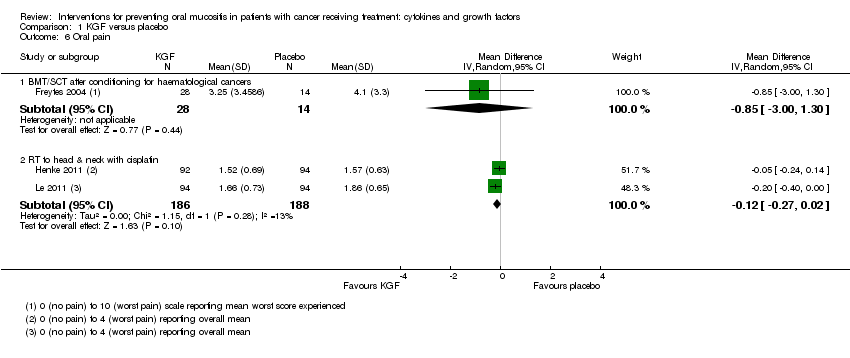
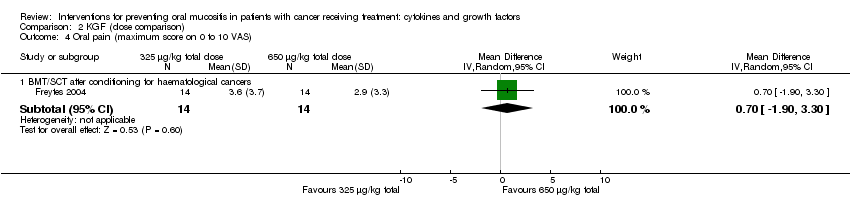
| 6 Oral pain Show forest plot | 3 | | Mean Difference (IV, Random, 95% CI) | Subtotals only |
|
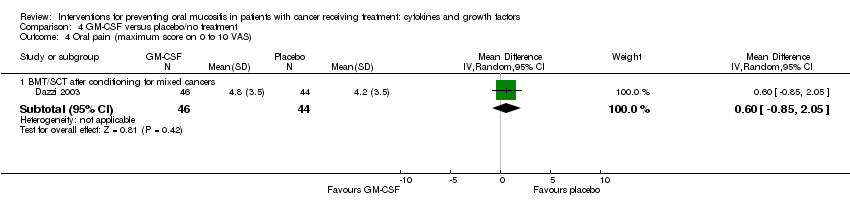
| 6.1 BMT/SCT after conditioning for haematological cancers | 1 | 42 | Mean Difference (IV, Random, 95% CI) | ‐0.85 [‐3.00, 1.30] |
| 6.2 RT to head & neck with cisplatin | 2 | 374 | Mean Difference (IV, Random, 95% CI) | ‐0.12 [‐0.27, 0.02] |
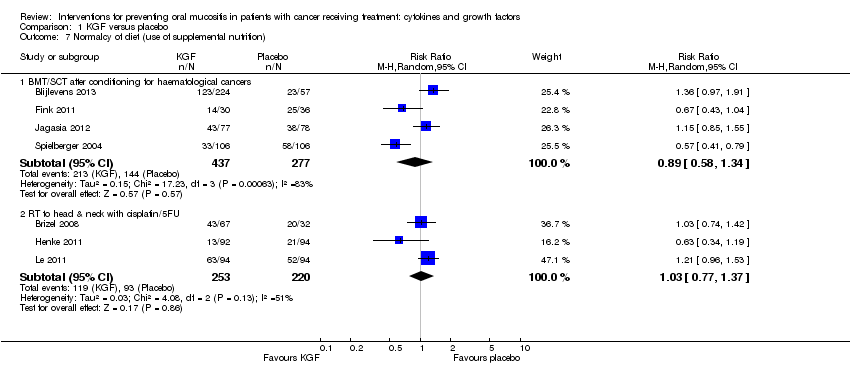
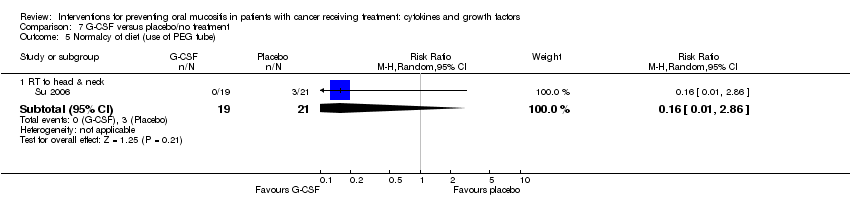
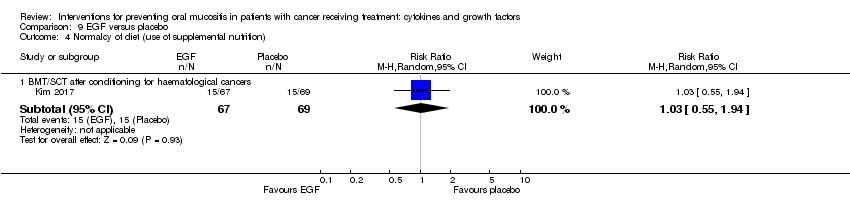
| 7 Normalcy of diet (use of supplemental nutrition) Show forest plot | 7 | | Risk Ratio (M‐H, Random, 95% CI) | Subtotals only |
|
| 7.1 BMT/SCT after conditioning for haematological cancers | 4 | 714 | Risk Ratio (M‐H, Random, 95% CI) | 0.89 [0.58, 1.34] |
| 7.2 RT to head & neck with cisplatin/5FU | 3 | 473 | Risk Ratio (M‐H, Random, 95% CI) | 1.03 [0.77, 1.37] |
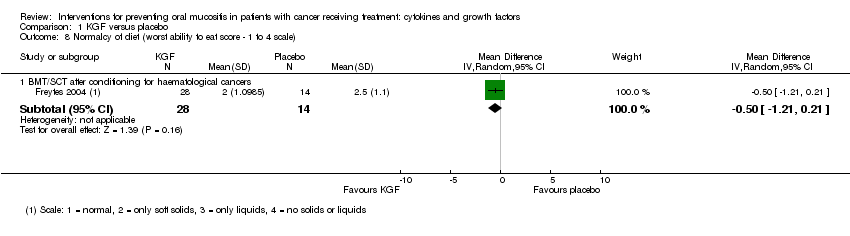
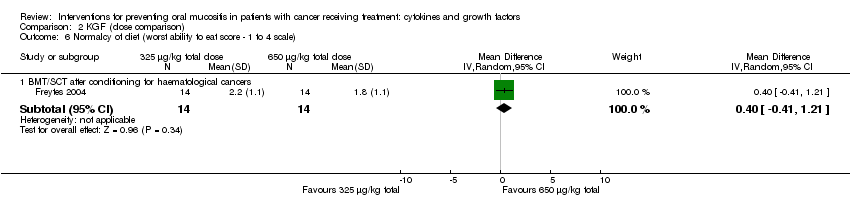
| 8 Normalcy of diet (worst ability to eat score ‐ 1 to 4 scale) Show forest plot | 1 | | Mean Difference (IV, Random, 95% CI) | Subtotals only |
|
| 8.1 BMT/SCT after conditioning for haematological cancers | 1 | 42 | Mean Difference (IV, Random, 95% CI) | ‐0.5 [‐1.21, 0.21] |
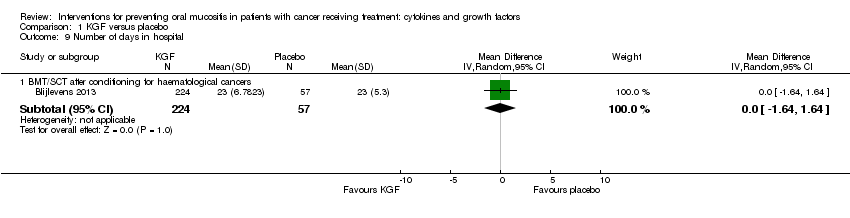
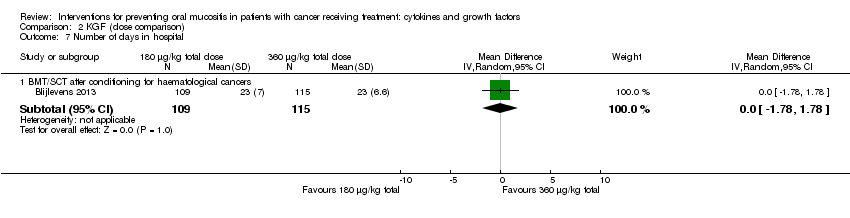
| 9 Number of days in hospital Show forest plot | 1 | | Mean Difference (IV, Random, 95% CI) | Subtotals only |
|
| 9.1 BMT/SCT after conditioning for haematological cancers | 1 | 281 | Mean Difference (IV, Random, 95% CI) | 0.0 [‐1.64, 1.64] |
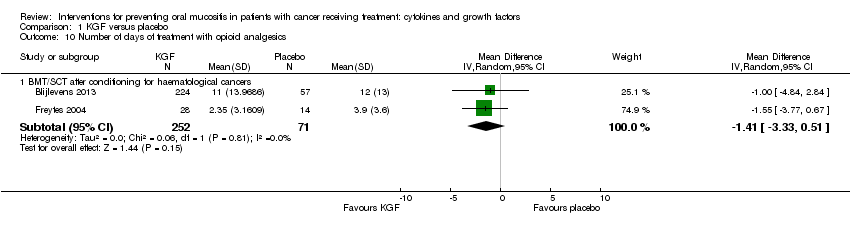
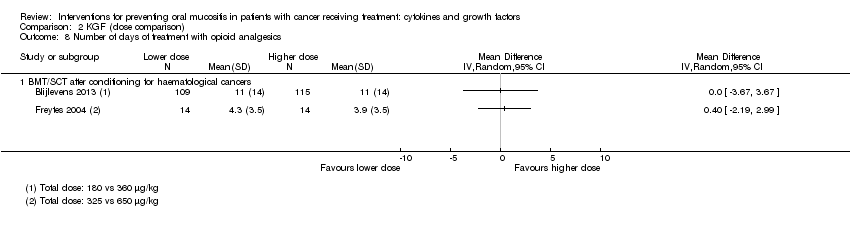
| 10 Number of days of treatment with opioid analgesics Show forest plot | 2 | | Mean Difference (IV, Random, 95% CI) | Subtotals only |
|
| 10.1 BMT/SCT after conditioning for haematological cancers | 2 | 323 | Mean Difference (IV, Random, 95% CI) | ‐1.41 [‐3.33, 0.51] |