Intervenciones para la prevención de la mucositis oral en pacientes con cáncer en tratamiento: citoquinas y factores de crecimiento
Resumen
Antecedentes
La mucositis oral es un efecto secundario de la quimioterapia, la radioterapia de cabeza y cuello y el tratamiento dirigido, que afecta a más del 75% de los pacientes de alto riesgo. La ulceración puede provocar dolor intenso y dificultades para comer y beber, lo que puede requerir la administración de analgésicos opiáceos, hospitalización y nutrición suplementaria. Estas complicaciones pueden interrumpir el tratamiento del cáncer, lo que puede reducir la supervivencia. También existe riesgo de muerte por sepsis si se introducen agentes patógenos en las úlceras de los pacientes inmunocomprometidos. La mucositis oral ulcerativa puede ser costosa para los sistemas de asistencia sanitaria, pero hay pocas intervenciones preventivas que hayan probado ser beneficiosas. Las citoquinas y los factores de crecimiento pueden ayudar a la regeneración del recubrimiento de las células de la boca, por lo que previenen o reducen la mucositis oral y sus efectos negativos.
Objetivos
Evaluar los efectos de las citoquinas y los factores de crecimiento para prevenir la mucositis oral en pacientes con cáncer sometidos a tratamiento.
Métodos de búsqueda
El especialista en información del Grupo Cochrane de Salud Oral (Cochrane Oral Health's Information Specialist) buscó en las siguientes bases de datos: Registro de Ensayos del Grupo Cochrane de Salud Oral (Cochrane Oral Health Group) (búsqueda 10 mayo 2017); Registro Cochrane Central de Ensayos Controlados (Cochrane Central Register of Controlled Trials (CENTRAL; 2017, número 4) en la Cochrane Library (búsqueda 10 mayo 2017); MEDLINE Ovid (1946 hasta 10 mayo 2017); Embase Ovid (7 diciembre 2015 hasta 10 mayo 2017); CINAHL EBSCO (Cumulative Index to Nursing and Allied Health Literature; 1937 hasta 10 mayo 2017); y en CANCERLIT PubMed (1950 hasta 10 mayo 2017). Se hicieron búsquedas de ensayos en curso en el US National Institutes of Health Ongoing Trials Register (ClinicalTrials.gov) y en la World Health Organization International Clinical Trials Registry Platform.
Criterios de selección
Se incluyeron los ensayos controlados aleatorios (ECA) de diseño paralelo que evaluaran los efectos de las citoquinas y los factores de crecimiento en pacientes con cáncer en tratamiento.
Obtención y análisis de los datos
Dos autores de la revisión examinaron de forma independiente los resultados de las búsquedas electrónicas, extrajeron los datos y evaluaron el riesgo de sesgo. Para los resultados dicotómicos se informaron los cocientes de riesgos (CR) y los intervalos de confianza (IC) del 95%. Para los datos continuos se informaron las diferencias de medias (DM) y los IC del 95%. Los estudios similares se agruparon en metanálisis de efectos aleatorios. Los efectos adversos se informaron en un formato narrativo.
Resultados principales
Se incluyeron 35 ECA analizaron a 3102 participantes. Trece estudios tenían bajo riesgo de sesgo, 12 estudios tenían un riesgo de sesgo incierto y 10 estudios presentaban un alto riesgo de sesgo.
Los resultados principales consideraron el factor de crecimiento de queratinocitos (FCQ) y se resumen del siguiente modo.
Podría haber una reducción en el riesgo de mucositis oral moderada a grave en los pacientes adultos sometidos a trasplante de médula ósea/células madres después del tratamiento de acondicionamiento para los cánceres hematológicos (CR 0,89; IC del 95%: 0,80 a 0,99; seis estudios; 852 participantes; evidencia de baja calidad). Se necesitaría tratar a 11 pacientes adultos con FCQ para impedir que un paciente adicional presente este resultado (IC del 95%: 6 a 112). Podría haber una reducción en el riesgo de mucositis oral grave en esta población pero también hay alguna posibilidad de un aumento en el riesgo (CR 0,85; IC del 95%: 0,65 a 1,11; seis estudios; 852 participantes; evidencia de baja calidad). Se necesitaría tratar a diez pacientes adultos con FCQ para impedir que un adulto adicional presente este resultado (IC del 95%: 5 para prevenir el resultado a 14 para causar el resultado).
Probablemente haya una reducción en el riesgo de mucositis oral moderada a grave en los pacientes adultos sometidos a radioterapia de cabeza y cuello con cisplatino o fluorouracilo (CR 0,91; IC del 95%: 0,83 a 1,00; tres estudios; 471 participantes; evidencia de calidad moderada). Se necesitaría tratar a 12 pacientes adultos con FCQ para impedir que un adulto adicional presente este resultado (IC del 95%: 7 a infinito). Es muy probable que haya una reducción en el riesgo de mucositis oral grave en esta población (CR 0,79; IC del 95%: 0,69 a 0,90; tres estudios; 471 participantes; evidencia de alta calidad). Se necesitaría tratar a siete pacientes adultos con FCQ para impedir que un paciente adicional presente este resultado (IC del 95%: 5 a 15).
Es probable que haya una reducción en el riesgo de mucositis oral moderada a grave en los pacientes adultos sometidos a quimioterapia sola para los cánceres sólidos mixtos y hematológicos (CR 0,56; IC del 95%: 0,45 a 0,70; cuatro estudios; 344 participantes; evidencia de calidad moderada). Se necesitaría tratar a cuatro pacientes adultos con FCQ para impedir que un paciente adicional presente este resultado (IC del 95%: 3 a 6). Podría haber una reducción en el riesgo de mucositis oral grave en esta población (CR 0,30; IC del 95%: 0,14 a 0,65; tres estudios; 263 participantes; (evidencia de baja calidad). Se necesitaría tratar a diez pacientes adultos con FCQ para impedir que un paciente adicional presente este resultado (IC del 95%: 8 a 19).
Debido al volumen bajo de evidencia, las comparaciones de estudios únicos y los tamaños insuficientes de la muestra, no se encontró evidencia irrefutable de un efecto beneficioso de otras citoquinas ni factores de crecimiento y no hubo evidencia en los niños. No pareció que hubiera ningún efecto adverso grave de ninguna de las intervenciones evaluadas en esta revisión.
Conclusiones de los autores
Hay seguridad con respecto a que el FCQ es beneficioso en la prevención de la mucositis oral en pacientes adultos sometidos a: a) radioterapia de cabeza y cuello con cisplatino o fluorouracilo; o b) quimioterapia sola para los cánceres sólidos mixtos y hematológicos. Hay menos seguridad acerca de un efecto beneficioso del FCQ en pacientes adultos sometidos a trasplante de médula ósea/células madres después del tratamiento de acondicionamiento para los cánceres hematológicos debido a los múltiples factores involucrados en esa población, por ejemplo, si recibieron o no irradiación corporal total (ICT) y si el trasplante fue autólogo (las propias células de los pacientes) o alogénico (células de un donante). El FCQ parece ser una intervención relativamente segura.
Debido a los estudios de investigación limitados, no hay seguridad de que haya efectos beneficiosos de otras citoquinas y factores de crecimiento. La evidencia actual no es suficiente para establecer conclusiones acerca del uso de citoquinas y factores de crecimiento en los niños.
PICOs
Resumen en términos sencillos
¿Las citoquinas y los factores de crecimiento pueden ayudar a prevenir el dolor y las úlceras de la boca (mucositis oral) en los pacientes tratados por cáncer?
Pregunta de la revisión
Esta revisión se ha realizado para evaluar si la administración de citoquinas y factores de crecimiento durante el tratamiento del cáncer puede ayudar a prevenir el dolor y las úlceras de la boca.
Antecedentes
El dolor y las úlceras en la boca (mucositis oral) es un efecto secundario del tratamiento para el cáncer que incluye quimioterapia, radioterapia de cabeza y cuello y tratamiento dirigido, que afecta al 75% de los pacientes de alto riesgo. Las úlceras pueden provocar dolor intenso y dificultad para comer y beber. Los enfermos pueden necesitar analgésicos potentes, posiblemente ingresar al hospital e incluso alimentarse a través de un tubo en el estómago o en las venas.
Estas complicaciones pueden interrumpir el tratamiento del cáncer, lo que significa que no reciban el mejor tratamiento y que se pueda reducir la supervivencia. Los pacientes con cáncer tienen debilitado su sistema inmunitario debido al tratamiento, lo que significa que el cuerpo es menos capaz de combatir las infecciones. Una úlcera es una herida abierta y existe el riesgo de que las bacterias se puedan introducir en el cuerpo y provoquen infección o sepsis (una reacción inflamatoria peligrosa del cuerpo a la infección).
El dolor y las úlceras de la boca pueden ser costosos para los sistemas de asistencia sanitaria; no obstante, hay pocas intervenciones preventivas o tratamientos que hayan probado ser beneficiosos. Las citoquinas y los factores de crecimiento pueden ayudar en la regeneración de las células que recubren la boca, por lo que previenen o reducen la mucositis oral y los efectos negativos.
Características de los estudios
Los autores del Grupo Cochrane de Salud Oral realizaron esta revisión de los estudios existentes y la evidencia está actualizada hasta el 10 de mayo de 2017. Incluye 35 estudios (publicados entre 1993 y 2017) con 3102 participantes, todos pacientes tratados por cáncer, con edades comprendidas entre uno y 87 años. Los autores de la revisión incluyeron estudios que compararon las citoquinas y los factores de crecimiento para la prevención de la mucositis oral. Los estudios se realizaron en todo el mundo y a menudo representaron sitios múltiples, aunque en su mayoría tuvieron lugar en países de ingresos altos.
Resultados principales
Los resultados principales estuvieron relacionados con el factor de crecimiento de queratinocitos (FCQ). Es probable que el FCQ reduzca el riesgo de mucositis oral en pacientes adultos sometidos a radioterapia de cabeza y cuello con quimioterapia (cisplatino o fluorouracilo), o quimioterapia sola para los cánceres sólidos mixtos y sanguíneos. El FCQ también puede reducir el riesgo de mucositis oral en pacientes adultos sometidos a trasplante de médula ósea/células madres después del tratamiento de acondicionamiento para los cánceres sanguíneos, pero estos resultados están menos claros debido a los múltiples factores de complicación. El FCQ parece ser una intervención relativamente segura. No pareció que hubiera ningún efecto adverso grave de ninguna de las intervenciones evaluadas en esta revisión.
Debido a los estudios de investigación limitados, los autores de la revisión no tienen la seguridad de que haya efectos beneficiosos de otras citoquinas y factores de crecimiento. La evidencia actual no es suficiente para establecer conclusiones acerca del uso de citoquinas y factores de crecimiento en los niños.
Calidad de la evidencia
Para la reducción de la mucositis oral en los pacientes adultos sometidos a radioterapia de cabeza y cuello con quimioterapia, los autores de la revisión calificaron la evidencia con respecto al FCQ de calidad moderada a alta. Para la reducción de la mucositis oral en los pacientes adultos sometidos a quimioterapia sola para los cánceres sólidos mixtos y sanguíneos, los autores de la revisión calificaron la evidencia con respecto al FCQ de calidad baja a moderada. La calidad de la evidencia se disminuyó debido a que no hay suficientes datos y porque algunos resultados todavía no se han publicado. Para la reducción de la mucositis oral en los pacientes adultos sometidos a trasplante de médula ósea/células madres después del tratamiento de acondicionamiento para los cánceres sanguíneos, los autores de la revisión calificaron la evidencia con respecto al FCQ de calidad baja porque los resultados no fueron similares entre los estudios y algunos resultados todavía no se han publicado. La evidencia sobre los efectos secundarios del FCQ se informó de manera deficiente e inconsistente.
Conclusiones de los autores
Summary of findings
| KGF compared to placebo for preventing oral mucositis in adults with cancer receiving treatment | ||||||
| Patient or population: adults** receiving treatment for cancer (see subgroup for treatment type) | ||||||
| Outcomes | Anticipated absolute effects* (95% CI) | Relative effect | Number of participants | Quality of the evidence | Comments | |
| Risk with placebo | Risk with KGF | |||||
| Oral mucositis (moderate + severe) | BMT/SCT after conditioning for haematological cancers | RR 0.89 | 852 | ⊕⊕⊝⊝ | There might be a benefit for KGF in this population NNTB = 11 (95% CI 6 to 112) | |
| 848 per 1000 | 755 per 1000 | |||||
| RT to head and neck with cisplatin/5FU | RR 0.91 | 471 | ⊕⊕⊕⊝ | There is probably a benefit for KGF in this population NNTB = 12 (95% CI 7 to ∞) | ||
| 932 per 1000 | 848 per 1000 | |||||
| CT alone for mixed cancers | RR 0.56 | 344 | ⊕⊕⊕⊝ | It is likely that there is a benefit for KGF in this population NNTB = 4 (95% CI 3 to 6) | ||
| 631 per 1000 | 353 per 1000 | |||||
| Oral mucositis (severe) | BMT/SCT after conditioning for haematological cancers | RR 0.85 | 852 | ⊕⊕⊝⊝ | There might be a benefit for KGF in this population, but there is also some possibility of an increase in risk NNTB = 10 (95% CI 5 NNTB to 14 NNTH) | |
| 677 per 1000 | 575 per 1000 | |||||
| RT to head and neck with cisplatin/5FU | RR 0.79 | 471 | ⊕⊕⊕⊕ | It is very likely that there is a benefit for KGF in this population NNTB = 7 (95% CI 5 to 15) | ||
| 700 per 1000 | 553 per 1000 | |||||
| CT alone for mixed cancers | RR 0.30 | 263 | ⊕⊕⊝⊝ | There might be a benefit for KGF in this population NNTB = 10 (95% CI 8 to 19) | ||
| 154 per 1000 | 46 per 1000 | |||||
| Adverse events | Adverse events that were attributed to the study drugs rather than the cancer therapy were typically oral‐related or skin‐related. Events were mostly mild to moderate with very few incidences of serious events. However, reporting was poor and inconsistent, meaning that it was not appropriate to meta‐analyse data | |||||
| *The risk in the intervention group (and its 95% confidence interval) is based on the assumed risk in the comparison group and the relative effect of the intervention (and its 95% CI). ***The number of people that would need to receive KGF in order to prevent 1 additional person from developing the outcome. Calculated as 1 divided by the absolute risk reduction (which is the control arm event rate minus the experimental arm event rate). NNTH means the number of people that would need to receive KGF to cause 1 additional person to develop the outcome. All decimal places have been rounded up to the nearest whole number (i.e. 6.1 = 7). | ||||||
| GRADE Working Group grades of evidence | ||||||
| 1Downgraded by 1 level for inconsistency (substantial heterogeneity: I2 = 50% to 90%, P < 0.1); downgraded 1 further level for publication bias as there are 2 references in Studies awaiting classification that would be included in the conditioning/transplant subgroup, but the data are not available (NCT02313792; Spielberger 2001). | ||||||
| GM‐CSF compared to placebo/no treatment for preventing oral mucositis in adults with cancer receiving treatment | ||||||
| Patient or population: adults** receiving treatment for cancer (see subgroup for treatment type) | ||||||
| Outcomes | Anticipated absolute effects* (95% CI) | Relative effect | Number of participants | Quality of the evidence | Comments | |
| Risk with placebo/no treatment | Risk with GM‐CSF | |||||
| Oral mucositis (moderate + severe) | BMT/SCT after conditioning for haematological cancers | RR 0.94 | 109 | ⊕⊝⊝⊝ | There is insufficient evidence to determine a benefit for GM‐CSF in this population NNTB = 20 (95% CI 6 NNTB to 10 NNTH) | |
| 839 per 1000 | 789 per 1000 | |||||
| RT to head and neck | RR 0.72 | 29 | ⊕⊝⊝⊝ | There is insufficient evidence to determine a benefit for GM‐CSF in this population NNTB = 4 (95% CI 3 NNTB to 14 NNTH) | ||
| 929 per 1000 | 669 per 1000 | |||||
| Oral mucositis (severe) | BMT/SCT after conditioning for mixed cancers | RR 0.74 | 235 | ⊕⊕⊝⊝ | There is insufficient evidence to determine a benefit for GM‐CSF in this population NNTB = 12 (95% CI 5 NNTB to 5 NNTH) | |
| 347 per 1000 | 257 per 1000 | |||||
| RT to head and neck | RR 0.31 | 29 | ⊕⊝⊝⊝ | There is insufficient evidence to determine a benefit for GM‐CSF in this population NNTB = 21 (95% CI 15 NNTB to 3 NNTH) | ||
| 71 per 1000 | 22 per 1000 | |||||
| CT alone for mixed cancers | RR 0.59 | 65 | ⊕⊝⊝⊝ | There is insufficient evidence to determine a benefit for GM‐CSF in this population NNTB = 5 (95% CI 3 NNTB to 2 NNTH) | ||
| 500 per 1000 | 295 per 1000 | |||||
| Adverse events | Adverse events that were attributed to the study drugs rather than the cancer therapy were typically bone pain, nausea, fever and headache. Events were not reported as being serious. Some studies did not report adverse events and 1 even reported that there were none. However, reporting was poor and inconsistent, meaning that it was not appropriate to meta‐analyse data | |||||
| *The risk in the intervention group (and its 95% confidence interval) is based on the assumed risk in the comparison group and the relative effect of the intervention (and its 95% CI). ***The number of people that would need to receive GM‐CSF in order to prevent 1 additional person from developing the outcome. Calculated as 1 divided by the absolute risk reduction (which is the control arm event rate minus the experimental arm event rate). NNTH means the number of people that would need to receive GM‐CSF to cause 1 additional person to develop the outcome. All decimal places have been rounded up to the nearest whole number (i.e. 6.1 = 7). | ||||||
| GRADE Working Group grades of evidence | ||||||
| 1Downgraded by 2 levels for imprecision (single study with a small sample size and the confidence interval includes a possible increase in risk that is of a similar magnitude to the possible reduction in risk); downgraded 1 further level for indirectness (single study so not widely generalisable). | ||||||
| G‐CSF compared to placebo/no treatment for preventing oral mucositis in patients with cancer receiving treatment | ||||||
| Patient or population: adults** receiving treatment for cancer (see subgroup for treatment type) | ||||||
| Outcomes | Anticipated absolute effects* (95% CI) | Relative effect | Number of participants | Quality of the evidence | Comments | |
| Risk with placebo/no treatment | Risk with G‐CSF | |||||
| Oral mucositis (moderate + severe) | CT alone for breast cancer | RR 0.33 | 14 | ⊕⊝⊝⊝ | There is very weak evidence that there might be a benefit for G‐CSF in this population NNTB = 2 (95% CI 2 to 20) | |
| 1000 per 1000 | 330 per 1000 | |||||
| Oral mucositis (severe) | RT to head and neck | RR 0.37 | 54 | ⊕⊕⊝⊝ | There is weak evidence that there might be a benefit for G‐CSF in this population NNTB = 3 (95% CI 3 to 15) | |
| 519 per 1000 | 192 per 1000 | |||||
| Adverse events | There was limited evidence of adverse events for G‐CSF. 2 of the 6 studies did not report adverse events. There were low rates of mild to moderate events, the most common of which appeared to be bone pain. However, reporting was poor and inconsistent, meaning that it was not appropriate to meta‐analyse data | |||||
| *The risk in the intervention group (and its 95% confidence interval) is based on the assumed risk in the comparison group and the relative effect of the intervention (and its 95% CI). ***The number of people that would need to receive G‐CSF in order to prevent 1 additional person from developing the outcome. Calculated as 1 divided by the absolute risk reduction (which is the control arm event rate minus the experimental arm event rate). NNTH means the number of people that would need to receive G‐CSF to cause 1 additional person to develop the outcome. All decimal places have been rounded up to the nearest whole number (i.e. 6.1 = 7). | ||||||
| GRADE Working Group grades of evidence | ||||||
| 1Downgraded by 2 levels for imprecision (wide confidence interval and very small sample size); downgraded by 1 further level for high risk of performance bias; downgraded by 1 further level for indirectness (single study so not widely generalisable). | ||||||
Antecedentes
Descripción de la afección
El tratamiento del cáncer con quimioterapia, radioterapia de cabeza y cuello o tratamiento dirigido puede causar efectos secundarios orales tóxicos (Al‐Dasooqi 2013; Scully 2006; Sonis 2004). Quizás el más ampliamente investigado de estos efectos secundarios es la mucositis oral (Al‐Dasooqi 2013), que afecta al menos al 75% de los pacientes con alto riesgo (los que reciben radioterapia de cabeza y cuello o quimioterapia a dosis alta) (Scully 2006). Es posible que la mucositis oral no se informe de manera suficiente en grupos con menor riesgo por diversas razones: su tendencia a ocurrir en pacientes ambulatorios con menos observación; menos informe de la mucositis moderada; o los pacientes y los médicos desean evitar cualquier interrupción del tratamiento óptimo del cáncer (Scully 2006).
Dicho de manera sencilla, la mucositis oral afecta a la mucosa oral (la membrana mucosa del tejido húmedo que cubre la cavidad bucal) y puede provocar la aparición de lesiones (úlceras). Sin embargo, el proceso que da lugar a la mucositis oral es complejo y multifactorial, y el modelo de cinco fases de Sonis es la explicación actualmente aceptada para la secuencia de eventos que constituyen la base de la afección (Sonis 2004; Sonis 2009).
-
Inicio: El daño al ADN causado por la quimioterapia o la radioterapia provoca la pérdida de la capacidad de proliferación de las células basales del epitelio (las capas externas de células que recubren la mucosa oral). Lo anterior produce especies de oxígeno reactivo (EOR).
-
Respuesta primaria de daño: La radioterapia, la quimioterapia, las EOR y la rotura de la cadena de ADN contribuyen a la activación de factores de transcripción como el factor nuclear kappa beta (NF‐Kβ), y las esfingomielinasas. Todo lo anterior provoca el aumento ("upregulation") de las citoquinas proinflamatorias (p.ej. el factor de necrosis tumoral alfa [TNF‐α]), el óxido nítrico, la ceramida y las metaloproteinasas de la matriz, que dan lugar al adelgazamiento del epitelio a través de la lesión tisular y la muerte celular, lo que culmina con la destrucción de la mucosa oral.
-
Amplificación de la señal: algunas de las moléculas en la fase anterior pueden dar lugar a exacerbación y prolongar la lesión tisular mediante la reacción positiva o negativa (p.ej. el TNF‐α puede reaccionar positivamente sobre el NF‐Kβ, lo que induce más producción de citoquina proinflamatoria).
-
Ulceración: las bacterias colonizan las úlceras y sus productos de la pared celular infiltran la submucosa (los tejidos conjuntivos debajo de la mucosa oral) y activan los macrófagos tisulares (leucocitos que responden a la infección o a las células dañadas / muertas), lo que da lugar a la producción adicional de citoquinas proinflamatorias, inflamación y dolor.
-
Cicatrización: la señalización de la matriz extracelular de la submucosa da lugar a la proliferación y diferenciación epitelial y consecuentemente a un engrosamiento del epitelio. La flora oral local se restituye.
Sin embargo, todavía existe una falta de claridad alrededor de los mecanismos y los factores de riesgo de la mucositis oral, en particular en áreas como la predisposición genética y los efectos microbianos. La comprensión de la patobiología que provoca la toxicidad de la mucosa como resultado de los tratamientos dirigidos (p.ej. la estomatitis asociada al inhibidor de la molécula diana de rapamicina en mamíferos [mTOR]) actualmente es limitada, pero se considera que difiere de la mucositis inducida por la quimioterapia y la radioterapia, y la presentación clínica de las úlceras tiene más semejanzas con la estomatitis aftosa (Al‐Dasooqi 2013; Boers‐Doets 2013; Peterson 2015).
La mucositis oral es una afección aguda y, cuando es provocada por la quimioterapia, la ulceración ocurre normalmente una semana después del tratamiento y se resuelve en el transcurso de tres semanas después del tratamiento (Sonis 2009). La mucositis oral inducida por la radioterapia requiere más tiempo para desarrollarse y para cicatrizar; la ulceración se presenta normalmente alrededor de las dos semanas en un ciclo de tratamiento de siete, y se resuelve de tres a cuatro semanas después que el tratamiento ha concluido (Sonis 2009).
La ulceración es la fase más significativa que provoca dolor de intensidad variada y dificultades para comer, deglutir y conversar (Scully 2006). Lo anterior a su vez da lugar al consumo de fármacos para el alivio del dolor, la necesidad de apoyo nutricional (p.ej. sonda de alimentación nasogástrica o intravenosa), el tratamiento de la mucositis oral, la atención por especialistas de higiene bucodental, el aumento en las consultas médicas y el uso de personal y recursos y, en algunos casos, la hospitalización (Jensen 2014; Miller 2001; Trotti 2003). Por lo tanto, la repercusión negativa sobre la calidad de vida de los pacientes con cáncer, cuando ya están afectados seriamente, es grave (Elting 2008; Epstein 1999). En los pacientes inmunosuprimidos pueden ocurrir problemas adicionales si todas las bacterias en la superficie de la úlcera atraviesan la submucosa subyacente y potencialmente provocan bacteriemia y sepsis, que requieren antibióticos y hospitalización y pueden causar la muerte (Jensen 2014; Peterson 2015; Scully 2006).
Por lo tanto, la mucositis oral puede ser una afección que limita las dosis e interrumpe el plan de tratamiento óptimo del cáncer del paciente (Jensen 2014; Peterson 2015; Sonis 2004). Los costos adicionales asociados con la mucositis oral pueden ser significativos; un estudio informa una mediana de costo gradual de 18 515 USD por paciente (Nonzee 2008). Se ha informado que estos costos pueden ser tan altos como USD 42 749 más por paciente cuando la mucositis oral ulcerosa está presente (Sonis 2001).
Descripción de la intervención
Como se describe anteriormente, la mucositis oral ocurre en parte como resultado de la pérdida de la capacidad regenerativa de las células epiteliales orales. Los factores de crecimiento y las citoquinas antiinflamatorias se utilizan para contrarrestar los procesos biológicos que dan lugar a esta pérdida de la capacidad proliferativa. Entre los factores de crecimiento y las citoquinas antiinflamatorias se incluyen (Raber‐Durlacher 2013):
-
el factor de crecimiento de queratinocitos;
-
los factores estimulantes de colonias;
-
el factor de crecimiento epidérmico;
-
el factor de crecimiento transformante beta;
-
el factor de crecimiento derivado del suero de la leche;
-
la interleucina 11;
-
ATL‐104;
-
el factor trefoil.
De qué manera podría funcionar la intervención
Los factores de crecimiento descritos aquí son proteínas que se unen a los receptores de las células objetivo y aumentan la proliferación de las células epiteliales que forman el recubrimiento de la mucosa de la cavidad bucal, o promueven la recuperación de los leucocitos que contribuyen al mantenimiento de la salud bucodental posterior a la quimioterapia a dosis convencional o alta (con o sin radioterapia) (Raber‐Durlacher 2013). Las citoquinas antiinflamatorias también son proteínas o glucoproteínas que se unen a los receptores de las células objetivo, y se considera que alteran el equilibrio complejo de las citoquinas pro y antiinflamatorias incluidas en la patogenia de la mucositis oral (Raber‐Durlacher 2013).
Actualmente las guías basadas en la evidencia recomiendan los factores de crecimiento para la prevención de la mucositis oral en los pacientes con cánceres hematológicos sometidos a quimioterapia e irradiación corporal total a dosis alta antes del trasplante de células madre hematopoyéticas (Lalla 2008). Se ha postulado que las células tumorales también pueden tener receptores que acomodan las citoquinas y los factores de crecimiento, por lo que promueven la proliferación de las células cancerosas en los tumores sólidos (Lalla 2008; von Bültzingslöwen 2006). Una revisión sistemática de 2010 indicó que el riesgo de leucemia mieloide aguda (LMA) o síndrome mielodisplástico (SMD) aumenta en los pacientes con diferentes cánceres sometidos a quimioterapia con factor estimulante de colonias de granulocitos (FEC‐G) en comparación con los sometidos a quimioterapia sin FEC‐G (Lyman 2010). Los autores concluyeron que no estaba claro si el aumento del riesgo de LMA/SMD se debió al FEC‐G o al aumento de la intensidad de la dosis de quimioterapia en esos pacientes. Sin embargo, la revisión también informó una reducción de la mortalidad general en los que recibieron FEC‐G.
Por qué es importante realizar esta revisión
Esta revisión Cochrane es la primera de una serie que reemplazará la revisión publicada previamente que analiza todas las intervenciones para la prevención de la mucositis oral en los pacientes con cáncer sometidos a tratamiento (Worthington 2011). El Mucositis Study Group (MSG) de la Multinational Association of Supportive Care in Cancer/International Society of Oral Oncology (MASCC/ISOO) es un grupo que se estableció en 1998 para producir guías internacionales de práctica clínica basadas en pruebas para controlar la mucositis (oral y gastrointestinal), que se publicaron primero en 2004, con la última actualización publicada en 2014 (Lalla 2014). Para facilitar la actualización futura de las revisiones Cochrane sobre este tema y también para hacerlas más utilizables para los médicos, los elaboradores de guías y los consumidores, se ha decidido dividir la revisión Cochrane original en las mismas categorías de intervención a las utilizadas por MASCC/ISOO, que son las siguientes:
-
atención oral básica / práctica clínica adecuada;
-
factores de crecimiento y citoquinas;
-
agentes antiinflamatorios;
-
antimicrobianos, agentes que cubren la mucosa, anestésicos y analgésicos;
-
láser y otra fototerapia;
-
crioterapia;
-
agentes naturales y variados;
-
amifostina.
Se considera que el seguimiento de la estructura MASCC/ISOO permitirá que las revisiones Cochrane hagan un mejor aporte a dichas guías. También se podrá hacer una evaluación minuciosa y rigurosa y resumir la evidencia en cada una de las categorías, lo que no es posible en una revisión Cochrane única que se acercaba a los 150 estudios incluidos.
También es importante hacer esta revisión ya que sistemáticamente muestra ser la revisión más utilizada producida por el Grupo Cochrane de Salud Oral (en cuanto a descargas de texto completo). También fue clasificada por un panel experto de especialistas en medicina oral como el tema más importante en el campo de la medicina oral en un ejercicio internacional de asignación de prioridades realizado por el Grupo Cochrane de Salud Oral en 2014 (Worthington 2015).
Objetivos
Evaluar los efectos de las citoquinas y los factores de crecimiento para prevenir la mucositis oral en pacientes con cáncer sometidos a tratamiento.
Métodos
Criterios de inclusión de estudios para esta revisión
Tipos de estudios
Se incluyeron todos los ensayos controlados aleatorios (ECA) de diseño paralelo. Es posible realizar estudios cruzados en esta área ya que los pacientes pueden recibir varias sesiones de tratamiento, pues cualquier mucositis cicatriza completamente en los períodos entre las sesiones. Sin embargo, no se incluyeron datos cruzados ya que no fue posible descartar efectos del período, dado que el riesgo de mucositis aumenta cuando los pacientes reciben ciclos adicionales de tratamiento (Scully 2006; Sonis 2009). En cambio, solo se utilizaron los datos del primer período y dichos estudios se analizaron como estudios de grupos paralelos.
Tipos de participantes
Se incluyeron todos los pacientes con cáncer que recibían tratamiento.
Tipos de intervenciones
Se incluyeron los estudios que compararon los factores de crecimiento y las citoquinas para la prevención de la mucositis oral (también se habría incluido la estomatitis inducida por el tratamiento dirigido si se hubieran identificado dichos estudios) contra atención habitual, ningún tratamiento u otro tratamiento para prevenir la mucositis oral. También se incluyeron los estudios que compararon diferentes factores de crecimiento y citoquinas o diferentes regímenes de factores de crecimiento y citoquinas entre sí (estudios de comparación directa).
Se excluyeron los estudios con intervenciones "complejas" para la prevención de la mucositis, como láser más factores de crecimiento y citoquinas versus láser. Lo anterior se debe a que es difícil atribuir cualquier efecto mostrado a algún componente particular de la intervención. Se excluyeron los estudios que evaluaron diferentes tratamientos del cáncer en que el resultado primario es la supervivencia / curación y la mucositis se consideró una toxicidad.
Tipos de medida de resultado
Se coincide con Williamson 2012 en que si se utilizan los ensayos clínicos y las revisiones sistemáticas, los resultados evaluados deben ser los considerados importantes para los pacientes, los profesionales sanitarios y otras partes interesadas clave. Si los resultados y las medidas de resultado no son consistentes entre los estudios, no será posible comparar y resumir los estudios de investigación y existe la posibilidad de sesgo de informe de resultado, con un informe selectivo de los resultados según la significación estadística y lo favorable que sean (Clarke 2007; Dwan 2008; Williamson 2005). Lo anterior puede dar lugar a estimaciones exageradas del efecto en las revisiones sistemáticas de intervenciones, lo que conlleva a la creencia incorrecta de que una intervención es más beneficiosa que lo que verdaderamente es (Clarke 2007). Se piensa que la manera de tratar este problema es desarrollar grupos de resultados centrales específicos de la afección o la enfermedad para utilizarlos como un mínimo cuando se realizan e informan los ensayos clínicos (Clarke 2007; Williamson 2012).
Por lo tanto, se utilizó el grupo de resultados centrales producido por Bellm 2002, que se registra en el sitio web COMET (Core Outcome Measures in Effectiveness Trials) Initiative (www.comet‐initiative.org) y es el único grupo de resultados centrales para la mucositis oral del que se tiene referencia. Se agregaron los resultados "interrupciones del tratamiento del cáncer" y "eventos adversos".
Resultados primarios
Incidencia de mucositis de cualquier gravedad. Se utilizó una escala de 0 a 4 puntos (ninguna a grave) para medir la mucositis, y se dicotomizó como cualquier mucositis (0 versus 1+), mucositis moderada a grave (0 a 1 versus 2+) y mucositis grave (0 a 2 versus 3+).
Algunos estudios miden los efectos de la mucositis mediante una escala compuesta. Si hubiera sido posible extraer los datos de la "mucositis solamente" de la puntuación total, se habrían incluido los datos en los análisis. Si no hubiera sido posible, se habrían registrado los datos compuestos en una tabla adicional.
Resultados secundarios
-
Interrupciones del tratamiento del cáncer.
-
Dolor oral.
-
Calidad de vida.
-
Normalidad de la dieta (que incluye el uso de sondas de alimentación por gastrostomía endoscópica percutánea [GEP] o nutrición parenteral total [NPT]).
-
Eventos adversos.
-
Número de días en el hospital.
-
Número de días de tratamiento con analgésicos opiáceos.
-
Número de días imposibilitados de recibir el fármaco por vía oral.
Results
Description of studies
Results of the search
Our electronic searches identified 5125 records. After removing duplicates, this number was reduced to 3145. We examined the titles and abstracts of these records and discarded 3042, leaving 103 records to examine in more detail. Where possible, we obtained full‐text copies of these potentially relevant records and linked any references pertaining to the same study under a single study ID. These 103 records represented 73 studies. We excluded 24 studies at this stage. The remaining 49 studies met our inclusion criteria and we included 35 of these studies in the review. The remaining 14 studies are awaiting assessment because we do not have enough information to be able to include them in the review. We present this process as a study flow chart in Figure 1.

Study flow diagram.
RCT = randomised controlled trial.
Included studies
We included 35 studies in this review. For further information see the Characteristics of included studies tables.
Characteristics of the trials
Study design
One study was a cross‐over design that reported the first‐period data separately (Chi 1995), whilst the remaining studies all used a parallel design.
Number of arms
Twenty‐seven studies had two arms, three studies had three arms (Blijlevens 2013; Freytes 2004; Peterson 2009), one study had four arms (Wu 2009), two studies had five arms (Cartee 1995; Linch 1993), and two studies had seven arms (Blazar 2006; Meropol 2003). Where studies had more than two arms, this was because they tested a range of doses of the cytokine/growth factor. In such instances we combined the arms testing different doses to make pairwise comparisons against the control group. Where possible, we also made head‐to‐head comparisons of doses (Blijlevens 2013; Cartee 1995; Freytes 2004; Meropol 2003; Peterson 2009).
Country
Nine studies were conducted in the USA (Blazar 2006; Cartee 1995; Crawford 1999; Freytes 2004; Meropol 2003; Schneider 1999; Spielberger 2004; Su 2006; Vadhan‐Raj 2010), four in Italy (Cesaro 2013; Dazzi 2003; Lucchese 2016a; Lucchese 2016b), two in each of South Korea (Kim 2017; Wu 2009), the UK (Linch 1993; McAleese 2006), Iran (Gholizadeh 2016; Hosseinjani 2017), Finland (Makkonen 2000; Saarilahti 2002), and one in each of the Netherlands (van der Lelie 2001), Russia (Peterson 2009), Japan (Katano 1995), Germany (Fink 2011), China (Chi 1995), Australia (Bradstock 2014), and France (Antoun 2009). The remaining seven studies were conducted across more than one country: USA and Australia (Jagasia 2012; Rosen 2006); USA and Canada (Nemunaitis 1995); Australia, Canada and the USA (Brizel 2008); Australia, Canada and Europe (Henke 2011); Canada, USA and Europe (Le 2011); and 14 European countries (Blijlevens 2013).
Number of centres
Fifteen studies were conducted at a single‐centre (Antoun 2009; Cartee 1995; Chi 1995; Dazzi 2003; Fink 2011; Hosseinjani 2017; Katano 1995; Kim 2017; Lucchese 2016a; Lucchese 2016b; McAleese 2006; Saarilahti 2002; Su 2006; Vadhan‐Raj 2010; van der Lelie 2001). Eighteen studies were multicentric, ranging from two sites (Blazar 2006; Makkonen 2000) to 46 sites (Le 2011). It was unclear how many centres were involved in the remaining two studies (Gholizadeh 2016; Schneider 1999).
Trials registries
We were able to find a trials registry number for 13 studies (Blijlevens 2013; Bradstock 2014; Cesaro 2013; Fink 2011; Gholizadeh 2016; Henke 2011; Hosseinjani 2017; Jagasia 2012; Kim 2017; Le 2011; McAleese 2006; Spielberger 2004; Vadhan‐Raj 2010), although only six studies mentioned it in the study report (Bradstock 2014; Cesaro 2013; Gholizadeh 2016; Hosseinjani 2017; Kim 2017; Vadhan‐Raj 2010), whilst a further study mentioned an obsolete number (Jagasia 2012).
Sample size calculation
Twenty‐one studies reported details of sample size calculations, but four of these were not based on oral mucositis (Cesaro 2013; Crawford 1999; Jagasia 2012; Su 2006). One further study stated that 36 participants "should be enough to demonstrate a clinically significant difference", with no details reported (van der Lelie 2001).
Funding and conflicts of interest
This information is difficult to summarise as it was not always adequately reported.
Nineteen studies appeared to be funded by industry alone i.e. it was explicitly stated that they received industry funding or that industry supplied the interventions or both. Five studies appeared to be funded by government/public sector alone and did not state whether or not the interventions were supplied by industry (Cartee 1995; Lucchese 2016a; Lucchese 2016b; Su 2006; Wu 2009). Four studies reported both government and industry funding, three of which stated that industry provided the interventions (Bradstock 2014; Chi 1995; Kim 2017), and one of which was not clear (Blazar 2006). Two studies stated that there was no funding for the study (Cesaro 2013; Hosseinjani 2017). The remaining five studies did not mention funding (Dazzi 2003; Freytes 2004; Gholizadeh 2016; McAleese 2006; Saarilahti 2002).
Ten studies, all industry funded, declared conflicts of interest for reasons such as board membership of the funder, employment or leadership roles with the funder, receipt of lecture fees or consultancy fees or research funding or honoraria from the funder (Antoun 2009; Blijlevens 2013; Brizel 2008; Henke 2011; Jagasia 2012; Le 2011; Peterson 2009; Rosen 2006; Spielberger 2004; Vadhan‐Raj 2010). Six of those studies also declared that some authors owned equity/stock with the funder (Brizel 2008; Henke 2011; Jagasia 2012; Le 2011; Rosen 2006; Spielberger 2004). Three studies did not explicitly declare conflicts of interest, but some authors were employed by the funder (Crawford 1999; Linch 1993; Nemunaitis 1995). Eight studies stated that there were no conflicts of interest (Bradstock 2014; Cesaro 2013; Gholizadeh 2016; Hosseinjani 2017; Kim 2017; Lucchese 2016a; Lucchese 2016b; Su 2006). The remaining 14 studies did not mention conflicts of interest.
Characteristics of the participants
Number randomised/analysed
The studies randomised 3218 participants, of whom 3102 were included in the studies' analyses (the latter number does not include any participants from Makkonen 2000, as this study did not report how many of the 40 randomised participants were analysed).
Age and sex
The age of the participants ranged from 1 to 87 years, with four studies only including children and young adults (i.e. up to 18 years) (Cesaro 2013; Gholizadeh 2016; Lucchese 2016a; Lucchese 2016b). Of the 31 studies including adult participants, one had a median age of 29 (Dazzi 2003), two had mean or median ages in their 30s (Linch 1993; Nemunaitis 1995), nine in their 40s (Blazar 2006; Bradstock 2014; Cartee 1995; Chi 1995; Hosseinjani 2017; Jagasia 2012; Spielberger 2004; Vadhan‐Raj 2010; van der Lelie 2001), 11 in their 50s (Blijlevens 2013; Brizel 2008; Fink 2011; Freytes 2004; Henke 2011; Katano 1995; Kim 2017; Le 2011; Peterson 2009; Saarilahti 2002; Wu 2009), seven in their 60s (Antoun 2009; Crawford 1999; Makkonen 2000; McAleese 2006; Meropol 2003; Rosen 2006; Su 2006), and one study did not report the age, although the inclusion criteria stated that they must be at least 18 years old (Schneider 1999). In 24 studies, there was a clear majority of male participants, whilst the male to female ratio was roughly equal in seven studies. In three studies there were more female participants, although two of these exclusively included breast cancer patients (Cartee 1995; Katano 1995), whilst the third included colorectal cancer patients (Peterson 2009).
Cancer type
Fourteen studies enrolled participants with haematological cancers (Blazar 2006; Blijlevens 2013; Bradstock 2014; Fink 2011; Freytes 2004; Gholizadeh 2016; Hosseinjani 2017; Jagasia 2012; Kim 2017; Lucchese 2016a; Lucchese 2016b; Nemunaitis 1995; Spielberger 2004; van der Lelie 2001). Eighteen studies enrolled participants with solid cancers: head and neck (Brizel 2008; Chi 1995; Henke 2011; Le 2011; Makkonen 2000; McAleese 2006; Saarilahti 2002; Schneider 1999; Su 2006; Wu 2009); colorectal (Antoun 2009; Meropol 2003; Peterson 2009; Rosen 2006); breast (Cartee 1995; Katano 1995); lung (Crawford 1999); and sarcoma (Vadhan‐Raj 2010). The remaining three studies enrolled a mixture of participants with solid cancers and participants with haematological cancers, two of which were 80% to 90% solid (Cesaro 2013; Dazzi 2003), and the other study only 3% solid (Linch 1993).
Cancer treatment
In 11 studies, the participants received chemotherapy only (Antoun 2009; Bradstock 2014; Cartee 1995; Chi 1995; Crawford 1999; Gholizadeh 2016; Katano 1995; Meropol 2003; Peterson 2009; Rosen 2006; Vadhan‐Raj 2010). Of the 15 studies in which the participants received conditioning therapy prior to stem cell or bone marrow transplantation, five of these involved chemotherapy only (Blijlevens 2013; Dazzi 2003; Fink 2011; Hosseinjani 2017; Kim 2017), and one involved total body irradiation (TBI) only (Lucchese 2016b). In the remaining nine transplant studies, all the participants had chemotherapy, but the proportion of participants also receiving TBI differed: 100% (Lucchese 2016a; Nemunaitis 1995; Spielberger 2004); around 50% (Blazar 2006; Jagasia 2012; van der Lelie 2001); 29% (Linch 1993); 10% or less (Cesaro 2013; Freytes 2004). The remaining nine studies were all on head and neck cancer patients where the participants either had radiotherapy to the head and neck alone (Makkonen 2000; McAleese 2006; Saarilahti 2002; Schneider 1999; Su 2006), or radiotherapy to the head and neck plus chemotherapy (Brizel 2008; Henke 2011; Le 2011; Wu 2009), although in one of those studies only 50% of participants had the chemotherapy (Wu 2009).
Of the 15 transplant studies, four involved allogeneic transplants (Blazar 2006; Jagasia 2012; Lucchese 2016b; Nemunaitis 1995), nine involved autologous transplants (Blijlevens 2013; Cesaro 2013; Dazzi 2003; Fink 2011; Freytes 2004; Hosseinjani 2017; Kim 2017; Lucchese 2016a; Spielberger 2004), with the remaining two involving a mixture (Linch 1993; van der Lelie 2001).
In six studies, all participants received granulocyte‐colony stimulating factor (a growth factor) as part of the cancer treatment to prevent neutropenia. Four of these studies were investigating keratinocyte growth factor (Blazar 2006; Bradstock 2014; Spielberger 2004; Vadhan‐Raj 2010), and two were investigating granulocyte‐macrophage colony‐stimulating factor (Cartee 1995; Dazzi 2003). Giving all participants this growth factor would have the potential to lessen the impact of the study intervention.
Characteristics of the interventions and comparisons
Keratinocyte growth factor (KGF)
Of the 16 studies investigating KGF, one study assessed KGF‐2 (repifermin) (Freytes 2004), whilst the remaining studies assessed KGF‐1 (palifermin).
Fourteen studies used a placebo comparator (Blazar 2006; Blijlevens 2013; Bradstock 2014; Brizel 2008; Freytes 2004; Henke 2011; Jagasia 2012; Le 2011; Lucchese 2016a; Lucchese 2016b; Meropol 2003; Rosen 2006; Spielberger 2004; Vadhan‐Raj 2010), one was KGF plus standard care versus standard care alone (Fink 2011), and the remaining study used a chlorhexidine mouthwash comparator (Gholizadeh 2016).
In all studies, KGF was given intravenously. The most common total dosage received was 360 µg/kg in seven studies (Bradstock 2014; Fink 2011; Gholizadeh 2016; Jagasia 2012; Lucchese 2016a; Lucchese 2016b; Spielberger 2004). The dosage varied greatly in the other studies: 120 µg/kg (Rosen 2006); 180 µg/kg (Vadhan‐Raj 2010); 600 µg/kg (Brizel 2008); 840 μg/kg to 960 µg/kg depending on resection type (Henke 2011); 1440 µg/kg (Le 2011). The dosages varied within the remaining studies due to multiple arms receiving different doses: 3 μg/kg to 240 µg/kg (Meropol 2003); 180 μg/kg to 360 µg/kg (Blijlevens 2013); 240 μg/kg to 720 µg/kg (Blazar 2006); 325 μg/kg to 650 µg/kg (Freytes 2004).
The number of doses received ranged from one (Vadhan‐Raj 2010) to 13 (Freytes 2004), but the most common was six (Blijlevens 2013; Bradstock 2014; Fink 2011; Gholizadeh 2016; Lucchese 2016a; Lucchese 2016b; Spielberger 2004).
Reporting of compliance varied too greatly to summarise succinctly but compliance was generally high (see Characteristics of included studies).
Granulocyte‐macrophage colony‐stimulating factor (GM‐CSF)
Of the eight studies investigating GM‐CSF, four used a placebo comparator (Cartee 1995; Dazzi 2003; Nemunaitis 1995; van der Lelie 2001), two used a no‐treatment comparator (Chi 1995; McAleese 2006), one was GM‐CSF plus sucralfate versus sucralfate alone (Makkonen 2000), and the remaining study used a sucralfate comparator (Saarilahti 2002).
In three studies, GM‐CSF was given by subcutaneous injection (Chi 1995; Makkonen 2000; McAleese 2006). In Makkonen 2000, both arms received sucralfate mouthwash that was swallowed after rinsing. In three studies, GM‐CSF was taken as a mouthwash (Cartee 1995; Dazzi 2003; Saarilahti 2002). In Saarilahti 2002, both the GM‐CSF and sucralfate comparator mouthwashes were swallowed after rinsing. In one study, GM‐CSF was given as an oral gel and swallowed after holding in the mouth (van der Lelie 2001). In the remaining study, GM‐CSF was given intravenously (Nemunaitis 1995).
Total dosage varied greatly: 40 µg (Chi 1995); 2100 µg (McAleese 2006); 5250 µg/m2 (Nemunaitis 1995). The dosages ranged from 12.6 µg to 12,600 µg within one study due to multiple arms receiving different doses (Cartee 1995). Another study reported a mean total dosage of 3398 µg, but this total ranged from 300 µg to 7200 µg depending on the participant's weight and the length of radiotherapy course (Makkonen 2000). In two studies, the dose was 150 µg per day but the total received varied depending on neutrophil recovery (Dazzi 2003), and the length of radiotherapy course (Saarilahti 2002). In the remaining study, the dose was 300 µg per day but the total received varied depending on neutrophil recovery (van der Lelie 2001).
As is obvious from the variation in total dosage, the number of doses received varied greatly both between studies and within studies. Compliance was also reported inconsistently but was generally high (see Characteristics of included studies).
Granulocyte‐colony stimulating factor (G‐CSF)
Of the six studies investigating G‐CSF, four used a placebo comparator (Crawford 1999; Linch 1993; Schneider 1999; Su 2006), one used a no‐treatment comparator (Katano 1995), and the remaining study compared a type of G‐CSF that is given as a single dose (pegfilgrastim) with the standard G‐CSF that is given in multiple doses (filgrastim) (Cesaro 2013).
Four studies reported that G‐CSF was given by subcutaneous injection (Crawford 1999; Katano 1995; Schneider 1999; Su 2006), whilst one did not specify, but was probably subcutaneous (Cesaro 2013), and the remaining study was intravenous delivery (Linch 1993).
Total dosage varied: 3220 µg/m2 (Crawford 1999); 3 µg/kg per day with the total dependent on neutrophil counts and the length of radiotherapy course (Schneider 1999; Su 2006); 2 µg/kg to 15 µg/kg per day due to multiple arms receiving different dosages with the total was depending on neutrophil recovery (Linch 1993); 125 µg per day with total depending on neutrophil recovery (Katano 1995); 100 µg/kg in the pegfilgrastim arm and at least 45 µg/kg in the filgrastim arm (Cesaro 2013).
The number of doses received varied both between studies and within studies. Compliance was reported as being 100% in one study (Cesaro 2013), whilst one study only reported that the interventions were well tolerated (Schneider 1999), and the remaining four studies did not report on compliance.
Epidermal growth factor (EGF)
Two studies investigated an oral spray of EGF, both using a placebo comparator (Kim 2017; Wu 2009). Total dosage was unclear in both studies but the daily dose was 50 µg/mL (six sprays twice daily) in one study (Kim 2017), and 10 µg to 100 µg per day (due to multiple arms receiving different dosages) in the other study (Wu 2009). The number of doses varied depending on neutrophil recovery and resolution of oral mucositis in Kim 2017, whilst participants in Wu 2009 received the interventions daily for five weeks but it was not clear if that meant only on the radiotherapy days (five days per week) or seven days per week. Compliance was reported as a median of 93% and 92% in the EGF and placebo groups respectively in Kim 2017, but compliance was not reported in Wu 2009.
Intestinal trefoil factor (ITF)
One study investigated an oral spray of ITF using a placebo comparator (Peterson 2009). The ITF was not expectorated. The study included two ITF arms with total dosages of 336 mg and 2688 mg. The mode of administration was three sprays to the oral mucosa eight times daily for 14 days. Patient‐reported compliance was 97%.
Erythropoietin
One study investigated a mouthwash of erythropoietin using a placebo comparator (Hosseinjani 2017). Neither swallowing nor expectoration was reported. The mouthwash was taken as 15 mL (50 IU/mL) four times daily (daily dosage of 3000 IU) for 14 days or until neutrophil recovery, whichever occurred first. Compliance was reported narratively as being low but no reason was stated.
Transforming growth factor (TGF)
One study investigated TGF‐beta(2) using a placebo comparator (Antoun 2009). The dosage was 2 ng of TGF per mg protein mixed with cool boiled water at 0.23 g/mL (100 kcl/100 mL). During each cycle participants received 750 mL to 1000 mL per day plus any other food desired. The formula was administered for two days before, two days during, and three days after chemotherapy (seven days/cycle), for one to eight cycles. Compliance was poor i.e. nine participants did not eat the formula and were excluded.
Characteristics of the outcomes
Primary outcome
For the primary outcome of oral mucositis, we were interested in both the presence/absence of oral mucositis, and also different levels of severity. All 35 studies assessed and reported the incidence of oral mucositis. Twenty‐two studies primarily used the WHO (World Health Organization) 0 to 4 scale, whilst four used the NCI‐CTC (National Cancer Institute common toxicity criteria) 0 to 4 scale (Brizel 2008; Dazzi 2003; Freytes 2004; Kim 2017), four used the RTOG (Radiation Therapy Oncology Group) 0 to 4 scale (Chi 1995; McAleese 2006; Saarilahti 2002; Wu 2009), one used the CALGB (Cancer and Leukemia Group B) 0 to 4 scale (Cartee 1995), one used an unnamed 0 to 2 scale (Makkonen 2000), one used an unnamed 0 to 3 scale (Su 2006), one used an unnamed 0 to 4 scale (Nemunaitis 1995), and the remaining study did not mention a scale and only reported the incidence of stomatitis (Linch 1993). The different oral mucositis assessment scales are described in Appendix 9.
Twelve studies reported the data in our preferred format which was the maximum oral mucositis score experienced by each participant over the length of the study, allowing us to dichotomise the data into various levels of severity as described in the section Primary outcomes. Eighteen studies reported a particular level of severity (e.g. grade 3 or above). One study reported the incidence of each oral mucositis grade on multiple assessment days. We were unable to use the data from the remaining four studies for analysis due to unclear or lack of reporting (Linch 1993; Lucchese 2016a; Lucchese 2016b; Makkonen 2000).
The frequency of oral mucositis assessment and the duration for which it was assessed varied greatly across the studies, often depending on whether the participants received radiotherapy, and often depending on the speed of neutrophil recovery, resolution of oral mucositis, or duration of hospitalisation. Four studies did not report the frequency of assessment (Antoun 2009; Cesaro 2013; Linch 1993; Nemunaitis 1995), whilst a further study was unclearly reported (Lucchese 2016b). Twelve studies reported daily assessments, eight reported weekly assessments, with the remainder falling somewhere in between these two frequencies. Where participants had multiple cycles of treatment, we only reported the results for the first cycle if these data were available separately.
Secondary outcomes
Interruptions to cancer treatment
Six studies reported data that we were able to use in analyses (Brizel 2008; Henke 2011; Le 2011; Saarilahti 2002; Su 2006; Wu 2009), whilst a further two studies assessed this outcome but either did not report the interruption by treatment arm (Makkonen 2000), or narratively reported that there were no differences, with no numerical data (Schneider 1999).
Two studies reported this outcome as the incidence of unscheduled radiotherapy breaks of five or more days (Brizel 2008; Henke 2011; Le 2011). Two of those studies also reported on chemotherapy delays/discontinuations (Henke 2011; Le 2011). The remaining studies all reported on the incidence of interruptions to radiotherapy treatment, one of which stated that interruptions were specifically due to oral mucositis (Saarilahti 2002), and another reporting the incidence of three or more consecutive days of interruption (Wu 2009).
Oral pain
Four studies reported data that we were able to use in analyses (Dazzi 2003; Freytes 2004; Henke 2011; Le 2011). Two of these studies used a 0 to 4 scale and reported the mean (Henke 2011; Le 2011), whilst the other two studies used a 0 to 10 scale and reported the mean worst score experienced (Dazzi 2003; Freytes 2004).
Of the 11 other studies that reported that oral pain was an outcome of the study, five reported the results as area under the curve (AUC) but, for reasons stated in the section Measures of treatment effect, we did not meta‐analyse these data (Blijlevens 2013; Kim 2017; Lucchese 2016a; Rosen 2006; Spielberger 2004). Two studies reported medians, which are not suitable for meta‐analysis (Vadhan‐Raj 2010; van der Lelie 2001). One study reported the data graphically as a mean over time with no standard deviation (Saarilahti 2002). One study narratively reported that there were no differences, with no numerical data (Wu 2009). The remaining two studies used two different scales: one reported as "no difference" and another reported on a graph with no standard deviation (Makkonen 2000); both reported on a graph over time, with one also reported as AUC (Meropol 2003).
Quality of life
Four studies assessed quality of life using various assessment scales: European Quality Of Life Utility Scale ‐ EQ‐5D (Blijlevens 2013); modified Oral Mucositis Daily Questionnaire ‐ OMDQ (Kim 2017); Functional Assessment of Cancer Therapy ‐ FACT (Spielberger 2004); an unnamed 1 to 7 scale (Vadhan‐Raj 2010). We did not use the data in our analyses as they were either reported as AUC (Kim 2017; Spielberger 2004), as a median (Vadhan‐Raj 2010), or the mean was reported at one very early time point with no standard deviation (Blijlevens 2013).
Normalcy of diet ‐ including use of percutaneous endoscopic gastrostomy (PEG) feeding tubes or total parenteral nutrition (TPN)
Fourteen studies reported data that we were able to use in analyses in the form of: incidence of TPN (Blijlevens 2013; Cesaro 2013; Fink 2011; Jagasia 2012; Kim 2017; Spielberger 2004; van der Lelie 2001); incidence of PEG (Brizel 2008; Saarilahti 2002; Su 2006); incidence of TPN, PEG, nasogastric tube or intravenous (IV) hydration (Henke 2011; Le 2011); incidence of "tube feeding" (McAleese 2006); ability to eat using a 1 to 4 scale (Freytes 2004). Only one of these studies explicitly stated that supplemental feeding was due to oral mucositis (Henke 2011).
Two further studies only reported the duration of TPN (Lucchese 2016a; Lucchese 2016b), and another study used 0 to 4 scales to assess difficulty in eating and drinking, but reported median scores (Vadhan‐Raj 2010).
We combined studies reporting incidence of TPN, PEG, etc., in meta‐analyses of 'supplemental feeding'.
Adverse events
This outcome was very poorly reported with some studies reporting numerical data and some reporting narratively. Some studies only reported adverse events if there was a minimum incidence (which varied between studies) or if there was a specified difference in incidence between treatment arms. It was also difficult to determine whether or not many adverse effects were due to the study interventions, or due to the underlying cancer treatment. We presented adverse event data/information only in an additional table.
Number of days in hospital
Two studies reported data that we were able to use in analyses i.e. mean and standard deviations (Blijlevens 2013; Hosseinjani 2017).
Five further studies reported medians (Cesaro 2013; Fink 2011; Linch 1993; Nemunaitis 1995; van der Lelie 2001). One study reported data graphically with no standard deviation or P value (Crawford 1999). One study listed this as an outcome of the study but did not actually report it (Kim 2017). One study reported the incidence of hospitalisation (Saarilahti 2002).
Number of days of treatment with opioid analgesics
Two studies reported data that we were able to use in analyses i.e. mean and standard deviations (Blijlevens 2013; Dazzi 2003; Freytes 2004). Only one study specified that the opioid use was due to oral mucositis (Freytes 2004).
Four further studies reported medians (Fink 2011; Kim 2017; Lucchese 2016a; Spielberger 2004), whilst another study did not state whether the data were means or medians, and there were no standard deviations or P value (Lucchese 2016b). Three studies reported total dose of opioid analgesic (Henke 2011; Le 2011; Vadhan‐Raj 2010), whilst four studies reported the incidence of its use (Hosseinjani 2017; Jagasia 2012; Saarilahti 2002; van der Lelie 2001). One study stated that it assessed the use of opioid analgesics, but did not specify whether this was in terms of duration, quantity or incidence, and did not actually report any data (Wu 2009).
Number of days unable to take medicine orally
No studies reported this outcome.
Excluded studies
We excluded 24 studies from this review for the following reasons.
-
Not a randomised controlled trial or unclear (Foncuberta 2001; Gordon 1993; Horsley 2007; Hunter 2009; Iwase 1997; Limaye 2013; Throuvalas 1995; Vitale 2014).
-
Stomatitis incidence reported in adverse events table (Kubo 2016; Lee 2016; Nabholtz 2002; Tsurusawa 2016).
-
Unclear if mucositis was oral or gastrointestinal (Jones 1996; Legros 1997; Pettengell 1992).
-
Study stopped early with very few participants enrolled (Antin 2002; NCT00360971; NCT00626639).
-
Oral mucositis not mentioned and unknown if measured (Gebbia 1994; Gladkov 2013).
-
Some participants had oral mucositis at baseline (Ryu 2007).
-
Cross‐over study with no reporting of first‐period data (de Koning 2007).
-
Results reported by cycle assuming independence (Karthaus 1998).
-
Survival/cure was primary outcome with mucositis (unclear if oral or gastrointestinal) as a toxicity (Ifrah 1999).
Risk of bias in included studies
Allocation
Random sequence generation
Nineteen studies described an adequate method of generating a random sequence, so we assessed these as at low risk of bias. The remaining 16 studies stated that they were randomised without providing a description of how the random sequence was generated, so we assessed these as at unclear risk of bias.
Allocation concealment
Seventeen studies described a process that would have concealed the random sequence from those involved in the study, thus allowing it to be applied as it was generated. We assessed these 17 studies as at low risk of bias. The remaining 18 studies did not describe any methods used to conceal the random sequence, so we assessed them as at unclear risk of bias.
In total, 16 studies are at low risk of selection bias, meaning that we assessed both of the above domains as low risk of bias. The remaining 19 studies are at unclear risk of selection bias because one or both of the above domains were rated as unclear.
Most studies were carried out in middle‐income and high‐income countries with strict controls and regulations and we feel that many of them probably had adequate randomisation, and that the unclear ratings for these two domains were probably due to reporting issues rather than actual bias. Therefore, when incorporating risk of bias into our GRADE assessments, we did not downgrade any evidence based on selection bias.
Blinding
Blinding of participants and personnel (performance bias)
We assessed 28 studies as at low risk of bias. Twenty‐seven of these studies used a placebo comparator and this ensured that blinding was performed successfully. One further study compared GM‐CSF with sucralfate, but the interventions were supplied as identical‐looking mouthwashes, the study was described as double‐blind, and there was no reason to suspect that participants or personnel were not blinded (Saarilahti 2002).
We assessed seven studies as at high risk of bias. Three of these studies used a no‐treatment comparator, so blinding was not possible (Chi 1995; Katano 1995; McAleese 2006). Two other studies were similar in that they compared KGF plus best supportive care with best supportive care alone (Fink 2011), and GM‐CSF plus sucralfate with sucralfate alone (Makkonen 2000). One study compared intravenous KGF with a chlorhexidine mouthwash (Gholizadeh 2016). The remaining study compared two types of G‐CSF, but the dosing schedule was very different, ensuring that blinding was not possible (Cesaro 2013).
Blinding of outcome assessment (detection bias)
We assessed 29 studies as at low risk of bias. We assessed four studies as at unclear risk of bias because blinding of outcome assessment was not mentioned, but we judged that it would have been possible to achieve (Cesaro 2013; Chi 1995; Katano 1995; Makkonen 2000). We assessed the remaining two studies as at high risk of bias because they either stated that there was no blinding of outcome assessors (Fink 2011), or it was implied by the description "single‐blind" (Linch 1993).
Incomplete outcome data
Attrition was generally very low and we assessed 31 studies as at low risk of bias. We assessed two studies as at unclear risk of bias because one did not report how many of the randomised participants were included in the analyses (Makkonen 2000), and the other did not report the attrition by treatment arm but there was potential for bias if the dropouts were mostly from one arm and had developed the outcome of severe oral mucositis (Cartee 1995). We assessed two studies as at high risk of bias because one had very high attrition (Antoun 2009), and the other had 19% attrition in one arm compared to none in the other arm (Fink 2011).
Selective reporting
It is important to note that we have perhaps been quite lenient when rating bias under this domain. We have tended to focus on the primary outcome because the vast majority of the data are for this outcome. Many studies have only reported a particular level of oral mucositis severity, for example grade 2 to 4 (ulcerative/moderate to severe), when they could have reported more usable data by reporting the maximum grade experienced per patient, allowing us to dichotomise this into all severities. Some readers may consider this to be bias but we have reported all this information transparently in the Characteristics of included studies tables, thus allowing the reader to decide if they would judge the risk of bias differently. Furthermore, many secondary outcomes were reported poorly or in a way that was not amenable to meta‐analysis, which in most cases is a reporting issue rather than a bias issue. This highlighted the problem with the current Cochrane risk of bias tool in that meta‐analyses are being biased due to missing information, but this is not being accounted for in the meta‐analysis. It does not seem appropriate to rate a study at high risk of bias due to a secondary outcome when it is contributing data to the meta‐analysis for the primary outcome, and it is the meta‐analysis for the secondary outcome that is affected by bias. Again, all this information is clearly reported in the Characteristics of included studies tables.
We assessed 32 studies as at low risk of bias. We assessed the remaining three studies as at high risk of bias, two because there were no usable data for the primary outcome (Linch 1993; Makkonen 2000), and one because several outcomes were assessed but not reported (Wu 2009).
Other potential sources of bias
We did not consider there to be any issues arising from other potential sources of bias in any of the studies and we therefore assessed them all as at low risk of other bias.
Overall risk of bias
-
Thirteen studies (37%) were at low overall risk of bias (Blijlevens 2013; Dazzi 2003; Freytes 2004; Henke 2011; Hosseinjani 2017; Kim 2017; Le 2011; Lucchese 2016a; Lucchese 2016b; Saarilahti 2002; Schneider 1999; Su 2006; Vadhan‐Raj 2010).
-
Twelve studies (34%) were at unclear overall risk of bias (Blazar 2006; Bradstock 2014; Brizel 2008; Cartee 1995; Crawford 1999; Jagasia 2012; Meropol 2003; Nemunaitis 1995; Peterson 2009; Rosen 2006; Spielberger 2004; van der Lelie 2001).
-
Ten studies (29%) were at high overall risk of bias (Antoun 2009; Cesaro 2013; Chi 1995; Fink 2011; Gholizadeh 2016; Katano 1995; Linch 1993; Makkonen 2000; McAleese 2006; Wu 2009).
Risk of bias can be viewed graphically in Figure 2.
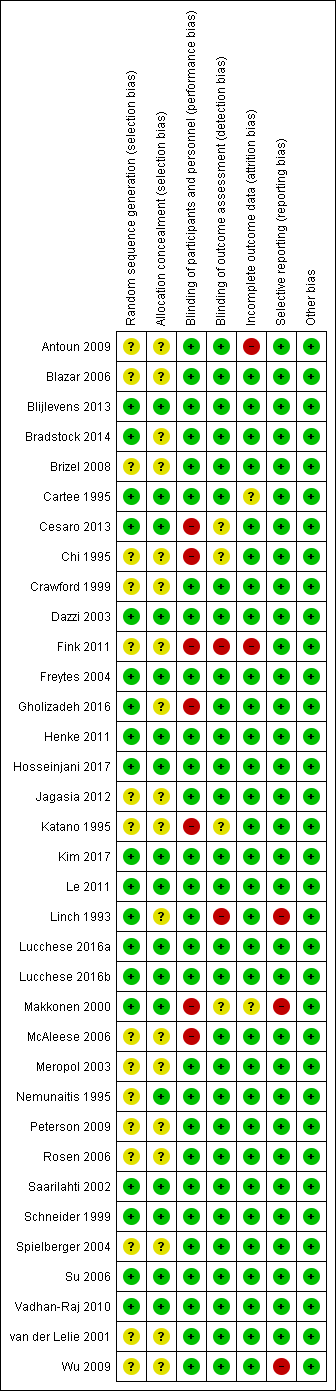
Risk of bias summary: review authors' judgements about each risk of bias item for each included study.
Effects of interventions
See: Summary of findings for the main comparison Keratinocyte growth factor (KGF) compared to placebo for preventing oral mucositis in adults with cancer receiving treatment; Summary of findings 2 Granulocyte‐macrophage colony‐stimulating factor (GM‐CSF) compared to placebo/no treatment for preventing oral mucositis in adults with cancer receiving treatment; Summary of findings 3 Granulocyte‐colony stimulating factor (G‐CSF) compared to placebo/no treatment for preventing oral mucositis in adults with cancer receiving treatment
We used GRADE methods to assess the quality of the body of evidence for each comparison in which there was more than one study in at least one of the subgroups based on cancer treatment. We included the incidence of moderate to severe oral mucositis, the incidence of severe oral mucositis and adverse events. These assessments are presented in summary of findings Table for the main comparison; summary of findings Table 2; summary of findings Table 3.
Keratinocyte growth factor (KGF) versus placebo
Oral mucositis
Adults receiving bone marrow/stem cell transplantation after conditioning therapy for haematological cancers
There was insufficient evidence from four studies, one at low (Blijlevens 2013), two at unclear (Blazar 2006; Spielberger 2004), and one at high risk of bias (Fink 2011), to determine whether or not KGF reduces the risk of any level of oral mucositis: risk ratio (RR) 0.96, 95% confidence interval (CI) 0.88 to 1.05; 655 participants (Analysis 1.1).
Six studies, two at low (Blijlevens 2013; Freytes 2004), three at unclear (Blazar 2006; Jagasia 2012; Spielberger 2004), and one at high risk of bias (Fink 2011), showed a reduction in the risk of moderate to severe oral mucositis in favour of KGF: RR 0.89, 95% CI 0.80 to 0.99; 852 participants (Analysis 1.2).
The same six studies showed a possible reduction in the risk of severe oral mucositis in favour of KGF, but there is also some possibility of an increase in risk: RR 0.85, 95% CI 0.65 to 1.11; 852 participants (Analysis 1.3).
Heterogeneity present in these meta‐analyses may partly be due to differences between studies where transplants were autologous or allogeneic.
Adults receiving radiotherapy to the head and neck with cisplatin/fluorouracil (5FU)
Two studies, both at low risk of bias (Henke 2011; Le 2011), showed a reduction in the risk of any level of oral mucositis in favour of KGF: RR 0.95, 95% CI 0.90 to 1.00; P = 0.04; 374 participants (Analysis 1.1).
Three studies, two at low (Henke 2011; Le 2011), and one at unclear risk of bias (Brizel 2008), showed a reduction in the risk of moderate to severe oral mucositis in favour of KGF: RR 0.91, 95% CI 0.83 to 1.00; P = 0.04; 471 participants (Analysis 1.2).
The same three studies showed a reduction in the risk of severe oral mucositis in favour of KGF: RR 0.79, 95% CI 0.69 to 0.90; 471 participants (Analysis 1.3).
Adults receiving chemotherapy alone for mixed cancers
Two studies, both at unclear risk of bias (Bradstock 2014; Rosen 2006), showed a reduction in the risk of any level of oral mucositis in favour of KGF: RR 0.71, 95% CI 0.60 to 0.85; 215 participants (Analysis 1.1).
Four studies, one at low (Vadhan‐Raj 2010), and three at unclear risk of bias (Bradstock 2014; Meropol 2003; Rosen 2006), showed a reduction in the risk of moderate to severe oral mucositis in favour of KGF: RR 0.56, 95% CI 0.45 to 0.70; 344 participants (Analysis 1.2).
Three studies, one at low (Vadhan‐Raj 2010), and two at unclear risk of bias (Bradstock 2014; Rosen 2006), showed a reduction in the risk of severe oral mucositis in favour of KGF: RR 0.30, 95% CI 0.14 to 0.65; 263 participants (Analysis 1.3).
Interruptions to cancer treatment
Adults receiving radiotherapy to the head and neck with cisplatin/fluorouracil (5FU)
There was insufficient evidence from three studies, two at low (Henke 2011; Le 2011), and one at unclear risk of bias (Brizel 2008), to determine whether or not KGF reduces the risk of having unscheduled radiotherapy breaks of five or more days: RR 1.01, 95% CI 0.65 to 1.59; 473 participants (Analysis 1.4).
There was insufficient evidence, from the same two studies at low risk of bias, to determine whether or not KGF reduces the risk of having chemotherapy delays/discontinuations: RR 0.96, 95% CI 0.62 to 1.47; 374 participants (Analysis 1.5).
Oral pain
Adults receiving bone marrow/stem cell transplantation after conditioning therapy for haematological cancers
There was insufficient evidence, from one study at low risk of bias (Freytes 2004), to determine whether or not KGF reduces the mean worst pain experienced on a 0 (no pain) to 10 (worst pain) scale: mean difference (MD) ‐0.85, 95% CI ‐3.00 to 1.30; 42 participants (Analysis 1.6).
Adults receiving radiotherapy to the head and neck with cisplatin
There was some evidence, from two studies at low risk of bias (Henke 2011; Le 2011), that KGF might lead to a reduction in the mean pain score on a 0 (no pain) to 4 (worst pain) scale: MD ‐0.12, 95% CI ‐0.27 to 0.02; 374 participants (Analysis 1.6).
Normalcy of diet
Adults receiving bone marrow/stem cell transplantation after conditioning therapy for haematological cancers
There was insufficient evidence from four studies, one at low (Blijlevens 2013), two at unclear (Jagasia 2012; Spielberger 2004), and one at high risk of bias (Fink 2011), to determine whether or not KGF reduces the risk of total parenteral nutrition: RR 0.89, 95% CI 0.58 to 1.34; 714 participants (Analysis 1.7).
There was further insufficient evidence, from one study at low risk of bias (Freytes 2004), to determine whether or not KGF reduces the mean worst ability to eat score on a 1 (normal) to 4 (no solids or liquids) scale: MD ‐0.50, 95% CI ‐1.21 to 0.21; 42 participants (Analysis 1.8).
Adults receiving radiotherapy to the head and neck with cisplatin/fluorouracil (5FU)
There was insufficient evidence from three studies, two at low (Henke 2011; Le 2011), and one at unclear risk of bias (Brizel 2008), to determine whether or not KGF reduces the risk of receiving supplemental nutrition (total parenteral nutrition, percutaneous endoscopic gastrostomy, nasogastric tube or intravenous (IV) hydration): RR 1.03, 95% CI 0.77 to 1.37; 473 participants (Analysis 1.7).
Adverse events
This outcome was difficult to summarise due to poor and inconsistent reporting, and we did not meta‐analyse any data. However, there do not appear to be any serious concerns regarding adverse effects of KGF. We have tabulated relevant information in Additional Table 1.
| Study ID | Adverse events results |
|
| |
|
| |
| Insufficient evidence of a difference in infection or Grade 3 to 4 (NCI‐CTC 0 to 4 toxicity scale) skin rash/desquamation | |
| The study authors state that most adverse events were considered to be caused by the cancer treatment or the underlying cancer itself and not related to study treatment. 2 participants in the palifermin group had serious adverse events considered to be related to the intervention: 1 had increased sputum production; the other had dehydration, dysphagia, pain (including abdominal), pancreatitis, and subsequently had schistosomiasis | |
| Total of 28 side effects in palifermin group occurring in 11 of 22 patients (50%) who received at least 4 of the 6 doses. Most frequent (90.9%) were cases of erythema or exanthema, often associated with itching (54.5%). Often (54.5%) a swelling of the oral mucosa including the tongue occurred. In 4 out of 6 patients, this was accompanied by taste disturbance. The severity of side effects were classified as mild to moderate. The CTC Grade 3 occurred only once in the form of a strong heat sensation In 1 of the 11 cases, there was premature discontinuation of palifermin due to severe facial swelling with eyelid and laryngeal pain as well as painful swelling of the hands following the second injection | |
| 25 different adverse events were reported and were mostly not KGF‐related. There was insufficient evidence of a difference for diarrhoea, abdominal pain, infection or rash | |
| "..two patients reported knee joint pain, skin rash was observed in one patient, two patients had abnormal taste, and one showed lingual mucosal thickening" (control group was chlorhexidine mouthrinse. The authors do not report the events by treatment group) | |
|
| |
| KGF‐related AEs with incidence ≥ 5% in KGF group: higher rate of gastrointestinal disorders in KGF group (18/78 versus 2/73; RR 8.42, 95% CI 2.02 to 35.04; P = 0.003). Insufficient evidence of a difference in any AE, tongue coating, tongue disorder, skin and subcutaneous tissue disorders, rash, pruritus, or erythema | |
| "Study drug–related AEs were reported for 35% of palifermin and 11% of placebo patients. The most frequent study drug–related AEs (palifermin, placebo) were rash (9%, 2%), flushing (5%, 0%), dysgeusia (5%, 1%), nausea (4%, 1%),and vomiting (3%, 1%). None of these events led to study withdrawal. Serious AEs considered related to study treatment were reported for five palifermin patients (5%; one each with necrotic pancreatitis, hypersensitivity, tracheostomy malfunction, peritoneal carcinoma, and convulsion) and two placebo patients (2%; one each with hepatitis/hepatic enzyme increase and cryptogenic organizing pneumonia)" | |
| "The administration of palifermin was generally safe and without considerable complications. The only adverse reactions were rashes (lasting for 48–72 hours) localized to the face, upper neck and shoulders, erythema, and altered taste (consistent with the pharmacologic action of palifermin of oral epithelium and skin), most of which were of NCI grade 1 or 2 severity" | |
| "The administration of palifermin was mostly safe and without substantial complications. The mean duration of the OM and the number of adverse event was significant less in the palifermin group (Tables II, III, Figure 1). The main adverse episodes were erythema, cutaneous rashes and altered taste and three of the patients in the palifermin group showed a light thickness of the tongue, mouth and palate" | |
| "Although the predefined frequency of DLTs attributable to KGF was not reached with KGF doses between 1 and 80 µg/kg/d, there were three adverse reactions involving the skin that required discontinuation of KGF in the 18 patients treated with 60 or 80 µg/kg (Table 5). Overall, skin and oral adverse events (rash, flushing, pruritis, edema, hypoesthesia, paresthesia, tongue disorder [thickening], and alteration in taste sensation) attributed to KGF occurred in 13 of 18 patients treated with 60 and 80 µg/kg of KGF (eight patients, grade 1; four patients, grade 2; and one patient, grade 3) and in three of 11 patients treated with 40 µg/kg (all grade 1). These events were reported in 16 of 39 patients (41%) dosed with KGF at > 20 µg/kg/d, whereas these symptoms were reported in only two of 21 subjects (10%) treated with placebo. The skin and oral toxicities associated with KGF were generally mild to moderate in severity, with onset approximately 36 hours after the first dose of KGF and resolution 7 to 10 days thereafter" | |
|
| |
| "The incidence, frequency, and severity of adverse events were similar in the two groups, and most were attributable to the underlying cancer, cytotoxic chemotherapy, or total‐body irradiation. Those that occurred with an incidence that was at least 5 percentage points higher in the palifermin group than in the placebo group are listed in Table 3. Most of these adverse events were consistent with the pharmacologic action of palifermin on skin and oral epithelium (e.g., rash, pruritus, erythema, paresthesia, mouth and tongue disorders, and taste alteration). All these events were mild to moderate in severity, transient (occurring approximately three days after the third dose of palifermin and lasting approximately three days), and not a cause for the discontinuation of study drug. Serious adverse events considered to be related to treatment occurred in one palifermin recipient (rash) and one placebo recipient (hypotension)" | |
|
|
AE = adverse event; CI = confidence interval; KGF = keratinocyte growth factor; NCI‐CTC = National Cancer Institute common toxicity criteria; RR = risk ratio; WHO = World Health Organization.
Number of days in hospital
Adults receiving bone marrow/stem cell transplantation after conditioning therapy for haematological cancers
There was insufficient evidence, from one study at low risk of bias (Blijlevens 2013), to determine whether or not KGF reduces the mean number of days in hospital: MD 0.00, 95% CI ‐1.64 to 1.64; 281 participants (Analysis 1.9).
Number of days of treatment with opioid analgesics
Adults receiving bone marrow/stem cell transplantation after conditioning therapy for haematological cancers
There was some imprecise evidence, from two studies at low risk of bias (Blijlevens 2013; Freytes 2004), that KGF might lead to a reduction in the mean number of days of treatment with opioid analgesics: MD ‐1.41, 95% CI ‐3.33 to 0.51; 323 participants (Analysis 1.10). The average effect is around 1.5 days reduction, but the confidence interval is compatible with both a reduction of almost 3.5 days and an increase of half a day.
No studies assessed the outcomes 'quality of life' and 'number of days unable to take medicine orally'.
Keratinocyte growth factor (KGF) dose comparisons
There was some inconsistent evidence from which no conclusions can be drawn regarding different dosages of KGF (Analysis 2.1; Analysis 2.2; Analysis 2.3; Analysis 2.4; Analysis 2.5; Analysis 2.6; Analysis 2.7; Analysis 2.8).
Keratinocyte growth factor (KGF) versus chlorhexidine
One study, at high risk of bias and analysing 90 children receiving mixed chemotherapy alone for acute lymphoblastic leukaemia (Gholizadeh 2016), compared KGF by IV infusion with chlorhexidine mouthwash. There was weak evidence (due to risk of bias and low sample size) that KGF performs better than chlorhexidine in reducing the risk of any level of oral mucositis (RR 0.67, 95% CI 0.54 to 0.85; Analysis 3.1), moderate to severe oral mucositis (RR 0.12, 95% CI 0.05 to 0.28; Analysis 3.2), and severe oral mucositis (RR 0.01, 95% CI 0.00 to 0.19; Analysis 3.3).
Granulocyte‐macrophage colony‐stimulating factor (GM‐CSF) versus placebo/no treatment
Oral mucositis
Adults receiving bone marrow/stem cell transplantation after conditioning therapy for mixed cancers
There was some evidence, from one study at low risk of bias (Dazzi 2003), that GM‐CSF might lead to a reduction in the risk of any level of oral mucositis: RR 0.91, 95% CI 0.80 to 1.04; 90 participants (Analysis 4.1).
There was insufficient evidence, from one study at unclear risk of bias (Nemunaitis 1995), to determine whether or not GM‐CSF reduces the risk of moderate to severe oral mucositis: RR 0.94, 95% CI 0.79 to 1.13; 109 participants (Analysis 4.2).
There was insufficient evidence from three studies, one at low (Dazzi 2003), and two at unclear risk of bias (Nemunaitis 1995; van der Lelie 2001), to determine whether or not GM‐CSF reduces the risk of severe oral mucositis: RR 0.74, 95% CI 0.33 to 1.67; 235 participants (Analysis 4.3).
Adults receiving radiotherapy to the head and neck
There was insufficient evidence, from one study at high risk of bias (McAleese 2006), to determine whether or not GM‐CSF reduces the risk of any level of oral mucositis (RR 1.01, 95% CI 0.82 to 1.23; 29 participants; Analysis 4.1), moderate to severe oral mucositis (RR 0.72, 95% CI 0.49 to 1.06; 29 participants; Analysis 4.2), or severe oral mucositis (RR 0.31, 95% CI 0.01 to 7.09; 29 participants; Analysis 4.3).
Adults receiving chemotherapy alone for mixed cancers
There was insufficient evidence from two studies, one at unclear (Cartee 1995), and one at high risk of bias (Chi 1995), to determine whether or not GM‐CSF reduces the risk of severe oral mucositis: RR 0.59, 95% CI 0.05 to 7.11; 65 participants (Analysis 4.3).
Oral pain
Adults receiving bone marrow/stem cell transplantation after conditioning therapy for mixed cancers
There was insufficient evidence, from one study at low risk of bias (Dazzi 2003), to determine whether or not GM‐CSF reduces the mean pain score on a 0 (no pain) to 10 (worst pain) scale: MD 0.60, 95% CI ‐0.85 to 2.05; 90 participants (Analysis 4.4).
Normalcy of diet
Adults receiving bone marrow/stem cell transplantation after conditioning therapy for haematological cancers
There was insufficient evidence, from one study at unclear risk of bias (van der Lelie 2001), to determine whether or not GM‐CSF reduces the risk of total parenteral nutrition: RR 1.10, 95% CI 0.63 to 1.91; 36 participants (Analysis 4.5).
Adults receiving radiotherapy to the head and neck
There was insufficient evidence, from one study at high risk of bias (McAleese 2006), to determine whether or not GM‐CSF reduces the risk of tube feeding: RR 0.31, 95% CI 0.01 to 7.09; 29 participants (Analysis 4.5).
Adverse events
This outcome was difficult to summarise due to poor and inconsistent reporting, and we did not meta‐analyse any data. However, there do not appear to be any serious concerns regarding adverse effects of GM‐CSF. We have tabulated relevant information in Additional Table 2.
| Study ID | Adverse events results |
| 2 participants (group allocation not reported) withdrew by day 3 due to intolerance to their mouthwash (dry mouth); 1 participant receiving GM‐CSF (1 µg/mL) had mouthwash withdrawn by day 3 due to possible allergic reaction (sensation of fullness in the posterior pharyngeal area) but resolved within 4 hours (the participant was withdrawn but appears to have been included in the analysis) | |
| "One patient had fever and chills, and two patients had general malaise and headache during GM‐CSF treatment. No patient had evidence of fluid retention after GM‐CSF" | |
| Not reported | |
| (Sucralfate given to both groups) "Only 2 of the 20 patients treated with GM‐CSF and sucralfate did not experience any side effects related to the drugs, but most side effects were mild (WHO Grade 1 or 2). The most common side effects were local skin reactions, fever, bone pain, and mild nausea...In the control group only 1 patient complained of nausea possibly related to the use of sucralfate, and another patient interrupted sucralfate treatment because of the same reason" | |
| "12 patients who received GM‐CSF had elevated white cell counts (WCC). The range of maximal WCC was 7.2–30.5 (median 19.7). All WCC had returned to normal within 3 weeks of completing injections (median 2 weeks). Three patients developed influenza‐like symptoms with the GM‐CSF and in one patient the injections were stopped because of this symptom. One patient developed an erythematous rash at his injection sites after completing his course of 14 injections (Figure 3). He had a past history of allergy to radiographic contrast medium" | |
|
| |
| (Comparator was sucralfate) "Both mouthwashes were well tolerated, and none of the patients reported any adverse effects related to the mouthwashes. Adverse effects commonly associated with subcutaneous GM‐CSF administration, such as nausea, vomiting, bone pain, headaches, and fever, were not observed" | |
| Not reported |
GM‐CSF = granulocyte‐macrophage colony‐stimulating factor.
Number of days of treatment with opioid analgesics
Adults receiving bone marrow/stem cell transplantation after conditioning therapy for mixed cancers
There was some evidence, from one study at low risk of bias (Dazzi 2003), that GM‐CSF might lead to a reduction in the mean number of days of treatment with opioid analgesics: MD ‐1.10, 95% CI ‐1.91 to ‐0.29; 90 participants (Analysis 4.6).
No studies assessed the outcomes 'interruptions to cancer treatment', 'quality of life', 'number of days in hospital' and 'number of days unable to take medicine orally'.
Granulocyte‐macrophage colony‐stimulating factor (GM‐CSF) dose comparison
There is some very weak evidence, from one study at unclear risk of bias and analysing 36 adults receiving mixed chemotherapy alone for breast cancer (Cartee 1995), that a higher dose of GM‐CSF (range 1260 µg to 12,600 µg) reduces the risk of severe oral mucositis when compared to a lower dose (range 12.6 µg to 126 µg): RR 2.75, 95% CI 1.07 to 7.04; 36 participants (Analysis 5.1).
Granulocyte‐macrophage colony‐stimulating factor (GM‐CSF) versus sucralfate
One study, at low risk of bias and analysing 40 adults receiving radiotherapy to the head and neck (Saarilahti 2002), compared GM‐CSF with sucralfate, both as a mouthwash. There was insufficient evidence to determine whether GM‐CSF or sucralfate perform better in reducing the risk of moderate to severe oral mucositis (RR 0.96, 95% CI 0.80 to 1.14; Analysis 6.1), severe oral mucositis (RR 0.54, 95% CI 0.24 to 1.21; Analysis 6.2), interruptions to cancer treatment (RR 0.13, 95% CI 0.01 to 2.36; Analysis 6.3), or percutaneous endoscopic gastrostomy (RR 0.18, 95% CI 0.01 to 3.56; Analysis 6.4).
Granulocyte‐colony stimulating factor (G‐CSF) versus placebo/no treatment
Oral mucositis
Adults receiving radiotherapy to the head and neck
There was insufficient evidence, from two studies at low risk of bias (Schneider 1999; Su 2006), to determine whether or not G‐CSF reduces the risk of any level of oral mucositis: RR 1.02, 95% CI 0.86 to 1.22; 54 participants (Analysis 7.1).
The same two studies showed weak evidence (due to a wide confidence interval and low sample size) of a reduction in the risk of severe oral mucositis in favour of G‐CSF: RR 0.37, 95% CI 0.15 to 0.87; 54 participants (Analysis 7.3).
Adults receiving chemotherapy alone for mixed cancers
One study on lung cancer, at unclear risk of bias (Crawford 1999), showed a reduction in the risk of any level of oral mucositis in favour of G‐CSF: RR 0.59, 95% CI 0.40 to 0.87; 195 participants (Analysis 7.1).
One study on breast cancer, at high risk of bias (Katano 1995), showed very weak evidence (due to risk of bias, very low sample size and a wide confidence interval) of a reduction in the risk of moderate to severe oral mucositis in favour of G‐CSF: RR 0.33, 95% CI 0.12 to 0.95; 14 participants (Analysis 7.2).
Adults receiving bone marrow/stem cell transplantation after conditioning therapy for haematological cancers
One study, at high risk of bias and analysing 121 participants (Linch 1993), did not provide any details of how oral mucositis was measured, so it is not clear what severity the information refers to. There were no numerical results reported, only the statement: "There was no difference in the frequency of stomatitis (defined as a sore, infected or ulcerated mouth, lips or pharynx), the incidence being between 29 and 33% in all groups" (Additional Table 3).
| Study ID | Population | Outcome | GM‐CSF | Placebo | Result |
| BMT/SCT after conditioning for haematological cancers | Oral mucositis: no scale described | No data | No data | "There was no difference in the frequency of stomatitis (defined as a sore, infected or ulcerated mouth, lips or pharynx), the incidence being between 29 and 33% in all groups" |
BMT = bone marrow transplantation; G‐CSF: granulocyte‐colony stimulating factor; SCT = stem cell transplantation.
Interruptions to cancer treatment
Adults receiving radiotherapy to the head and neck
There was insufficient evidence, from one study at low risk of bias (Su 2006), to determine whether or not G‐CSF reduces the risk of radiotherapy interruptions: RR 0.22, 95% CI 0.01 to 4.31; 40 participants (Analysis 7.4).
Normalcy of diet
Adults receiving radiotherapy to the head and neck
There was insufficient evidence, from one study at low risk of bias (Su 2006), to determine whether or not G‐CSF reduces the risk of percutaneous endoscopic gastrostomy: RR 0.16, 95% CI 0.01 to 2.86; 40 participants (Analysis 7.5).
Adverse events
This outcome was difficult to summarise due to poor and inconsistent reporting, and we did not meta‐analyse any data. However, there do not appear to be any serious concerns regarding adverse effects of G‐CSF. We have tabulated relevant information in Additional Table 4.
| Study ID | Adverse events results |
| "Both pegfilgrastim and filgrastim were well tolerated and no significant adverse effects were associated with their use" (G‐CSF versus G‐CSF) | |
| Approximately 20% of participants receiving G‐CSF experienced mild to moderate skeletal pain which was resolved by using oral analgesics; 6% of participants in both groups reported mild generalised rash/itching; 3 participants experienced an event thought to be G‐CSF‐related and which caused them to request withdrawal from the study: abdominal pain, diffuse aches and pains, and a flare‐up of pre‐existing eczema | |
| Not reported | |
| "There was no difference in the overall frequency of adverse clinical or laboratory events between the groups or in the frequency of adverse events thought by the clinicians to be possibly or probably due to study medication" | |
| Not reported | |
| "In general, toxicities typical of postoperative RT to the head and neck were observed. Additional toxicities attributable to G‐CSF and/or daily injections were as follows: elevated WBC requiring G‐CSF dose reduction by prospectively planned guidelines occurred in nine patients in the GCSF arm; grade 2–3 bone pain was observed in two patients in the G‐CSF arm; three patients refused injection (2 G‐CSF, 1 placebo)" |
G‐CSF = granulocyte‐colony stimulating factor.
No studies assessed the outcomes 'oral pain', 'quality of life', 'number of days in hospital', 'number of days of treatment with opioid analgesics' and 'number of days unable to take medicine orally'.
G‐CSF (pegfilgrastim) versus G‐CSF (filgrastim)
There was insufficient evidence, from one study at high risk of bias and analysing 61 children receiving bone marrow/stem cell transplantation after conditioning therapy for mixed cancers (Cesaro 2013), to determine whether pegfilgrastim or filgrastim perform better in reducing the risk of any level of oral mucositis (RR 1.02, 95% CI 0.82 to 1.27; Analysis 8.1), moderate to severe oral mucositis (RR 0.78, 95% CI 0.55 to 1.11; Analysis 8.2), or total parenteral nutrition (RR 1.00, 95% CI 0.94 to 1.06; Analysis 8.3).
Epidermal growth factor (EGF) versus placebo
Oral mucositis
Adults receiving bone marrow/stem cell transplantation after conditioning therapy for haematological cancers
There was insufficient evidence, from one study at low risk of bias and analysing 136 participants (Kim 2017), to determine whether or not EGF reduces the risk of moderate to severe oral mucositis (RR 1.06, 95% CI 0.78 to 1.43; Analysis 9.1), or severe oral mucositis (RR 1.03, 95% CI 0.59 to 1.80; Analysis 9.2).
Adults receiving radiotherapy to the head and neck with/without cisplatin
One study, at high risk of bias (Wu 2009), showed weak evidence (due to risk of bias and low sample size) of a reduction in the risk of moderate to severe oral mucositis in favour of EGF: RR 0.67, 95% CI 0.45 to 0.99; 103 participants (Analysis 9.1).
Interruptions to cancer treatment
Adults receiving radiotherapy to the head and neck with/without cisplatin
There was insufficient evidence, from one study at high risk of bias (Wu 2009), to determine whether or not EGF reduces the risk of having radiotherapy breaks longer than two days: RR 4.38, 95% CI 0.25 to 75.44; 113 participants (Analysis 9.3).
Normalcy of diet
Adults receiving bone marrow/stem cell transplantation after conditioning therapy for haematological cancers
There was insufficient evidence, from one study at low risk of bias (Kim 2017), to determine whether or not EGF reduces the risk of total parenteral nutrition: RR 1.03, 95% CI 0.55 to 1.94; 136 participants (Analysis 9.4).
Adverse events
There do not appear to be any serious concerns regarding adverse effects of EGF. We have tabulated relevant information in Additional Table 5.
| Study ID | Adverse events results |
| "Adverse events were similar in both groups (Table 3). The most common adverse event in the rhEGF group was nausea (n = 7, 10.4%). The incidence of other adverse events including oral pain, dry mouth, and taste alteration was low. All the adverse events were mild and transient. No grade 3 or 4 adverse events were noted during the study period" (there were no differences between groups in any adverse event) | |
| "The frequency of minor and serious adverse events was similar in all groups. Most adverse events were related to primary disease status and treatment modalities" |
EGF = epidermal growth factor.
No studies assessed the outcomes 'oral pain', 'quality of life', 'number of days in hospital', 'number of days of treatment with opioid analgesics' and 'number of days unable to take medicine orally'.
Intestinal trefoil factor (ITF) versus placebo
Oral mucositis
Adults receiving chemotherapy alone for colorectal cancer
One study, at unclear risk of bias and analysing 99 participants (Peterson 2009), showed weak evidence (due to low sample size) of a reduction in the risk of any level of oral mucositis (RR 0.52, 95% CI 0.35 to 0.79; Analysis 10.1), and moderate to severe oral mucositis (RR 0.22, 95% CI 0.10 to 0.48; Analysis 10.2), both in favour of ITF.
There was insufficient evidence, from the same study, to determine whether or not EGF reduces the risk of severe oral mucositis: RR 1.52, 95% CI 0.06 to 36.39 (Analysis 10.3).
Adverse events
There do not appear to be any serious concerns regarding adverse effects of ITF. We have tabulated relevant information in Additional Table 6.
| Study ID | Adverse events results |
| "Only a minority of patients (six [6.1%] of 99 patients) reported mild to moderate treatment‐emergent adverse events on the study. The symptoms included abdominal pain, diarrhea, oral pain, headache, and hypertension (Table 2). Of these, four were considered related to study drug: one (3%) was in the placebo group, two (6%) were in the low‐dose rhITF group, and one (3%) was in the high‐dose rhITF group. The events were isolated and resolved spontaneously without sequelae" |
ITF = intestinal trefoil factor.
No studies assessed the outcomes 'interruptions to cancer treatment', 'oral pain', 'quality of life', 'normalcy of diet', 'number of days in hospital', 'number of days of treatment with opioid analgesics' and 'number of days unable to take medicine orally'.
Intestinal trefoil factor (ITF) dose comparison
There was insufficient evidence, from one study at unclear risk of bias and analysing 66 adults receiving chemotherapy alone for colorectal cancer (Peterson 2009), to determine whether a lower dose (336 mg) or a higher dose (2688 mg) perform better in reducing the risk of oral mucositis of any severity (Analysis 11.1; Analysis 11.2; Analysis 11.3).
Erythropoietin versus placebo
Oral mucositis
Adults receiving bone marrow/stem cell transplantation after conditioning therapy for haematological cancers
One study, at low risk of bias and analysing 80 participants (Hosseinjani 2017), showed weak evidence (due to low sample size) of a reduction in the risk of any level of oral mucositis (RR 0.35, 95% CI 0.21 to 0.60; Analysis 12.1), and moderate to severe oral mucositis (RR 0.43, 95% CI 0.24 to 0.79; Analysis 12.2), both in favour of erythropoietin.
The same study showed weak evidence (due to low sample size and a wide confidence interval) that erythropoietin might reduce the risk of severe oral mucositis, but there is also some possibility of an increase in risk: RR 0.40, 95% CI 0.14 to 1.17 (Analysis 12.3).
Number of days in hospital
Adults receiving bone marrow/stem cell transplantation after conditioning therapy for haematological cancers
There was insufficient evidence, from one study at low risk of bias (Hosseinjani 2017), to determine whether or not erythropoietin reduces the mean number of days in hospital: MD ‐2.95, 95% CI ‐7.73 to 1.83; 80 participants (Analysis 12.4).
No studies assessed the outcomes 'interruptions to cancer treatment', 'oral pain', 'quality of life', 'normalcy of diet', 'adverse events', 'number of days of treatment with opioid analgesics' and 'number of days unable to take medicine orally'.
Transforming growth factor (TGF) versus placebo
Oral mucositis
Adults receiving chemotherapy alone for colorectal cancer
There was insufficient evidence, from one study at high risk of bias and analysing 13 participants (Antoun 2009), to determine whether or not TGF reduces the risk of any level of oral mucositis: RR 0.10, 95% CI 0.01 to 1.71 (Additional Table 7).
| Study ID | Population | Outcome | TGF‐beta(2) | Placebo | Result |
| CT alone for colorectal cancer | Oral mucositis (WHO 0 to 4 scale): any oral mucositis | 0/9 | 2/4 | RR 0.10 (95% CI 0.01 to 1.71); P = 0.11 |
CI = confidence interval; CT = chemotherapy; RR = risk ratio; TGF = transforming growth factor; WHO = World Health Organization.
No studies assessed the outcomes 'interruptions to cancer treatment', 'oral pain', 'quality of life', 'normalcy of diet', 'adverse events', 'number of days in hospital', 'number of days of treatment with opioid analgesics' and 'number of days unable to take medicine orally'.
Discusión
Resumen de los resultados principales
Treinta y cinco estudios cumplieron con los criterios de elegibilidad y se incluyeron en esta revisión. Se utilizó la metodología GRADE para evaluar la calidad del grupo de evidencia para cada una de las comparaciones principales y para el resultado primario de incidencia y gravedad de la mucositis oral (GRADE 2004). La mayoría de la evidencia encontrada fue sobre el factor de crecimiento de queratinocitos (FCQ: Resumen de los hallazgos para la comparación principal), el factor estimulante de colonias de granulocitos‐macrófagos (FEC‐GM: Resumen de los hallazgos 2), y el factor estimulante de colonias de granulocitos (FEC‐G: Resumen de los hallazgos 3).
Los principales hallazgos fueron los siguientes.
Factor de crecimiento de queratinocitos (FCQ)
Mucositis oral moderada a grave
-
Pacientes adultos sometidos a trasplante de médula ósea/células madres después del tratamiento de acondicionamiento para el cáncer hematológico: podría haber una reducción en el riesgo (11% y una variación del 20% al 1%).
-
Pacientes adultos sometidos a radioterapia de cabeza y cuello con cisplatino/fluorouracilo (5FU): probablemente una reducción en el riesgo (9% y con una variación del 17% a ninguna reducción).
-
Pacientes adultos sometidos a quimioterapia sola para cánceres mixtos: probablemente una reducción en el riesgo (44% y con una variación del 55% al 30%).
Mucositis oral grave
-
Pacientes adultos sometidos a trasplante de médula ósea/células madres después del tratamiento de acondicionamiento para el cáncer hematológico: podría haber una reducción en el riesgo, pero alguna posibilidad de un aumento del riesgo (reducción del 15% y con una variación de una reducción del 35% a un aumento del 11%).
-
Pacientes adultos sometidos a radioterapia de cabeza y cuello con cisplatino/fluorouracilo (5FU): muy probablemente una reducción en el riesgo (21% y con una variación del 31% al 10%).
-
Pacientes adultos sometidos a quimioterapia sola para cánceres mixtos: podría haber una reducción en el riesgo (60% y una variación del 86% al 35%).
Factor estimulante de colonias de granulocitos macrófagos (FEC‐GM)
Mucositis oral moderada a grave
-
Pacientes adultos sometidos a trasplante de médula ósea/células madres después del tratamiento de acondicionamiento para el cáncer hematológico: evidencia insuficiente de un efecto beneficioso.
-
Pacientes adultos sometidos a radioterapia de cabeza y cuello: evidencia insuficiente de un efecto beneficioso.
Mucositis oral grave
-
Pacientes adultos sometidos a trasplante de médula ósea/células madres después del tratamiento de acondicionamiento para cánceres mixtos: evidencia insuficiente de un efecto beneficioso.
-
Pacientes adultos sometidos a radioterapia de cabeza y cuello: evidencia insuficiente de un efecto beneficioso.
-
Pacientes adultos sometidos a quimioterapia sola para cánceres mixtos: evidencia insuficiente de un efecto beneficioso.
Factor estimulante de colonias de granulocitos (FEC‐G)
Mucositis oral moderada a grave
-
Pacientes adultos sometidos a quimioterapia sola para el cáncer de mama: evidencia muy débil de una posible reducción del riesgo (67% y con una variación del 88% al 5%).
Mucositis oral grave
-
Pacientes adultos sometidos a radioterapia de cabeza y cuello: evidencia débil de una posible reducción del riesgo (63% y con una variación del 85% al 13%).
La evidencia restante para el resultado primario provino de las comparaciones de un estudio único.
-
El factor de crecimiento epidérmico podría reducir el riesgo de mucositis oral moderada a grave en los pacientes adultos sometidos a radioterapia de cabeza y cuello con o sin cisplatino, pero no hubo evidencia suficiente de una reducción en el riesgo de mucositis oral moderada a grave, ni grave, en pacientes adultos sometidos a trasplante de médula ósea/células madres después del tratamiento de acondicionamiento para el cáncer hematológico.
-
El factor trefoil intestinal podría reducir el riesgo de mucositis oral moderada a grave en los pacientes adultos sometidos a quimioterapia sola para el cáncer colorrectal.
-
La eritropoyetina podría reducir el riesgo de mucositis oral moderada a grave en los pacientes adultos sometidos a trasplante de médula ósea/células madres después del tratamiento de acondicionamiento para el cáncer hematológico.
Por lo general no hubo evidencia suficiente de un efecto beneficioso con respecto a los resultados secundarios de esta revisión. Todas las intervenciones investigadas parecen ser relativamente seguras; solamente se informaron efectos adversos leves a moderados.
Compleción y aplicabilidad general de las pruebas
La evidencia presentada en la presente revisión permite establecer algunas conclusiones con respecto a los efectos del FCQ para prevenir la mucositis oral en pacientes adultos sometidos a ciertos tipos de tratamiento para el cáncer. Sin embargo, falta evidencia con respecto a otras citoquinas y factores de crecimiento, y en los niños. Desafortunadamente los dos estudios que se encontraron sobre FCQ versus placebo en niños fueron poco claros en cuanto a su informe y no fue posible presentar datos. Todos los estudios informaron el resultado primario de esta revisión, pero falta evidencia de los resultados secundarios.
La evidencia del FCQ debe tener una validez externa razonable, ya que se incluyó la mayor parte de la población adulta en cuanto a los tipos de tratamiento que los pacientes reciben para diferentes tipos de cáncer. Los estudios también se realizaron en todo el mundo y a menudo incluyeron múltiples sitios. Sin embargo, una limitación puede ser el hecho de que la mayoría de los estudios se realizaron en países de ingresos medios y altos, por lo que pueden ser menos generalizables a los pacientes de países de ingresos bajos.
Numerosos estudios informaron algunos de los resultados secundarios, pero no informaron los datos en un formato apropiado para la inclusión en los metanálisis, p.ej. como mediana con o sin rango, el área bajo la curva, o como media (o un gráfico) pero sin la desviación estándar/el error estándar/el valor de p. En esos casos, el metanálisis está sesgado debido a la pérdida de información. Sin embargo, la herramienta Cochrane para el riesgo de sesgo y los metanálisis actualmente no abordan este tema de manera adecuada. El estudio se puede considerar con alto riesgo de informe selectivo de los resultados, pero si el estudio no se incluye en el metanálisis debido a que no presenta datos, entonces no se refleja ni se toma en cuenta. Lo anterior destaca la necesidad de la estandarización en cuanto a "qué medir" y "cómo medirlo" en los ensayos clínicos en esta área de investigación. De otro modo continuarán los estudios de investigación baldíos, con datos que no es posible agrupar en las síntesis de datos. Hay iniciativas como COMET (en inglés, Core Outcome Measures in Effectiveness Trials) y COSMIN (en inglés, COnsensus‐based Standards for the selection of health Measurement INstruments) que pueden ayudar en estos temas y los estudios de investigación futuros en estas áreas serían beneficiosos.
Durante el proceso de revisión sistemática aparecieron inquietudes adicionales con respecto a la utilidad de los resultados secundarios porque no estaba claro si se debieron a la mucositis oral. La hospitalización, la administración de suplementos nutricionales o de analgésicos opiáceos y las interrupciones del tratamiento del cáncer de pueden haber debido a motivos diferentes de la mucositis oral. Además, no siempre estuvo claro si los efectos adversos se debieron a las intervenciones administradas para prevenir la mucositis oral. Estos aspectos se podrían mejorar mediante un informe más claro y explícito.
El costo es un tema que no se consideró en esta revisión, pero que puede afectar al hecho de si la evidencia se puede o no aplicar en algunos contextos. Si se toma el FCQ como ejemplo, el costo por dosis es alto pero actualmente no hay evaluaciones económicas sanitarias de alta calidad, lo que hace difícil poder tomar decisiones.
Calidad de la evidencia
Se incluyeron 35 ensayos controlados aleatorios (ECA) que analizaron 3102 participantes. A pesar de este volumen grande de estudios de investigación, no fue posible establecer conclusiones consistentes acerca de los efectos de la mayoría de las citoquinas y factores de crecimiento. El grupo de evidencia más fuerte, en cuanto al volumen y la calidad, estuvo en las diferentes poblaciones que recibieron FCQ. La evidencia del FCQ para la prevención de la mucositis oral grave en pacientes adultos sometidos a radioterapia de cabeza y cuello con o sin cisplatino o fluorouracilo se consideró de alta calidad. En la misma población, la calidad de la evidencia para la prevención de la mucositis oral moderada a grave se disminuyó en un nivel debido a la inconsistencia en los resultados de los estudios individuales (heterogeneidad), lo que dio lugar a evidencia de calidad moderada. En los pacientes adultos sometidos a quimioterapia sola para cánceres mixtos, la calidad de la evidencia del FCQ para la prevención de la mucositis oral moderada a grave se disminuyó en un nivel debido al sesgo de publicación, ya que se encontró un estudio no publicado que se incluiría en el metanálisis, lo que dio lugar a evidencia de calidad moderada (NCT00393822). En la misma población, la calidad de la evidencia para la prevención de la mucositis oral grave se disminuyó en dos niveles: uno por sesgo de publicación y uno por imprecisión debido al tamaño pequeño de la muestra, las bajas tasas de eventos y un intervalo de confianza amplio. Esto resultó en evidencia de baja calidad. En los pacientes adultos sometidos a trasplante de médula ósea/células madres después del tratamiento de acondicionamiento para los cánceres hematológicos, la evidencia del FCQ para prevenir la mucositis oral moderada a grave y grave se consideró de baja calidad. La calidad de la evidencia se disminuyó en dos niveles: uno por heterogeneidad y uno por sesgo de publicación, ya que hubo dos estudios para los cuales no fue posible encontrar los informes completos publicados (NCT02313792; Spielberger 2001). No hubo inquietudes sobre el riesgo de sesgo en los estudios de FCQ porque suelen ser ensayos multicéntricos grandes que se realizan de manera adecuada y en su mayoría utilizan placebo para el cegamiento y el desgaste es muy bajo.
La evidencia del FEC‐GM y el FEC‐G fue más débil, por lo que se consideró de calidad baja o muy baja. Los motivos para esta disminución se debieron principalmente a la imprecisión porque el volumen de la evidencia fue mucho menor y los estudios a menudo reclutaron pocos participantes, lo que dio lugar a intervalos de confianza muy amplios que con frecuencia incluyeron la posibilidad de una disminución o un aumento del riesgo. Los motivos adicionales fueron el riesgo de sesgo de realización debido a la falta de cegamiento en algunos de estos estudios, la inconsistencia, y también porque parte de la evidencia provino de estudios únicos. Cuando un grupo de evidencia provino de un estudio único, la calidad se disminuyó automáticamente en un nivel. El razonamiento detrás de lo anterior es que a menudo, cuando se utiliza la metodología GRADE, la calidad del grupo de evidencia se disminuye por inconsistencia debido a las diferentes estimaciones del efecto en los estudios individuales. Esta inconsistencia no es posible en un grupo de evidencia de estudios únicos, por lo que si no se disminuye la calidad se exageraría falsamente su calificación, aunque al mismo tiempo, en comparación, al grupo de evidencia más grande se le penaliza injustamente debido a que tiene más estudios. En tales casos, la calidad de la evidencia de un estudio único se disminuyó debido a la indireccionalidad porque solamente puede ser generalizable a la población particular que participó en el estudio.
La evidencia restante para otras intervenciones provino de las comparaciones de estudios únicos, por lo que todas se consideraron de calidad baja a muy baja, principalmente por indireccionalidad (como se describe anteriormente) e imprecisión.
Sesgos potenciales en el proceso de revisión
Aunque la metodología de la revisión sistemática está diseñada para disminuir los sesgos en el proceso, a menudo se toman decisiones por necesidad o por motivos prácticos, lo que puede introducir algún posible sesgo.
Una vez que se comenzó a evaluar la bibliografía identificada mediante las búsquedas, surgieron preocupaciones acerca de que se podrían haber perdido algunos estudios relevantes porque no se habían incluido términos de búsqueda para otras afecciones para las cuales se han administrado citoquinas y factores de crecimiento (p.ej. diarrea, enfermedad de injerto versus huésped y neutropenia). Para evaluar el alcance de este posible problema, se realizó una búsqueda de amplio alcance que incluyó los términos de búsqueda. La producción fue muy abundante y un único autor de la revisión evaluó una muestra de 500 registros, pero no se identificaron estudios adicionales. Por lo tanto, se decidió no modificar la búsqueda al agregar los nuevos términos de búsqueda. Se reconoce la posibilidad de que se hayan perdido algunos estudios que han medido e informado la mucositis oral, pero no lo mencionan en el resumen. Esto podría introducir un sesgo si faltan datos relevantes de la revisión.
Hubo algunos estudios que tuvieron múltiples brazos de tratamiento con diferentes dosis de citoquinas o factores de crecimiento. En todos los casos los brazos se combinaron para hacer una comparación por pares contra el brazo control, por lo que se perdieron algunas posibles sutilezas de los datos, lo que posiblemente influyó en los resultados.
Acuerdos y desacuerdos con otros estudios o revisiones
El Mucositis Study Group (MSG) de la Multinational Association of Supportive Care in Cancer/International Society of Oral Oncology (MASCC/ISOO) es el grupo internacional líder en esta área de investigación. En 2013 se publicó una serie de revisiones sistemáticas sobre las diferentes intervenciones para el control de la mucositis oral, que incluyó una sobre las citoquinas y los factores de crecimiento (Raber‐Durlacher 2013). Estas revisiones se incluyen en las MASCC/ISOO Clinical Practice Guidelines for the Management of Mucositis Secondary to Cancer Therapy (Lalla 2014). La revisión sistemática MASCC/ISOO no está limitada a ECA. La guía actual de este grupo es la siguiente.
-
Recomendaciones a favor de una intervención (es decir, pruebas sólidas que apoyen la efectividad): el panel recomienda que el factor de crecimiento de queratinocitos humanos recombinante 1 (FCQ‐1/palifermin) se utilice para prevenir la mucositis oral (a una dosis de 60 µg/kg por día durante tres días antes del tratamiento de acondicionamiento y durante tres días después del trasplante) en los pacientes sometidos a quimioterapia a dosis alta e irradiación corporal total, seguido de trasplante autólogo de células madre, para una neoplasia maligna hematológica (evidencia de nivel II).
-
Indicaciones contra una intervención (es decir, evidencia más débil que indica falta de efectividad): el panel indica que no se utilice el colutorio de factor estimulante de colonias de granulocitos‐macrófagos para prevenir la mucositis oral en los pacientes sometidos a quimioterapia a dosis alta, para el trasplante autólogo o alogénico de células madre (evidencia de nivel II).
En los metanálisis del FCQ en la población anteriormente mencionada, se combinaron los estudios de todos los tipos de FCQ, con trasplantes autólogos y alogénicos y con irradiación corporal total (ICT), sin ICT o una mezcla de ICT/sin ICT. La revisión sistemática MASCC/ISOO separó todos estos factores. Sin embargo, al examinar los estudios individuales en los metanálisis, la primera recomendación parece ser válida. Además, la revisión sistemática MASCC/ISOO señala "La evidencia sobre la eficacia de palifermin en el TCMH autólogo sin acondicionamiento de ICT es contradictoria... y estos estudios muy pequeños no permiten elaborar una guía. Además, no es posible proporcionar una guía para la administración de palifermin en el contexto del TCMH alogénico con o sin ICT". A pesar de que los metanálisis incluyeron algunos ECA adicionales no incluidos en la otra revisión, estas afirmaciones también parecen ser válidas.
La indicación contra el colutorio de FEC‐GM también es válida; aunque no se separaron los estudios según la forma de administración, está claro que los dos estudios de colutorios en los análisis (Análisis 4.3) tienen resultados contradictorios. Sin embargo, según un estudio sobre FEC‐GM administrado por vía intravenosa en esta población (Nemunaitis 1995), hay evidencia alentadora de un efecto beneficioso, pero la revisión sistemática MASCC/ISOO consideró esta evidencia junto con otros estudios que no se incluyeron y establecieron la conclusión de que no había una guía posible.
Los resultados no coinciden con las siguientes afirmaciones de la revisión sistemática MASCC/ISOO con respecto a otras poblaciones que reciben FCQ.
-
No fue posible proporcionar una guía para la administración de palifermin en el contexto de la QT para los tumores sólidos y hematológicos ... debido a que la evidencia no es suficiente".
-
"Además, no fue posible proporcionar una guía para la administración de palifermin en RTC&C debido a que la evidencia no es suficiente".
Se presentó alguna evidencia de calidad moderada a alta de un efecto beneficioso del FCQ en estas poblaciones, lo que posiblemente justifica las afirmaciones de las guías nuevas en la próxima actualización. Esta evidencia se equipararía a la evidencia de nivel I en el sistema de calificación utilizado en las guías (evidencia obtenida de metanálisis de múltiples estudios controlados bien diseñados)". En otra revisión Cochrane sobre la prevención de la disfunción de la glándula salival en los pacientes sometidos a radioterapia de cabeza y cuello, con o sin quimioterapia, el FCQ no pareció tener un efecto perjudicial sobre la supervivencia general ni la supervivencia sin progresión (Riley 2017).
Study flow diagram.
RCT = randomised controlled trial.
Risk of bias summary: review authors' judgements about each risk of bias item for each included study.

Comparison 1 KGF versus placebo, Outcome 1 Oral mucositis (any).

Comparison 1 KGF versus placebo, Outcome 2 Oral mucositis (moderate + severe).

Comparison 1 KGF versus placebo, Outcome 3 Oral mucositis (severe).

Comparison 1 KGF versus placebo, Outcome 4 Interruptions to cancer treatment (unscheduled RT breaks of 5 or more days).

Comparison 1 KGF versus placebo, Outcome 5 Interruptions to cancer treatment (chemotherapy delays/discontinuations).

Comparison 1 KGF versus placebo, Outcome 6 Oral pain.

Comparison 1 KGF versus placebo, Outcome 7 Normalcy of diet (use of supplemental nutrition).

Comparison 1 KGF versus placebo, Outcome 8 Normalcy of diet (worst ability to eat score ‐ 1 to 4 scale).

Comparison 1 KGF versus placebo, Outcome 9 Number of days in hospital.

Comparison 1 KGF versus placebo, Outcome 10 Number of days of treatment with opioid analgesics.

Comparison 2 KGF (dose comparison), Outcome 1 Oral mucositis (any).

Comparison 2 KGF (dose comparison), Outcome 2 Oral mucositis (moderate + severe).

Comparison 2 KGF (dose comparison), Outcome 3 Oral mucositis (severe).

Comparison 2 KGF (dose comparison), Outcome 4 Oral pain (maximum score on 0 to 10 VAS).

Comparison 2 KGF (dose comparison), Outcome 5 Normalcy of diet (use of TPN).

Comparison 2 KGF (dose comparison), Outcome 6 Normalcy of diet (worst ability to eat score ‐ 1 to 4 scale).

Comparison 2 KGF (dose comparison), Outcome 7 Number of days in hospital.

Comparison 2 KGF (dose comparison), Outcome 8 Number of days of treatment with opioid analgesics.

Comparison 3 KGF versus chlorhexidine, Outcome 1 Oral mucositis (any).

Comparison 3 KGF versus chlorhexidine, Outcome 2 Oral mucositis (moderate + severe).

Comparison 3 KGF versus chlorhexidine, Outcome 3 Oral mucositis (severe).

Comparison 4 GM‐CSF versus placebo/no treatment, Outcome 1 Oral mucositis (any).

Comparison 4 GM‐CSF versus placebo/no treatment, Outcome 2 Oral mucositis (moderate + severe).

Comparison 4 GM‐CSF versus placebo/no treatment, Outcome 3 Oral mucositis (severe).

Comparison 4 GM‐CSF versus placebo/no treatment, Outcome 4 Oral pain (maximum score on 0 to 10 VAS).

Comparison 4 GM‐CSF versus placebo/no treatment, Outcome 5 Normalcy of diet (use of feeding tube/parenteral nutrition).

Comparison 4 GM‐CSF versus placebo/no treatment, Outcome 6 Number of days of treatment with opioid analgesics.

Comparison 5 GM‐CSF (dose comparison), Outcome 1 Oral mucositis (severe).

Comparison 6 GM‐CSF versus sucralfate, Outcome 1 Oral mucositis (moderate + severe).

Comparison 6 GM‐CSF versus sucralfate, Outcome 2 Oral mucositis (severe).

Comparison 6 GM‐CSF versus sucralfate, Outcome 3 Interruptions to cancer treatment.

Comparison 6 GM‐CSF versus sucralfate, Outcome 4 Normalcy of diet (use of PEG tube).

Comparison 7 G‐CSF versus placebo/no treatment, Outcome 1 Oral mucositis (any).

Comparison 7 G‐CSF versus placebo/no treatment, Outcome 2 Oral mucositis (moderate + severe).

Comparison 7 G‐CSF versus placebo/no treatment, Outcome 3 Oral mucositis (severe).

Comparison 7 G‐CSF versus placebo/no treatment, Outcome 4 Interruptions to cancer treatment (RT interruption).

Comparison 7 G‐CSF versus placebo/no treatment, Outcome 5 Normalcy of diet (use of PEG tube).

Comparison 8 G‐CSF (pegfilgrastim) versus G‐CSF (filgrastim), Outcome 1 Oral mucositis (any).

Comparison 8 G‐CSF (pegfilgrastim) versus G‐CSF (filgrastim), Outcome 2 Oral mucositis (moderate + severe).

Comparison 8 G‐CSF (pegfilgrastim) versus G‐CSF (filgrastim), Outcome 3 Normalcy of diet (use of supplemental nutrition).

Comparison 9 EGF versus placebo, Outcome 1 Oral mucositis (moderate + severe).

Comparison 9 EGF versus placebo, Outcome 2 Oral mucositis (severe).

Comparison 9 EGF versus placebo, Outcome 3 Interruptions to cancer treatment (RT breaks > 2 consecutive days).

Comparison 9 EGF versus placebo, Outcome 4 Normalcy of diet (use of supplemental nutrition).

Comparison 10 ITF versus placebo, Outcome 1 Oral mucositis (any).

Comparison 10 ITF versus placebo, Outcome 2 Oral mucositis (moderate + severe).

Comparison 10 ITF versus placebo, Outcome 3 Oral mucositis (severe).

Comparison 11 ITF (dose comparison), Outcome 1 Oral mucositis (any).

Comparison 11 ITF (dose comparison), Outcome 2 Oral mucositis (moderate + severe).

Comparison 11 ITF (dose comparison), Outcome 3 Oral mucositis (severe).

Comparison 12 Erythropoietin versus placebo, Outcome 1 Oral mucositis (any).

Comparison 12 Erythropoietin versus placebo, Outcome 2 Oral mucositis (moderate + severe).

Comparison 12 Erythropoietin versus placebo, Outcome 3 Oral mucositis (severe).

Comparison 12 Erythropoietin versus placebo, Outcome 4 Number of days in hospital.
| KGF compared to placebo for preventing oral mucositis in adults with cancer receiving treatment | ||||||
| Patient or population: adults** receiving treatment for cancer (see subgroup for treatment type) | ||||||
| Outcomes | Anticipated absolute effects* (95% CI) | Relative effect | Number of participants | Quality of the evidence | Comments | |
| Risk with placebo | Risk with KGF | |||||
| Oral mucositis (moderate + severe) | BMT/SCT after conditioning for haematological cancers | RR 0.89 | 852 | ⊕⊕⊝⊝ | There might be a benefit for KGF in this population NNTB = 11 (95% CI 6 to 112) | |
| 848 per 1000 | 755 per 1000 | |||||
| RT to head and neck with cisplatin/5FU | RR 0.91 | 471 | ⊕⊕⊕⊝ | There is probably a benefit for KGF in this population NNTB = 12 (95% CI 7 to ∞) | ||
| 932 per 1000 | 848 per 1000 | |||||
| CT alone for mixed cancers | RR 0.56 | 344 | ⊕⊕⊕⊝ | It is likely that there is a benefit for KGF in this population NNTB = 4 (95% CI 3 to 6) | ||
| 631 per 1000 | 353 per 1000 | |||||
| Oral mucositis (severe) | BMT/SCT after conditioning for haematological cancers | RR 0.85 | 852 | ⊕⊕⊝⊝ | There might be a benefit for KGF in this population, but there is also some possibility of an increase in risk NNTB = 10 (95% CI 5 NNTB to 14 NNTH) | |
| 677 per 1000 | 575 per 1000 | |||||
| RT to head and neck with cisplatin/5FU | RR 0.79 | 471 | ⊕⊕⊕⊕ | It is very likely that there is a benefit for KGF in this population NNTB = 7 (95% CI 5 to 15) | ||
| 700 per 1000 | 553 per 1000 | |||||
| CT alone for mixed cancers | RR 0.30 | 263 | ⊕⊕⊝⊝ | There might be a benefit for KGF in this population NNTB = 10 (95% CI 8 to 19) | ||
| 154 per 1000 | 46 per 1000 | |||||
| Adverse events | Adverse events that were attributed to the study drugs rather than the cancer therapy were typically oral‐related or skin‐related. Events were mostly mild to moderate with very few incidences of serious events. However, reporting was poor and inconsistent, meaning that it was not appropriate to meta‐analyse data | |||||
| *The risk in the intervention group (and its 95% confidence interval) is based on the assumed risk in the comparison group and the relative effect of the intervention (and its 95% CI). ***The number of people that would need to receive KGF in order to prevent 1 additional person from developing the outcome. Calculated as 1 divided by the absolute risk reduction (which is the control arm event rate minus the experimental arm event rate). NNTH means the number of people that would need to receive KGF to cause 1 additional person to develop the outcome. All decimal places have been rounded up to the nearest whole number (i.e. 6.1 = 7). | ||||||
| GRADE Working Group grades of evidence | ||||||
| 1Downgraded by 1 level for inconsistency (substantial heterogeneity: I2 = 50% to 90%, P < 0.1); downgraded 1 further level for publication bias as there are 2 references in Studies awaiting classification that would be included in the conditioning/transplant subgroup, but the data are not available (NCT02313792; Spielberger 2001). | ||||||
| GM‐CSF compared to placebo/no treatment for preventing oral mucositis in adults with cancer receiving treatment | ||||||
| Patient or population: adults** receiving treatment for cancer (see subgroup for treatment type) | ||||||
| Outcomes | Anticipated absolute effects* (95% CI) | Relative effect | Number of participants | Quality of the evidence | Comments | |
| Risk with placebo/no treatment | Risk with GM‐CSF | |||||
| Oral mucositis (moderate + severe) | BMT/SCT after conditioning for haematological cancers | RR 0.94 | 109 | ⊕⊝⊝⊝ | There is insufficient evidence to determine a benefit for GM‐CSF in this population NNTB = 20 (95% CI 6 NNTB to 10 NNTH) | |
| 839 per 1000 | 789 per 1000 | |||||
| RT to head and neck | RR 0.72 | 29 | ⊕⊝⊝⊝ | There is insufficient evidence to determine a benefit for GM‐CSF in this population NNTB = 4 (95% CI 3 NNTB to 14 NNTH) | ||
| 929 per 1000 | 669 per 1000 | |||||
| Oral mucositis (severe) | BMT/SCT after conditioning for mixed cancers | RR 0.74 | 235 | ⊕⊕⊝⊝ | There is insufficient evidence to determine a benefit for GM‐CSF in this population NNTB = 12 (95% CI 5 NNTB to 5 NNTH) | |
| 347 per 1000 | 257 per 1000 | |||||
| RT to head and neck | RR 0.31 | 29 | ⊕⊝⊝⊝ | There is insufficient evidence to determine a benefit for GM‐CSF in this population NNTB = 21 (95% CI 15 NNTB to 3 NNTH) | ||
| 71 per 1000 | 22 per 1000 | |||||
| CT alone for mixed cancers | RR 0.59 | 65 | ⊕⊝⊝⊝ | There is insufficient evidence to determine a benefit for GM‐CSF in this population NNTB = 5 (95% CI 3 NNTB to 2 NNTH) | ||
| 500 per 1000 | 295 per 1000 | |||||
| Adverse events | Adverse events that were attributed to the study drugs rather than the cancer therapy were typically bone pain, nausea, fever and headache. Events were not reported as being serious. Some studies did not report adverse events and 1 even reported that there were none. However, reporting was poor and inconsistent, meaning that it was not appropriate to meta‐analyse data | |||||
| *The risk in the intervention group (and its 95% confidence interval) is based on the assumed risk in the comparison group and the relative effect of the intervention (and its 95% CI). ***The number of people that would need to receive GM‐CSF in order to prevent 1 additional person from developing the outcome. Calculated as 1 divided by the absolute risk reduction (which is the control arm event rate minus the experimental arm event rate). NNTH means the number of people that would need to receive GM‐CSF to cause 1 additional person to develop the outcome. All decimal places have been rounded up to the nearest whole number (i.e. 6.1 = 7). | ||||||
| GRADE Working Group grades of evidence | ||||||
| 1Downgraded by 2 levels for imprecision (single study with a small sample size and the confidence interval includes a possible increase in risk that is of a similar magnitude to the possible reduction in risk); downgraded 1 further level for indirectness (single study so not widely generalisable). | ||||||
| G‐CSF compared to placebo/no treatment for preventing oral mucositis in patients with cancer receiving treatment | ||||||
| Patient or population: adults** receiving treatment for cancer (see subgroup for treatment type) | ||||||
| Outcomes | Anticipated absolute effects* (95% CI) | Relative effect | Number of participants | Quality of the evidence | Comments | |
| Risk with placebo/no treatment | Risk with G‐CSF | |||||
| Oral mucositis (moderate + severe) | CT alone for breast cancer | RR 0.33 | 14 | ⊕⊝⊝⊝ | There is very weak evidence that there might be a benefit for G‐CSF in this population NNTB = 2 (95% CI 2 to 20) | |
| 1000 per 1000 | 330 per 1000 | |||||
| Oral mucositis (severe) | RT to head and neck | RR 0.37 | 54 | ⊕⊕⊝⊝ | There is weak evidence that there might be a benefit for G‐CSF in this population NNTB = 3 (95% CI 3 to 15) | |
| 519 per 1000 | 192 per 1000 | |||||
| Adverse events | There was limited evidence of adverse events for G‐CSF. 2 of the 6 studies did not report adverse events. There were low rates of mild to moderate events, the most common of which appeared to be bone pain. However, reporting was poor and inconsistent, meaning that it was not appropriate to meta‐analyse data | |||||
| *The risk in the intervention group (and its 95% confidence interval) is based on the assumed risk in the comparison group and the relative effect of the intervention (and its 95% CI). ***The number of people that would need to receive G‐CSF in order to prevent 1 additional person from developing the outcome. Calculated as 1 divided by the absolute risk reduction (which is the control arm event rate minus the experimental arm event rate). NNTH means the number of people that would need to receive G‐CSF to cause 1 additional person to develop the outcome. All decimal places have been rounded up to the nearest whole number (i.e. 6.1 = 7). | ||||||
| GRADE Working Group grades of evidence | ||||||
| 1Downgraded by 2 levels for imprecision (wide confidence interval and very small sample size); downgraded by 1 further level for high risk of performance bias; downgraded by 1 further level for indirectness (single study so not widely generalisable). | ||||||
| Study ID | Adverse events results |
|
| |
|
| |
| Insufficient evidence of a difference in infection or Grade 3 to 4 (NCI‐CTC 0 to 4 toxicity scale) skin rash/desquamation | |
| The study authors state that most adverse events were considered to be caused by the cancer treatment or the underlying cancer itself and not related to study treatment. 2 participants in the palifermin group had serious adverse events considered to be related to the intervention: 1 had increased sputum production; the other had dehydration, dysphagia, pain (including abdominal), pancreatitis, and subsequently had schistosomiasis | |
| Total of 28 side effects in palifermin group occurring in 11 of 22 patients (50%) who received at least 4 of the 6 doses. Most frequent (90.9%) were cases of erythema or exanthema, often associated with itching (54.5%). Often (54.5%) a swelling of the oral mucosa including the tongue occurred. In 4 out of 6 patients, this was accompanied by taste disturbance. The severity of side effects were classified as mild to moderate. The CTC Grade 3 occurred only once in the form of a strong heat sensation In 1 of the 11 cases, there was premature discontinuation of palifermin due to severe facial swelling with eyelid and laryngeal pain as well as painful swelling of the hands following the second injection | |
| 25 different adverse events were reported and were mostly not KGF‐related. There was insufficient evidence of a difference for diarrhoea, abdominal pain, infection or rash | |
| "..two patients reported knee joint pain, skin rash was observed in one patient, two patients had abnormal taste, and one showed lingual mucosal thickening" (control group was chlorhexidine mouthrinse. The authors do not report the events by treatment group) | |
|
| |
| KGF‐related AEs with incidence ≥ 5% in KGF group: higher rate of gastrointestinal disorders in KGF group (18/78 versus 2/73; RR 8.42, 95% CI 2.02 to 35.04; P = 0.003). Insufficient evidence of a difference in any AE, tongue coating, tongue disorder, skin and subcutaneous tissue disorders, rash, pruritus, or erythema | |
| "Study drug–related AEs were reported for 35% of palifermin and 11% of placebo patients. The most frequent study drug–related AEs (palifermin, placebo) were rash (9%, 2%), flushing (5%, 0%), dysgeusia (5%, 1%), nausea (4%, 1%),and vomiting (3%, 1%). None of these events led to study withdrawal. Serious AEs considered related to study treatment were reported for five palifermin patients (5%; one each with necrotic pancreatitis, hypersensitivity, tracheostomy malfunction, peritoneal carcinoma, and convulsion) and two placebo patients (2%; one each with hepatitis/hepatic enzyme increase and cryptogenic organizing pneumonia)" | |
| "The administration of palifermin was generally safe and without considerable complications. The only adverse reactions were rashes (lasting for 48–72 hours) localized to the face, upper neck and shoulders, erythema, and altered taste (consistent with the pharmacologic action of palifermin of oral epithelium and skin), most of which were of NCI grade 1 or 2 severity" | |
| "The administration of palifermin was mostly safe and without substantial complications. The mean duration of the OM and the number of adverse event was significant less in the palifermin group (Tables II, III, Figure 1). The main adverse episodes were erythema, cutaneous rashes and altered taste and three of the patients in the palifermin group showed a light thickness of the tongue, mouth and palate" | |
| "Although the predefined frequency of DLTs attributable to KGF was not reached with KGF doses between 1 and 80 µg/kg/d, there were three adverse reactions involving the skin that required discontinuation of KGF in the 18 patients treated with 60 or 80 µg/kg (Table 5). Overall, skin and oral adverse events (rash, flushing, pruritis, edema, hypoesthesia, paresthesia, tongue disorder [thickening], and alteration in taste sensation) attributed to KGF occurred in 13 of 18 patients treated with 60 and 80 µg/kg of KGF (eight patients, grade 1; four patients, grade 2; and one patient, grade 3) and in three of 11 patients treated with 40 µg/kg (all grade 1). These events were reported in 16 of 39 patients (41%) dosed with KGF at > 20 µg/kg/d, whereas these symptoms were reported in only two of 21 subjects (10%) treated with placebo. The skin and oral toxicities associated with KGF were generally mild to moderate in severity, with onset approximately 36 hours after the first dose of KGF and resolution 7 to 10 days thereafter" | |
|
| |
| "The incidence, frequency, and severity of adverse events were similar in the two groups, and most were attributable to the underlying cancer, cytotoxic chemotherapy, or total‐body irradiation. Those that occurred with an incidence that was at least 5 percentage points higher in the palifermin group than in the placebo group are listed in Table 3. Most of these adverse events were consistent with the pharmacologic action of palifermin on skin and oral epithelium (e.g., rash, pruritus, erythema, paresthesia, mouth and tongue disorders, and taste alteration). All these events were mild to moderate in severity, transient (occurring approximately three days after the third dose of palifermin and lasting approximately three days), and not a cause for the discontinuation of study drug. Serious adverse events considered to be related to treatment occurred in one palifermin recipient (rash) and one placebo recipient (hypotension)" | |
|
| |
| AE = adverse event; CI = confidence interval; KGF = keratinocyte growth factor; NCI‐CTC = National Cancer Institute common toxicity criteria; RR = risk ratio; WHO = World Health Organization. | |
| Study ID | Adverse events results |
| 2 participants (group allocation not reported) withdrew by day 3 due to intolerance to their mouthwash (dry mouth); 1 participant receiving GM‐CSF (1 µg/mL) had mouthwash withdrawn by day 3 due to possible allergic reaction (sensation of fullness in the posterior pharyngeal area) but resolved within 4 hours (the participant was withdrawn but appears to have been included in the analysis) | |
| "One patient had fever and chills, and two patients had general malaise and headache during GM‐CSF treatment. No patient had evidence of fluid retention after GM‐CSF" | |
| Not reported | |
| (Sucralfate given to both groups) "Only 2 of the 20 patients treated with GM‐CSF and sucralfate did not experience any side effects related to the drugs, but most side effects were mild (WHO Grade 1 or 2). The most common side effects were local skin reactions, fever, bone pain, and mild nausea...In the control group only 1 patient complained of nausea possibly related to the use of sucralfate, and another patient interrupted sucralfate treatment because of the same reason" | |
| "12 patients who received GM‐CSF had elevated white cell counts (WCC). The range of maximal WCC was 7.2–30.5 (median 19.7). All WCC had returned to normal within 3 weeks of completing injections (median 2 weeks). Three patients developed influenza‐like symptoms with the GM‐CSF and in one patient the injections were stopped because of this symptom. One patient developed an erythematous rash at his injection sites after completing his course of 14 injections (Figure 3). He had a past history of allergy to radiographic contrast medium" | |
|
| |
| (Comparator was sucralfate) "Both mouthwashes were well tolerated, and none of the patients reported any adverse effects related to the mouthwashes. Adverse effects commonly associated with subcutaneous GM‐CSF administration, such as nausea, vomiting, bone pain, headaches, and fever, were not observed" | |
| Not reported | |
| GM‐CSF = granulocyte‐macrophage colony‐stimulating factor. | |
| Study ID | Population | Outcome | GM‐CSF | Placebo | Result |
| BMT/SCT after conditioning for haematological cancers | Oral mucositis: no scale described | No data | No data | "There was no difference in the frequency of stomatitis (defined as a sore, infected or ulcerated mouth, lips or pharynx), the incidence being between 29 and 33% in all groups" | |
| BMT = bone marrow transplantation; G‐CSF: granulocyte‐colony stimulating factor; SCT = stem cell transplantation. | |||||
| Study ID | Adverse events results |
| "Both pegfilgrastim and filgrastim were well tolerated and no significant adverse effects were associated with their use" (G‐CSF versus G‐CSF) | |
| Approximately 20% of participants receiving G‐CSF experienced mild to moderate skeletal pain which was resolved by using oral analgesics; 6% of participants in both groups reported mild generalised rash/itching; 3 participants experienced an event thought to be G‐CSF‐related and which caused them to request withdrawal from the study: abdominal pain, diffuse aches and pains, and a flare‐up of pre‐existing eczema | |
| Not reported | |
| "There was no difference in the overall frequency of adverse clinical or laboratory events between the groups or in the frequency of adverse events thought by the clinicians to be possibly or probably due to study medication" | |
| Not reported | |
| "In general, toxicities typical of postoperative RT to the head and neck were observed. Additional toxicities attributable to G‐CSF and/or daily injections were as follows: elevated WBC requiring G‐CSF dose reduction by prospectively planned guidelines occurred in nine patients in the GCSF arm; grade 2–3 bone pain was observed in two patients in the G‐CSF arm; three patients refused injection (2 G‐CSF, 1 placebo)" | |
| G‐CSF = granulocyte‐colony stimulating factor. | |
| Study ID | Adverse events results |
| "Adverse events were similar in both groups (Table 3). The most common adverse event in the rhEGF group was nausea (n = 7, 10.4%). The incidence of other adverse events including oral pain, dry mouth, and taste alteration was low. All the adverse events were mild and transient. No grade 3 or 4 adverse events were noted during the study period" (there were no differences between groups in any adverse event) | |
| "The frequency of minor and serious adverse events was similar in all groups. Most adverse events were related to primary disease status and treatment modalities" | |
| EGF = epidermal growth factor. | |
| Study ID | Adverse events results |
| "Only a minority of patients (six [6.1%] of 99 patients) reported mild to moderate treatment‐emergent adverse events on the study. The symptoms included abdominal pain, diarrhea, oral pain, headache, and hypertension (Table 2). Of these, four were considered related to study drug: one (3%) was in the placebo group, two (6%) were in the low‐dose rhITF group, and one (3%) was in the high‐dose rhITF group. The events were isolated and resolved spontaneously without sequelae" | |
| ITF = intestinal trefoil factor. | |
| Study ID | Population | Outcome | TGF‐beta(2) | Placebo | Result |
| CT alone for colorectal cancer | Oral mucositis (WHO 0 to 4 scale): any oral mucositis | 0/9 | 2/4 | RR 0.10 (95% CI 0.01 to 1.71); P = 0.11 | |
| CI = confidence interval; CT = chemotherapy; RR = risk ratio; TGF = transforming growth factor; WHO = World Health Organization. | |||||
| Outcome or subgroup title | No. of studies | No. of participants | Statistical method | Effect size |
| 1 Oral mucositis (any) Show forest plot | 8 | Risk Ratio (M‐H, Random, 95% CI) | Subtotals only | |
| 1.1 BMT/SCT after conditioning for haematological cancers | 4 | 655 | Risk Ratio (M‐H, Random, 95% CI) | 0.96 [0.88, 1.05] |
| 1.2 RT to head & neck with cisplatin | 2 | 374 | Risk Ratio (M‐H, Random, 95% CI) | 0.95 [0.90, 1.00] |
| 1.3 CT alone for mixed cancers | 2 | 215 | Risk Ratio (M‐H, Random, 95% CI) | 0.71 [0.60, 0.85] |
| 2 Oral mucositis (moderate + severe) Show forest plot | 13 | Risk Ratio (M‐H, Random, 95% CI) | Subtotals only | |
| 2.1 BMT/SCT after conditioning for haematological cancers | 6 | 852 | Risk Ratio (M‐H, Random, 95% CI) | 0.89 [0.80, 0.99] |
| 2.2 RT to head & neck with cisplatin/5FU | 3 | 471 | Risk Ratio (M‐H, Random, 95% CI) | 0.91 [0.83, 1.00] |
| 2.3 CT alone for mixed cancers | 4 | 344 | Risk Ratio (M‐H, Random, 95% CI) | 0.56 [0.45, 0.70] |
| 3 Oral mucositis (severe) Show forest plot | 12 | Risk Ratio (M‐H, Random, 95% CI) | Subtotals only | |
| 3.1 BMT/SCT after conditioning for haematological cancers | 6 | 852 | Risk Ratio (M‐H, Random, 95% CI) | 0.85 [0.65, 1.11] |
| 3.2 RT to head & neck with cisplatin/5FU | 3 | 471 | Risk Ratio (M‐H, Random, 95% CI) | 0.79 [0.69, 0.90] |
| 3.3 CT alone for mixed cancers | 3 | 263 | Risk Ratio (M‐H, Random, 95% CI) | 0.30 [0.14, 0.65] |
| 4 Interruptions to cancer treatment (unscheduled RT breaks of 5 or more days) Show forest plot | 3 | Risk Ratio (M‐H, Random, 95% CI) | Subtotals only | |
| 4.1 RT to head & neck with cisplatin/5FU | 3 | 473 | Risk Ratio (M‐H, Random, 95% CI) | 1.01 [0.65, 1.59] |
| 5 Interruptions to cancer treatment (chemotherapy delays/discontinuations) Show forest plot | 2 | Risk Ratio (M‐H, Random, 95% CI) | Subtotals only | |
| 5.1 RT to head & neck with cisplatin | 2 | 374 | Risk Ratio (M‐H, Random, 95% CI) | 0.96 [0.62, 1.47] |
| 6 Oral pain Show forest plot | 3 | Mean Difference (IV, Random, 95% CI) | Subtotals only | |
| 6.1 BMT/SCT after conditioning for haematological cancers | 1 | 42 | Mean Difference (IV, Random, 95% CI) | ‐0.85 [‐3.00, 1.30] |
| 6.2 RT to head & neck with cisplatin | 2 | 374 | Mean Difference (IV, Random, 95% CI) | ‐0.12 [‐0.27, 0.02] |
| 7 Normalcy of diet (use of supplemental nutrition) Show forest plot | 7 | Risk Ratio (M‐H, Random, 95% CI) | Subtotals only | |
| 7.1 BMT/SCT after conditioning for haematological cancers | 4 | 714 | Risk Ratio (M‐H, Random, 95% CI) | 0.89 [0.58, 1.34] |
| 7.2 RT to head & neck with cisplatin/5FU | 3 | 473 | Risk Ratio (M‐H, Random, 95% CI) | 1.03 [0.77, 1.37] |
| 8 Normalcy of diet (worst ability to eat score ‐ 1 to 4 scale) Show forest plot | 1 | Mean Difference (IV, Random, 95% CI) | Subtotals only | |
| 8.1 BMT/SCT after conditioning for haematological cancers | 1 | 42 | Mean Difference (IV, Random, 95% CI) | ‐0.5 [‐1.21, 0.21] |
| 9 Number of days in hospital Show forest plot | 1 | Mean Difference (IV, Random, 95% CI) | Subtotals only | |
| 9.1 BMT/SCT after conditioning for haematological cancers | 1 | 281 | Mean Difference (IV, Random, 95% CI) | 0.0 [‐1.64, 1.64] |
| 10 Number of days of treatment with opioid analgesics Show forest plot | 2 | Mean Difference (IV, Random, 95% CI) | Subtotals only | |
| 10.1 BMT/SCT after conditioning for haematological cancers | 2 | 323 | Mean Difference (IV, Random, 95% CI) | ‐1.41 [‐3.33, 0.51] |
| Outcome or subgroup title | No. of studies | No. of participants | Statistical method | Effect size |
| 1 Oral mucositis (any) Show forest plot | 1 | Risk Ratio (M‐H, Random, 95% CI) | Subtotals only | |
| 1.1 BMT/SCT after conditioning for haematological cancers | 1 | 224 | Risk Ratio (M‐H, Random, 95% CI) | 0.88 [0.75, 1.03] |
| 2 Oral mucositis (moderate + severe) Show forest plot | 3 | Risk Ratio (M‐H, Random, 95% CI) | Totals not selected | |
| 2.1 BMT/SCT after conditioning for haematological cancers | 2 | Risk Ratio (M‐H, Random, 95% CI) | 0.0 [0.0, 0.0] | |
| 2.2 CT alone for metastatic colorectal cancer | 1 | Risk Ratio (M‐H, Random, 95% CI) | 0.0 [0.0, 0.0] | |
| 3 Oral mucositis (severe) Show forest plot | 2 | Risk Ratio (M‐H, Random, 95% CI) | Totals not selected | |
| 3.1 BMT/SCT after conditioning for haematological cancers | 2 | Risk Ratio (M‐H, Random, 95% CI) | 0.0 [0.0, 0.0] | |
| 4 Oral pain (maximum score on 0 to 10 VAS) Show forest plot | 1 | Mean Difference (IV, Random, 95% CI) | Subtotals only | |
| 4.1 BMT/SCT after conditioning for haematological cancers | 1 | 28 | Mean Difference (IV, Random, 95% CI) | 0.70 [‐1.90, 3.30] |
| 5 Normalcy of diet (use of TPN) Show forest plot | 1 | Risk Ratio (M‐H, Random, 95% CI) | Subtotals only | |
| 5.1 BMT/SCT after conditioning for haematological cancers | 1 | 224 | Risk Ratio (M‐H, Random, 95% CI) | 0.80 [0.63, 1.02] |
| 6 Normalcy of diet (worst ability to eat score ‐ 1 to 4 scale) Show forest plot | 1 | Mean Difference (IV, Random, 95% CI) | Subtotals only | |
| 6.1 BMT/SCT after conditioning for haematological cancers | 1 | 28 | Mean Difference (IV, Random, 95% CI) | 0.40 [‐0.41, 1.21] |
| 7 Number of days in hospital Show forest plot | 1 | Mean Difference (IV, Random, 95% CI) | Subtotals only | |
| 7.1 BMT/SCT after conditioning for haematological cancers | 1 | 224 | Mean Difference (IV, Random, 95% CI) | 0.0 [‐1.78, 1.78] |
| 8 Number of days of treatment with opioid analgesics Show forest plot | 2 | Mean Difference (IV, Random, 95% CI) | Totals not selected | |
| 8.1 BMT/SCT after conditioning for haematological cancers | 2 | Mean Difference (IV, Random, 95% CI) | 0.0 [0.0, 0.0] | |
| Outcome or subgroup title | No. of studies | No. of participants | Statistical method | Effect size |
| 1 Oral mucositis (any) Show forest plot | 1 | Risk Ratio (M‐H, Random, 95% CI) | Subtotals only | |
| 1.1 CT alone for haematological cancer | 1 | 90 | Risk Ratio (M‐H, Random, 95% CI) | 0.67 [0.54, 0.85] |
| 2 Oral mucositis (moderate + severe) Show forest plot | 1 | Risk Ratio (M‐H, Random, 95% CI) | Subtotals only | |
| 2.1 CT alone for haematological cancer | 1 | 90 | Risk Ratio (M‐H, Random, 95% CI) | 0.12 [0.05, 0.28] |
| 3 Oral mucositis (severe) Show forest plot | 1 | Risk Ratio (M‐H, Random, 95% CI) | Subtotals only | |
| 3.1 CT alone for haematological cancer | 1 | 90 | Risk Ratio (M‐H, Random, 95% CI) | 0.01 [0.00, 0.19] |
| Outcome or subgroup title | No. of studies | No. of participants | Statistical method | Effect size |
| 1 Oral mucositis (any) Show forest plot | 2 | Risk Ratio (M‐H, Random, 95% CI) | Subtotals only | |
| 1.1 BMT/SCT after conditioning for mixed cancers | 1 | 90 | Risk Ratio (M‐H, Random, 95% CI) | 0.91 [0.80, 1.04] |
| 1.2 RT to head & neck | 1 | 29 | Risk Ratio (M‐H, Random, 95% CI) | 1.01 [0.82, 1.23] |
| 2 Oral mucositis (moderate + severe) Show forest plot | 2 | Risk Ratio (M‐H, Random, 95% CI) | Subtotals only | |
| 2.1 BMT/SCT after conditioning for haematological cancers | 1 | 109 | Risk Ratio (M‐H, Random, 95% CI) | 0.94 [0.79, 1.13] |
| 2.2 RT to head & neck | 1 | 29 | Risk Ratio (M‐H, Random, 95% CI) | 0.72 [0.49, 1.06] |
| 3 Oral mucositis (severe) Show forest plot | 6 | Risk Ratio (M‐H, Random, 95% CI) | Subtotals only | |
| 3.1 BMT/SCT after conditioning for mixed cancers | 3 | 235 | Risk Ratio (M‐H, Random, 95% CI) | 0.74 [0.33, 1.67] |
| 3.2 RT to head & neck | 1 | 29 | Risk Ratio (M‐H, Random, 95% CI) | 0.31 [0.01, 7.09] |
| 3.3 CT alone for mixed cancers | 2 | 65 | Risk Ratio (M‐H, Random, 95% CI) | 0.59 [0.05, 7.11] |
| 4 Oral pain (maximum score on 0 to 10 VAS) Show forest plot | 1 | Mean Difference (IV, Random, 95% CI) | Subtotals only | |
| 4.1 BMT/SCT after conditioning for mixed cancers | 1 | 90 | Mean Difference (IV, Random, 95% CI) | 0.60 [‐0.85, 2.05] |
| 5 Normalcy of diet (use of feeding tube/parenteral nutrition) Show forest plot | 2 | Risk Ratio (M‐H, Random, 95% CI) | Subtotals only | |
| 5.1 BMT/SCT after conditioning for haematological cancers | 1 | 36 | Risk Ratio (M‐H, Random, 95% CI) | 1.1 [0.63, 1.91] |
| 5.2 RT to head & neck | 1 | 29 | Risk Ratio (M‐H, Random, 95% CI) | 0.31 [0.01, 7.09] |
| 6 Number of days of treatment with opioid analgesics Show forest plot | 1 | Mean Difference (IV, Random, 95% CI) | Subtotals only | |
| 6.1 BMT/SCT after conditioning for mixed cancers | 1 | 90 | Mean Difference (IV, Random, 95% CI) | ‐1.10 [‐1.91, ‐0.29] |
| Outcome or subgroup title | No. of studies | No. of participants | Statistical method | Effect size |
| 1 Oral mucositis (severe) Show forest plot | 1 | Risk Ratio (M‐H, Random, 95% CI) | Subtotals only | |
| 1.1 CT alone for breast cancer | 1 | 36 | Risk Ratio (M‐H, Random, 95% CI) | 2.75 [1.07, 7.04] |
| Outcome or subgroup title | No. of studies | No. of participants | Statistical method | Effect size |
| 1 Oral mucositis (moderate + severe) Show forest plot | 1 | Risk Ratio (M‐H, Random, 95% CI) | Subtotals only | |
| 1.1 RT to head & neck | 1 | 40 | Risk Ratio (M‐H, Random, 95% CI) | 0.96 [0.80, 1.14] |
| 2 Oral mucositis (severe) Show forest plot | 1 | Risk Ratio (M‐H, Random, 95% CI) | Subtotals only | |
| 2.1 RT to head & neck | 1 | 40 | Risk Ratio (M‐H, Random, 95% CI) | 0.54 [0.24, 1.21] |
| 3 Interruptions to cancer treatment Show forest plot | 1 | Risk Ratio (M‐H, Random, 95% CI) | Subtotals only | |
| 3.1 RT to head & neck | 1 | 40 | Risk Ratio (M‐H, Random, 95% CI) | 0.13 [0.01, 2.36] |
| 4 Normalcy of diet (use of PEG tube) Show forest plot | 1 | Risk Ratio (M‐H, Random, 95% CI) | Subtotals only | |
| 4.1 RT to head & neck | 1 | 40 | Risk Ratio (M‐H, Random, 95% CI) | 0.18 [0.01, 3.56] |
| Outcome or subgroup title | No. of studies | No. of participants | Statistical method | Effect size |
| 1 Oral mucositis (any) Show forest plot | 3 | Risk Ratio (M‐H, Random, 95% CI) | Subtotals only | |
| 1.1 RT to head & neck | 2 | 54 | Risk Ratio (M‐H, Random, 95% CI) | 1.02 [0.86, 1.22] |
| 1.2 CT alone for lung cancer | 1 | 195 | Risk Ratio (M‐H, Random, 95% CI) | 0.59 [0.40, 0.87] |
| 2 Oral mucositis (moderate + severe) Show forest plot | 1 | Risk Ratio (M‐H, Random, 95% CI) | Subtotals only | |
| 2.1 CT alone for breast cancer | 1 | 14 | Risk Ratio (M‐H, Random, 95% CI) | 0.33 [0.12, 0.95] |
| 3 Oral mucositis (severe) Show forest plot | 2 | Risk Ratio (M‐H, Random, 95% CI) | Subtotals only | |
| 3.1 RT to head & neck | 2 | 54 | Risk Ratio (M‐H, Random, 95% CI) | 0.37 [0.15, 0.87] |
| 4 Interruptions to cancer treatment (RT interruption) Show forest plot | 1 | Risk Ratio (M‐H, Random, 95% CI) | Subtotals only | |
| 4.1 RT to head & neck | 1 | 40 | Risk Ratio (M‐H, Random, 95% CI) | 0.22 [0.01, 4.31] |
| 5 Normalcy of diet (use of PEG tube) Show forest plot | 1 | Risk Ratio (M‐H, Random, 95% CI) | Subtotals only | |
| 5.1 RT to head & neck | 1 | 40 | Risk Ratio (M‐H, Random, 95% CI) | 0.16 [0.01, 2.86] |
| Outcome or subgroup title | No. of studies | No. of participants | Statistical method | Effect size |
| 1 Oral mucositis (any) Show forest plot | 1 | Risk Ratio (M‐H, Random, 95% CI) | Subtotals only | |
| 1.1 BMT/SCT after conditioning for mixed cancers | 1 | 61 | Risk Ratio (M‐H, Random, 95% CI) | 1.02 [0.82, 1.27] |
| 2 Oral mucositis (moderate + severe) Show forest plot | 1 | Risk Ratio (M‐H, Random, 95% CI) | Subtotals only | |
| 2.1 BMT/SCT after conditioning for mixed cancers | 1 | 61 | Risk Ratio (M‐H, Random, 95% CI) | 0.78 [0.55, 1.11] |
| 3 Normalcy of diet (use of supplemental nutrition) Show forest plot | 1 | Risk Ratio (M‐H, Random, 95% CI) | Subtotals only | |
| 3.1 BMT/SCT after conditioning for mixed cancers | 1 | 61 | Risk Ratio (M‐H, Random, 95% CI) | 1.0 [0.94, 1.06] |
| Outcome or subgroup title | No. of studies | No. of participants | Statistical method | Effect size |
| 1 Oral mucositis (moderate + severe) Show forest plot | 2 | Risk Ratio (M‐H, Random, 95% CI) | Subtotals only | |
| 1.1 BMT/SCT after conditioning for haematological cancers | 1 | 136 | Risk Ratio (M‐H, Random, 95% CI) | 1.06 [0.78, 1.43] |
| 1.2 RT to head & neck +/‐ cisplatin | 1 | 103 | Risk Ratio (M‐H, Random, 95% CI) | 0.67 [0.45, 0.99] |
| 2 Oral mucositis (severe) Show forest plot | 1 | Risk Ratio (M‐H, Random, 95% CI) | Subtotals only | |
| 2.1 BMT/SCT after conditioning for haematological cancers | 1 | 136 | Risk Ratio (M‐H, Random, 95% CI) | 1.03 [0.59, 1.80] |
| 3 Interruptions to cancer treatment (RT breaks > 2 consecutive days) Show forest plot | 1 | Risk Ratio (M‐H, Random, 95% CI) | Subtotals only | |
| 3.1 RT to head & neck +/‐ cisplatin | 1 | 113 | Risk Ratio (M‐H, Random, 95% CI) | 4.38 [0.25, 75.44] |
| 4 Normalcy of diet (use of supplemental nutrition) Show forest plot | 1 | Risk Ratio (M‐H, Random, 95% CI) | Subtotals only | |
| 4.1 BMT/SCT after conditioning for haematological cancers | 1 | 136 | Risk Ratio (M‐H, Random, 95% CI) | 1.03 [0.55, 1.94] |
| Outcome or subgroup title | No. of studies | No. of participants | Statistical method | Effect size |
| 1 Oral mucositis (any) Show forest plot | 1 | Risk Ratio (M‐H, Random, 95% CI) | Subtotals only | |
| 1.1 CT alone for colorectal cancer | 1 | 99 | Risk Ratio (M‐H, Random, 95% CI) | 0.52 [0.35, 0.79] |
| 2 Oral mucositis (moderate + severe) Show forest plot | 1 | Risk Ratio (M‐H, Random, 95% CI) | Subtotals only | |
| 2.1 CT alone for colorectal cancer | 1 | 99 | Risk Ratio (M‐H, Random, 95% CI) | 0.22 [0.10, 0.48] |
| 3 Oral mucositis (severe) Show forest plot | 1 | Risk Ratio (M‐H, Random, 95% CI) | Subtotals only | |
| 3.1 CT alone for colorectal cancer | 1 | 99 | Risk Ratio (M‐H, Random, 95% CI) | 1.52 [0.06, 36.39] |
| Outcome or subgroup title | No. of studies | No. of participants | Statistical method | Effect size |
| 1 Oral mucositis (any) Show forest plot | 1 | Risk Ratio (M‐H, Random, 95% CI) | Subtotals only | |
| 1.1 CT alone for colorectal cancer | 1 | 66 | Risk Ratio (M‐H, Random, 95% CI) | 1.3 [0.67, 2.54] |
| 2 Oral mucositis (moderate + severe) Show forest plot | 1 | Risk Ratio (M‐H, Random, 95% CI) | Subtotals only | |
| 2.1 CT alone for colorectal cancer | 1 | 66 | Risk Ratio (M‐H, Random, 95% CI) | 0.75 [0.18, 3.09] |
| 3 Oral mucositis (severe) Show forest plot | 1 | Risk Ratio (M‐H, Random, 95% CI) | Subtotals only | |
| 3.1 CT alone for colorectal cancer | 1 | 66 | Risk Ratio (M‐H, Random, 95% CI) | 0.33 [0.01, 7.90] |
| Outcome or subgroup title | No. of studies | No. of participants | Statistical method | Effect size |
| 1 Oral mucositis (any) Show forest plot | 1 | Risk Ratio (M‐H, Random, 95% CI) | Subtotals only | |
| 1.1 BMT/SCT after conditioning for haematological cancers | 1 | 80 | Risk Ratio (M‐H, Random, 95% CI) | 0.35 [0.21, 0.60] |
| 2 Oral mucositis (moderate + severe) Show forest plot | 1 | Risk Ratio (M‐H, Random, 95% CI) | Subtotals only | |
| 2.1 BMT/SCT after conditioning for haematological cancers | 1 | 80 | Risk Ratio (M‐H, Random, 95% CI) | 0.43 [0.24, 0.79] |
| 3 Oral mucositis (severe) Show forest plot | 1 | Risk Ratio (M‐H, Random, 95% CI) | Subtotals only | |
| 3.1 BMT/SCT after conditioning for haematological cancers | 1 | 80 | Risk Ratio (M‐H, Random, 95% CI) | 0.4 [0.14, 1.17] |
| 4 Number of days in hospital Show forest plot | 1 | Mean Difference (IV, Random, 95% CI) | Subtotals only | |
| 4.1 BMT/SCT after conditioning for haematological cancers | 1 | 80 | Mean Difference (IV, Random, 95% CI) | ‐2.95 [‐7.73, 1.83] |