| 1 Betacore, 1st trimester urine test, 5% FPR Show forest plot | 1 | 516 |
|
| 2 Betacore, 2nd trimester urine test, 5% FPR Show forest plot | 6 | 9613 |
|
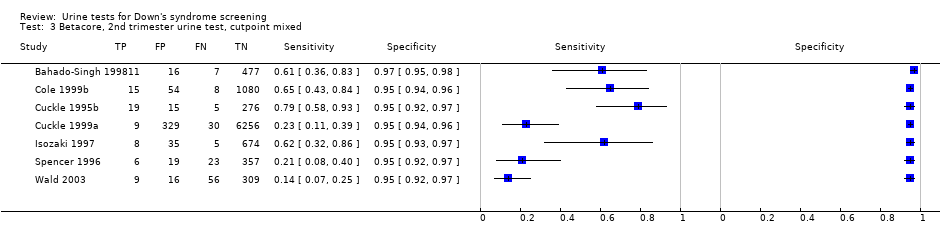
| 3 Betacore, 2nd trimester urine test, cutpoint mixed Show forest plot | 7 | 10124 |
|
| 4 Gonadotropin, 2nd trimester urine test, risk 1:100 Show forest plot | 1 | 105 |
|
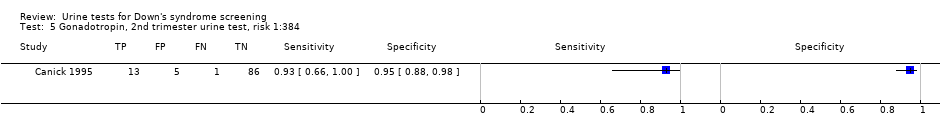
| 5 Gonadotropin, 2nd trimester urine test, risk 1:384 Show forest plot | 1 | 105 |
|
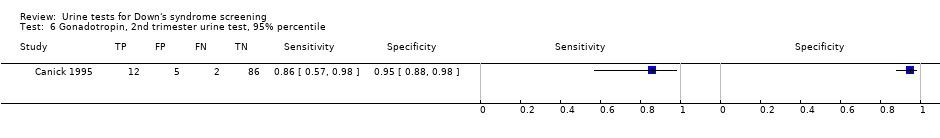
| 6 Gonadotropin, 2nd trimester urine test, 95% percentile Show forest plot | 1 | 105 |
|
| 7 ITA, 1st trimester urine test, 5% FPR Show forest plot | 2 | 579 |
|
| 8 ITA, 2nd trimester urine test, 3.74MoM Show forest plot | 1 | 2051 |
|
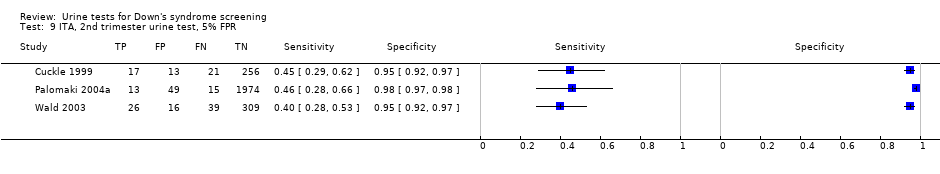
| 9 ITA, 2nd trimester urine test, 5% FPR Show forest plot | 3 | 2748 |
|
| 10 Total hCG, 1st trimester urine test, 5% FPR Show forest plot | 1 | 516 |
|
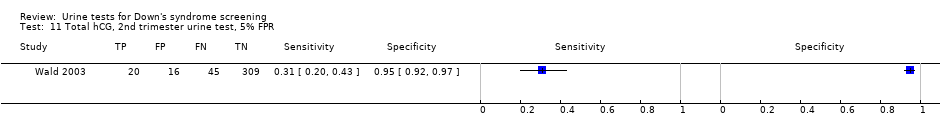
| 11 Total hCG, 2nd trimester urine test, 5% FPR Show forest plot | 1 | 390 |
|
| 12 Free ßhCG, 1st trimester urine test, 5% FPR Show forest plot | 1 | 516 |
|
| 13 Free ßhCG, 2nd trimester urine test, 5% FPR Show forest plot | 3 | 1517 |
|
| 14 Oestriol, 2nd trimester urine test, 5% FPR Show forest plot | 2 | 1472 |
|
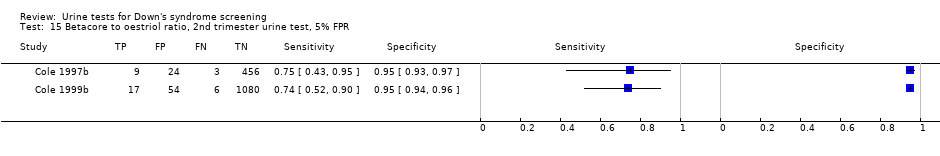
| 15 Betacore to oestriol ratio, 2nd trimester urine test, 5% FPR Show forest plot | 2 | 1649 |
|
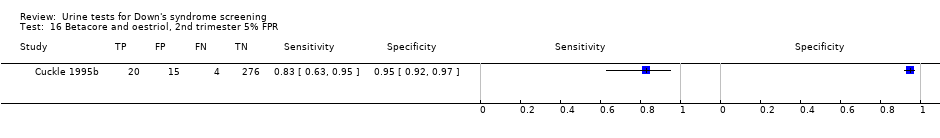
| 16 Betacore and oestriol, 2nd trimester 5% FPR Show forest plot | 1 | 315 |
|
| 17 AFP and ITA, 2nd trimester urine test, 3% FPR Show forest plot | 1 | 524 |
|
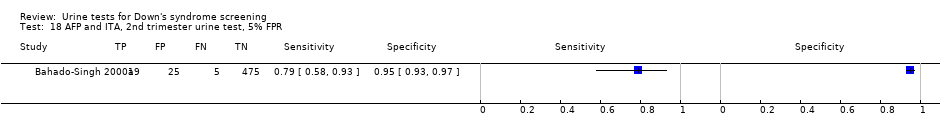
| 18 AFP and ITA, 2nd trimester urine test, 5% FPR Show forest plot | 1 | 524 |
|
| 19 AFP and ITA, 2nd trimester urine test,10% FPR Show forest plot | 1 | 524 |
|
| 20 AFP and ITA, 2nd trimester urine test, 15% FPR Show forest plot | 1 | 524 |
|
| 21 AFP, uE3 and ITA, 2nd trimester urine test, 3% FPR Show forest plot | 1 | 524 |
|
| 22 AFP, uE3 and ITA, 2nd trimester urine test, 5% FPR Show forest plot | 1 | 524 |
|
| 23 AFP, uE3 and ITA, 2nd trimester urine test, 10% FPR Show forest plot | 1 | 524 |
|
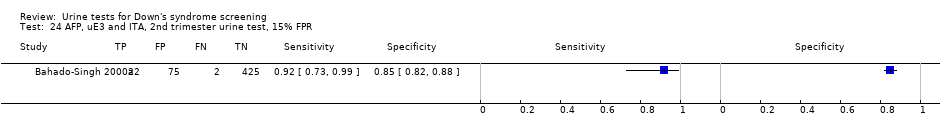
| 24 AFP, uE3 and ITA, 2nd trimester urine test, 15% FPR Show forest plot | 1 | 524 |
|
| 25 Age, betacore, 2nd trimester urine test, 1% FPR Show forest plot | 2 | 2083 |
|
| 26 Age, betacore, 2nd trimester urine test, 3% FPR Show forest plot | 2 | 2083 |
|
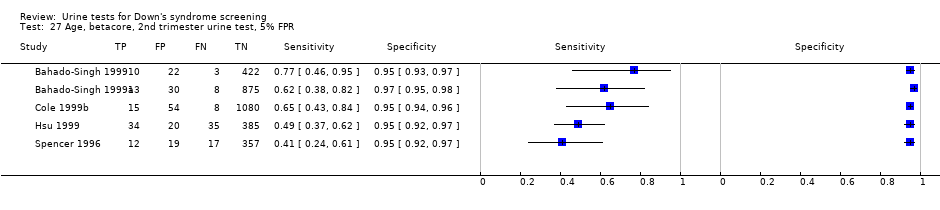
| 27 Age, betacore, 2nd trimester urine test, 5% FPR Show forest plot | 5 | 3419 |
|
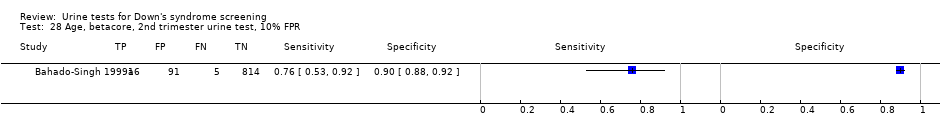
| 28 Age, betacore, 2nd trimester urine test, 10% FPR Show forest plot | 1 | 926 |
|
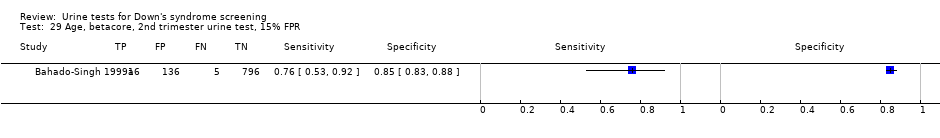
| 29 Age, betacore, 2nd trimester urine test, 15% FPR Show forest plot | 1 | 953 |
|
| 30 Age, betacore, 2nd trimester urine test, 20% FPR Show forest plot | 1 | 926 |
|
| 31 Age, ITA, 2nd trimester urine test, 5% FPR Show forest plot | 1 | 1016 |
|
| 32 Age, oestriol, 2nd trimester urine test, 5% FPR Show forest plot | 1 | 474 |
|
| 33 Age, free ßhCG, 2nd trimester urine test, 5% FPR Show forest plot | 2 | 879 |
|
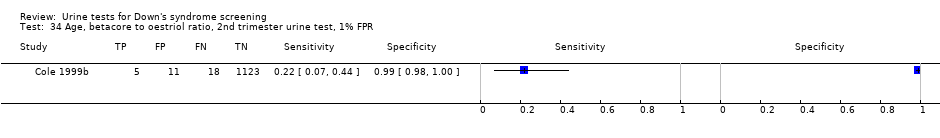
| 34 Age, betacore to oestriol ratio, 2nd trimester urine test, 1% FPR Show forest plot | 1 | 1157 |
|
| 35 Age, betacore to oestriol ratio, 2nd trimester urine test, 3% FPR Show forest plot | 1 | 1157 |
|
| 36 Age, betacore to oestriol ratio, 2nd trimester urine test, 5% FPR Show forest plot | 3 | 2088 |
|
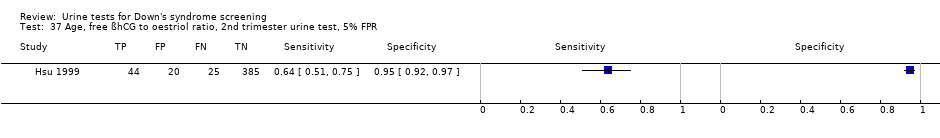
| 37 Age, free ßhCG to oestriol ratio, 2nd trimester urine test, 5% FPR Show forest plot | 1 | 474 |
|
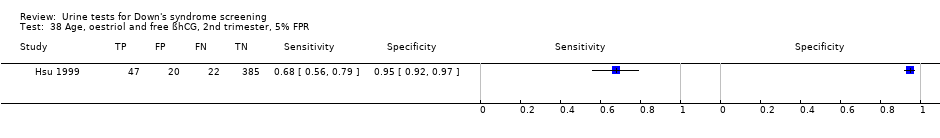
| 38 Age, oestriol and free ßhCG, 2nd trimester, 5% FPR Show forest plot | 1 | 474 |
|
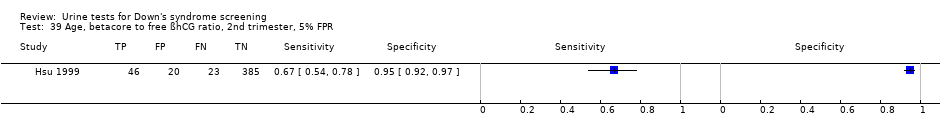
| 39 Age, betacore to free ßhCG ratio, 2nd trimester, 5% FPR Show forest plot | 1 | 474 |
|
| 40 Age, betacore and oestriol, 2nd trimester 1% FPR Show forest plot | 1 | 1157 |
|
| 41 Age, betacore and oestriol, 2nd trimester, 3% FPR Show forest plot | 1 | 1157 |
|
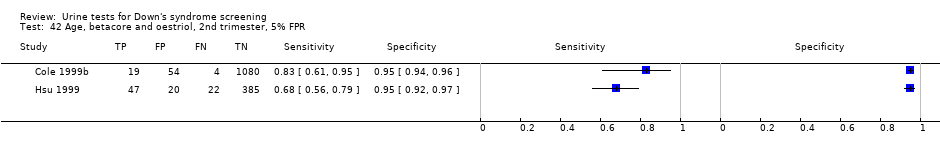
| 42 Age, betacore and oestriol, 2nd trimester, 5% FPR Show forest plot | 2 | 1631 |
|
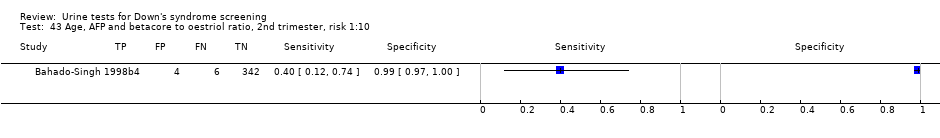
| 43 Age, AFP and betacore to oestriol ratio, 2nd trimester, risk 1:10 Show forest plot | 1 | 356 |
|
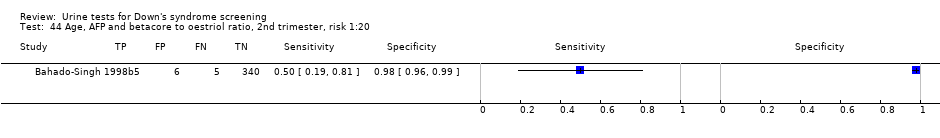
| 44 Age, AFP and betacore to oestriol ratio, 2nd trimester, risk 1:20 Show forest plot | 1 | 356 |
|
| 45 Age, AFP and betacore to oestriol ratio, 2nd trimester, risk 1:30 Show forest plot | 1 | 356 |
|
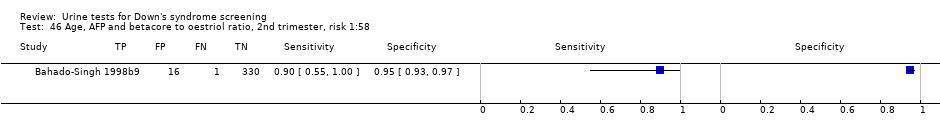
| 46 Age, AFP and betacore to oestriol ratio, 2nd trimester, risk 1:58 Show forest plot | 1 | 356 |
|
| 47 Age, AFP and betacore to oestriol ratio, 2nd trimester, risk 1:270 Show forest plot | 1 | 356 |
|
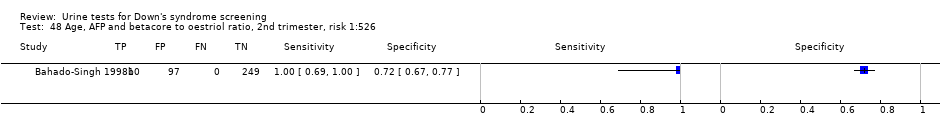
| 48 Age, AFP and betacore to oestriol ratio, 2nd trimester, risk 1:526 Show forest plot | 1 | 356 |
|