Pruebas de orina para el cribado del síndrome de Down
Resumen
Antecedentes
El síndrome de Down ocurre cuando un paciente tiene tres copias del cromosoma 21 (o del área específica del cromosoma 21 que causa el síndrome de Down) en lugar de dos. Es la causa congénita más frecuente de discapacidad mental y también da lugar a numerosos problemas metabólicos y estructurales. Puede ser potencialmente mortal o provocar importantes problemas de salud, aunque algunos individuos solamente tienen problemas leves y pueden llevar una vida relativamente normal. Es probable que tener un niño con síndrome de Down repercuta de manera significativa sobre la vida familiar. El riesgo de que el feto esté afectado por el síndrome de Down se incrementa con el aumento de la edad materna.
El cribado no invasivo basado en el análisis bioquímico del suero o la orina de la madre, o las mediciones de ecografía fetal, permiten calcular el riesgo de que un embarazo esté afectado y proporcionan información para guiar las decisiones acerca de una prueba definitiva. Antes de aceptar las pruebas de cribado, los padres necesitan contar con toda la información acerca de sus posibles riesgos, efectos beneficiosos y consecuencias. Lo anterior incluye elecciones posteriores de pruebas adicionales a las que se pueden enfrentar y las implicaciones de las pruebas de cribado con resultados falsos positivos y falsos negativos (es decir, pruebas de diagnóstico invasivas, y la posibilidad de aborto de un feto que puede ser cromosómicamente normal). Las decisiones que pueden enfrentar los padres que esperan un niño generan inevitablemente un nivel alto de ansiedad en todos los estadios del proceso de cribado, y los resultados del cribado se pueden asociar con considerable morbilidad física y psicológica. Ninguna prueba de cribado puede predecir la gravedad de los problemas que tendrá un paciente con síndrome de Down.
Objetivos
Calcular y comparar la exactitud de los marcadores urinarios del primer y segundo trimestres para el cribado del síndrome de Down.
Métodos de búsqueda
Se realizó una búsqueda bibliográfica sensible y exhaustiva en MEDLINE (desde 1980 hasta 25 de agosto 2011), EMBASE (1980 hasta 25 de agosto 2011), BIOSIS vía EDINA (1985 hasta 25 de agosto 2011), CINAHL vía OVID (1982 hasta 25 de agosto 2011), The Database of Abstracts of Reviews of Effectiveness (The Cochrane Library 2011, número 7), MEDION (25 de agosto 2011), The Database of Systematic Reviews and Meta‐Analyses in Laboratory Medicine (25 de agosto 2011), The National Research Register (archivado en 2007), y la base de datos Health Services Research Projects in Progress (25 de agosto 2011). Se examinaron las listas de referencias y los artículos de revisión publicados.
Criterios de selección
Estudios que evaluaron las pruebas de orina materna en embarazadas con hasta 24 semanas de gestación para el síndrome de Down, en comparación con un estándar de referencia, ya sea la verificación cromosómica o el examen macroscópico posnatal.
Obtención y análisis de los datos
Los datos se extrajeron como resultados negativos o positivos para embarazos con síndrome de Down y sin síndrome de Down, lo que permitió la estimación de las tasas de cribado (sensibilidad) y las tasas de falsos positivos (1‐especificidad). La evaluación de la calidad se realizó según los criterios QUADAS (Quality Assessment of Diagnostic Accuracy Studies). Se utilizaron los métodos metanalíticos jerárquicos resumen ROC (siglas en inglés, característica operativa del receptor) para analizar el rendimiento de las pruebas y comparar su exactitud. Se realizó un análisis de los estudios que permitió la comparación directa entre las pruebas. El impacto de la edad materna en el rendimiento de las pruebas se investigó en análisis de subgrupos.
Resultados principales
Se incluyeron 19 estudios con 18 013 embarazos (527 con síndrome de Down). En general los estudios fueron de calidad alta, aunque fue frecuente la verificación diferencial con pruebas invasivas de los embarazos de alto riesgo solamente. Se evaluaron 24 combinaciones de pruebas formadas por combinaciones de los siguientes siete marcadores diferentes, con y sin la edad materna: AFP (alfafetoproteína), ATI (antígeno trofoblástico invasivo), fragmento ß‐central, ßhCG (gonadotrofina coriónica humana beta) libre, hCG total, estriol, péptido de gonadotropina y cocientes de diversos marcadores. Las estrategias evaluadas incluyeron tres pruebas dobles y siete pruebas individuales en combinación con la edad materna, y una prueba triple, dos pruebas dobles y 11 pruebas individuales sin la edad materna. Doce de los 19 estudios solamente evaluaron el rendimiento de una única estrategia de prueba, mientras que los siete restantes evaluaron al menos dos estrategias de pruebas. Se evaluaron dos combinaciones de marcadores en más de cuatro estudios: fragmento ß‐central del segundo trimestre (seis estudios) y fragmento ß‐central del segundo trimestre con la edad materna (cinco estudios).
En las comparaciones directas de las pruebas, para una tasa de falsos positivos (TFP) del 5%, la exactitud diagnóstica de la combinación de las pruebas del marcador doble del fragmento ß‐central en el segundo trimestre y el estriol con la edad materna fue significativamente mejor (cociente del odds ratio diagnóstico [CORD]: 2,2; [intervalo de confianza (IC) del 95%: 1,1 a 4,5], p = 0,02) (sensibilidad resumen 73% [IC: 57 a 85] a un punto de corte de una TFP del 5%), en comparación con la de la estrategia de la prueba de marcador individual del fragmento ß‐central en el segundo trimestre y la edad materna (sensibilidad resumen 56% [IC: 45 a 66] a un punto de corte de una TFP del 5%), aunque no fue significativamente mejor (CORD: 1,5 [0,8 a 2,8], p = 0,21) que la de la estrategia de prueba del cociente entre el fragmento ß‐central y el estriol en el segundo trimestre, y la edad materna (sensibilidad resumen 71% [IC: 51 a 86] a un punto de corte de la TFP del 5%).
Conclusiones de los autores
Las pruebas que incluyeron el fragmento ß‐central y el estriol en el segundo trimestre y la edad materna son significativamente más sensibles que el marcador individual del fragmento ß‐central en el segundo trimestre y la edad materna; sin embargo, hubo pocos estudios. Hay escasez de evidencia disponible para apoyar el uso de la prueba de orina para el cribado del síndrome de Down en la práctica clínica cuando hay otras opciones disponibles.
Resumen en términos sencillos
Pruebas de cribado para el síndrome de Down en las primeras 24 semanas de embarazo
Antecedentes
El síndrome de Down (también conocido como Trisomía 21) es un trastorno genético incurable que causa problemas de salud físicos y mentales significativos, así como discapacidades. Sin embargo, hay una variación amplia en cómo el síndrome de Down afecta a los pacientes. Algunos tienen una afectación grave, aunque otros tienen problemas leves y pueden llevar una vida relativamente normal. No hay una manera de predecir en qué magnitud se verá afectado un niño.
A los padres que esperan un niño se les ofrece la opción de realizar pruebas para el síndrome de Down durante el embarazo y ayudarlos a tomar decisiones. Si una madre está embarazada de un niño con síndrome de Down, entonces debe tomar la decisión de interrumpir o continuar el embarazo. La información les ofrece a los padres la oportunidad de planificar su vida con un niño con síndrome de Down.
Las pruebas más exactas para detectar el síndrome de Down incluyen la obtención de líquido de alrededor del feto (amniocentesis) o del tejido de la placenta (toma de muestras de las vellosidades coriónicas [TMVC]) para los cromosomas anormales asociados con el síndrome Down. Ambas pruebas incluyen insertar agujas a través del abdomen de la madre y se conoce que aumentan el riesgo de aborto espontáneo. Por lo tanto, las pruebas no son apropiadas para ofrecerlas a todas las embarazadas. En su lugar, se utilizan pruebas que miden marcadores en la sangre o la orina de la madre, o ecografías del feto como pruebas de cribado. Estas pruebas de cribado no son perfectas, pueden omitir casos de síndrome de Down y también aportar resultados de pruebas de "alto riesgo" a varias mujeres cuyos niños no están afectados por el síndrome de Down. Por lo tanto, los embarazos identificados como de "alto riesgo" mediante estas pruebas de cribado requieren pruebas adicionales con amniocentesis o TMVC para confirmar un diagnóstico de Down.
Lo realizado
El objetivo de esta revisión fue determinar cuáles de las pruebas de cribado con urinarias realizadas durante las primeras 24 semanas de embarazo son las más exactas para predecir el riesgo de que un feto esté afectado por el síndrome de Down. Se consideraron siete marcadores urinarios diferentes que pueden utilizarse solos, en cocientes o en combinación, tomados antes de las 24 semanas de gestación, lo que creó 24 pruebas de cribado para el síndrome de Down. Se encontraron 19 estudios con 18 013 embarazos, de los cuales 527 estaban afectados por el síndrome de Down.
Datos encontrados
Durante las primeras 24 semanas de embarazo, la evidencia no apoya el uso de las pruebas de orina para el cribado del síndrome de Down. La cantidad de evidencia es limitada. Estas pruebas no se ofrecen en la práctica clínica habitual.
Otra información importante a considerar
Las prueba de orina en sí no tienen efectos adversos para la embarazada. Sin embargo, algunas mujeres que tienen un resultado de la prueba de cribado de "alto riesgo" y que son sometidas a amniocentesis o a TMVC presentan un riesgo de aborto de un feto no afectado por el síndrome de Down. Los padres deberán comparar este riesgo al decidir si realizar una amniocentesis o una TMVC después de un resultado de las pruebas de cribado de "alto riesgo".
Authors' conclusions
Summary of findings
| Review Question | What is the accuracy of urine based markers for screening for Down's syndrome? | ||||
| Population | Pregnant women at less than 24 weeks' gestation confirmed by ultrasound, who had not undergone previous testing for Down’s syndrome. Most studies were undertaken in women identified to be high risk based on maternal age | ||||
| Settings | All settings | ||||
| Numbers of studies, pregnancies and Down's syndrome cases | 19 studies (reported in 29 publications) involving 18,013 pregnancies of which 527 were Down's syndrome pregnancies. | ||||
| Index tests | Risk scores computed using maternal age and first and second trimester urine markers for AFP; ITA; ß‐core fragment; free ßhCG; total hCG; oestriol (also termed as uE3); gonadotropin peptide. | ||||
| Reference standards | Chromosomal verification (amniocentesis and CVS undertaken during pregnancy, and postnatal karyotyping) and postnatal macroscopic inspection. | ||||
| Study limitations | Seven studies only used selective chromosomal verification during pregnancy, and were at risk of under‐ascertainment of Down's syndrome cases due loss of the pregnancy to miscarriage between the serum test and the reference standard. | ||||
| Test | Studies | Women (Cases) | Sensitivity* (95% CI) | Specificity* (95% CI) | Threshold |
| Test without maternal age | |||||
| Single tests | |||||
| First trimester free ßhCG | 1 | 516 (86) | 5 (1 to 11) | 95 (92 to 97) | 5% FPR |
| First trimester ß‐core fragment | 1 | 516 (86) | 10 (5 to 19) | 95 (92 to 97) | 5% FPR |
| First trimester ITA | 2 | 579 (94) | 15 (2 to 62) | 95 | 5% FPR |
| First trimester total hCG | 1 | 516 (86) | 17 (10 to 27) | 95 (92 to 97) | 5% FPR |
| Second trimester oestriol | 2 | 1472 (47) | 23 (8 to 49) | 95 | 5% FPR |
| Second trimester total hCG | 1 | 390 (65) | 31 (20 to 43) | 95 (92 to 97) | 5% FPR |
| Second trimester free ßhCG | 3 | 1517 (107) | 32 (12 to 63) | 95 | 5% FPR |
| Second trimester ß‐core fragment | 6 | 9613 (193) | 41 (20 to 66) | 95 | 5% FPR |
| Second trimester ITA | 3 | 2748 (131) | 43 (35 to 51) | 95 | 5% FPR |
| Second trimester ß‐core fragment to oestriol ratio | 2 | 1649 (35) | 74 (58 to 86) | 95 | 5% FPR |
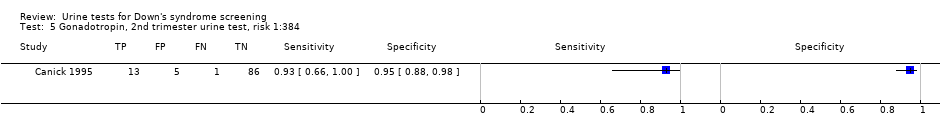
| Second trimester gonadotropin test | 1 | 105 (14) | 93 (66 to 100) | 95 (88 to 98) | 1:384 risk |
| Double tests | |||||
| Second trimester AFP and ITA | 1 | 524 (24) | 79 (58 to 93) | 95 (93 to 97) | 5% FPR |
| Second trimester ß‐core fragment and oestriol | 1 | 315 (24) | 83 (63 to 95) | 95 (92 to 97) | 5% FPR |
| Triple tests | |||||
| Second trimester AFP, uE3 and ITA | 1 | 524 (24) | 79 (58 to 93) | 95 (93 to 97) | 5% FPR |
| Test with maternal age | |||||
| Single tests | |||||
| Second trimester oestriol | 1 | 474 (69) | 49 (37 to 62) | 95 (92 to 97) | 5% FPR |
| Second trimester ß‐core fragment | 5 | 3419 (155) | 56 (45 to 66) | 95 | 5% FPR |
| Second trimester free ßhCG | 2 | 879 (98) | 57 (47 to 67) | 95 | 5% FPR |
| Second trimester free ßhCG to oestriol ratio | 1 | 474 (69) | 64 (51 to 75) | 95 (92 to 97) | 5% FPR |
| Second trimester ß‐core fragment to free ßhCG | 1 | 474 (69) | 67 (54 to 78) | 95 (92 to 97) | 5% FPR |
| Second trimester ITA | 1 | 1016 (23) | 70 (47 to 87) | 95 (93 to 96) | 5% FPR |
| Second trimester ß‐core fragment to oestriol ratio | 3 | 2088 (105) | 71 (51 to 86) | 95 | 5% FPR |
| Double tests | |||||
| Second trimester oestriol and free ßhCG | 1 | 474 (69) | 68 (56 to 79) | 95 (92 to 97) | 5% FPR |
| Second trimester ß‐core fragment and oestriol | 2 | 1631 (92) | 73 (57 to 85) | 95 | 5% FPR |
| Second trimester AFP and ß‐core fragment to oestriol ratio | 1 | 356 (10) | 90 (55 to 100) | 95 (93 to 97) | 1:58 risk |
| *Tests evaluated by at least one study are presented in the table. Where two studies reported the same threshold, estimates of summary sensitivity and summary specificity were obtained by using univariate fixed effects logistic regression models to pool sensitivities and specificities separately. if the threshold used was a 5% FPR, then only the sensitivities were pooled. AFP: alpha‐fetoprotein; ßhCG: beta human chorionic gonadotrophin;CI: confidence interval; CVS: chorionic villus sampling; FPR: false positive rate; hCG: beta human chorionic gonadotrophin;ITA: invasive trophoblast antigen; uE3: unconjugated oestriol | |||||
Background
This is one of a series of reviews on antenatal screening for Down's syndrome following a generic protocol (Alldred 2010) ‐ see Published notes for more details.
Target condition being diagnosed
Down’s syndrome
Down’s syndrome affects approximately one in 800 live‐born babies (Cuckle 1987a). It results from a person having three, rather than two, copies of chromosome 21—or the specific area of chromosome 21 implicated in causing Down's syndrome, as a result of trisomy or translocation. If not all cells are affected, the pattern is described as 'mosaic'. Down’s syndrome can cause a wide range of physical and mental problems. It is the commonest cause of mental disability, and is also associated with a number of congenital malformations, notably affecting the heart. There is also an increased risk of cancers such as leukaemia, and numerous metabolic problems including diabetes and thyroid disease. Some of these problems may be life‐threatening, or lead to considerable ill health, while some individuals with Down’s syndrome have only mild problems and can lead a relatively normal life.
There is no cure for Down’s syndrome, and antenatal diagnosis allows for preparation for the birth and subsequent care of a baby with Down’s syndrome, or for the offer of a termination of pregnancy. Having a baby with Down’s syndrome is likely to have a significant impact on family and social life, relationships and parents’ work. Special provisions may need to be made for education and care of the child, as well as accommodating the possibility of periods of hospitalisation.
Definitive invasive tests (amniocentesis and chorionic villus sampling (CVS)) exist that allow the diagnosis of Down's syndrome before birth, but carry a risk of miscarriage. No test can predict the severity of problems a person with Down’s syndrome will have. Noninvasive screening tests based on biochemical analysis of maternal serum or urine, or fetal ultrasound measurements, allow an estimate of the risk of a pregnancy being affected and provide parents with information to enable them to make choices about definitive testing. Such screening tests are used during the first and second trimester of pregnancy.
Screening tests for Down's syndrome
Initially, screening was determined solely by using maternal age to classify a pregnancy as high or low risk for trisomy 21, as it was known that older women had a higher chance of carrying a baby with Down’s syndrome (Penrose 1933).
Further advances in screening were made in the early 1980s, when Merkatz et al investigated the possibility that low maternal serum alpha‐fetoprotein (AFP), obtained from maternal blood in the second trimester of pregnancy could be associated with chromosomal abnormalities in the fetus. Their retrospective case‐control study showed a statistically significant relationship between fetal trisomy, such as Down’s syndrome, and lowered maternal serum AFP (Merkatz 1984). This was further explored by Cuckle et al in a larger retrospective trial using data collected as part of a neural tube defect (NTD) screening project (Cuckle 1984). This work was followed by calculation of risk estimates using maternal serum AFP values and maternal age, which ultimately led to the introduction of the two screening parameters in combination (Alfirevic 2004).
In 1987, in a small case‐control study of women carrying fetuses with known chromosomal abnormalities, Bogart and colleagues investigated maternal serum levels of human chorionic gonadotrophin (hCG) as a possible screening tool for chromosomal abnormalities in the second trimester (Bogart 1987). This followed the observations that low hCG levels were associated with miscarriages, which are commonly associated with fetal chromosomal abnormalities. They concluded that high hCG levels were associated with Down’s syndrome and because hCG levels plateau at 18 to 24 weeks, that this would be the most appropriate time for screening. Later work suggested that the ß sub‐unit of hCG was a more effective marker than total hCG (Macri 1990; Macri 1993).
Second trimester unconjugated oestriol (uE3), produced by the fetal adrenals and the placenta, was also evaluated as a potential screening marker. In another retrospective case‐control study, uE3 was shown to be lower in Down’s syndrome pregnancies compared with unaffected pregnancies. When used in combination with AFP and maternal age, it appeared to identify more pregnancies affected by Down’s syndrome than AFP and age alone (Canick 1988). Further work suggested that all three serum markers (AFP, hCG and uE3) showed even higher detection rates when combined with maternal age (Wald 1988a; Wald 1988b) and appeared to be a cost‐effective screening strategy (Wald 1992a).
Two other serum markers, produced by the placenta, have been linked with Down’s syndrome, namely pregnancy‐associated plasma protein A or PAPP‐A, and Inhibin A. PAPP‐A has been shown to be reduced in the first trimester of Down’s syndrome pregnancies, with its most marked reduction in the early first trimester (Bersinger 1995). Inhibin A is high in the second trimester in pregnancies affected by Down’s syndrome (Cuckle 1995a; Wallace 1995). There are some issues concerning the biological stability and hence reliability of this marker, and the effect this will have on individual risk.
In addition to serum and ultrasound markers for Down’s syndrome, work has been carried out looking at urinary markers. These markers include invasive trophoblast antigen, ß‐core fragment, free ßhCG and total hCG (Cole 1999a). There is controversy about their value (Wald 2003a).
Screening and parental choice
Antenatal screening is used for several reasons (Alfirevic 2004), but the most important is to enable parental choice regarding pregnancy management and outcome. Before a woman and her partner opt to have a screening test, they need to be fully informed about the risks, benefits and possible consequences of such a test. This includes the choices they may have to face should the result show that the woman has a high risk of carrying a baby with Down’s syndrome and the implications of both false positive and false negative screening tests. They need to be informed of the risk of a miscarriage due to invasive diagnostic testing, and the possibility that a miscarried fetus may be chromosomally normal. If, following invasive diagnostic testing, the fetus is shown to have Down’s syndrome, further decisions need to be made about continuation or termination of the pregnancy, the possibility of adoption and finally, preparation for parenthood. Equally, if a woman has a test that shows she is at a low risk of carrying a fetus with Down’s syndrome, it does not necessarily mean that the baby will be born with a normal chromosomal make up. This possibility can only be excluded by an invasive diagnostic test (Alfirevic 2003).The decisions that may be faced by expectant parents inevitably engender a high level of anxiety at all stages of the screening process, and the outcomes of screening can be associated with considerable physical and psychological morbidity. No screening test can predict the severity of problems a person with Down's syndrome will have.
Index test(s)
This review examined urine screening tests used in the first and second trimester of pregnancy (up to 24 weeks' gestation) comprised of the following individual markers; AFP; invasive trophoblast antigen (ITA) (also known as hyperglycosylated hCG); ß‐core fragment; free ßhCG; total hCG; uE3 (oestriol); gonadotropin peptide; and various marker ratios. These markers can be used individually, in combination with age, and can also be used in combination with each other. The risks are calculated by comparing a woman's test result for each marker with values for an unaffected population, and multiplying this with her age‐related risk. Where several markers are combined, risks are computed using risk equations (often implemented in commercial software) that take into account the correlational relationships between the different markers and marker distributions in affected and unaffected populations.
Alternative test(s)
Down’s syndrome can be detected during pregnancy with invasive diagnostic tests such as amniocentesis or CVS, with or without prior screening. These tests are considered to be reference tests rather than index or screening tests. The ability to determine fetal chromosomal make up (also known as a karyotype) from amniotic fluid samples was demonstrated in 1966 by Steele and Breg (Steele 1966), and the first antenatal diagnosis of Down’s syndrome was made in 1968 (Vaklenti 1968). Amniocentesis is an invasive procedure that involves taking a small sample of the amniotic fluid (liquor) surrounding the baby, using a needle which goes through the abdominal wall into the uterus, and is usually performed after 15 weeks' gestation. Chorionic villus sampling involves taking a sample of the placental tissue using a needle which goes through the abdominal wall and uterus or a cannula through the cervix. It is usually performed between 10 and 13 weeks' gestation. Amniocentesis and CVS are both methods of obtaining fetal chromosome material, which are then used to diagnose Down’s syndrome. Both tests use ultrasound scans to guide placement of the needle. Amniocentesis carries a risk of miscarriage in the order of 1%; transabdominal CVS may carry a similar risk (Alfirevic 2003). Recent developments in the use of cell‐free fetal DNA detection in maternal serum are paving the way for noninvasive diagnosis of Down's syndrome and other trisomies, however these tests were not used as reference standards in any of the studies examined.
Many different screening tests are available and offered to pregnant women, and these tests are the subject of additional Cochrane reviews published (Alldred 2012) or currently in preparation, and other published reviews. Tests being assessed in other Cochrane reviews include first trimester serum tests; second trimester serum tests; first trimester ultrasound markers; tests that combine serum and ultrasound markers; and tests that combine markers from the first trimester with markers from the second trimester. Second trimester ultrasound markers have been assessed in a previous systematic review (Smith‐Bindman 2001).
Rationale
This is one of a suite of Cochrane reviews, the aim of which is to identify all screening tests for Down's syndrome used in clinical practice, or evaluated in the research setting, in order to try to identify the most accurate test(s) available, and to provide clinicians, policy‐makers and women with robust and balanced evidence on which to base decisions about interpreting test results and implementing screening policies to triage the use of invasive diagnostic testing. The full set of reviews is described in the generic protocol (Alldred 2010).
The topic has been split into several different reviews to allow for greater ease of reading and greater accessibility of data, and also to allow the reader to focus on separate groups of tests, for example, first trimester serum tests alone, first trimester ultrasound alone, first trimester serum and ultrasound, second trimester serum alone, first and second trimester serum, combinations of serum and ultrasound markers and urine markers alone. An overview review will compare the best tests, focusing on commonly used strategies from each of these groups to give comparative results between the best tests in the different categories. This review is written with a global perspective in mind, rather than to conform with any specific local or national policy, as not all tests will be available in all areas where screening for Down's syndrome is carried out.
A systematic review of second trimester ultrasound markers in the detection of Down’s syndrome fetuses was published in 2001 that concluded that nuchal fold thickening may be useful in detecting Down’s syndrome, but that it was not sensitive enough to use as a screening test. The review concluded that the other second trimester ultrasound markers did not usefully distinguish between Down’s syndrome and pregnancies without Down’s syndrome (Smith‐Bindman 2001). There has yet to be a systematic review and meta‐analysis of the observed data on serum, urine and first trimester ultrasound markers, in order to draw rigorous and robust conclusions about the diagnostic accuracy of available Down’s syndrome screening tests.
Objectives
The aim of this review was to estimate and compare the accuracy of first and second trimester urine markers for the detection of Down’s syndrome in the antenatal period, both as individual markers and as combinations of markers. Accuracy is described by the proportion of fetuses with Down’s syndrome detected by screening before birth (sensitivity or detection rate), and the proportion of women with a low risk (normal) screening test result who subsequently had a baby unaffected by Down's syndrome (specificity). We grouped our analyses to focus on investigating the value of adding increasing numbers of markers (comparing single, dual, triple and quadruple tests).
Investigation of sources of heterogeneity
We planned to investigate whether a uniform screening test is suitable for all women, or whether different screening methods are more applicable to different groups, defined by advanced maternal age, ethnic groups and aspects of the pregnancy and medical history such as multiple pregnancy, diabetes and family history of Down's syndrome. We also considered whether there existed evidence of overestimation of test accuracy in studies evaluating risk equations in the derivation sample rather than in a separate validation sample.
Methods
Criteria for considering studies for this review
Types of studies
We included studies in which all women from a given population had one or more index test(s) compared to a reference standard. Both consecutive series and diagnostic case‐control study designs were included. Randomised trials where individuals were randomised to different screening strategies and all verified using a reference standard were also eligible for inclusion. Studies in which test strategies were compared head‐to‐head, either in the same women, or between randomised groups were identified for inclusion in separate comparisons of test strategies. Studies were excluded if they included less than five Down's syndrome cases, or more than 20% of participants were not followed up.
Participants
Pregnant women at less than 24 weeks' gestation confirmed by ultrasound, who had not undergone previous testing for Down’s syndrome in their pregnancy were eligible. Studies were included if the pregnant women were unselected, or if they represented groups with increased risk of Down’s syndrome, or difficulty with conventional screening tests including maternal age greater than 35 years old, multiple pregnancy, diabetes mellitus and family history of Down’s syndrome.
Index tests
The following index tests were examined; AFP; ITA; ß‐core fragment; free ßhCG; total hCG; oestriol (also termed as uE3); gonadotropin peptide and various marker ratios and combinations of these markers combined with maternal age. Combinations without maternal age were not included in the test comparisons (Table 1; Table 2), however, information on such test combinations is provided.
| Ratio of DORs (95% CI); P values (studies) | Second trimester AFP and ß‐core fragment to oestriol ratio, risk 1:58 | Second trimester ß‐core fragment and oestriol, 5% FPR | Second trimester ITA, 5% FPR | Second trimester ß‐core fragment to oestriol ratio, 5% FPR |
| Second trimester ß‐core fragment and oestriol, 5% FPR | – | |||
| Second trimester ITA, 5% FPR | – | – | ||
| Second trimester ß‐core fragment to oestriol ratio, 5% FPR | – | 1.5 (0.7 to 3.0); P = 0.27 (K = 2) | ||
| Second trimester ß‐core fragment, 5% FPR | – | 2.2 (1.1 to 4.5); P = 0.02 (K = 2) | – | 1.5 (0.8 to 2.8); P = 0.21 (K = 3) |
Direct comparisons were made using only data from studies that compared each pair of tests in the same population. Ratio of diagnostic odds ratios (DOR)s were computed by division of the DOR for the test in the column by the DOR for the test in the row. If the ratio of DORs is greater than one, then the diagnostic accuracy of the test in the column is higher than that of the test in the row; if the ratio is less than one, the diagnostic accuracy of the test in the row is higher than that of the test in the column.
AFP: alpha‐fetoprotein; CI: confidence interval; DORs: diagnostic odds ratio; FPR: false positive rate; ITA: invasive trophoblast antigen
| Ratio of DOR (95% CI); P value | Second trimester AFP and ß‐core fragment to oestriol ratio, risk 1:58 | Second trimester ß‐core fragment and oestriol, 5% FPR | Second trimester ITA, 5% FPR | Second trimester ß‐core fragment to oestriol ratio, 5% FPR | ||
| Studies | 1 | 2 | 1 | 3 | ||
| Studies | DOR (95% CI) | 186 (22, 1560) | 50 (30 to 84) | 43 (17 to 110) | 38 (24 to 59) | |
| Second trimester ß‐core fragment and oestriol, 5% FPR | 2 | 50 (30 to 84) | 3.7 (0.4 to 33.0); P = 0.24 | |||
| Second trimester ITA, 5% FPR | 1 | 43 (17 to 110) | 4.3 (0.4 to 44.0); P = 0.22 | 1.2 (0.4 to 3.4); P = 0.78 | ||
| Second trimester ß‐core fragment to oestriol ratio, 5% FPR | 3 | 38 (24 to 59) | 4.9 (0.6 to 43.4); P = 0.15 | 1.3 (0.7 to 2.6); P = 0.41 | 1.1 (0.4 to 3.2); P = 0.80 | |
| Second trimester ß‐core fragment, 5% FPR | 5 | 25 (18 to 36) | 7.3 (0.8 to 63.1); P = 0.07 | 2.0 (1.1 to 3.7); P = 0.03 | 1.7 (0.6 to 4.6); P = 0.30 | 1.5 (0.8 to 2.6); P = 0.18 |
Indirect comparisons were made using all available data. Ratio of diagnostic odds ratios (DOR)s were computed by division of the DOR for the test in the column by the DOR for the test in the row. If the ratio of DORs is greater than one, then the diagnostic accuracy of the test in the column is higher than that of the test in the row; if the ratio is less than one, the diagnostic accuracy of the test in the row is higher than that of the test in the column.
AFP: alpha‐fetoprotein; CI: confidence interval; DORs: diagnostic odds ratio; FPR: false positive rate; ITA: invasive trophoblast antigen
We looked at comparisons of tests in isolation and in various combinations. These included single (one marker), double (two markers), triple (three markers), test strategies, all maternal age‐adjusted.
Where tests were used in comparison, we looked at the performance of test comparisons according to predicted probabilities computed using risk equations and dichotomised into high risk and low risk.
Target conditions
Down's syndrome in the fetus due to trisomy, translocation or mosaicism.
Reference standards
We considered several reference standards, involving chromosomal verification and postnatal macroscopic inspection.
Amniocentesis and CVS are invasive chromosomal verification tests undertaken during pregnancy. They are highly accurate, but the process carries a 1% miscarriage rate, and therefore they are only used in pregnancies considered to be at high risk of Down's syndrome, or on the mother's request. All other types of testing (postnatal examination, postnatal karyotyping, birth registers and Down’s syndrome registers) are based on information available at the end of pregnancy. The greatest concern is not their accuracy, but the loss of the pregnancy to miscarriage between the urine test and the reference standard. Miscarriage with cytogenetic testing of the fetus is included in the reference standard where available. We anticipated that older studies, and studies undertaken in older women were more likely to have used invasive chromosomal verification tests in all women.
Studies undertaken in younger women and more recent studies were likely to use differential verification as they often only used prenatal karyotypic testing on fetuses considered screen positive/high risk according to the screening test; the reference standard for most unaffected infants being observing a phenotypically normal baby. Although the accuracy of this combined reference standard is considered high, it is methodologically a weaker approach as pregnancies that miscarry between the index test and birth are likely to be lost from the analysis, and miscarriage is more likely to occur in Down's than normal pregnancies. We investigated the impact of the likely missing false negative results in sensitivity analyses.
Search methods for identification of studies
Electronic searches
We applied a sensitive search strategy to search the following databases. We used one broad generic search strategy to identify studies for all reviews in this series.
Databases searched included;
-
MEDLINE via OVID (1980 to 25 August 2011)
-
EMBASE via Dialog Datastar (1980 to 25 August 2011)
-
BIOSIS via EDINA (1985 to 25 August 2011)
-
CINAHL via OVID (1982 to 25 August 2011)
-
The Database of Abstracts of Reviews of Effectiveness (The Cochrane Library 2011, Issue 7)
-
MEDION (25 August 2011)
-
The Database of Systematic Reviews and Meta‐Analyses in Laboratory Medicine (www.ifcc.org/) (25 August 2011)
-
The National Research Register (archived 2007)
-
Health Services Research Projects in Progress database (HSRPROJ) (25 August 2011)
The search strategy combined three sets of search terms (seeAppendix 1). The first set was made up of named tests, general terms used for screening/diagnostic tests and statistical terms. Note that the statistical terms were used to increase sensitivity and were not used as a methodological filter to increase specificity. The second set was made up of terms that encompass Down syndrome and the third set made up of terms to limit the testing to pregnant women. All terms within each set were combined with the Boolean operator OR and then the three sets were combined using AND. The terms used were a combination of subject headings and free text terms. The search strategy was adapted to suit each database searched.
We attempted to identify cumulative papers that reported data from the same data set, and we contacted authors to obtain clarification of the overlap between data presented in these papers, in order to prevent data from the same women being analysed more than once.
Searching other resources
In addition, we examined references cited in studies identified as being potentially relevant, and those cited by previous reviews. We contacted authors of studies where further information was required. We did not apply a diagnostic test filter, and we did not apply language restrictions to the search.
We carried out forward citation searching of relevant items, using the search strategy in ISI citation indices, Google scholar and Pubmed ‘related articles’.
Data collection and analysis
Selection of studies
Two review authors screened the titles and abstracts (where available) of all studies identified by the search strategy. We obtained full‐text versions of studies identified as being potentially relevant and two review authors independently assessed these for inclusion, using a study eligibility screening pro forma according to the pre‐specified inclusion criteria. Any disagreement between the two review authors was settled by consensus, or where necessary, by a third party.
Data extraction and management
We developed a data extraction form and piloted the form using a subset of 20 identified studies (from all identified studies in this suite of reviews). Two review authors independently extracted data, and where disagreement or uncertainty existed, a third review author validated the information extracted.
Data on each marker were extracted as binary test positive/test negative results for Down's and non‐Down's pregnancies, with a high risk‐result, as defined by each individual study, being regarded as test positive (suggestive or diagnostic of Down's syndrome), and a low‐risk result being regarded as test negative (suggestive of absence of Down's syndrome). Where results were reported at several thresholds, we extracted data at each threshold.
We noted those in special groups that posed either increased risk of Down’s syndrome or difficulty with conventional screening tests, including maternal age greater than 35 years old, multiple pregnancy, diabetes mellitus and family history of Down’s syndrome.
Assessment of methodological quality
We used a modified version of the QUADAS tool (Whiting 2003), a quality assessment tool for use in systematic reviews of diagnostic accuracy studies, to assess the methodological quality of included studies. We anticipated that a key methodological issue would be the potential for bias arising from the differential use of invasive testing and follow‐up for the reference standard according to index test results, bias arising due to higher loss to miscarriage in false negatives than true negatives. We chose to code this issue as originating from differential verification in the QUADAS tool: we are aware that it could also be coded under delay in obtaining the reference standard, and reporting of withdrawals. We omitted the QUADAS item assessing quality according to length of time between index and reference tests, as Down's syndrome is either present or absent rather than a condition that evolves and resolves, and disregarding the differential reference standard issue thus any length of delay is acceptable. Two review authors assessed each included study separately. Any disagreement between the two authors was settled by consensus, or where necessary, by a third party. Each item in the QUADAS tool was marked as ‘yes’, ‘no’ or ‘unclear’, and scores were summarised graphically. We did not use a summary quality score.
QUADAS criteria included the following 10 questions.
-
Was the spectrum of women representative of the women who will receive the test in practice? (Criteria met if the sample was selected from a wide range of childbearing ages, or selected from a specified ‘high‐risk’ group such as over 35s, family history of Down’s syndrome, multiple pregnancy or diabetes mellitus, provided all affected and unaffected fetuses included that could be tested at the time point when the screening test would be applied; criteria not met if the sample taken from a select or unrepresentative group of women (i.e. private practice), was an atypical screening population or recruited at a later time point when selection could be affected by selective fetal loss).
-
Is the reference standard likely to correctly classify the target condition? (Amniocentesis, CVS, postnatal karyotyping, miscarriage with cytogenetic testing of the fetus, a phenotypically normal baby or birth registers are all regarded as meeting this criteria).
-
Did the whole sample or a random selection of the sample receive verification using a reference standard of diagnosis?
-
Did women receive the same reference standard regardless of the index test result?
-
Was the reference standard independent of the index test result (i.e. the index test did not form part of the reference standard)?
-
Were the index test results interpreted without knowledge of the results of the reference standard?
-
Were the reference standard results interpreted without knowledge of the results of the index test?
-
Were the same clinical data (i.e. maternal age and weight, ethnic origin, gestational age) available when test results were interpreted as would be available when the test is used in practice?
-
Were uninterpretable/intermediate test results reported?
-
Were withdrawals from the study explained?
Statistical analysis and data synthesis
We initially examined each test or test strategy at each of the common risk thresholds used to define test positivity by plotting estimates of sensitivity and specificity from each study on forest plots and in receiver operating characteristic (ROC) space. Test strategies were selected for further investigation if they were evaluated in four or more studies or, if there were three or fewer studies, but the individual study results indicated performance likely to be superior to a sensitivity of 70% and specificity of 90%.
Estimation of average sensitivity and specificity
The analysis for each test strategy was undertaken first restricting to studies that reported a common threshold to estimate average sensitivity and specificity for each test at each threshold. Although data on all thresholds were extracted, we present only key common thresholds close to risks of 1:384, 1:250 and the 5% false positive rate (FPR), unless other thresholds were more commonly reported. Where combinations of tests were used in a risk score, we extracted the result for the test combination using the risk score and not the individual components that made up the test.
We undertook meta‐analyses using hierarchical summary ROC (HSROC) models, which included estimation of random effects in accuracy and threshold parameters when there were four or more studies. Otherwise, average sensitivity and specificity values were computed by using univariate random‐effects logistic regression models to average logit sensitivity and logit specificity separately because of insufficient number of studies to reliably estimate all the parameters in the HSROC model. It is common in this field for studies to report sensitivity for a fixed specificity (usually a 5% FPR). This removes the requirement to account for the correlation between sensitivity and specificity across studies by using a bivariate meta‐analytical method since all specificities are the same value. Thus, at a fixed specificity value, logit sensitivities were pooled using a univariate random‐effects model. This model was further simplified to a fixed‐effect model when there were only two or three studies and heterogeneity was not observed on the SROC plot. All analyses were undertaken using the NLMIXED procedure in SAS (version 9.2; SAS Institute, Cary, NC) and the xtmelogit command in Stata version 11.2 (Stata‐Corp, College Station, TX, USA).
Comparisons between tests
We made comparisons between tests, first by utilising all available studies, selecting one threshold from each study to estimate a SROC curve without restricting to a common threshold. The threshold was chosen for each study according to the following order of preference: a) the risk threshold closest to one in 250; b) a multiples of the median (MoM) or presence/absence threshold; c) the performance closest to a 5% FPR or 95th percentile. The 5% FPR was chosen as a cut‐off point as this is the cut‐off most commonly reported in the literature. The analysis that used all available studies was performed by including the most evaluated or best performing test strategies in a single HSROC model. The model included two indicator terms for each test to allow for differences in accuracy and threshold. As there were very few studies for each test, a symmetric summary ROC curve was assumed. In addition, because the model failed to converge, we assumed fixed‐effect for the threshold and accuracy parameters. An estimate of the sensitivity of each test for a 5% FPR was derived from the SROC curve, and we obtained associated confidence intervals using the delta method.
Direct comparisons between tests were based on results of very few studies, and were analysed using a simplified HSROC model with fixed‐effect and symmetrical underlying SROC curves because the number of studies was insufficient to estimate between study heterogeneity in accuracy and threshold or asymmetry in the shape of the SROC curves. We used a separate model to make each pair‐wise comparison. We assessed comparisons between tests by using likelihood ratio tests to test if the differences in accuracy were statistically significant or not. We expressed the differences as ratios of diagnostic odds ratios and reported with 95% confidence intervals. As studies rarely report data cross‐classified by both tests for Down's and normal pregnancies, the analytical method did not take full account of the pairing of test results, but the restriction to direct head‐to‐head comparisons should have removed the potential confounding of test comparisons with other features of the studies. The strength of evidence for differences in performance of test strategies relied on evidence from both the direct and indirect comparisons.
Investigations of heterogeneity
Had there been 10 or more studies available for a test, we planned to investigate heterogeneity by adding covariate terms to the HSROC model to assess the effect of a covariate on accuracy and threshold.
Sensitivity analyses
In many of the included studies, mothers with pregnancies identified as high risk for Down's syndrome by the urine testing were offered immediate definitive testing by amniocentesis, whereas the remainder were assessed for Down's syndrome by inspection at birth. Such delayed and differential verification will introduce bias most likely through there being greater loss to miscarriage in the Down's syndrome pregnancies that were not detected by the urine testing (the false negative diagnoses). Testing and detection of miscarriages is impractical in many situations, and no clear data are available on the magnitude of these miscarriage rates.
To account for the possible bias introduced by such a mechanism, we planned to perform sensitivity analyses by increasing the percentage of false negatives in studies where delayed verification in test negatives occurred (Mol 1999). We planned to incrementally increase the percentage from 10% to 50%, the final value representing a scenario where a third of more Down's pregnancies than normal pregnancies were likely to miscarry, thought to be higher than the likely value. We intended to conduct the sensitivity analyses on the analysis investigating the effect of maternal age on test sensitivity.
Results
Results of the search
The search for the whole suite of reviews identified a total of 15,394 papers, once the results from each bibliographic database were combined and duplicates were removed. After screening out obviously inappropriate papers based on their title and abstract, 1145 papers remained and we obtained full‐text copies for formal assessment of eligibility. From these, a total of 269 papers were deemed eligible and were included in the suite of reviews. We included a total of 19 studies (reported in 29 publications) in this review of urine tests, involving 18,013 pregnancies, of which 527 were Down's syndrome pregnancies.
A total of 24 different test strategies or combinations, at one or more thresholds, were evaluated in the 19 studies. These tests were produced from combinations of seven different urine tests (and their ratios) with and without maternal age: AFP; ITA; ß‐core fragment; free ßhCG; total hCG; oestriol; gonadotropin peptide and various marker ratios. Strategies evaluated included three double tests and seven single tests in combination with maternal age, and one triple test, two double tests and 11 single tests without maternal age. Twelve of the 19 studies only evaluated the performance of a single test strategy while the remaining seven evaluated at least two test strategies.
The following combinations evaluated included four or more studies.
-
Second trimester ß‐core fragment (six studies; 9615 women with 193 affected Down's pregnancies)
-
Second trimester ß‐core fragment and maternal age (five studies; 3419 women with 155 Down's pregnancies)
Methodological quality of included studies
We judged the studies to be of high methodological quality in most categories (Figure 1). Due to the nature of testing for Down's syndrome screening and the potential side effects of invasive testing, differential verification is almost universal in the general screening population, as most women whose screening test result is defined as low risk will have their screening test verified at birth, rather than by invasive diagnosis in the antenatal period. Additionally, it was not always possible to ascertain from the included studies whether or not the results of index tests and reference standards were blinded. It would be difficult to blind clinicians performing invasive diagnostic tests (reference standards) to the index test result, unless all women received the same reference standard, which would not be appropriate in most scenarios. Any biases secondary to a lack of clinician blinding are likely to be minimal.
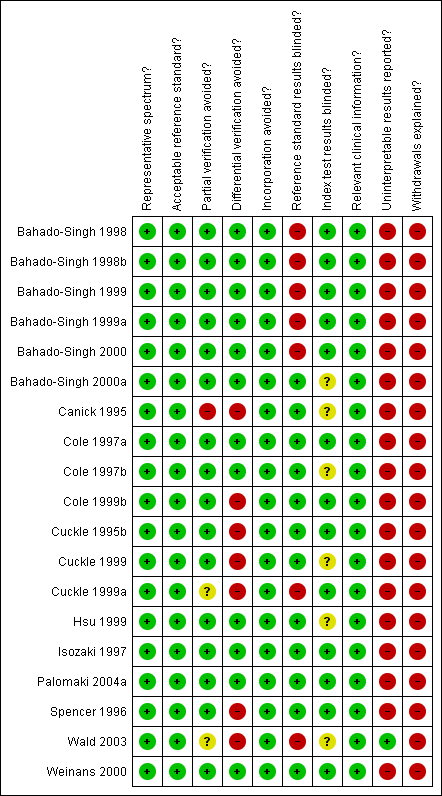
Methodological quality summary: review authors' judgements about each methodological quality item for each included study.
Most studies seemed to indicate 100% follow‐up, however there will inevitably be losses to follow‐up due to women moving out of area, for example. Studies sometimes accounted for these and it is unlikely that there were enough losses to follow‐up to have introduced significant bias. There was likely under‐ascertainment of miscarriage, and very few papers accounted for miscarriage, or performed tissue karyotyping in pregnancies resulting in miscarriage. Some studies attempted to adjust for predicted miscarriage rate and the incidence of Down's syndrome in this specific population, but most did not. We have not attempted to adjust for expected miscarriage rate in this review. There is a higher natural miscarriage rate in the first trimester, however this will be uniform across studies and therefore unlikely to introduce significant bias.
Some studies that provided estimates of risk using multivariable equations used the same data set to evaluate performance of the risk equation as was used to derive the equation. This is often thought to lead to over‐estimation of test performance.
Findings
1) Second trimester ß‐core fragment
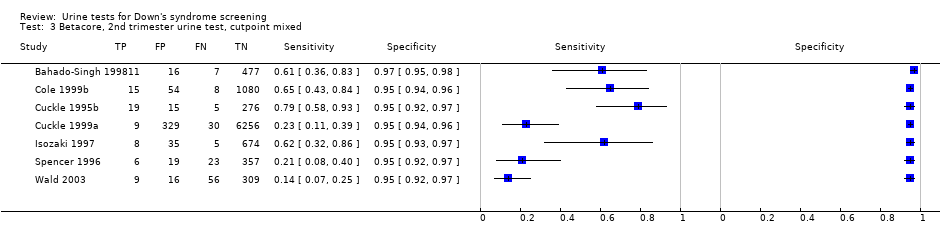
Results for this single test were derived from six studies (Cole 1999b; Cuckle 1995b; Cuckle 1999a; Isozaki 1997; Spencer 1996; Wald 2003), and included 9615 women in whom 193 pregnancies were known to be affected by Down's syndrome. Two studies (Cole 1999b; Cuckle 1999a) contributed over 7000 pregnancies to the data. Six studies (Cole 1999b; Cuckle 1995b; Cuckle 1999a; Isozaki 1997; Spencer 1996; Wald 2003) presented data for a cut‐point of 5% FPR and the estimated sensitivity was 41% (95% confidence interval (CI) 20 to 66).
2) Second trimester ß‐core fragment and maternal age
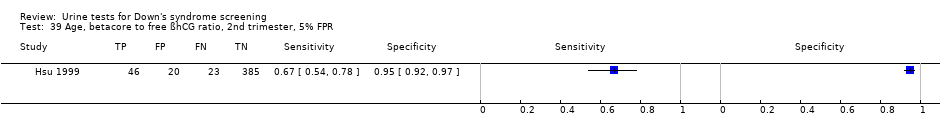
Results for this single test were derived from five studies (Bahado‐Singh 1999; Bahado‐Singh 1999a; Cole 1999b; Hsu 1999; Spencer 1996), and included 3419 women in whom 155 pregnancies were known to be affected by Down's syndrome. Cole 1999b contributed over 1000 pregnancies to the data. The studies presented data at a cut‐point of 5% FPR and the summary sensitivity was 56% (95% CI 45 to 66).
3) Other test combinations
Of the 22 test combinations evaluated in three or fewer studies, nine test combinations demonstrated estimated sensitivities of more than 70% and estimated specificities of more than 90%. Six of these were evaluated in single studies (see summary of findings Table), and the following three test combinations were evaluated in two or more studies.
-
Second trimester ß‐core fragment to oestriol ratio evaluated in two studies (Cole 1997b; Cole 1999b), with a summary sensitivity of 74% (95% CI 58 to 86) at a cut‐point of 5% FPR.
-
Second trimester ß‐core fragment to oestriol ratio and maternal age evaluated in three studies (Bahado‐Singh 1999; Cole 1999b; Hsu 1999), with a summary sensitivity of 71% (95% CI 51 to 86) at a cut‐point of 5% FPR.
-
Second trimester ß‐core fragment, oestriol and maternal age evaluated in two studies (Cole 1999b; Hsu 1999), with a summary sensitivity of 73% (95% CI 57 to 85) at a cut‐point of 5% FPR.
Comparative analyses of the five selected test strategies
For each test we obtained the detection rate (sensitivity) for a fixed FPR (1‐specificity), a metric which is commonly used in Down’s syndrome screening to describe test performance. We chose to estimate detection rates at a 5% FPR in common with much of the literature. Figure 2 shows point estimates of the detection rate (and their 95% CIs) at a 5% FPR based on all available data for the five test strategies; the test strategies are ordered according to decreasing detection rates. The plot shows that all five test strategies have detection rates between 56% and 90%. The combination of second trimester AFP and ß‐core fragment to oestriol ratio with maternal age showed the highest detection rate with an estimated detection rate of 90% (CI 55 to 100), based on data from one study with 10 affected cases out of a total of 356 pregnancies. The worst performing strategy was the combination of ß‐core fragment to oestriol ratio and maternal age, with an estimated detection rate of 56% (CI 45 to 66), based on data from five studies with 155 affected cases out of a total of 3419 pregnancies.

Detection rates (% sensitivity) at a 5% false positive rate for the five most evaluated or best performing test strategies. The estimates are shown with 95% confidence intervals. The test strategies are ordered on the plot according to decreasing detection rate. The number of studies, cases and women included for each test strategy are shown on the horizontal axis.
Table 1 shows pair‐wise direct comparisons (head‐to‐head) where studies were available. Such comparisons are regarded as providing the strongest evidence as they are unconfounded. The table shows the ratio of diagnostic odds ratio (RDOR) with 95% CI and P values for each test combination, the number of studies (K) for which data were available. The table shows that the diagnostic accuracy of the double marker combination of second trimester ß‐core fragment and oestriol with maternal age was significantly better (RDOR 2.2 (95% CI 1.1 to 4.5); P = 0.02) than the single marker second trimester ß‐core fragment and maternal age test strategy but was not significantly better (RDOR 1.5 (95% CI 0.8 to 2.8); P = 0.21) than that of the second trimester ß‐core fragment to oestriol ratio and maternal age test strategy. However, the comparisons in this table were based on two or three studies and are unlikely to be powered to detect differences in detection rates.
Table 2 shows the same comparisons made using all available data (as used to create Figure 2). Results are in agreement with the direct comparisons, and in addition, showed no significant differences between any of the other pair of tests for which direct comparisons were not available. However, these comparisons are potentially confounded by differences between the studies, and the evidence is limited.
Investigation of heterogeneity and sensitivity analyses
None of the tests was evaluated by 10 or more studies and so we were unable to investigate the effect of maternal age or any other potential source of heterogeneity. The planned sensitivity analyses, looking at differential verification and any resultant bias, were also not possible.
Discussion
Summary of main results
The systematic review found 19 studies evaluating urinary markers for Down's syndrome screening. Very few studies provided unconfounded comparisons of test strategies by applying and comparing several strategies using the same urine sample; the majority of studies only evaluating a single test combination. A summary of results for the 24 strategies is given in summary of findings Table.
The following key findings were noted.
-
There is evidence from direct comparison to support the use of multiple marker urine tests in combination with age for screening ‐ the double marker combination of second trimester ß‐core fragment and oestriol with maternal age test strategy was significantly better (ratio of diagnostic odds ratio (RDOR) 2.2 (95% CI 1.1 to 4.5); P = 0.02) than the single marker second trimester ß‐core fragment and maternal age. This is reflected in the indirect comparison of the two tests.
-
There was little evidence that urine markers are of value in screening for Down's syndrome. Marker combinations evaluated by more than three studies showed low detection rates for a 5% false positive rate (FPR). More promising markers were investigated in fewer than three studies.
-
In indirect comparisons, with the exception of the difference in accuracy between the single marker second trimester ß‐core fragment and maternal age test and the double marker combination of second trimester ß‐core fragment and oestriol with maternal age, there was no significant difference in the detection rates between tests, however, the number of included studies was small.
Strengths and weaknesses of the review
This is the first comprehensive systematic review of urine tests for Down's syndrome screening. We examined papers from around the world, covering a wide cross‐section of women in varying populations. We contacted authors to verify data where necessary to give as complete a picture as possible while trying to avoid replication of data.
There were a number of factors that have made meta‐analysis of the data difficult, which we have tried to adapt for in order to allow for comparability of data presented in different studies.
-
There were many different cut‐points used to define pregnancies as high or low risk for Down's syndrome. This means that direct comparison is more difficult than if all studies used the same cut‐point to dichotomise their populations.
-
There were many different risk equations and software applications in use for combination of multiple markers, which were often not described in the papers. This means that risks may be calculated by different formulae, and they may not be directly comparable for this reason.
-
Different laboratories and clinics run different assays and use different machines and methods. This may influence raw results and subsequent risk calculations. Many laboratories have a quality assessment/audit trail, however, this may not necessarily be standard across the board, for example, how many assays are run, how often medians are calculated and adjusted for a given population and how quickly samples are tested from initially being taken.
-
Very few studies make direct comparisons between tests, making it difficult to detect if there is a real difference between tests (i.e. how different tests perform in the same population). There are differences in populations, with assay medians being affected, for example, by race. It is not certain whether it is appropriate to make comparisons between populations which are inherently different.
-
We were unable to perform any of the subgroup analyses that we had originally intended to, as the data simply were not available. The vast majority of papers looking at pregnancies conceived by in vitro fertilisation (IVF), affected by diabetes, multiple gestation or a family history of Down's syndrome involved unaffected pregnancies only.
Applicability of findings to the review question
When planning a screening policy or a clinical screening programme, clinicians and policy makers need to make decisions about a finite number of tests or type of tests that can be offered. These policies are often driven by both the needs of a specific population and by financial resources. Economic analysis was considered to be outside the scope of this review. Many of the tests examined as part of this review are already commercially available and in use in the clinical setting. The studies were carried out on populations of typical pregnant women and therefore, the results should be considered comparable with most pregnant populations encountered in every day clinical practice.
We were unable to extract information about the harms of testing, information about miscarriage rates and uptake of definitive testing as the data were not often available. While it is unlikely that major differences between the tests evaluated here exist in terms of direct harms of testing, as they are all based on a single urine sample, differences in accuracy may lead to differences in the use of definitive testing and its consequent adverse outcomes.

Methodological quality summary: review authors' judgements about each methodological quality item for each included study.

Detection rates (% sensitivity) at a 5% false positive rate for the five most evaluated or best performing test strategies. The estimates are shown with 95% confidence intervals. The test strategies are ordered on the plot according to decreasing detection rate. The number of studies, cases and women included for each test strategy are shown on the horizontal axis.

Betacore, 1st trimester urine test, 5% FPR.

Betacore, 2nd trimester urine test, 5% FPR.
Betacore, 2nd trimester urine test, cutpoint mixed.

Gonadotropin, 2nd trimester urine test, risk 1:100.
Gonadotropin, 2nd trimester urine test, risk 1:384.
Gonadotropin, 2nd trimester urine test, 95% percentile.

ITA, 1st trimester urine test, 5% FPR.

ITA, 2nd trimester urine test, 3.74MoM.
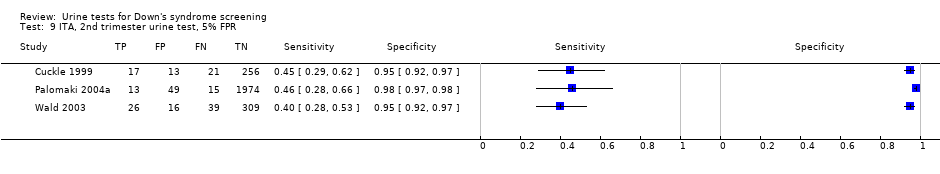
ITA, 2nd trimester urine test, 5% FPR.

Total hCG, 1st trimester urine test, 5% FPR.
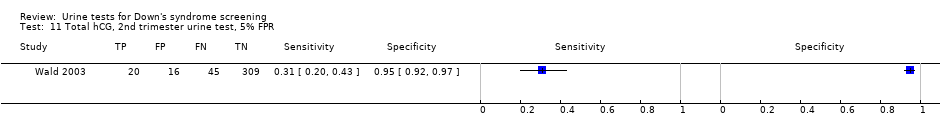
Total hCG, 2nd trimester urine test, 5% FPR.

Free ßhCG, 1st trimester urine test, 5% FPR.

Free ßhCG, 2nd trimester urine test, 5% FPR.

Oestriol, 2nd trimester urine test, 5% FPR.
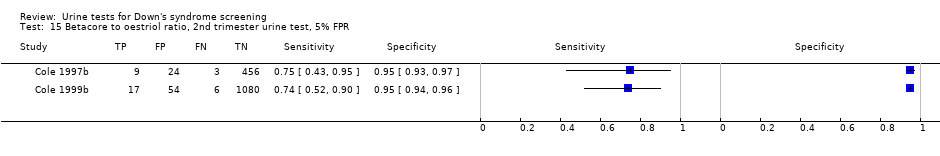
Betacore to oestriol ratio, 2nd trimester urine test, 5% FPR.
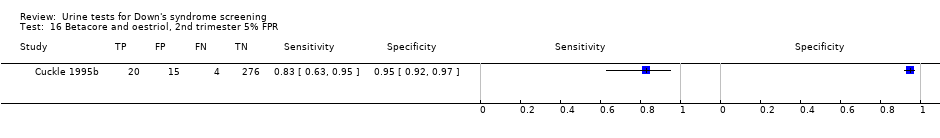
Betacore and oestriol, 2nd trimester 5% FPR.

AFP and ITA, 2nd trimester urine test, 3% FPR.
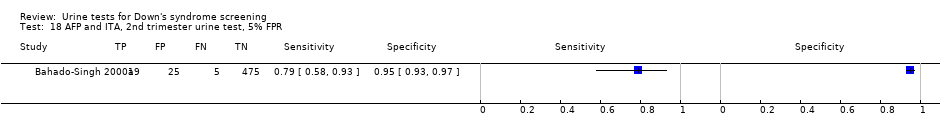
AFP and ITA, 2nd trimester urine test, 5% FPR.

AFP and ITA, 2nd trimester urine test,10% FPR.

AFP and ITA, 2nd trimester urine test, 15% FPR.

AFP, uE3 and ITA, 2nd trimester urine test, 3% FPR.

AFP, uE3 and ITA, 2nd trimester urine test, 5% FPR.

AFP, uE3 and ITA, 2nd trimester urine test, 10% FPR.
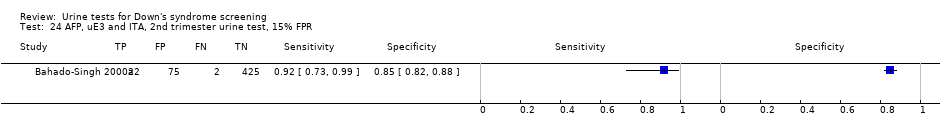
AFP, uE3 and ITA, 2nd trimester urine test, 15% FPR.

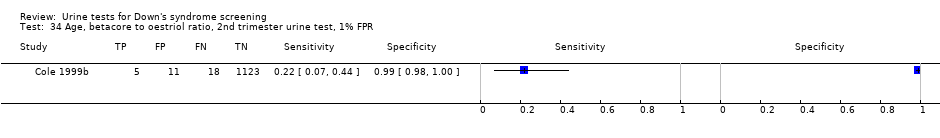
Age, betacore, 2nd trimester urine test, 1% FPR.

Age, betacore, 2nd trimester urine test, 3% FPR.
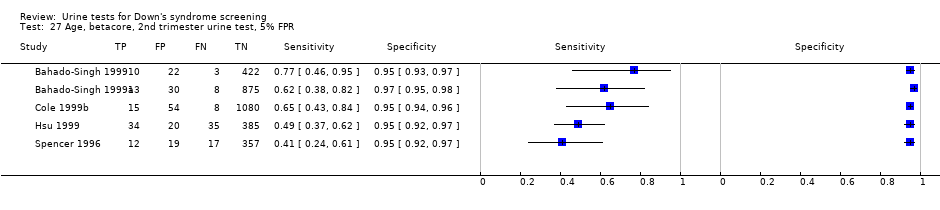
Age, betacore, 2nd trimester urine test, 5% FPR.
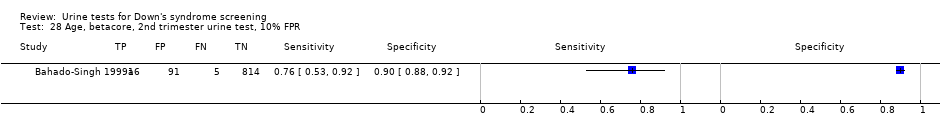
Age, betacore, 2nd trimester urine test, 10% FPR.
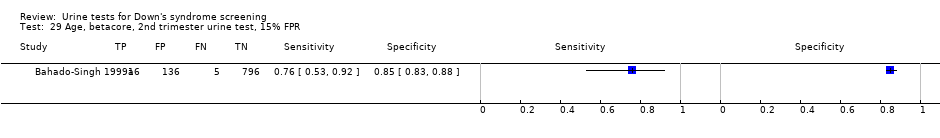
Age, betacore, 2nd trimester urine test, 15% FPR.

Age, betacore, 2nd trimester urine test, 20% FPR.

Age, ITA, 2nd trimester urine test, 5% FPR.

Age, oestriol, 2nd trimester urine test, 5% FPR.

Age, free ßhCG, 2nd trimester urine test, 5% FPR.
Age, betacore to oestriol ratio, 2nd trimester urine test, 1% FPR.

Age, betacore to oestriol ratio, 2nd trimester urine test, 3% FPR.

Age, betacore to oestriol ratio, 2nd trimester urine test, 5% FPR.
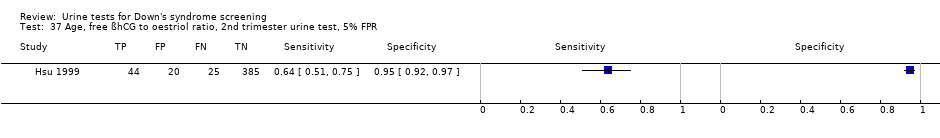
Age, free ßhCG to oestriol ratio, 2nd trimester urine test, 5% FPR.
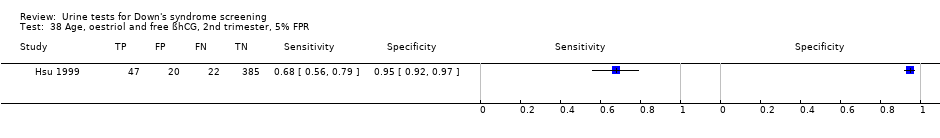
Age, oestriol and free ßhCG, 2nd trimester, 5% FPR.
Age, betacore to free ßhCG ratio, 2nd trimester, 5% FPR.

Age, betacore and oestriol, 2nd trimester 1% FPR.

Age, betacore and oestriol, 2nd trimester, 3% FPR.
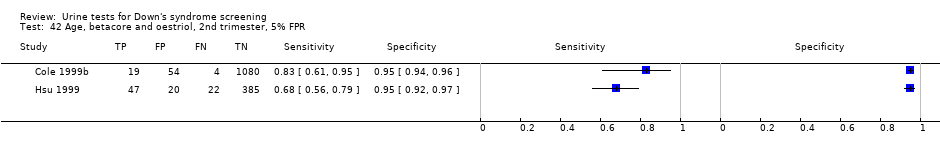
Age, betacore and oestriol, 2nd trimester, 5% FPR.
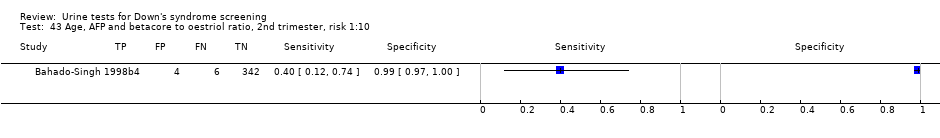
Age, AFP and betacore to oestriol ratio, 2nd trimester, risk 1:10.
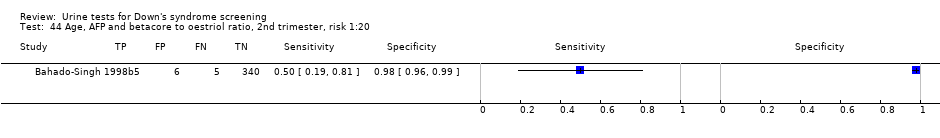
Age, AFP and betacore to oestriol ratio, 2nd trimester, risk 1:20.

Age, AFP and betacore to oestriol ratio, 2nd trimester, risk 1:30.
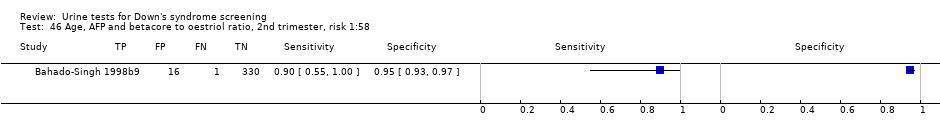
Age, AFP and betacore to oestriol ratio, 2nd trimester, risk 1:58.

Age, AFP and betacore to oestriol ratio, 2nd trimester, risk 1:270.
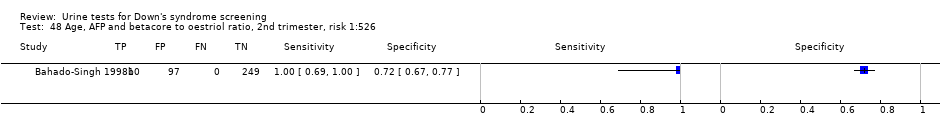
Age, AFP and betacore to oestriol ratio, 2nd trimester, risk 1:526.
| Review Question | What is the accuracy of urine based markers for screening for Down's syndrome? | ||||
| Population | Pregnant women at less than 24 weeks' gestation confirmed by ultrasound, who had not undergone previous testing for Down’s syndrome. Most studies were undertaken in women identified to be high risk based on maternal age | ||||
| Settings | All settings | ||||
| Numbers of studies, pregnancies and Down's syndrome cases | 19 studies (reported in 29 publications) involving 18,013 pregnancies of which 527 were Down's syndrome pregnancies. | ||||
| Index tests | Risk scores computed using maternal age and first and second trimester urine markers for AFP; ITA; ß‐core fragment; free ßhCG; total hCG; oestriol (also termed as uE3); gonadotropin peptide. | ||||
| Reference standards | Chromosomal verification (amniocentesis and CVS undertaken during pregnancy, and postnatal karyotyping) and postnatal macroscopic inspection. | ||||
| Study limitations | Seven studies only used selective chromosomal verification during pregnancy, and were at risk of under‐ascertainment of Down's syndrome cases due loss of the pregnancy to miscarriage between the serum test and the reference standard. | ||||
| Test | Studies | Women (Cases) | Sensitivity* (95% CI) | Specificity* (95% CI) | Threshold |
| Test without maternal age | |||||
| Single tests | |||||
| First trimester free ßhCG | 1 | 516 (86) | 5 (1 to 11) | 95 (92 to 97) | 5% FPR |
| First trimester ß‐core fragment | 1 | 516 (86) | 10 (5 to 19) | 95 (92 to 97) | 5% FPR |
| First trimester ITA | 2 | 579 (94) | 15 (2 to 62) | 95 | 5% FPR |
| First trimester total hCG | 1 | 516 (86) | 17 (10 to 27) | 95 (92 to 97) | 5% FPR |
| Second trimester oestriol | 2 | 1472 (47) | 23 (8 to 49) | 95 | 5% FPR |
| Second trimester total hCG | 1 | 390 (65) | 31 (20 to 43) | 95 (92 to 97) | 5% FPR |
| Second trimester free ßhCG | 3 | 1517 (107) | 32 (12 to 63) | 95 | 5% FPR |
| Second trimester ß‐core fragment | 6 | 9613 (193) | 41 (20 to 66) | 95 | 5% FPR |
| Second trimester ITA | 3 | 2748 (131) | 43 (35 to 51) | 95 | 5% FPR |
| Second trimester ß‐core fragment to oestriol ratio | 2 | 1649 (35) | 74 (58 to 86) | 95 | 5% FPR |
| Second trimester gonadotropin test | 1 | 105 (14) | 93 (66 to 100) | 95 (88 to 98) | 1:384 risk |
| Double tests | |||||
| Second trimester AFP and ITA | 1 | 524 (24) | 79 (58 to 93) | 95 (93 to 97) | 5% FPR |
| Second trimester ß‐core fragment and oestriol | 1 | 315 (24) | 83 (63 to 95) | 95 (92 to 97) | 5% FPR |
| Triple tests | |||||
| Second trimester AFP, uE3 and ITA | 1 | 524 (24) | 79 (58 to 93) | 95 (93 to 97) | 5% FPR |
| Test with maternal age | |||||
| Single tests | |||||
| Second trimester oestriol | 1 | 474 (69) | 49 (37 to 62) | 95 (92 to 97) | 5% FPR |
| Second trimester ß‐core fragment | 5 | 3419 (155) | 56 (45 to 66) | 95 | 5% FPR |
| Second trimester free ßhCG | 2 | 879 (98) | 57 (47 to 67) | 95 | 5% FPR |
| Second trimester free ßhCG to oestriol ratio | 1 | 474 (69) | 64 (51 to 75) | 95 (92 to 97) | 5% FPR |
| Second trimester ß‐core fragment to free ßhCG | 1 | 474 (69) | 67 (54 to 78) | 95 (92 to 97) | 5% FPR |
| Second trimester ITA | 1 | 1016 (23) | 70 (47 to 87) | 95 (93 to 96) | 5% FPR |
| Second trimester ß‐core fragment to oestriol ratio | 3 | 2088 (105) | 71 (51 to 86) | 95 | 5% FPR |
| Double tests | |||||
| Second trimester oestriol and free ßhCG | 1 | 474 (69) | 68 (56 to 79) | 95 (92 to 97) | 5% FPR |
| Second trimester ß‐core fragment and oestriol | 2 | 1631 (92) | 73 (57 to 85) | 95 | 5% FPR |
| Second trimester AFP and ß‐core fragment to oestriol ratio | 1 | 356 (10) | 90 (55 to 100) | 95 (93 to 97) | 1:58 risk |
| *Tests evaluated by at least one study are presented in the table. Where two studies reported the same threshold, estimates of summary sensitivity and summary specificity were obtained by using univariate fixed effects logistic regression models to pool sensitivities and specificities separately. if the threshold used was a 5% FPR, then only the sensitivities were pooled. AFP: alpha‐fetoprotein; ßhCG: beta human chorionic gonadotrophin;CI: confidence interval; CVS: chorionic villus sampling; FPR: false positive rate; hCG: beta human chorionic gonadotrophin;ITA: invasive trophoblast antigen; uE3: unconjugated oestriol | |||||
| Ratio of DORs (95% CI); P values (studies) | Second trimester AFP and ß‐core fragment to oestriol ratio, risk 1:58 | Second trimester ß‐core fragment and oestriol, 5% FPR | Second trimester ITA, 5% FPR | Second trimester ß‐core fragment to oestriol ratio, 5% FPR |
| Second trimester ß‐core fragment and oestriol, 5% FPR | – | |||
| Second trimester ITA, 5% FPR | – | – | ||
| Second trimester ß‐core fragment to oestriol ratio, 5% FPR | – | 1.5 (0.7 to 3.0); P = 0.27 (K = 2) | ||
| Second trimester ß‐core fragment, 5% FPR | – | 2.2 (1.1 to 4.5); P = 0.02 (K = 2) | – | 1.5 (0.8 to 2.8); P = 0.21 (K = 3) |
| Direct comparisons were made using only data from studies that compared each pair of tests in the same population. Ratio of diagnostic odds ratios (DOR)s were computed by division of the DOR for the test in the column by the DOR for the test in the row. If the ratio of DORs is greater than one, then the diagnostic accuracy of the test in the column is higher than that of the test in the row; if the ratio is less than one, the diagnostic accuracy of the test in the row is higher than that of the test in the column. AFP: alpha‐fetoprotein; CI: confidence interval; DORs: diagnostic odds ratio; FPR: false positive rate; ITA: invasive trophoblast antigen | ||||
| Ratio of DOR (95% CI); P value | Second trimester AFP and ß‐core fragment to oestriol ratio, risk 1:58 | Second trimester ß‐core fragment and oestriol, 5% FPR | Second trimester ITA, 5% FPR | Second trimester ß‐core fragment to oestriol ratio, 5% FPR | ||
| Studies | 1 | 2 | 1 | 3 | ||
| Studies | DOR (95% CI) | 186 (22, 1560) | 50 (30 to 84) | 43 (17 to 110) | 38 (24 to 59) | |
| Second trimester ß‐core fragment and oestriol, 5% FPR | 2 | 50 (30 to 84) | 3.7 (0.4 to 33.0); P = 0.24 | |||
| Second trimester ITA, 5% FPR | 1 | 43 (17 to 110) | 4.3 (0.4 to 44.0); P = 0.22 | 1.2 (0.4 to 3.4); P = 0.78 | ||
| Second trimester ß‐core fragment to oestriol ratio, 5% FPR | 3 | 38 (24 to 59) | 4.9 (0.6 to 43.4); P = 0.15 | 1.3 (0.7 to 2.6); P = 0.41 | 1.1 (0.4 to 3.2); P = 0.80 | |
| Second trimester ß‐core fragment, 5% FPR | 5 | 25 (18 to 36) | 7.3 (0.8 to 63.1); P = 0.07 | 2.0 (1.1 to 3.7); P = 0.03 | 1.7 (0.6 to 4.6); P = 0.30 | 1.5 (0.8 to 2.6); P = 0.18 |
| Indirect comparisons were made using all available data. Ratio of diagnostic odds ratios (DOR)s were computed by division of the DOR for the test in the column by the DOR for the test in the row. If the ratio of DORs is greater than one, then the diagnostic accuracy of the test in the column is higher than that of the test in the row; if the ratio is less than one, the diagnostic accuracy of the test in the row is higher than that of the test in the column. AFP: alpha‐fetoprotein; CI: confidence interval; DORs: diagnostic odds ratio; FPR: false positive rate; ITA: invasive trophoblast antigen | ||||||
| Test | No. of studies | No. of participants |
| 1 Betacore, 1st trimester urine test, 5% FPR Show forest plot | 1 | 516 |
| 2 Betacore, 2nd trimester urine test, 5% FPR Show forest plot | 6 | 9613 |
| 3 Betacore, 2nd trimester urine test, cutpoint mixed Show forest plot | 7 | 10124 |
| 4 Gonadotropin, 2nd trimester urine test, risk 1:100 Show forest plot | 1 | 105 |
| 5 Gonadotropin, 2nd trimester urine test, risk 1:384 Show forest plot | 1 | 105 |
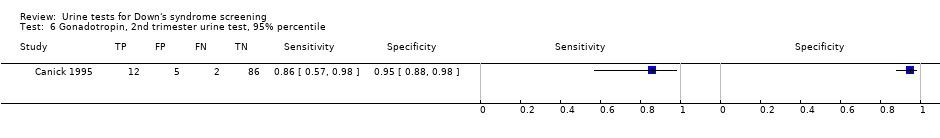
| 6 Gonadotropin, 2nd trimester urine test, 95% percentile Show forest plot | 1 | 105 |
| 7 ITA, 1st trimester urine test, 5% FPR Show forest plot | 2 | 579 |
| 8 ITA, 2nd trimester urine test, 3.74MoM Show forest plot | 1 | 2051 |
| 9 ITA, 2nd trimester urine test, 5% FPR Show forest plot | 3 | 2748 |
| 10 Total hCG, 1st trimester urine test, 5% FPR Show forest plot | 1 | 516 |
| 11 Total hCG, 2nd trimester urine test, 5% FPR Show forest plot | 1 | 390 |
| 12 Free ßhCG, 1st trimester urine test, 5% FPR Show forest plot | 1 | 516 |
| 13 Free ßhCG, 2nd trimester urine test, 5% FPR Show forest plot | 3 | 1517 |
| 14 Oestriol, 2nd trimester urine test, 5% FPR Show forest plot | 2 | 1472 |
| 15 Betacore to oestriol ratio, 2nd trimester urine test, 5% FPR Show forest plot | 2 | 1649 |
| 16 Betacore and oestriol, 2nd trimester 5% FPR Show forest plot | 1 | 315 |
| 17 AFP and ITA, 2nd trimester urine test, 3% FPR Show forest plot | 1 | 524 |
| 18 AFP and ITA, 2nd trimester urine test, 5% FPR Show forest plot | 1 | 524 |
| 19 AFP and ITA, 2nd trimester urine test,10% FPR Show forest plot | 1 | 524 |
| 20 AFP and ITA, 2nd trimester urine test, 15% FPR Show forest plot | 1 | 524 |
| 21 AFP, uE3 and ITA, 2nd trimester urine test, 3% FPR Show forest plot | 1 | 524 |
| 22 AFP, uE3 and ITA, 2nd trimester urine test, 5% FPR Show forest plot | 1 | 524 |
| 23 AFP, uE3 and ITA, 2nd trimester urine test, 10% FPR Show forest plot | 1 | 524 |
| 24 AFP, uE3 and ITA, 2nd trimester urine test, 15% FPR Show forest plot | 1 | 524 |
| 25 Age, betacore, 2nd trimester urine test, 1% FPR Show forest plot | 2 | 2083 |
| 26 Age, betacore, 2nd trimester urine test, 3% FPR Show forest plot | 2 | 2083 |
| 27 Age, betacore, 2nd trimester urine test, 5% FPR Show forest plot | 5 | 3419 |
| 28 Age, betacore, 2nd trimester urine test, 10% FPR Show forest plot | 1 | 926 |
| 29 Age, betacore, 2nd trimester urine test, 15% FPR Show forest plot | 1 | 953 |
| 30 Age, betacore, 2nd trimester urine test, 20% FPR Show forest plot | 1 | 926 |
| 31 Age, ITA, 2nd trimester urine test, 5% FPR Show forest plot | 1 | 1016 |
| 32 Age, oestriol, 2nd trimester urine test, 5% FPR Show forest plot | 1 | 474 |
| 33 Age, free ßhCG, 2nd trimester urine test, 5% FPR Show forest plot | 2 | 879 |
| 34 Age, betacore to oestriol ratio, 2nd trimester urine test, 1% FPR Show forest plot | 1 | 1157 |
| 35 Age, betacore to oestriol ratio, 2nd trimester urine test, 3% FPR Show forest plot | 1 | 1157 |
| 36 Age, betacore to oestriol ratio, 2nd trimester urine test, 5% FPR Show forest plot | 3 | 2088 |
| 37 Age, free ßhCG to oestriol ratio, 2nd trimester urine test, 5% FPR Show forest plot | 1 | 474 |
| 38 Age, oestriol and free ßhCG, 2nd trimester, 5% FPR Show forest plot | 1 | 474 |
| 39 Age, betacore to free ßhCG ratio, 2nd trimester, 5% FPR Show forest plot | 1 | 474 |
| 40 Age, betacore and oestriol, 2nd trimester 1% FPR Show forest plot | 1 | 1157 |
| 41 Age, betacore and oestriol, 2nd trimester, 3% FPR Show forest plot | 1 | 1157 |
| 42 Age, betacore and oestriol, 2nd trimester, 5% FPR Show forest plot | 2 | 1631 |
| 43 Age, AFP and betacore to oestriol ratio, 2nd trimester, risk 1:10 Show forest plot | 1 | 356 |
| 44 Age, AFP and betacore to oestriol ratio, 2nd trimester, risk 1:20 Show forest plot | 1 | 356 |
| 45 Age, AFP and betacore to oestriol ratio, 2nd trimester, risk 1:30 Show forest plot | 1 | 356 |
| 46 Age, AFP and betacore to oestriol ratio, 2nd trimester, risk 1:58 Show forest plot | 1 | 356 |
| 47 Age, AFP and betacore to oestriol ratio, 2nd trimester, risk 1:270 Show forest plot | 1 | 356 |
| 48 Age, AFP and betacore to oestriol ratio, 2nd trimester, risk 1:526 Show forest plot | 1 | 356 |