Pruebas de orina para el cribado del síndrome de Down
Información
- DOI:
- https://doi.org/10.1002/14651858.CD011984Copiar DOI

- Base de datos:
-
- Cochrane Database of Systematic Reviews
- Versión publicada:
-
- 10 diciembre 2015see what's new
- Tipo:
-
- Diagnostic
- Etapa:
-
- Review
- Grupo Editorial Cochrane:
-
Grupo Cochrane de Embarazo y parto
- Copyright:
-
- Copyright © 2015 The Cochrane Collaboration. Published by John Wiley & Sons, Ltd.
Cifras del artículo
Altmetric:
Citado por:
Autores
Contributions of authors
KA undertook the searches, applied eligibility criteria, extracted and entered data and wrote the first and second draft of the review.
ZA applied eligibility criteria, provided senior clinical input, oversaw the review process, and approved the final draft of the review.
JD supervised and planned the review, checked data extraction, supervised statistical analyses and wrote the second draft of the review.
JP applied eligibility criteria, provided senior clinical input, oversaw the review process, and approved the final draft of the review.
BG checked data extraction and undertook statistical analyses.
MP applied eligibility criteria, extracted and entered data for the updated literature search, and entered characteristics of studies information.
SW applied eligibility criteria, extracted and entered data for the updated literature search, and entered characteristics of studies information
YT undertook statistical analyses and wrote parts of the first draft of the review.
Sources of support
Internal sources
-
University of Birmingham, Other.
Funding of research time for BG, MP, SW, YT and JD
External sources
-
NIHR Health Technology Assessment Programme, UK, Other.
Project grant
-
NIHR Health Technology Assessment Programme, UK, Other.
Funding for the Cochrane Reviews of Diagnostic Test Accuracy Support Unit, based at the University of Birmingham (JD).
Declarations of interest
S Kate Alldred: none known
Zarko Alfirevic: none known
Jonathan J Deeks: none known
James P Neilson: none known
Boliang Guo: none known
Mary Pennant: none known
Susanna Wisniewski: none known
Yemisi Takwoingi: none known
Acknowledgements
We acknowledge the assistance of the Pregnancy and Childirth Cochrane Review Group Editorial base with writing the searches and other aspects of this review.
As part of the pre‐publication editorial process, this review has been commented on by three peers (an editor and two referees who are external to the editorial team) and a member of the Pregnancy and Childbirth Group's international panel of consumers.
This project was supported by the National Institute for Health Research, via Cochrane Infrastructure funding to Cochrane Pregnancy and Childbirth. The views and opinions expressed therein are those of the authors and do not necessarily reflect those of the Systematic Reviews Programme, NIHR, NHS or the Department of Health.
Version history
| Published | Title | Stage | Authors | Version |
| 2015 Dec 10 | Urine tests for Down's syndrome screening | Review | S Kate Alldred, Boliang Guo, Yemisi Takwoingi, Mary Pennant, Susanna Wisniewski, Jonathan J Deeks, James P Neilson, Zarko Alfirevic | |
Differences between protocol and review
The protocol intended to investigate several additional outcomes downstream from test accuracy, should they be reported in the test accuracy studies. When we attempted to extract this information however, it was found to be available in very few studies. Where such information was found, it was difficult to extract meaningful data to allow for comparison between studies because data were not reported in a universal manner. In several studies such outcomes were estimated rather than measured. Often they were not reported at all. The outcomes stated in the protocol which have not been included are: harms of testing; need for further testing; side effects of tests; interventions and side effects; other abnormalities detected by testing; spontaneous miscarriage; miscarriage subsequent to invasive procedure, with or without normal karyotype; fetal karyotype; termination of pregnancy (prior to definitive testing or in a karyotypically normal pregnancy and following confirmation of Down’s syndrome or following detection of other chromosomal abnormalities); stillbirth; livebirth of affected and unaffected fetus; uptake of definitive testing by women.
The following refinements to the eligibility criteria were imposed to ensure that the quality of the included literature remained high. We excluded studies that identified fewer than five Down's syndrome pregnancies in their study population. We excluded studies that had less than 80% follow‐ up of participants.
In addition, the analytical strategy was informed by the volume of tests and studies included, so that we focused on key tests and test combinations by a) only meta‐analysing tests that were included in four or more studies, or b) showed more than 70% sensitivity with at least a 95% specificity. In addition, a requirement that a minimum of 10 studies for a single test was required before subgroup analysis was undertaken. Consequently several possible sources of heterogeneity were not investigated due to lack of data.
Notes
This review belongs to a suite of planned systematic diagnostic test reviews examining antenatal screening for Down's syndrome which include four other titles: First trimester serum tests for Down's syndrome screening; Second trimester serum tests for Down's syndrome screening (Alldred 2012); First trimester serum and ultrasound tests for Down's syndrome screening; and First and second trimester serum tests with and without first trimester ultrasound tests for Down's syndrome screening. The plans for these reviews were described in a generic protocol (Alldred 2010) published in the Cochrane Library in 2010. The project as a whole has been much larger than initially anticipated, both in terms of size and statistical complexity. The initial search was completed in 2007 and an updated search in August 2011. After identifying studies appropriate for inclusion, a significant amount of time has been devoted to data management and analysis.
The authors are conscious of the time lag from the latest literature search to publication, and the potential for the introduction of new urine tests in this time frame. The authors are also conscious of the potential for publication of new data pertaining to tests included in this review. Whilst not fulfilling the usual Cochrane up‐to‐date criteria, this review is published because it provides historical context in what is a rapidly‐changing field, and because it is unlikely to ever be repeated.
Keywords
MeSH
Medical Subject Headings (MeSH) Keywords
- Biomarkers [*urine];
- Chorionic Gonadotropin [urine];
- Down Syndrome [*diagnosis];
- Estriol [urine];
- False Positive Reactions;
- Gonadotropins [urine];
- Maternal Age;
- Predictive Value of Tests;
- Pregnancy Trimester, First [*urine];
- Pregnancy Trimester, Second [*urine];
- Sensitivity and Specificity;
- alpha‐Fetoproteins [urine];
Medical Subject Headings Check Words
Female; Humans; Pregnancy;

Methodological quality summary: review authors' judgements about each methodological quality item for each included study.

Detection rates (% sensitivity) at a 5% false positive rate for the five most evaluated or best performing test strategies. The estimates are shown with 95% confidence intervals. The test strategies are ordered on the plot according to decreasing detection rate. The number of studies, cases and women included for each test strategy are shown on the horizontal axis.

Betacore, 1st trimester urine test, 5% FPR.

Betacore, 2nd trimester urine test, 5% FPR.
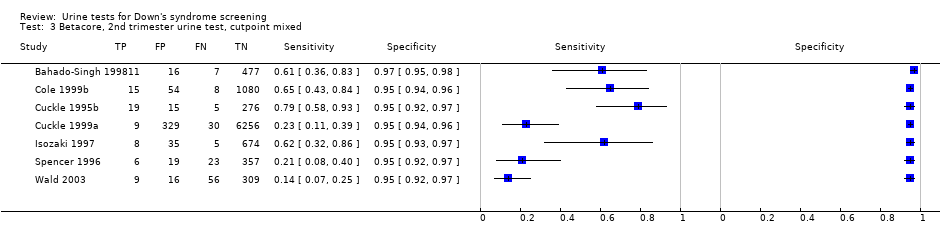
Betacore, 2nd trimester urine test, cutpoint mixed.

Gonadotropin, 2nd trimester urine test, risk 1:100.
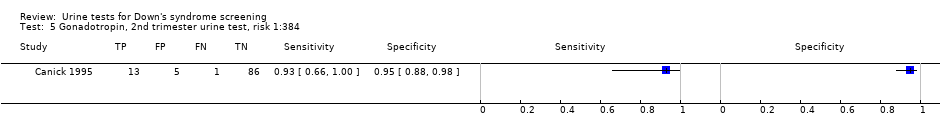
Gonadotropin, 2nd trimester urine test, risk 1:384.
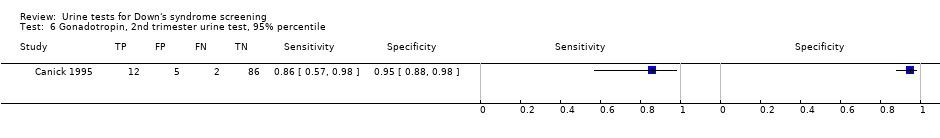
Gonadotropin, 2nd trimester urine test, 95% percentile.

ITA, 1st trimester urine test, 5% FPR.

ITA, 2nd trimester urine test, 3.74MoM.
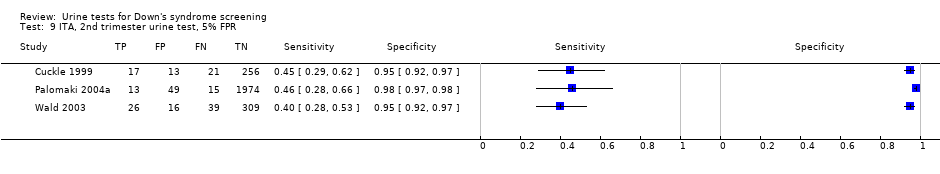
ITA, 2nd trimester urine test, 5% FPR.

Total hCG, 1st trimester urine test, 5% FPR.
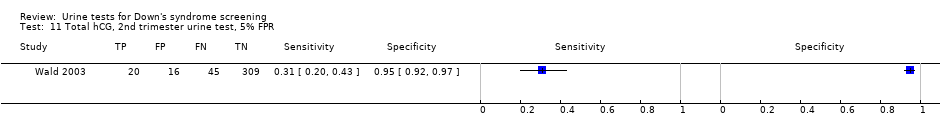
Total hCG, 2nd trimester urine test, 5% FPR.

Free ßhCG, 1st trimester urine test, 5% FPR.

Free ßhCG, 2nd trimester urine test, 5% FPR.

Oestriol, 2nd trimester urine test, 5% FPR.
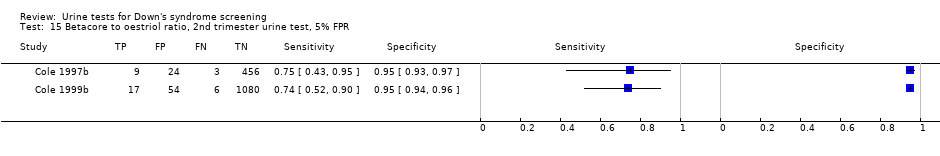
Betacore to oestriol ratio, 2nd trimester urine test, 5% FPR.
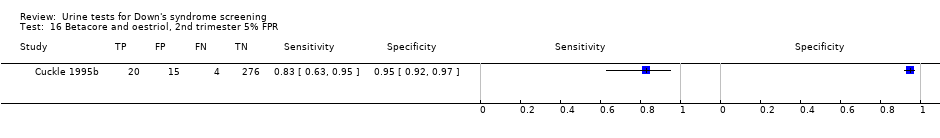
Betacore and oestriol, 2nd trimester 5% FPR.

AFP and ITA, 2nd trimester urine test, 3% FPR.
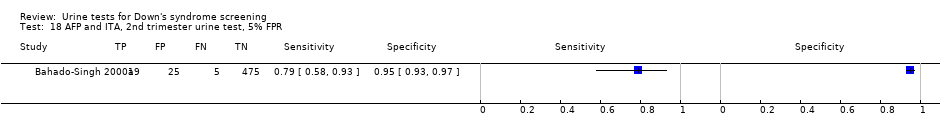
AFP and ITA, 2nd trimester urine test, 5% FPR.

AFP and ITA, 2nd trimester urine test,10% FPR.

AFP and ITA, 2nd trimester urine test, 15% FPR.

AFP, uE3 and ITA, 2nd trimester urine test, 3% FPR.

AFP, uE3 and ITA, 2nd trimester urine test, 5% FPR.

AFP, uE3 and ITA, 2nd trimester urine test, 10% FPR.
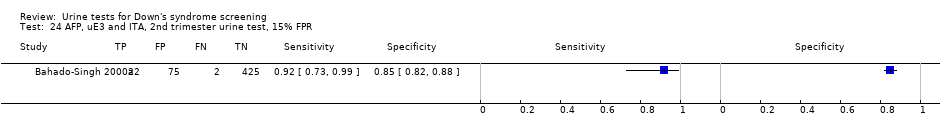
AFP, uE3 and ITA, 2nd trimester urine test, 15% FPR.

Age, betacore, 2nd trimester urine test, 1% FPR.

Age, betacore, 2nd trimester urine test, 3% FPR.
Age, betacore, 2nd trimester urine test, 5% FPR.
Age, betacore, 2nd trimester urine test, 10% FPR.
Age, betacore, 2nd trimester urine test, 15% FPR.

Age, betacore, 2nd trimester urine test, 20% FPR.

Age, ITA, 2nd trimester urine test, 5% FPR.

Age, oestriol, 2nd trimester urine test, 5% FPR.

Age, free ßhCG, 2nd trimester urine test, 5% FPR.
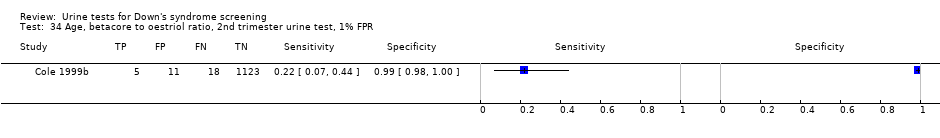
Age, betacore to oestriol ratio, 2nd trimester urine test, 1% FPR.

Age, betacore to oestriol ratio, 2nd trimester urine test, 3% FPR.

Age, betacore to oestriol ratio, 2nd trimester urine test, 5% FPR.
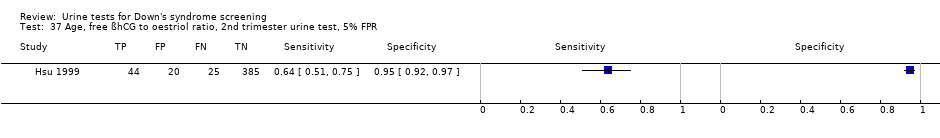
Age, free ßhCG to oestriol ratio, 2nd trimester urine test, 5% FPR.
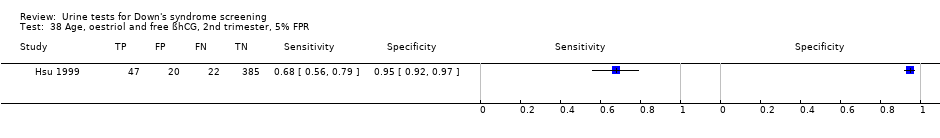
Age, oestriol and free ßhCG, 2nd trimester, 5% FPR.
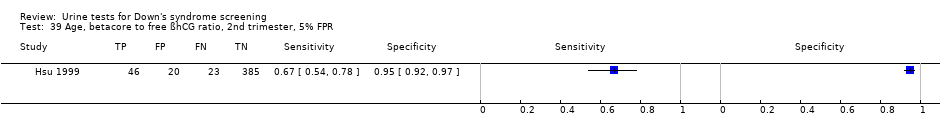
Age, betacore to free ßhCG ratio, 2nd trimester, 5% FPR.

Age, betacore and oestriol, 2nd trimester 1% FPR.

Age, betacore and oestriol, 2nd trimester, 3% FPR.
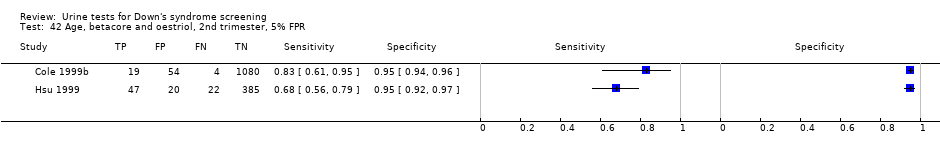
Age, betacore and oestriol, 2nd trimester, 5% FPR.
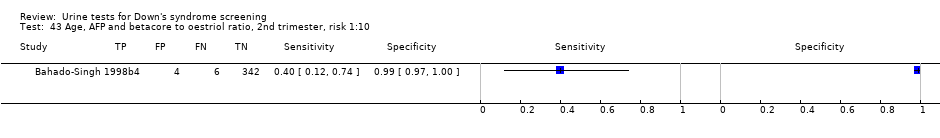
Age, AFP and betacore to oestriol ratio, 2nd trimester, risk 1:10.
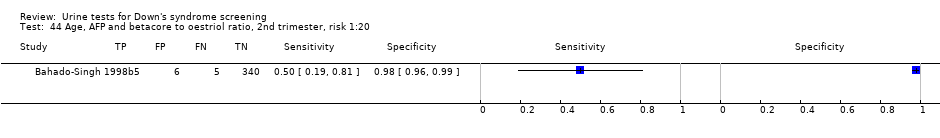
Age, AFP and betacore to oestriol ratio, 2nd trimester, risk 1:20.

Age, AFP and betacore to oestriol ratio, 2nd trimester, risk 1:30.
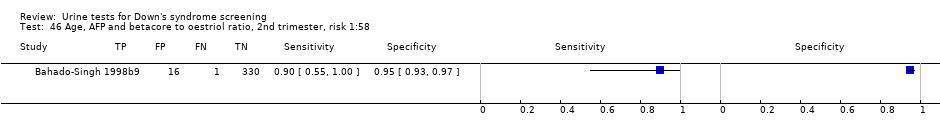
Age, AFP and betacore to oestriol ratio, 2nd trimester, risk 1:58.

Age, AFP and betacore to oestriol ratio, 2nd trimester, risk 1:270.
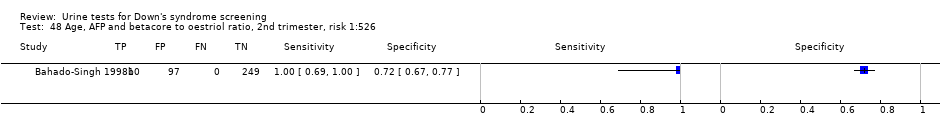
Age, AFP and betacore to oestriol ratio, 2nd trimester, risk 1:526.
| Review Question | What is the accuracy of urine based markers for screening for Down's syndrome? | ||||
| Population | Pregnant women at less than 24 weeks' gestation confirmed by ultrasound, who had not undergone previous testing for Down’s syndrome. Most studies were undertaken in women identified to be high risk based on maternal age | ||||
| Settings | All settings | ||||
| Numbers of studies, pregnancies and Down's syndrome cases | 19 studies (reported in 29 publications) involving 18,013 pregnancies of which 527 were Down's syndrome pregnancies. | ||||
| Index tests | Risk scores computed using maternal age and first and second trimester urine markers for AFP; ITA; ß‐core fragment; free ßhCG; total hCG; oestriol (also termed as uE3); gonadotropin peptide. | ||||
| Reference standards | Chromosomal verification (amniocentesis and CVS undertaken during pregnancy, and postnatal karyotyping) and postnatal macroscopic inspection. | ||||
| Study limitations | Seven studies only used selective chromosomal verification during pregnancy, and were at risk of under‐ascertainment of Down's syndrome cases due loss of the pregnancy to miscarriage between the serum test and the reference standard. | ||||
| Test | Studies | Women (Cases) | Sensitivity* (95% CI) | Specificity* (95% CI) | Threshold |
| Test without maternal age | |||||
| Single tests | |||||
| First trimester free ßhCG | 1 | 516 (86) | 5 (1 to 11) | 95 (92 to 97) | 5% FPR |
| First trimester ß‐core fragment | 1 | 516 (86) | 10 (5 to 19) | 95 (92 to 97) | 5% FPR |
| First trimester ITA | 2 | 579 (94) | 15 (2 to 62) | 95 | 5% FPR |
| First trimester total hCG | 1 | 516 (86) | 17 (10 to 27) | 95 (92 to 97) | 5% FPR |
| Second trimester oestriol | 2 | 1472 (47) | 23 (8 to 49) | 95 | 5% FPR |
| Second trimester total hCG | 1 | 390 (65) | 31 (20 to 43) | 95 (92 to 97) | 5% FPR |
| Second trimester free ßhCG | 3 | 1517 (107) | 32 (12 to 63) | 95 | 5% FPR |
| Second trimester ß‐core fragment | 6 | 9613 (193) | 41 (20 to 66) | 95 | 5% FPR |
| Second trimester ITA | 3 | 2748 (131) | 43 (35 to 51) | 95 | 5% FPR |
| Second trimester ß‐core fragment to oestriol ratio | 2 | 1649 (35) | 74 (58 to 86) | 95 | 5% FPR |
| Second trimester gonadotropin test | 1 | 105 (14) | 93 (66 to 100) | 95 (88 to 98) | 1:384 risk |
| Double tests | |||||
| Second trimester AFP and ITA | 1 | 524 (24) | 79 (58 to 93) | 95 (93 to 97) | 5% FPR |
| Second trimester ß‐core fragment and oestriol | 1 | 315 (24) | 83 (63 to 95) | 95 (92 to 97) | 5% FPR |
| Triple tests | |||||
| Second trimester AFP, uE3 and ITA | 1 | 524 (24) | 79 (58 to 93) | 95 (93 to 97) | 5% FPR |
| Test with maternal age | |||||
| Single tests | |||||
| Second trimester oestriol | 1 | 474 (69) | 49 (37 to 62) | 95 (92 to 97) | 5% FPR |
| Second trimester ß‐core fragment | 5 | 3419 (155) | 56 (45 to 66) | 95 | 5% FPR |
| Second trimester free ßhCG | 2 | 879 (98) | 57 (47 to 67) | 95 | 5% FPR |
| Second trimester free ßhCG to oestriol ratio | 1 | 474 (69) | 64 (51 to 75) | 95 (92 to 97) | 5% FPR |
| Second trimester ß‐core fragment to free ßhCG | 1 | 474 (69) | 67 (54 to 78) | 95 (92 to 97) | 5% FPR |
| Second trimester ITA | 1 | 1016 (23) | 70 (47 to 87) | 95 (93 to 96) | 5% FPR |
| Second trimester ß‐core fragment to oestriol ratio | 3 | 2088 (105) | 71 (51 to 86) | 95 | 5% FPR |
| Double tests | |||||
| Second trimester oestriol and free ßhCG | 1 | 474 (69) | 68 (56 to 79) | 95 (92 to 97) | 5% FPR |
| Second trimester ß‐core fragment and oestriol | 2 | 1631 (92) | 73 (57 to 85) | 95 | 5% FPR |
| Second trimester AFP and ß‐core fragment to oestriol ratio | 1 | 356 (10) | 90 (55 to 100) | 95 (93 to 97) | 1:58 risk |
| *Tests evaluated by at least one study are presented in the table. Where two studies reported the same threshold, estimates of summary sensitivity and summary specificity were obtained by using univariate fixed effects logistic regression models to pool sensitivities and specificities separately. if the threshold used was a 5% FPR, then only the sensitivities were pooled. AFP: alpha‐fetoprotein; ßhCG: beta human chorionic gonadotrophin;CI: confidence interval; CVS: chorionic villus sampling; FPR: false positive rate; hCG: beta human chorionic gonadotrophin;ITA: invasive trophoblast antigen; uE3: unconjugated oestriol | |||||
| Ratio of DORs (95% CI); P values (studies) | Second trimester AFP and ß‐core fragment to oestriol ratio, risk 1:58 | Second trimester ß‐core fragment and oestriol, 5% FPR | Second trimester ITA, 5% FPR | Second trimester ß‐core fragment to oestriol ratio, 5% FPR |
| Second trimester ß‐core fragment and oestriol, 5% FPR | – | |||
| Second trimester ITA, 5% FPR | – | – | ||
| Second trimester ß‐core fragment to oestriol ratio, 5% FPR | – | 1.5 (0.7 to 3.0); P = 0.27 (K = 2) | ||
| Second trimester ß‐core fragment, 5% FPR | – | 2.2 (1.1 to 4.5); P = 0.02 (K = 2) | – | 1.5 (0.8 to 2.8); P = 0.21 (K = 3) |
| Direct comparisons were made using only data from studies that compared each pair of tests in the same population. Ratio of diagnostic odds ratios (DOR)s were computed by division of the DOR for the test in the column by the DOR for the test in the row. If the ratio of DORs is greater than one, then the diagnostic accuracy of the test in the column is higher than that of the test in the row; if the ratio is less than one, the diagnostic accuracy of the test in the row is higher than that of the test in the column. AFP: alpha‐fetoprotein; CI: confidence interval; DORs: diagnostic odds ratio; FPR: false positive rate; ITA: invasive trophoblast antigen | ||||
| Ratio of DOR (95% CI); P value | Second trimester AFP and ß‐core fragment to oestriol ratio, risk 1:58 | Second trimester ß‐core fragment and oestriol, 5% FPR | Second trimester ITA, 5% FPR | Second trimester ß‐core fragment to oestriol ratio, 5% FPR | ||
| Studies | 1 | 2 | 1 | 3 | ||
| Studies | DOR (95% CI) | 186 (22, 1560) | 50 (30 to 84) | 43 (17 to 110) | 38 (24 to 59) | |
| Second trimester ß‐core fragment and oestriol, 5% FPR | 2 | 50 (30 to 84) | 3.7 (0.4 to 33.0); P = 0.24 | |||
| Second trimester ITA, 5% FPR | 1 | 43 (17 to 110) | 4.3 (0.4 to 44.0); P = 0.22 | 1.2 (0.4 to 3.4); P = 0.78 | ||
| Second trimester ß‐core fragment to oestriol ratio, 5% FPR | 3 | 38 (24 to 59) | 4.9 (0.6 to 43.4); P = 0.15 | 1.3 (0.7 to 2.6); P = 0.41 | 1.1 (0.4 to 3.2); P = 0.80 | |
| Second trimester ß‐core fragment, 5% FPR | 5 | 25 (18 to 36) | 7.3 (0.8 to 63.1); P = 0.07 | 2.0 (1.1 to 3.7); P = 0.03 | 1.7 (0.6 to 4.6); P = 0.30 | 1.5 (0.8 to 2.6); P = 0.18 |
| Indirect comparisons were made using all available data. Ratio of diagnostic odds ratios (DOR)s were computed by division of the DOR for the test in the column by the DOR for the test in the row. If the ratio of DORs is greater than one, then the diagnostic accuracy of the test in the column is higher than that of the test in the row; if the ratio is less than one, the diagnostic accuracy of the test in the row is higher than that of the test in the column. AFP: alpha‐fetoprotein; CI: confidence interval; DORs: diagnostic odds ratio; FPR: false positive rate; ITA: invasive trophoblast antigen | ||||||
| Test | No. of studies | No. of participants |
| 1 Betacore, 1st trimester urine test, 5% FPR Show forest plot | 1 | 516 |
| 2 Betacore, 2nd trimester urine test, 5% FPR Show forest plot | 6 | 9613 |
| 3 Betacore, 2nd trimester urine test, cutpoint mixed Show forest plot | 7 | 10124 |
| 4 Gonadotropin, 2nd trimester urine test, risk 1:100 Show forest plot | 1 | 105 |
| 5 Gonadotropin, 2nd trimester urine test, risk 1:384 Show forest plot | 1 | 105 |
| 6 Gonadotropin, 2nd trimester urine test, 95% percentile Show forest plot | 1 | 105 |
| 7 ITA, 1st trimester urine test, 5% FPR Show forest plot | 2 | 579 |
| 8 ITA, 2nd trimester urine test, 3.74MoM Show forest plot | 1 | 2051 |
| 9 ITA, 2nd trimester urine test, 5% FPR Show forest plot | 3 | 2748 |
| 10 Total hCG, 1st trimester urine test, 5% FPR Show forest plot | 1 | 516 |
| 11 Total hCG, 2nd trimester urine test, 5% FPR Show forest plot | 1 | 390 |
| 12 Free ßhCG, 1st trimester urine test, 5% FPR Show forest plot | 1 | 516 |
| 13 Free ßhCG, 2nd trimester urine test, 5% FPR Show forest plot | 3 | 1517 |
| 14 Oestriol, 2nd trimester urine test, 5% FPR Show forest plot | 2 | 1472 |
| 15 Betacore to oestriol ratio, 2nd trimester urine test, 5% FPR Show forest plot | 2 | 1649 |
| 16 Betacore and oestriol, 2nd trimester 5% FPR Show forest plot | 1 | 315 |
| 17 AFP and ITA, 2nd trimester urine test, 3% FPR Show forest plot | 1 | 524 |
| 18 AFP and ITA, 2nd trimester urine test, 5% FPR Show forest plot | 1 | 524 |
| 19 AFP and ITA, 2nd trimester urine test,10% FPR Show forest plot | 1 | 524 |
| 20 AFP and ITA, 2nd trimester urine test, 15% FPR Show forest plot | 1 | 524 |
| 21 AFP, uE3 and ITA, 2nd trimester urine test, 3% FPR Show forest plot | 1 | 524 |
| 22 AFP, uE3 and ITA, 2nd trimester urine test, 5% FPR Show forest plot | 1 | 524 |
| 23 AFP, uE3 and ITA, 2nd trimester urine test, 10% FPR Show forest plot | 1 | 524 |
| 24 AFP, uE3 and ITA, 2nd trimester urine test, 15% FPR Show forest plot | 1 | 524 |
| 25 Age, betacore, 2nd trimester urine test, 1% FPR Show forest plot | 2 | 2083 |
| 26 Age, betacore, 2nd trimester urine test, 3% FPR Show forest plot | 2 | 2083 |
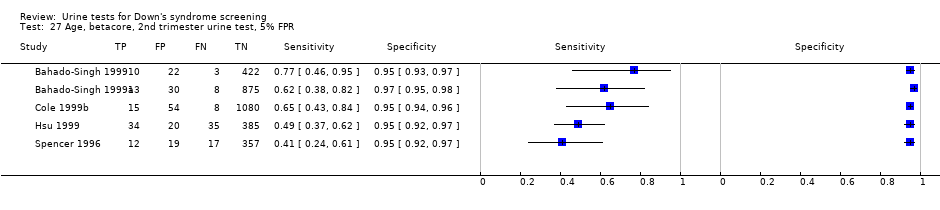
| 27 Age, betacore, 2nd trimester urine test, 5% FPR Show forest plot | 5 | 3419 |
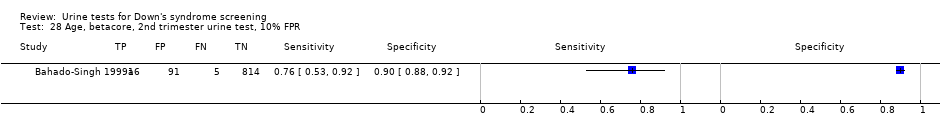
| 28 Age, betacore, 2nd trimester urine test, 10% FPR Show forest plot | 1 | 926 |
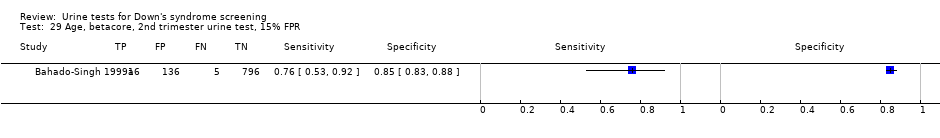
| 29 Age, betacore, 2nd trimester urine test, 15% FPR Show forest plot | 1 | 953 |
| 30 Age, betacore, 2nd trimester urine test, 20% FPR Show forest plot | 1 | 926 |
| 31 Age, ITA, 2nd trimester urine test, 5% FPR Show forest plot | 1 | 1016 |
| 32 Age, oestriol, 2nd trimester urine test, 5% FPR Show forest plot | 1 | 474 |
| 33 Age, free ßhCG, 2nd trimester urine test, 5% FPR Show forest plot | 2 | 879 |
| 34 Age, betacore to oestriol ratio, 2nd trimester urine test, 1% FPR Show forest plot | 1 | 1157 |
| 35 Age, betacore to oestriol ratio, 2nd trimester urine test, 3% FPR Show forest plot | 1 | 1157 |
| 36 Age, betacore to oestriol ratio, 2nd trimester urine test, 5% FPR Show forest plot | 3 | 2088 |
| 37 Age, free ßhCG to oestriol ratio, 2nd trimester urine test, 5% FPR Show forest plot | 1 | 474 |
| 38 Age, oestriol and free ßhCG, 2nd trimester, 5% FPR Show forest plot | 1 | 474 |
| 39 Age, betacore to free ßhCG ratio, 2nd trimester, 5% FPR Show forest plot | 1 | 474 |
| 40 Age, betacore and oestriol, 2nd trimester 1% FPR Show forest plot | 1 | 1157 |
| 41 Age, betacore and oestriol, 2nd trimester, 3% FPR Show forest plot | 1 | 1157 |
| 42 Age, betacore and oestriol, 2nd trimester, 5% FPR Show forest plot | 2 | 1631 |
| 43 Age, AFP and betacore to oestriol ratio, 2nd trimester, risk 1:10 Show forest plot | 1 | 356 |
| 44 Age, AFP and betacore to oestriol ratio, 2nd trimester, risk 1:20 Show forest plot | 1 | 356 |
| 45 Age, AFP and betacore to oestriol ratio, 2nd trimester, risk 1:30 Show forest plot | 1 | 356 |
| 46 Age, AFP and betacore to oestriol ratio, 2nd trimester, risk 1:58 Show forest plot | 1 | 356 |
| 47 Age, AFP and betacore to oestriol ratio, 2nd trimester, risk 1:270 Show forest plot | 1 | 356 |
| 48 Age, AFP and betacore to oestriol ratio, 2nd trimester, risk 1:526 Show forest plot | 1 | 356 |