Enseñanza virtual para los profesionales de la salud
Información
- DOI:
- https://doi.org/10.1002/14651858.CD011736.pub2Copiar DOI

- Base de datos:
-
- Cochrane Database of Systematic Reviews
- Versión publicada:
-
- 22 enero 2018see what's new
- Tipo:
-
- Intervention
- Etapa:
-
- Review
- Grupo Editorial Cochrane:
-
Grupo Cochrane de Práctica y organización sanitaria efectivas
- Copyright:
-
- Copyright © 2018 The Cochrane Collaboration. Published by John Wiley & Sons, Ltd.
Cifras del artículo
Altmetric:
Citado por:
Autores
Contributions of authors
| Conception of the study | Cochrane Review Group |
| Design | LM, RB, DC |
| Coordinator of the working group and Contact Author | AV |
| Draft the protocol | AV, LM, RB, VP |
| Develop and run the search strategy | Trial Search Coordinator |
| Obtain copies of studies | AV |
| Revise each draft (text‐references ...) | AV |
| Revise the references and tables | GR, AV |
| Enter data into RevMan 5 (text) | AV, IT |
| Enter data into RevMan 5 (references) | AV, IT |
| Preparation of data sheet for data studies | AV, RB |
| Select which studies to include | AV, RB, VP, GR, KK, DC |
| Extract data from studies | AV, RB, VP |
| Enter data into data sheet | AV, RB, DC |
| Carry out the analysis | AV, IT, LM |
| Interpret the analysis | AV, IT, LM |
| Draft the final review | AV, IT, LM, RB |
| Update the review | All the authors |
Sources of support
Internal sources
-
EPOC Cochrane Review Group ‐ Editorial base, The Centre for Practice Changing Research, Ottawa Hospital Research Institute (OHRI), Ottawa, Canada.
External sources
-
No external source of support, Other.
Declarations of interest
AV: none known.
RB: none known.
KK: none known.
GR: none known.
DC: none known.
VP: none known.
IT: none known.
LM: none known.
Acknowledgements
We thank Al Mayhew, Lori Tarbett, Gabriel Rada, Jan Odegaard‐Jensen and Tanya Horsely for their comments on the protocol draft and Kerry Dwan, Toby Lasserson, Gabriel Rada, Justin Presseau, Jorge Ruiz and Meggan Harris for their comments to the review.
We also gratefully acknowledge Michelle Fiander, who corrected the search methods and search strategy; Julia Worswick, Sharlini Yogasingam, Thomas Pantoja, Paul Miller and Atle Fretheim for their continuous support to the review development; Stefanos Bonovas for his help with the statistical side of the protocol; Roberta Zimol and Marien Gonzales Lorenzo for the citation screening; and Linda Matti for her editing support.
We would like to further thank Jason King, Micheal Fordis, Raija Kontio, Maritta Valimaki, Gavin Perkins, and Peter Kimani for their availability to provide additional data from their studies.
Lorenzo Moja is a recipient of a Research Early Career Award from the Italian Ministry of Health (GR‐2009‐1606736) and by Regione Lombardia (D.R.G. IX/4340 26/10/2012) on new technologies to change health professionals' behaviours. LM is Programme Editor of Dr Cochrane – Cochrane vignettes, one of a suite of online learning activities launched by the Cochrane Collaboration (www.wileyhealthlearning.com/cochrane.aspx), and of ECM, an Italian e‐learning platform by SICS Editor.
We acknowledge the valuable support of the the National Institute for Health Research, via Cochrane Infrastructure funding to the Effective Practice and Organisation of Care (EPOC) Group. The views and opinions expressed therein are those of the authors and do not necessarily reflect those of the Systematic Reviews Programme, NIHR, NHS or the Department of Health.
AV would like to dedicate this review to the memory of his brother Andrea, example of research in Economics and life.
Version history
| Published | Title | Stage | Authors | Version |
| 2018 Jan 22 | E‐learning for health professionals | Review | Alberto Vaona, Rita Banzi, Koren H Kwag, Giulio Rigon, Danilo Cereda, Valentina Pecoraro, Irene Tramacere, Lorenzo Moja | |
| 2015 Jun 19 | E‐learning for health professionals | Protocol | Alberto Vaona, Giulio Rigon, Rita Banzi, Koren H Kwag, Danilo Cereda, Valentina Pecoraro, Lorenzo Moja, Stefanos Bonovas | |
Differences between protocol and review
We changed the protocol title 'E‐learning for post‐graduate health professionals' into 'E‐learning for health professionals' as in many countries health professionals include postgraduate trainees (e.g. residents and fellows), and many trainees are fully licensed. The protocol title might therefore have generated confusion on the target population.
In terms of search strategies, we did not:
-
screen individual journals and conference proceedings (e.g. handsearch);
-
contact researchers with expertise relevant to the review topic or EPOC interventions (EPOC 2002);
-
conduct cited reference searches for all included studies in citations indexes.
We decided to aggregate studies at unclear risk of bias with those at high risk of bias in the sensitivity analysis. We adopted a conservative approach, assuming that the absence of information indicated inadequate quality ('guilty until proven innocent').
Measures of treatment effect: we replaced change scores as the main outcome measures with final scores because we believed that randomisation would adequately prevent differences between experimental and control group baseline scores.
In the protocol we stated, "We took contextual heterogeneity into account and conducted the analyses in subgroups including studies with similar clinical and methodological characteristics: designs, settings, interventions, comparators, outcome scales, effect sizes". This was a misprint, as the sentence was part of a previous draft written when we were still considering also including non‐randomised studies.
Changes in the authorship of this Cochrane Review: Irene Tramacere replaced Stefanos Bonovas as statistician.
We decided to perform subgroup analyses if at least 10 observations were available for each characteristic modelled (Higgins 2011a).
Keywords
MeSH
Medical Subject Headings (MeSH) Keywords
Medical Subject Headings Check Words
Humans;
PICO
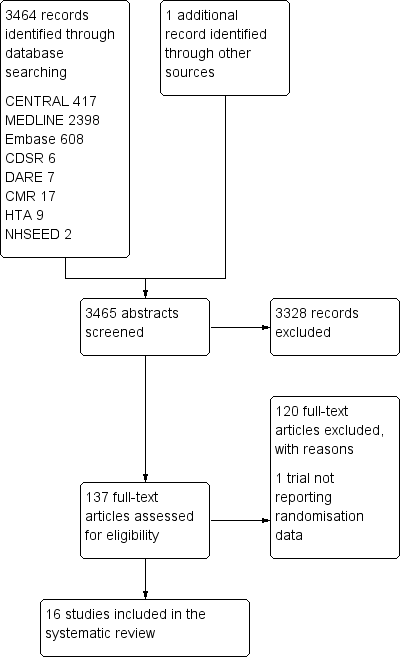
Study flow diagram
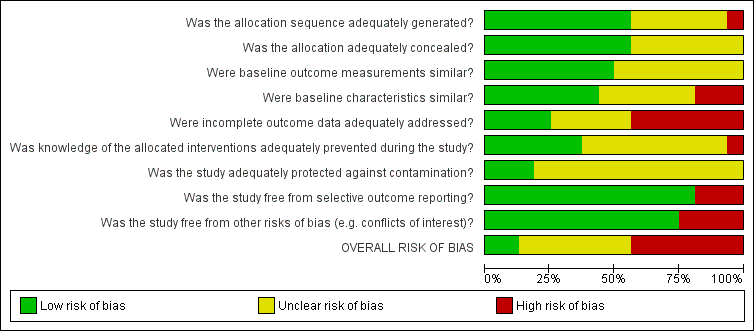
Risk of bias graph: review authors' judgments about each risk of bias item presented as percentages across all included studies.

Risk of bias summary: review authors' judgments about each risk of bias item for each included study.
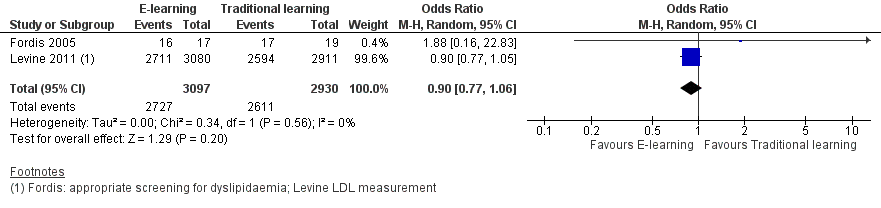
Forest plot of comparison: 1 Behaviours, outcome: 1.1 Patients appropriately screened (Fordis 2005 ‐ screening for dyslipidaemia; Levine 2011 ‐ LDL measurement).

Forest plot of comparison: 1 Behaviours, outcome: 1.2 Patients appropriately treated (Fordis 2005 ‐ treatment for dyslipidaemia; Levine 2011 ‐ statin prescription).
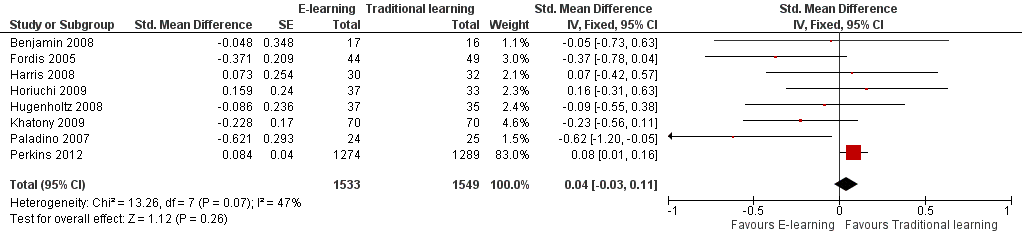
Forest plot of comparison: 3 Knowledge, outcome: 3.1 At any time (fixed‐effect).

Forest plot of comparison: 3 Knowledge, outcome: 3.2 At any time (random‐effects).

Comparison 1 Behaviours, Outcome 1 Patients appropriately screened (Fordis 2005 ‐ screening for dyslipidaemia; Levine 2011 ‐ LDL measurement).

Comparison 1 Behaviours, Outcome 2 Patients appropriately treated (Fordis 2005 ‐ treatment for dyslipidaemia; Levine 2011 ‐ statin prescription).

Comparison 1 Behaviours, Outcome 3 Patients appropriately screened (Fordis 2005 ‐ screening for dyslipidaemia; Levine 2011 ‐ HbA1c measurement).
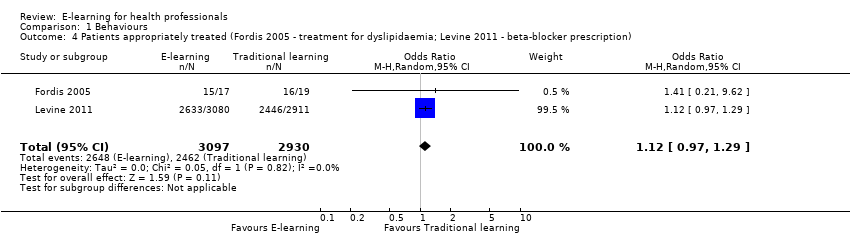
Comparison 1 Behaviours, Outcome 4 Patients appropriately treated (Fordis 2005 ‐ treatment for dyslipidaemia; Levine 2011 ‐ beta‐blocker prescription).

Comparison 1 Behaviours, Outcome 5 Patients appropriately treated (Fordis 2005 ‐ treatment for dyslipidaemia; Levine 2011 ‐ ACEI/ARB prescription).

Comparison 2 Skills, Outcome 1 Drug dose calculation accuracy (Simonsen 2014); ulcer classification accuracy (Bredesen 2016).

Comparison 2 Skills, Outcome 2 Cardiac arrest simulation test (CASTest).
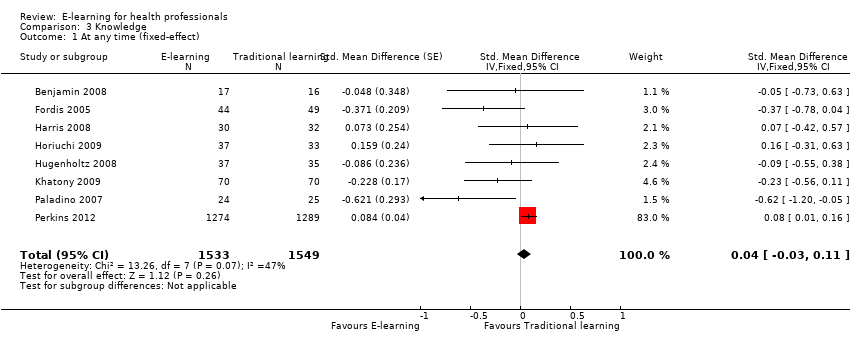
Comparison 3 Knowledge, Outcome 1 At any time (fixed‐effect).

Comparison 3 Knowledge, Outcome 2 At any time (random‐effects).
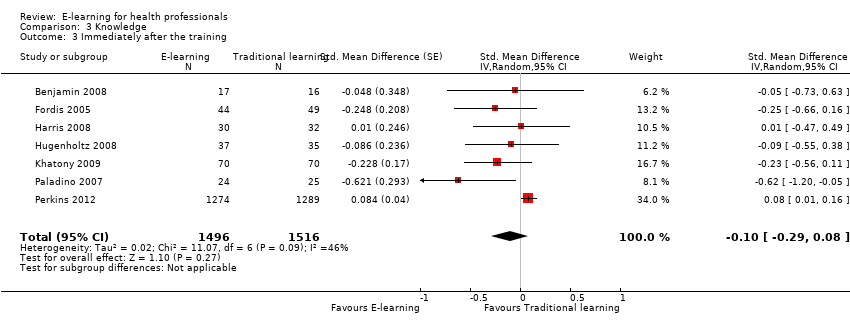
Comparison 3 Knowledge, Outcome 3 Immediately after the training.

Comparison 3 Knowledge, Outcome 4 After 3 or more months.
| E‐learning versus traditional learning for health professionals | ||||
| Patient or population: licensed health professionals (doctors, nurses and allied health professionals fully licensed to practice without supervision) Settings: postgraduate education in any setting Intervention: e‐learning (any intervention in which clinical content is distributed primarily by the Internet, Extranet or Intranet) Comparison: traditional learning (any intervention not distributed through the media mentioned above) | ||||
| Outcomes | Impact* | No of participants | Certainty of the evidence | Comments |
| Patient outcomes Follow‐up: 12 months | E‐learning may make lead to little or no difference between the groups in proportion of patients with LDL cholesterol < 100 mg/dL (adjusted difference 4.0% (95% CI −0.3 to 7.9; 6399 patients) or glycated haemoglobin level < 8% (adjusted difference 4.6%, 95% CI −1.5 to 9.8; 3114 patients) | 168 primary care clinics; 847 health professionals (1 study) | ⊕⊕⊝⊝ | — |
| Health professionals' behaviours Follow‐up: 3‐12 months | E‐learning may make little or no difference between the groups in terms of screening for dyslipidaemia (OR 0.90, 95% CI 0.77 to 1.06, 6027 patients) or treatment for dyslipidaemia (OR 1.15, 95% CI 0.89 to 1.48; 5491 patients) | 950 health professionals (2 studies) | ⊕⊕⊝⊝ | Studies reported multiple outcomes without specifying the primary outcome: to assess consistency, we explored 3 other possible combinations between the 2 study indicators. |
| Health professionals' skills Follow‐up: 0‐12 weeks | We are uncertain whether e‐learning improves or reduces health professionals' skills (SMD 0.03, 95% CI −0.25 to 0.31, I2 = 61%, 201 participants, 12 weeks' follow‐up). | 2912 health professionals (6 studies) | ⊕⊝⊝⊝ Very lowc | The results from the largest trial and 2 more trials, favouring traditional learning (2640 participants), and from one trial favouring e‐learning could not be included in the meta‐analysis. The meta‐analysis included 2 trials studying different professional skills (drug dose calculation and accuracy in pressure ulcers classification). |
| Health professionals' knowledge Any follow‐up: 0‐12 weeks | E‐learning may make little or no difference in health professionals' knowledge: 8 trials provided data to the meta‐analysis (SMD 0.04, 95% CI ‐0.03 to 0.11, I2 = 47%, 3082 participants). | 3236 health professionals (11 studies) | ⊕⊕⊝⊝ | 3 additional studies (154 participants) reported this outcome but no data were available for pooling. |
| CI: confidence interval; LDL: low‐density lipoprotein; OR: odds ratio; SD: standard deviation; SMD: standardised mean difference. *We interpreted SMDs using the following rules suggested by Higgins 2011a: < 0.40 represents a small effect size; 0.40 to 0.70, a moderate effect size; and > 0.70, a large effect size. | ||||
| GRADE Working Group grades of evidence: | ||||
| aDowngraded for study limitations (risk of bias and imprecision) and imprecision surrounding surrogate outcomes. Important benefits cannot be ruled out. | ||||
| Outcome or subgroup title | No. of studies | No. of participants | Statistical method | Effect size |
| 1 Patients appropriately screened (Fordis 2005 ‐ screening for dyslipidaemia; Levine 2011 ‐ LDL measurement) Show forest plot | 2 | 6027 | Odds Ratio (M‐H, Random, 95% CI) | 0.90 [0.77, 1.06] |
| 2 Patients appropriately treated (Fordis 2005 ‐ treatment for dyslipidaemia; Levine 2011 ‐ statin prescription) Show forest plot | 2 | 5491 | Odds Ratio (M‐H, Random, 95% CI) | 1.15 [0.89, 1.48] |
| 3 Patients appropriately screened (Fordis 2005 ‐ screening for dyslipidaemia; Levine 2011 ‐ HbA1c measurement) Show forest plot | 2 | 3056 | Odds Ratio (M‐H, Random, 95% CI) | 0.85 [0.69, 1.06] |
| 4 Patients appropriately treated (Fordis 2005 ‐ treatment for dyslipidaemia; Levine 2011 ‐ beta‐blocker prescription) Show forest plot | 2 | 6027 | Odds Ratio (M‐H, Random, 95% CI) | 1.12 [0.97, 1.29] |
| 5 Patients appropriately treated (Fordis 2005 ‐ treatment for dyslipidaemia; Levine 2011 ‐ ACEI/ARB prescription) Show forest plot | 2 | 6027 | Odds Ratio (M‐H, Random, 95% CI) | 1.06 [0.94, 1.19] |
| Outcome or subgroup title | No. of studies | No. of participants | Statistical method | Effect size |
| 1 Drug dose calculation accuracy (Simonsen 2014); ulcer classification accuracy (Bredesen 2016) Show forest plot | 2 | 201 | Std. Mean Difference (Fixed, 95% CI) | 0.03 [‐0.25, 0.31] |
| 2 Cardiac arrest simulation test (CASTest) Show forest plot | 1 | 2562 | Odds Ratio (M‐H, Random, 95% CI) | 1.46 [1.22, 1.76] |
| Outcome or subgroup title | No. of studies | No. of participants | Statistical method | Effect size |
| 1 At any time (fixed‐effect) Show forest plot | 8 | 3082 | Std. Mean Difference (Fixed, 95% CI) | 0.04 [‐0.03, 0.11] |
| 2 At any time (random‐effects) Show forest plot | 8 | 3082 | Std. Mean Difference (Random, 95% CI) | ‐0.09 [‐0.27, 0.09] |
| 3 Immediately after the training Show forest plot | 7 | 3012 | Std. Mean Difference (Random, 95% CI) | ‐0.10 [‐0.29, 0.08] |
| 4 After 3 or more months Show forest plot | 3 | 225 | Std. Mean Difference (Random, 95% CI) | ‐0.07 [‐0.41, 0.27] |