Scolaris Content Display Scolaris Content Display

Study flow diagram
Figuras y tablas -
Figure 1

Study flow diagram

Risk of bias graph: review authors' judgments about each risk of bias item presented as percentages across all included studies.
Figuras y tablas -
Figure 2

Risk of bias graph: review authors' judgments about each risk of bias item presented as percentages across all included studies.

Risk of bias summary: review authors' judgments about each risk of bias item for each included study.
Figuras y tablas -
Figure 3

Risk of bias summary: review authors' judgments about each risk of bias item for each included study.

Forest plot of comparison: 1 Behaviours, outcome: 1.1 Patients appropriately screened (Fordis 2005 ‐ screening for dyslipidaemia; Levine 2011 ‐ LDL measurement).
Figuras y tablas -
Figure 4

Forest plot of comparison: 1 Behaviours, outcome: 1.1 Patients appropriately screened (Fordis 2005 ‐ screening for dyslipidaemia; Levine 2011 ‐ LDL measurement).

Forest plot of comparison: 1 Behaviours, outcome: 1.2 Patients appropriately treated (Fordis 2005 ‐ treatment for dyslipidaemia; Levine 2011 ‐ statin prescription).
Figuras y tablas -
Figure 5

Forest plot of comparison: 1 Behaviours, outcome: 1.2 Patients appropriately treated (Fordis 2005 ‐ treatment for dyslipidaemia; Levine 2011 ‐ statin prescription).

Forest plot of comparison: 3 Knowledge, outcome: 3.1 At any time (fixed‐effect).
Figuras y tablas -
Figure 6

Forest plot of comparison: 3 Knowledge, outcome: 3.1 At any time (fixed‐effect).

Forest plot of comparison: 3 Knowledge, outcome: 3.2 At any time (random‐effects).
Figuras y tablas -
Figure 7

Forest plot of comparison: 3 Knowledge, outcome: 3.2 At any time (random‐effects).

Comparison 1 Behaviours, Outcome 1 Patients appropriately screened (Fordis 2005 ‐ screening for dyslipidaemia; Levine 2011 ‐ LDL measurement).
Figuras y tablas -
Analysis 1.1

Comparison 1 Behaviours, Outcome 1 Patients appropriately screened (Fordis 2005 ‐ screening for dyslipidaemia; Levine 2011 ‐ LDL measurement).

Comparison 1 Behaviours, Outcome 2 Patients appropriately treated (Fordis 2005 ‐ treatment for dyslipidaemia; Levine 2011 ‐ statin prescription).
Figuras y tablas -
Analysis 1.2

Comparison 1 Behaviours, Outcome 2 Patients appropriately treated (Fordis 2005 ‐ treatment for dyslipidaemia; Levine 2011 ‐ statin prescription).

Comparison 1 Behaviours, Outcome 3 Patients appropriately screened (Fordis 2005 ‐ screening for dyslipidaemia; Levine 2011 ‐ HbA1c measurement).
Figuras y tablas -
Analysis 1.3

Comparison 1 Behaviours, Outcome 3 Patients appropriately screened (Fordis 2005 ‐ screening for dyslipidaemia; Levine 2011 ‐ HbA1c measurement).

Comparison 1 Behaviours, Outcome 4 Patients appropriately treated (Fordis 2005 ‐ treatment for dyslipidaemia; Levine 2011 ‐ beta‐blocker prescription).
Figuras y tablas -
Analysis 1.4

Comparison 1 Behaviours, Outcome 4 Patients appropriately treated (Fordis 2005 ‐ treatment for dyslipidaemia; Levine 2011 ‐ beta‐blocker prescription).

Comparison 1 Behaviours, Outcome 5 Patients appropriately treated (Fordis 2005 ‐ treatment for dyslipidaemia; Levine 2011 ‐ ACEI/ARB prescription).
Figuras y tablas -
Analysis 1.5

Comparison 1 Behaviours, Outcome 5 Patients appropriately treated (Fordis 2005 ‐ treatment for dyslipidaemia; Levine 2011 ‐ ACEI/ARB prescription).

Comparison 2 Skills, Outcome 1 Drug dose calculation accuracy (Simonsen 2014); ulcer classification accuracy (Bredesen 2016).
Figuras y tablas -
Analysis 2.1

Comparison 2 Skills, Outcome 1 Drug dose calculation accuracy (Simonsen 2014); ulcer classification accuracy (Bredesen 2016).

Comparison 2 Skills, Outcome 2 Cardiac arrest simulation test (CASTest).
Figuras y tablas -
Analysis 2.2

Comparison 2 Skills, Outcome 2 Cardiac arrest simulation test (CASTest).

Comparison 3 Knowledge, Outcome 1 At any time (fixed‐effect).
Figuras y tablas -
Analysis 3.1

Comparison 3 Knowledge, Outcome 1 At any time (fixed‐effect).

Comparison 3 Knowledge, Outcome 2 At any time (random‐effects).
Figuras y tablas -
Analysis 3.2

Comparison 3 Knowledge, Outcome 2 At any time (random‐effects).

Comparison 3 Knowledge, Outcome 3 Immediately after the training.
Figuras y tablas -
Analysis 3.3

Comparison 3 Knowledge, Outcome 3 Immediately after the training.

Comparison 3 Knowledge, Outcome 4 After 3 or more months.
Figuras y tablas -
Analysis 3.4

Comparison 3 Knowledge, Outcome 4 After 3 or more months.

Summary of findings for the main comparison. Summary of findings: e‐learning versus traditional learning for health professionals

E‐learning versus traditional learning for health professionals

Patient or population: licensed health professionals (doctors, nurses and allied health professionals fully licensed to practice without supervision)

Settings: postgraduate education in any setting

Intervention: e‐learning (any intervention in which clinical content is distributed primarily by the Internet, Extranet or Intranet)

Comparison: traditional learning (any intervention not distributed through the media mentioned above)

Outcomes

Impact*

No of participants
(studies)

Certainty of the evidence
(GRADE)

Comments

Patient outcomes

Follow‐up: 12 months

E‐learning may make lead to little or no difference between the groups in proportion of patients with LDL cholesterol < 100 mg/dL (adjusted difference 4.0% (95% CI −0.3 to 7.9; 6399 patients) or glycated haemoglobin level < 8% (adjusted difference 4.6%, 95% CI −1.5 to 9.8; 3114 patients)

168 primary care clinics; 847 health professionals

(1 study)

⊕⊕⊝⊝
Lowa

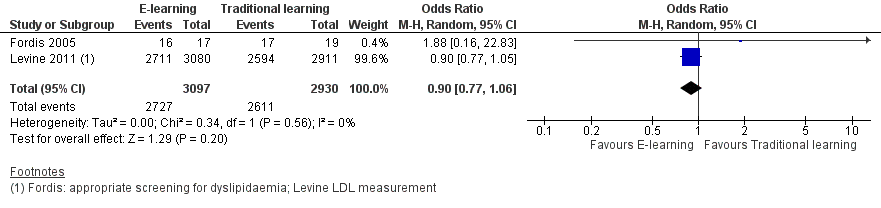
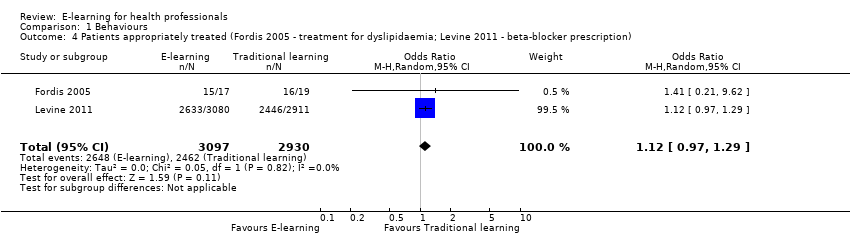
Health professionals'

behaviours

Follow‐up: 3‐12 months

E‐learning may make little or no difference between the groups in terms of screening for dyslipidaemia (OR 0.90, 95% CI 0.77 to 1.06, 6027 patients) or treatment for dyslipidaemia (OR 1.15, 95% CI 0.89 to 1.48; 5491 patients)

950 health professionals

(2 studies)

⊕⊕⊝⊝
Lowb

Studies reported multiple outcomes without specifying the primary outcome: to assess consistency, we explored 3 other possible combinations between the 2 study indicators.

Health professionals'

skills

Follow‐up: 0‐12 weeks

We are uncertain whether e‐learning improves or reduces health professionals' skills (SMD 0.03, 95% CI −0.25 to 0.31, I2 = 61%, 201 participants, 12 weeks' follow‐up).

2912 health professionals

(6 studies)

⊕⊝⊝⊝

Very lowc

The results from the largest trial and 2 more trials, favouring traditional learning (2640 participants), and from one trial favouring e‐learning could not be included in the meta‐analysis.

The meta‐analysis included 2 trials studying different professional skills (drug dose calculation and accuracy in pressure ulcers classification).

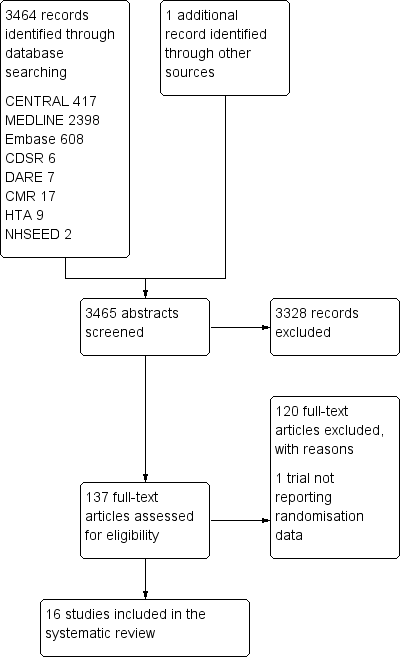
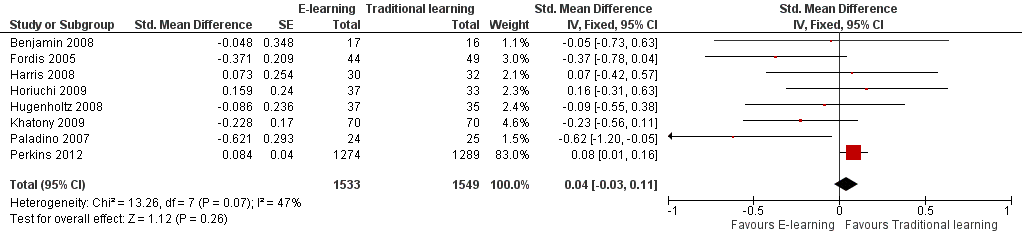
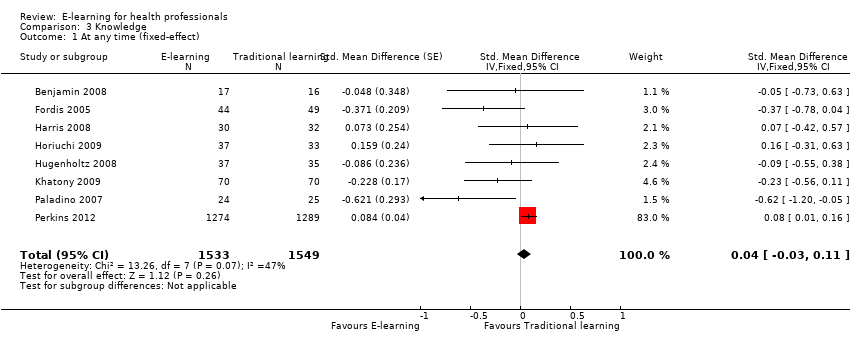
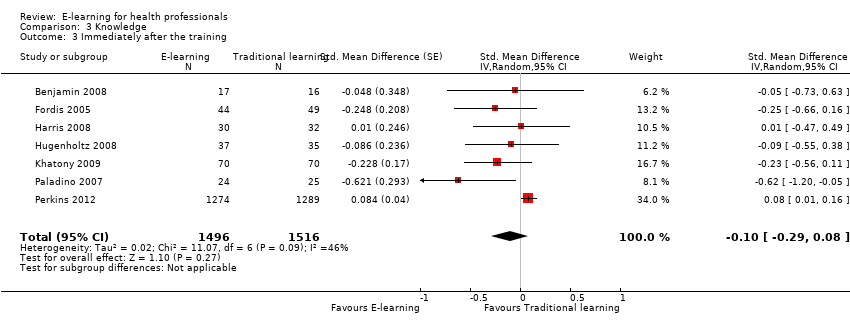
Health professionals'

knowledge

Any follow‐up:

0‐12 weeks

E‐learning may make little or no difference in health professionals' knowledge: 8 trials provided data to the meta‐analysis (SMD 0.04, 95% CI ‐0.03 to 0.11, I2 = 47%, 3082 participants).

3236 health professionals

(11 studies)

⊕⊕⊝⊝
Lowd

3 additional studies (154 participants) reported this outcome but no data were available for pooling.

CI: confidence interval; LDL: low‐density lipoprotein; OR: odds ratio; SD: standard deviation; SMD: standardised mean difference.

*We interpreted SMDs using the following rules suggested by Higgins 2011a: < 0.40 represents a small effect size; 0.40 to 0.70, a moderate effect size; and > 0.70, a large effect size.

GRADE Working Group grades of evidence:
High quality: further research is very unlikely to change our confidence in the estimate of effect.
Moderate quality: further research is likely to have an important impact on our confidence in the estimate of effect and may change the estimate.
Low quality: further research is very likely to have an important impact on our confidence in the estimate of effect and is likely to change the estimate.
Very low quality: we are uncertain about the estimate.

aDowngraded for study limitations (risk of bias and imprecision) and imprecision surrounding surrogate outcomes. Important benefits cannot be ruled out.
bDowngraded for study limitations (risk of bias) and inconsistency, with main effect estimates going in different directions (out of the five meta‐analyses, two were in favour of e‐learning and two in favour of traditional learning). Important benefits cannot be ruled out.
cDowngraded for study limitations: inconsistency, imprecision and indirectness. Important differences cannot be ruled out.
dDowngraded for study limitations (imbalance at baseline and incomplete data) and high inconsistency, with main effect estimates going in different directions (out of the eight studies, five were in favour of e‐learning and three in favour of traditional learning). Although the effect estimate is imprecise, large, relevant differences are unlikely.

Figuras y tablas -
Summary of findings for the main comparison. Summary of findings: e‐learning versus traditional learning for health professionals
Comparison 1. Behaviours

Outcome or subgroup title

No. of studies

No. of participants

Statistical method

Effect size

1 Patients appropriately screened (Fordis 2005 ‐ screening for dyslipidaemia; Levine 2011 ‐ LDL measurement) Show forest plot

2

6027

Odds Ratio (M‐H, Random, 95% CI)

0.90 [0.77, 1.06]

2 Patients appropriately treated (Fordis 2005 ‐ treatment for dyslipidaemia; Levine 2011 ‐ statin prescription) Show forest plot

2

5491

Odds Ratio (M‐H, Random, 95% CI)

1.15 [0.89, 1.48]

3 Patients appropriately screened (Fordis 2005 ‐ screening for dyslipidaemia; Levine 2011 ‐ HbA1c measurement) Show forest plot

2

3056

Odds Ratio (M‐H, Random, 95% CI)

0.85 [0.69, 1.06]

4 Patients appropriately treated (Fordis 2005 ‐ treatment for dyslipidaemia; Levine 2011 ‐ beta‐blocker prescription) Show forest plot

2

6027

Odds Ratio (M‐H, Random, 95% CI)

1.12 [0.97, 1.29]

5 Patients appropriately treated (Fordis 2005 ‐ treatment for dyslipidaemia; Levine 2011 ‐ ACEI/ARB prescription) Show forest plot

2

6027

Odds Ratio (M‐H, Random, 95% CI)

1.06 [0.94, 1.19]

Figuras y tablas -
Comparison 1. Behaviours
Comparison 2. Skills

Outcome or subgroup title

No. of studies

No. of participants

Statistical method

Effect size

1 Drug dose calculation accuracy (Simonsen 2014); ulcer classification accuracy (Bredesen 2016) Show forest plot

2

201

Std. Mean Difference (Fixed, 95% CI)

0.03 [‐0.25, 0.31]

2 Cardiac arrest simulation test (CASTest) Show forest plot

1

2562

Odds Ratio (M‐H, Random, 95% CI)

1.46 [1.22, 1.76]

Figuras y tablas -
Comparison 2. Skills
Comparison 3. Knowledge

Outcome or subgroup title

No. of studies

No. of participants

Statistical method

Effect size

1 At any time (fixed‐effect) Show forest plot

8

3082

Std. Mean Difference (Fixed, 95% CI)

0.04 [‐0.03, 0.11]

2 At any time (random‐effects) Show forest plot

8

3082

Std. Mean Difference (Random, 95% CI)

‐0.09 [‐0.27, 0.09]

3 Immediately after the training Show forest plot

7

3012

Std. Mean Difference (Random, 95% CI)

‐0.10 [‐0.29, 0.08]

4 After 3 or more months Show forest plot

3

225

Std. Mean Difference (Random, 95% CI)

‐0.07 [‐0.41, 0.27]

Figuras y tablas -
Comparison 3. Knowledge