Enseñanza virtual para los profesionales de la salud
Resumen
Antecedentes
El uso de enseñanza virtual, definida como cualquier intervención educacional mediada electrónicamente por Internet, ha aumentado de forma sostenida entre los profesionales de la salud a nivel mundial. Varios estudios han intentado medir los efectos de la enseñanza virtual en la práctica médica, que a menudo se han asociado con efectos positivos grandes en comparación con ninguna intervención y con efectos positivos pequeños en comparación con la enseñanza tradicional (sin acceso a la enseñanza virtual). Sin embargo, los resultados no son concluyentes.
Objetivos
Evaluar los efectos de los programas de enseñanza virtual versus enseñanza tradicional en profesionales de la salud autorizados para mejorar los resultados de los pacientes o los comportamientos, las aptitudes y el conocimiento de los profesionales de la salud.
Métodos de búsqueda
Se hicieron búsquedas en CENTRAL, MEDLINE, Embase, en otras cinco bases de datos y en tres registros de ensayos hasta julio 2016, sin niguna restricción en base al idioma o estado de publicación. Se examinaron las listas de referencias de los estudios incluidos y otras revisiones relevantes. Si fue necesario, se contactó con los autores de los estudios para recopilar información adicional sobre los estudios.
Criterios de selección
Ensayos aleatorizados que evaluaban la efectividad de la enseñanza virtual versus enseñanza tradicional para los profesionales de la salud. Se excluyeron los ensayos no aleatorizados y los ensayos que incluían a profesionales de la salud de pregrado.
Obtención y análisis de los datos
Dos autores de la revisión, de forma independiente, seleccionaron los estudios, extrajeron los datos y evaluaron el riesgo de sesgo. La certidumbre de la evidencia para cada resultado se calificó mediante el enfoque GRADE y los efectos en los resultados se estandarizaron mediante los riesgos relativos (riesgos relativos [RR] u odds ratio [OR]) o la diferencia de medias estandarizada [DME] cuando fue posible.
Resultados principales
Se incluyeron 16 ensayos aleatorizados con 5679 profesionales de la salud autorizados (4759 profesionales de la salud combinados, 587 enfermeras, 300 médicos y 33 consultores en salud del cuidado infantil).
En comparación con el aprendizaje tradicional a los 12 meses de seguimiento, la evidencia de baja incertidumbre indica que el aprendizaje electrónico puede tener poca o ninguna diferencia para los siguientes resultados de los pacientes: la proporción de pacientes con colesterol de lipoproteínas de baja densidad (LDL) de menos de 100 mg/dL (diferencia ajustada 4,0%, intervalo de confianza (IC) del 95% ‐0,3 a 7,9, N = 6399 pacientes, un estudio) y la proporción con un nivel de hemoglobina glucosilada inferior al 8% (diferencia ajustada 4,6%, IC del 95% ‐1,5 a 9,8, 3114 pacientes, un estudio). En el seguimiento de tres a 12 meses, la evidencia de baja certeza indica que el aprendizaje electrónico puede marcar poca o ninguna diferencia en los siguientes comportamientos de los profesionales de la salud: detección de la dislipidemia (OR 0,90; IC del 95%: 0,77 a 1,06; 6027 pacientes, dos estudios) y tratamiento de la dislipidemia (OR 1,15; IC del 95%: 0,89 a 1,48; 5491 pacientes, dos estudios). No se sabe con certeza si el aprendizaje electrónico mejora o reduce las aptitudes de los profesionales de la salud (2912 profesionales de la salud; seis estudios; evidencia de muy baja certeza), y es posible que no haya diferencias, o que éstas sean mínimas, en los conocimientos de los profesionales de la salud (3236 participantes; 11 estudios; evidencia de baja certeza).
Debido a la escasez de estudios y de datos, no fue posible explorar las diferencias en los efectos a través de diferentes subgrupos. Debido al informe deficiente, no fue posible recopilar información suficiente para completar una evaluación significativa del “riesgo de sesgo” para la mayoría de los criterios de calidad. El riesgo de sesgo se evaluó como poco claro para la mayoría de los estudios, aunque el ensayo más grande se clasificó como en bajo riesgo de sesgo. Los datos faltantes representaron una posible fuente de sesgo en varios estudios.
Conclusiones de los autores
En comparación con la enseñanza tradicional, la enseñanza virtual puede lograr poca o ninguna diferencia en los resultados de los pacientes o los comportamientos, las aptitudes o el conocimiento de los profesionales de la salud. Aunque la enseñanza virtual podría ser más exitosa que la enseñanza tradicional en ámbitos de educación médica particulares, las afirmaciones generales de que es intrínsecamente más efectiva que la enseñanza tradicional pueden ser engañosas.
PICO
Resumen en términos sencillos
¿La enseñanza virtual es más efectiva que la enseñanza tradicional para los profesionales de la salud?
¿Cuál era el objetivo de esta revisión?
El objetivo de esta revisión Cochrane es determinar si la enseñanza virtual, o sea, los programas formativos interactivos en línea, es más efectiva que la enseñanza tradicional (sin acceso a enseñanza virtual) para los profesionales de la salud autorizados para mejorar los resultados de los pacientes o los comportamientos, las aptitudes y el conocimiento de los profesionales de la salud. Los investigadores Cochrane recopilaron y analizan toda la evidencia relevante para responder a esta pregunta e identificaron 16 estudios.
Mensajes clave
En comparación con la enseñanza tradicional, la enseñanza virtual puede lograr poca o ninguna diferencia en la mejoría de los resultados de los pacientes o los comportamientos y el conocimiento de los profesionales de la salud y no se conoce si mejora o reduce las aptitudes de los profesionales de la salud.
¿Qué se estudió en esta revisión?
Las tecnologías modernas han creado nuevas plataformas para impulsar la educación médica. La enseñanza virtual ha ganado popularidad debido a los beneficios potenciales de la instrucción personalizada, permitiendo a los alumnos adaptar el ritmo y el contenido de los cursos a sus necesidades individuales, aumentando la accesibilidad de la información a los alumnos remotos, reduciendo los costos y facilitando las actualizaciones frecuentes del contenido.
Las revisiones anteriores no han identificado diferencias, aunque estuvieron limitadas por el tipo de participantes incluidos (combinación de profesionales de la salud autorizados y estudiantes de medicina) y los tipos de estudio evaluados (ensayos aleatorizados junto con no aleatorizados).
¿Cuáles son los principales resultados de la revisión?
Los autores de la revisión identificaron 16 estudios relevantes de 10 países diferentes, y proporcionaron datos sobre 5679 participantes (4759 profesionales de la salud combinados, 587 enfermeras, 300 médicos y 33 consultores de salud del cuidado infantil). Las empresas financiaron tres estudios, mientras que las agencias gubernamentales financiaron seis.
Un estudio con 847 profesionales de la salud encontró poca o ninguna diferencia entre la enseñanza virtual y la enseñanza tradicional en los resultados de los pacientes un año más tarde, y dos estudios con 950 profesionales de la salud indicaron poca a ninguna diferencia en los comportamientos de los profesionales de la salud a los tres a 12 meses, debido a que la certidumbre de la evidencia fue baja. No existe seguridad en cuanto a si la enseñanza virtual mejora o reduce las aptitudes de los profesionales de la salud a la semana cero a 12 de seguimiento, basado en los resultados de seis estudios con 2912 participantes y en evidencia de certidumbre muy baja. La enseñanza virtual también puede lograr poca o ninguna diferencia en el conocimiento de los profesionales de la salud, basado en los resultados de 11 estudios con 3236 participantes a la semana cero a 12 de seguimiento, debido a que la certidumbre de la evidencia fue baja.
¿Cuál es el grado de actualización de esta revisión?
Los autores de la revisión buscaron estudios que se habían publicado hasta julio 2016.
Authors' conclusions
Summary of findings
| E‐learning versus traditional learning for health professionals | ||||
| Patient or population: licensed health professionals (doctors, nurses and allied health professionals fully licensed to practice without supervision) Settings: postgraduate education in any setting Intervention: e‐learning (any intervention in which clinical content is distributed primarily by the Internet, Extranet or Intranet) Comparison: traditional learning (any intervention not distributed through the media mentioned above) | ||||
| Outcomes | Impact* | No of participants | Certainty of the evidence | Comments |
| Patient outcomes Follow‐up: 12 months | E‐learning may make lead to little or no difference between the groups in proportion of patients with LDL cholesterol < 100 mg/dL (adjusted difference 4.0% (95% CI −0.3 to 7.9; 6399 patients) or glycated haemoglobin level < 8% (adjusted difference 4.6%, 95% CI −1.5 to 9.8; 3114 patients) | 168 primary care clinics; 847 health professionals (1 study) | ⊕⊕⊝⊝ | — |
| Health professionals' behaviours Follow‐up: 3‐12 months | E‐learning may make little or no difference between the groups in terms of screening for dyslipidaemia (OR 0.90, 95% CI 0.77 to 1.06, 6027 patients) or treatment for dyslipidaemia (OR 1.15, 95% CI 0.89 to 1.48; 5491 patients) | 950 health professionals (2 studies) | ⊕⊕⊝⊝ | Studies reported multiple outcomes without specifying the primary outcome: to assess consistency, we explored 3 other possible combinations between the 2 study indicators. |
| Health professionals' skills Follow‐up: 0‐12 weeks | We are uncertain whether e‐learning improves or reduces health professionals' skills (SMD 0.03, 95% CI −0.25 to 0.31, I2 = 61%, 201 participants, 12 weeks' follow‐up). | 2912 health professionals (6 studies) | ⊕⊝⊝⊝ Very lowc | The results from the largest trial and 2 more trials, favouring traditional learning (2640 participants), and from one trial favouring e‐learning could not be included in the meta‐analysis. The meta‐analysis included 2 trials studying different professional skills (drug dose calculation and accuracy in pressure ulcers classification). |
| Health professionals' knowledge Any follow‐up: 0‐12 weeks | E‐learning may make little or no difference in health professionals' knowledge: 8 trials provided data to the meta‐analysis (SMD 0.04, 95% CI ‐0.03 to 0.11, I2 = 47%, 3082 participants). | 3236 health professionals (11 studies) | ⊕⊕⊝⊝ | 3 additional studies (154 participants) reported this outcome but no data were available for pooling. |
| CI: confidence interval; LDL: low‐density lipoprotein; OR: odds ratio; SD: standard deviation; SMD: standardised mean difference. *We interpreted SMDs using the following rules suggested by Higgins 2011a: < 0.40 represents a small effect size; 0.40 to 0.70, a moderate effect size; and > 0.70, a large effect size. | ||||
| GRADE Working Group grades of evidence: | ||||
| aDowngraded for study limitations (risk of bias and imprecision) and imprecision surrounding surrogate outcomes. Important benefits cannot be ruled out. | ||||
Background
Description of the intervention
E‐learning is a broad concept that involves the provision of educational programmes through electronic systems (Clark 2011). Currently, there is no standard or recognised definition of e‐learning for research purposes. The Medical Subjects Headings Vocabulary, for example, does not provide a specific item different from 'distance education', which includes correspondence, radio and television in addition to computer networks as media tools.
For the purpose of this review, we define e‐learning as any educational intervention that is mediated electronically via the Internet.
The biomedical literature contains numerous examples of terms synonymous with our definition for e‐learning: web‐based learning or training, online learning or education, computer‐assisted or ‐aided instruction (CAI) or computer‐based instruction (CBI), Internet‐based learning (Cook 2008a; Ruiz 2006), multimedia learning, technology‐enhanced learning and virtual learning. This diverse nomenclature has led to confusion: terms refer to an array of elements addressing a specific part of the e‐learning concept such as the medium (e.g. computer‐assisted instruction) or the delivery system (e.g. online learning). Although the term e‐learning sometimes refers to blended interventions involving electronic systems and face‐to‐face teaching, it is generally seen as a particular evolution of distance education, that is, the use of information technologies in order to deliver education to remote learners. When these learners are computer‐assisted and interconnected through computer networks, accessing online packages for learning, their distance education can unequivocally be referred to as e‐learning (Ruiz 2006; Ward 2001).
How the intervention might work
Although e‐learning shares many features with traditional learning systems, several aspects are unique (Zimitat 2001). Thus, assessing the quality of e‐learning programmes involves more than evaluating the quality and educational design of the course content; it should also involve an analysis of navigability, multimedia approach, degree of interactivity, and other key factors like intervention duration, repetition and feedback or layout impact in the development of an optimal e‐learning framework (Cook 2010a; Menon 2012; Straus 2004). The traditional role of trainers is evolving from a 'distributor of content' to a 'facilitator', enhancing the learner‐centred characteristics of the educational programme (Wentling 2000).
Applying the latest information technologies to education takes advantage of the increasing availability of Internet access (via optical fibres, WiFi and 3G/4G mobile phone technology), allowing a broad use of content across diverse settings (home, workplaces, and public places such as libraries, parks, and Internet points).
The delivery advantages of an e‐learning programme are obvious: some of their most cited benefits include lower costs, widespread distribution, increased accessibility to information, frequent content updates and personalised instruction in terms of content and pace of learning (Wentling 2000). Moreover, the interactivity and ability to link educational programmes with past experiences and specific needs fit the adult learning paradigm (Gibbons 2000).
As a result of these advantages, online learning is becoming more popular, and online courses worldwide are rapidly increasing in number, offering many specialty modules in their portfolios (Coppus 2007; Moja 2007; Ruiz 2007). Potential disadvantages include technology‐related costs, cost involved in developing programmes, possible technical problems, limited direct interaction, lack of exchanges and relations with other learners, absence of the physical presence of the teacher, decrease in motivation to learn, need for greater self‐discipline, and attenuation of the desire to compete with other learners (Cook 2007; Poon 2015; Welsh 2003). Moreover, equity should be considered carefully: poor access, language barriers, and lack of computer and Internet literacy could limit or prevent the participation of some health professionals, especially in low‐ and middle‐income countries. These limitations might prevent e‐learning from becoming the norm.
Previous systematic reviews on the efficacy and efficiency of e‐learning focused on the outcomes laid out in Kirkpatrick 1996: satisfaction, knowledge/attitudes, skills (in a test setting), behaviours (in a practice setting) and effects on patients (Cook 2008a; Cook 2010a; Lahti 2014; Lam‐Antoniades 2009; Sinclair 2016). Knowledge measurement by standardised tests is the most common outcome for both traditional and e‐learning systems. However, the progression from cognitive to behavioural steps – from acquiring knowledge to performing a task in practice – is neither linear nor simple: many other factors influence health professionals' behaviours, including system‐related factors (e.g. government incentives, guidelines, laws) and individual‐related factors (e.g. patient expectations, relationship with peers) (Rethans 2002).
These reviews found:
-
e‐learning is associated with large positive effects when compared with no intervention (Cook 2008a);
-
e‐learning is associated with small positive effects when compared with traditional educational interventions (without access to e‐learning), suggesting similar effectiveness (Cook 2008a; Lahti 2014; Sinclair 2016);
-
e‐learning and traditional educational interventions take similar time to participate in or complete (Cook 2010c);
-
insufficient evidence is available comparing e‐learning and traditional educational interventions on licensed health professionals' behaviours and patient outcomes (Sinclair 2016)
-
interactivity, practice exercises, repetition and feedback play pivotal roles in e‐learning and seem to be associated with improved learning outcomes (Cook 2010a).
A further relevant finding was the large heterogeneity in study designs, participants, instructional designs and outcomes. The authors conclude that e‐learning is not a single entity, although educators and researchers frequently view it as a single activity or a cluster of single activities, with relatively homogeneous effects (Cook 2010b).
Why it is important to do this review
E‐learning is gaining in popularity, and programmes are rapidly increasing in number. Their relatively low costs, high flexibility, and reduced dependence on geographical or site boundaries are attracting the investments of stakeholders (countries, networks, and universities) and increasing the demands of learners. This review synthesises the evidence for the effectiveness of e‐learning versus traditional educational interventions for licensed health professionals: more precise data about the effectiveness of e‐learning programmes have the potential to influence future investments regarding continuing medical education (CME) programmes.
Objectives
To assess the effects of e‐learning programmes versus traditional learning in licensed health professionals for improving patient outcomes or health professionals' behaviours, skills and knowledge.
Methods
Criteria for considering studies for this review
Types of studies
We included randomised trials and cluster‐randomised trials.
We used the Cochrane definitions for randomised trials (Higgins 2011a).We excluded non‐randomised trials (e.g. controlled before‐after studies or interrupted time series) as they are prone to a wider range of potential risks of bias and add little value when sufficient evidence is available from randomised trials (EPOC 2013a). Non‐randomised quality‐improvement intervention trials often overstate the strength of causal inference between intervention and outcomes compared to randomised trials (Li 2009). Conclusions from meta‐analyses exploring the causality of e‐learning might be undermined if largely based on studies that adopt intrinsically weaker research designs (Banzi 2009).
We included studies published in all languages and providing data about any follow‐up periods.
Types of participants
We included studies assessing e‐learning programmes aimed at improving patient outcomes or behaviours, skills or knowledge of licensed health professionals (doctors, nurses and allied health professionals). We focused on the license to practice without supervision as a discriminating factor, that is, health professionals who can fully practice a specific health‐related profession versus those who cannot. We included only those licensed to practice in this review. If the description was not sufficient, we sent requests to the study authors for additional information before excluding the studies.
We excluded studies recruiting undergraduate students, trainees and residents, or a mix of licensed and unlicensed participants, if data on the eligible participants were not provided by the authors after a formal request by email.
Types of interventions
Definition of e‐learning programme
We included any intervention distributing and facilitating access to clinical content primarily by the Internet, Extranet or Intranet: web‐based tutorials, virtual clinical vignettes, online discussion groups, Internet‐mediated videoconferencing, web seminars, emails, podcasts and virtual social networks. We excluded CD‐ROMs and applications not distributed through the media mentioned above. The learners may have had access to interventions through a variety of technologies (e.g. computers, personal digital assistant (PDA), smart phones, etc). We applied no restrictions with regard to the programme length: we included short programmes such as single lectures, workshops and modules as well as more extended educational programmes. We included an intervention if the description was sufficient to allow us to establish whether it could potentially improve knowledge or behaviours by any kind of intervention mentioned above; we also included interventions if the description was sufficient to allow us to establish that it was aimed at improving clinical practice (starting effective treatment or dismissing ineffective or harmful treatment). On the contrary, if the description proved unclear or insufficient, we sent a request to the study authors for additional information before excluding the studies.
We excluded e‐learning programmes focusing on non‐clinical medical topics (e.g. bio‐terrorism), defined as subjects different from the seven roles that all physicians need to have to be better doctors: medical expertise, communication, collaboration, leadership, health advocacy, scholarship and professionalism (The CanMEDS Framework).
We only included interventions in which e‐learning is a core or essential element. However, in multifaceted educational interventions (e.g. those applying two or more interventions to change health professionals' practice), the e‐learning component may have different degrees of centrality. Thus, we categorised studies into three groups:
-
e‐learning alone;
-
e‐learning as a core, essential component of a multifaceted intervention;
-
e‐learning as a component of a multifaceted intervention, but not considered core and essential.
We classified studies as having 'core' e‐learning interventions when e‐learning was the main part of the educational intervention (e.g. e‐learning together with the dissemination of guideline in a paper format). When learners could use the components other than e‐learning in the absence of e‐learning, or e‐learning was merely added to a multifaceted intervention that could easily be offered in its absence (e.g. audit and feedback interventions), we considered the intervention as 'not core'.
We included trials where the eligible comparators were educational interventions on the same topic without access to e‐learning (e.g. print books, face‐to‐face residential courses, guidelines dissemination) or multifaceted educational interventions without e‐learning on the same topic.
Types of outcome measures
We included the following outcome measures: patient outcomes and health professionals' behaviours, skills or knowledge (Kirkpatrick 1996; Straus 2004).
For the purposes of this review, we assessed different components targeted by educational interventions in clinical practice, excluding subjectively assessed outcomes (e.g. learner satisfaction or self‐reported knowledge, intentions to do, or beliefs about capabilities).
-
Patient outcomes defined as occurrence of deaths (i.e. mortality) or illness (i.e. morbidity; e.g. pneumonia, myocardial infarction, stroke) or progression of disease or hospitalisation.
-
Health professionals' behaviours, defined as actual professional performance: the incorporation of knowledge and skills into practice, with the adoption of proven treatments and interventions that can potentially improve patients' health.
-
Health professionals' skills, defined as deep learning or competence (what the learner is able to do), for example posing structured clinical questions considering patients, treatments, comparisons and outcomes, and understanding quantitative aspects (e.g. relative or absolute risk reduction, number needed to treat).
-
Health professionals' knowledge defined as factual knowledge or basic learning, for example knowing the benefits and risks of different interventions (e.g. in patients with unstable angina, aspirin is beneficial).
Primary outcomes
Patient clinical outcomes
-
Any objective measure of patient clinical outcomes (e.g. blood pressure, number of caesarean sections, medical errors)
Health professionals' behaviour
-
Any objective measure of clinical performance (e.g. number of tests ordered, prescriptions for a particular drug).
We assessed primary outcomes at two major time points:
-
immediately after the e‐learning intervention; and
-
at the longest duration of follow‐up available.
Secondary outcomes
Skills and knowledge are clinical competence dimensions related to the concept of 'know' (knowledge) and 'know‐how' (skills) (Miller 1990).
Health professionals' skills
-
Any objective measure of skills such as the assessment of learners' ability to demonstrate a procedure or technique (e.g. problem solving, objective structured clinical examination scores)
Health professionals' knowledge
-
Any objective measure of learners' knowledge such as assessment of factual or conceptual understanding (e.g. multiple‐choice test of knowledge).
Search methods for identification of studies
Electronic searches
The EPOC Information Specialist wrote the search strategies in consultation with the authors. We searched the Cochrane Database of Systematic Reviews (CDSR) and the Database of Abstracts of Reviews of Effects (DARE) (via the Cochrane Library) for related systematic reviews, and the following databases for primary studies:
-
Cochrane Central Register of Controlled Trials (CENTRAL; 2016, Issue 6) via Wiley (searched 7 July 2016).
-
MEDLINE, Epub Ahead of Print, In‐Process & Other Non‐Indexed Citations, MEDLINE Ovid Daily and MEDLINE Ovid, OvidSP (1946 to 7 July 2016).
-
Embase OvidSP (1980 to 7 July 2016).
-
Health Technology Assessment (2016, Issue 2) via Wiley (searched 7 July 2016).
-
NHS Economic Evaluation Database (2016, Issue 2) via Wiley (searched 7 July 2016).
-
Database of Abstracts of Reviews of Effects (2016, Issue 2) via Wiley (searched 7 July 2016).
Search strategies are comprised of keywords and controlled vocabulary terms. We applied no language or time limits. All strategies used are provided in Appendix 1
Searching other resources
We searched the following trial registries for ongoing and completed trials.
-
Word Health Organization (WHO) International Clinical Trials Registry Platform (ICTRP) (www.who.int/ictrp/en).
-
ClinicalTrials.gov, US National Institutes of Health (NIH).
We examined the reference lists of the included trials and relevant reviews published in the field of e‐learning (e.g. Chumley‐Jones 2002; Cook 2008a; Lam‐Antoniades 2009; Ruiz 2006; Wentling 2000; Wutoh 2004).
Data collection and analysis
Two review authors independently determined the eligibility of the intervention by examining the study report and the description of the intervention. If necessary, we referred to other related papers or reports (e.g. protocol or register records) and sent requests to the study authors for additional information, especially if e‐learning programmes were unclear or trialists did not clearly report the measures to monitor outcomes changes.
We collated multiple reports of the same studies so that each study, rather than each report, was the unit of interest in the review.
Where means and standard deviations (SDs) were not reported in the original article, we sent requests to the study authors for additional information.
We examined any relevant retraction statements and errata, and we searched for any key unpublished information that was missing from the reports of the included studies.
We used Review Manager 5 (RevMan 5) software to manage the included studies data (RevMan 2014).
Selection of studies
Two review authors independently screened the titles and abstracts and applied inclusion and exclusion criteria. We searched for complete manuscripts in the cases of uncertainty and resolved disagreements through discussion and consensus.
We documented the studies selection process in a PRISMA flow diagram (Liberati 2009).
Data extraction and management
Two review authors independently extracted data from the included studies, using a data sheet based on a modified version of the EPOC data collection checklist (EPOC 2015).
We extracted the following information.
-
Characteristics of participants: total number at baseline, total number at completion of the study, and type of target health professionals.
-
Interventions and controls: number of groups, interventions applied, frequency, duration and main components.
-
Methods: study design, duration of the study, setting and provider.
-
Outcomes: type of outcome measures, scales of measure, values for means and standard deviations.
-
Results: measures at follow‐up (including means and SD/standard errors (SEs)/confidence intervals (CIs) for continuous data and summary table for dichotomous data), withdrawals and loss to follow‐up.
We resolved any disagreement by discussion to reach a consensus. We described any ongoing study, if available, detailing its primary author, research question, methods and outcome measures along with its estimated date of completion.
Assessment of risk of bias in included studies
Two review authors independently assessed the quality of all eligible studies using the EPOC risk of bias criteria (EPOC 2013b). We resolved any discrepancies in quality rating by discussion and consensus. We collected the sources of information (to support our judgments) for each risk of bias assessment (e.g. quotation, summary of information from trial reports, correspondence with investigators). For each study, we assessed the following nine standard criteria for risk of bias.
-
Was the allocation sequence adequately generated?
-
Was the allocation adequately concealed?
-
Were baseline outcome measurements similar?
-
Were baseline characteristics similar?
-
Were incomplete outcome data adequately addressed?
-
Was knowledge of the allocated interventions adequately prevented during the study?
-
Was the study adequately protected against contamination?
-
Was the study free from selective outcome reporting?
-
Was the study free from other risks of bias?
We summarised the overall risk of bias for the single studies, considering the risk of bias for allocation concealment, incomplete outcome data, and blinding of outcome assessors to be key domains (Chan 2004; Dwan 2008; Kirkham 2010; Savovic 2012; Wood 2008). We judged the overall risk of bias at study level to be high if we had rated one of these items as being at high risk of bias and as low if we had judged all the items to be at low risk. We used the risk of bias of the single studies in the sensitivity analysis as detailed below.
Measures of treatment effect
We separately analysed patient outcomes, health professionals' behaviours, skills and knowledge.
When possible, we calculated the outcome measures in accordance with the intention‐to‐treat principle (i.e. analysing all data according to randomised group assignment, regardless of whether some of the participants violated the protocol, failed to adhere or were lost to follow‐up). Accordingly, we contacted study authors to obtain additional primary trial data when necessary.
We based analyses on the consideration of dichotomous (e.g. proportion of patients managed according to e‐learning programme) or continuous process measures (e.g. change in learners' knowledge scores). Where studies reported more than one measure for each endpoint, we planned to abstract the primary measure (as defined by the study authors) or the median measure identified. For example, if the comparison reported five continuous knowledge test variables and none of them were denoted as the primary variable, we ranked the effect sizes for the five variables and took the median value.
We extracted the outcomes from each study in natural units. We planned to combine final values if all the studies used the same scale, convert the effect size back into the natural units of the outcome measure most familiar to the target audience, or provide a standardised effect size.
We only included continuous data from a trial in the analyses if:
-
means and SDs were available or could be calculated; and
-
there was no clear evidence of a skewed distribution (e.g. as indicated by the ratio between the difference between the minimum or maximum value of the scale and the SD (Deeks 2011).
Because final value and change scores from baseline to final values should not be combined together as standardised mean difference, for studies providing both measures of treatment effect for continuous outcomes, we privileged the post‐test means. Due to randomisation, we did not expect differences between experimental and control group baseline scores (Higgins 2011a).
We planned to use results from both periods of cross‐over trials, unless there was a risk of carryover effects from one period to another, which presents a serious flaw. For cross‐over trials, we planned to use paired estimates of the effect (e.g. means and its SE), or calculated them from the exact statistical test results (e.g. paired t‐test for continuous data or McNemar's test for binary outcomes) (Cook 2008a; Elbourne 2002).
We present binary outcomes using odds ratios (OR) as appropriate and their 95% confidence intervals. For continuous outcomes, we report mean and standard deviation SD and standardised mean differences (SMD) for studies evaluating the same outcome in different ways. We interpreted the magnitude of the SMD as small for values of about 0.2, medium for SMDs of 0.5, and large for SMDs of 0.8 or more (Cohen 1988).
Unit of analysis issues
Studies with more than two arms
If more than one comparison from a study with more than two arms was eligible for the same comparison, we planned to adjust the number of health professionals to avoid double counting. We sought to make the adjustment by dividing the number of health professionals in the shared arm more or less evenly among the comparisons.
Cluster‐randomised trials
Owing to the focus on an educational intervention, we expected trials to be randomised by groups of professionals. In cluster‐randomised trials, 'clusters' of individuals are randomly allocated to study arms, and investigators measure outcomes based on the individual cluster members. Under such circumstances, it is necessary to adjust the results from primary trials for clustering before they are included in the meta‐analysis in order to avoid spurious precision in 95% CIs. We included cluster‐randomised trials with adequate definition of participants and clusters, as suggested by the Ottawa Statement for cluster‐randomised trials (Weijer 2012).
For the cluster‐randomised trials, in order to calculate adjusted (inflated) CIs that account for the clustering, we planned to proceed to an approximate analysis. Our approach was to multiply the SE of the effect estimate (from the analysis ignoring the clustering) by the square root of the design effect. For this, we used intra‐correlation coefficients borrowed from an external source (University of Aberdeen 2015).
Performing meta‐analyses using studies with unit of analysis errors required us to make a number of assumptions about the magnitude of unreported parameters, such as the intra‐correlation coefficients and the distributions of patients across clusters. We planned to re‐analyse studies with potential unit of analysis errors where possible, reporting the re‐analysed results (observed SEs, P values, or CIs) in an additional table along with the original results. If this was not possible, we reported only the original results and excluded the study from the meta‐analyses.
Dealing with missing data
For all included studies, we analysed available data obtained either from publications or following correspondence with the authors. In the Discussion section of the review, we considered the extent to which the missing data could alter our results and conclusions.
For all outcomes across all studies, we carried out analyses as far as possible on an intention‐to‐treat basis (i.e. we attempted to include all participants randomised to each group in the analyses, regardless of whether or not they received the allocated intervention). If intention‐to‐treat data were not available or for dichotomous and continuous data that were missing, we made no assumptions about loss to follow‐up, but we based analyses on participants completing the trial. If there was a discrepancy between the number randomised and the number analysed in each treatment group, we calculated and reported the percentage of loss to follow‐up in each group.
Where standard deviations were not specified, we calculated them using the exact statistical test results (e.g. P value related to t or F statistic) or, if these were not reported, we used differences in change scores, standardised using pretest variance. If neither P values nor any measure of variance were reported, we planned to use the average standard deviation from other similar studies (Cook 2008a).
We considered the impact of missing data separately for each primary and secondary outcome reported in each study.
Assessment of heterogeneity
To assess the contextual heterogeneity of the included trials (the differences in populations, context, interventions, comparators, follow‐up), we planned to conduct subgroup analyses according to important clinical and methodological characteristics, such as settings, interventions, comparators, etc. Between‐study heterogeneity was planned to be assessed overall and within the subgroups.
We included all the pre‐specified outcomes available from the individual studies in the meta‐analysis, with heterogeneity reported by the Q (Chi2) and the I2 statistics (Deeks 2011). The I2 describes the percentage of the variability in effect estimates that is due to heterogeneity rather than chance (sampling error). The Cochrane Handbook for Systematic Reviews of Interventions gives the following guidance on this decision based on I2 values to classify the inconsistency of the effect measures across studies (Higgins 2011a).
-
0% to 40%: might not be important.
-
30% to 60%: may represent moderate heterogeneity.
-
50% to 90%: may represent substantial heterogeneity.
-
75% to 100%: considerable heterogeneity.
In cases of moderate/substantial heterogeneity, we performed the analysis using both the fixed‐effect and the random‐effects model. Where considerable heterogeneity existed, we explored the magnitude and direction of the effects: if I2 was more than 75%, but the large majority of effect estimates were in the direction of benefit, and a random‐effects meta‐analysis yielded highly statistically significant benefits, we accepted the results. In this scenario, there would be some uncertainty about the amount of benefit but not its existence; it is safe to conclude that the intervention is beneficial (Virgili 2009). If substantial heterogeneity existed, studies were sparse or directions discordant, we did not pool data from the trials, and we did not conclude in favour of or against the intervention.
Assessment of reporting biases
We planned to use funnel plots to assess the reporting biases. We planned to evaluate the funnel plot asymmetry, not only visually but also with the use of tests for funnel plot asymmetry if we found more than 10 studies to include in the meta‐analysis. We planned to use the test proposed by Egger 1997 and by Harbord 2006 for continuous and dichotomous outcomes, respectively. If we detected asymmetry, we discussed possible explanations (e.g. publication bias or poor methodological quality of the studies) on the basis of available information and subsequently performed a sensitivity analysis (Higgins 2011b). We interpreted funnel plots cautiously, as they may be misleading.
Data synthesis
We grouped the studies according to important clinical and methodological (conceptual) characteristics, such as settings, interventions, comparators, etc. Accordingly, we synthesised similar studies reporting homogeneous (similar) outcomes and outcome measures.
We entered outcomes into RevMan 5 as effect sizes and their SEs (RevMan 2014).
We conducted meta‐analyses using both random‐effects and fixed‐effect models.
Subgroup analysis and investigation of heterogeneity
We planned to perform the following subgroup analyses if at least 10 observations (i.e. 10 studies in a meta‐analysis) were available for each characteristic modelled (Higgins 2011a).
-
Content: e‐learning programmes subgrouped by medical, surgical or rehabilitation topics, with the hypothesis that e‐learning programmes about medical topics (more likely to be centred on knowledge than skills or behaviours) are more effective than e‐learning programmes focused on other topics.
-
Health professionals targeted: doctors, nurses or physiotherapists, with the hypothesis that e‐learning programmes for doctors are more effective than e‐learning programmes for other health professionals.
-
Regulation: formally accredited versus non‐accredited e‐learning programmes, with the hypothesis that accredited e‐learning programmes are more effective than non‐accredited ones.
-
Format:
-
-
high‐interaction programmes (combination of at least three components, e.g. web module, chat, emails) or low‐interaction programmes (fewer than three components), with the hypothesis that high‐interaction programmes are more effective;
-
short (i.e. less than one week in duration) or long programmes (more than one week in duration), with the hypothesis that short programmes are more effective.
-
Other authors have identified some of these factors as potentially influencing the effect of educational e‐learning programmes (Cook 2008a; Cook 2008b; Ruiz 2006). We undertook the standard test for heterogeneity across subgroup results to investigate the differences between two subgroups (Borenstein 2009). We used these analyses to investigate potential sources of heterogeneity and reported them as post hoc exploratory data analyses only.
Sensitivity analysis
We planned to perform sensitivity analyses:
-
excluding studies assessed as at high risk of bias; and
-
excluding cross‐over trials.
We decided to aggregate studies at unclear risk of bias to those at high risk of bias. We adopted a conservative approach, assuming that an absence of information indicated inadequate quality ('guilty until proven innocent') (Moja 2014).
Summary of findings table
We assessed the certainty of evidence for pre‐specified outcomes using GRADEpro software (GRADEpro 2008). We justified all decisions to downgrade or upgrade the rating using footnotes, and we provided comments to aid readers' understanding of the review when necessary, as recommended by Cochrane (Schünemann 2011). summary of findings Table for the main comparison includes the overall grading of the certainty of evidence related to each of the outcomes according to the GRADE approach. We graded the certainty of evidence as high, moderate, low or very low; we downgraded the initial level of confidence considering the risk of bias, inconsistency and indirectness of evidence, imprecision of effect estimates and risk of publication bias.
Results
Description of studies
Results of the search
We identified 3464 records through the search strategy (CENTRAL 417, MEDLINE 2398, Embase 608, CDSR 6, DARE 7, CMR 17, HTA 9, NHSEED 2) and one additional article from other reviews. We excluded 3328 articles based on the abstracts (Figure 1).

Study flow diagram
We retrieved the full text of 137 articles to determine their eligibility for inclusion, excluding 121 records and including 16.
Included studies
Sixteen randomised trials providing data on 5679 learner participants met our predefined selection criteria. The trials were all published between 2005 and 2016. The mean sample size was 400 participants, but only 3 trials had more than 150 participants. Six trials took place in the USA (Benjamin 2008; Fordis 2005; Harris 2008; Le 2010; Levine 2011; Wilson‐Sands 2015), while the remaining 10 studies were in Japan (Horiuchi 2009), the Netherlands (Hugenholtz 2008), Finland (Mäkinen 2006), Australia (Maloney 2011; Perkins 2012), Brasil (Paladino 2007), the UK (Perkins 2012), Taiwan (Sheen 2008), Norway (Bredesen 2016; Simonsen 2014), and Iran (Khatony 2009); only Perkins 2012 was performed in two countries.
Characteristics of participants and settings
Four trials randomised 4759 mixed health professionals (Levine 2011; Maloney 2011; Perkins 2012; Wilson‐Sands 2015), seven trials randomised 587 nurses (Bredesen 2016; Horiuchi 2009; Khatony 2009; Mäkinen 2006; Paladino 2007; Sheen 2008; Simonsen 2014), four trials randomised 300 doctors (Fordis 2005; Harris 2008; Hugenholtz 2008; Le 2010), and one trial randomised 33 childcare health consultants (Benjamin 2008). Four trials took place in a primary care setting (Fordis 2005; Harris 2008; Le 2010; Levine 2011), six trials in a secondary care hospital setting (Horiuchi 2009; Khatony 2009; Mäkinen 2006; Paladino 2007; Sheen 2008; Wilson‐Sands 2015), three trials in a mixed setting (Bredesen 2016; Perkins 2012; Simonsen 2014), and one in a rehabilitation setting (Maloney 2011). Two trials were performed in other settings (Benjamin 2008; Hugenholtz 2008).
Characteristics of educational interventions used in the trials
All 16 trials included in our review compared e‐learning interventions versus face‐to‐face residential learning except for two trials comparing e‐learning with guideline dissemination or availability (Le 2010; Levine 2011). In five trials, the educational intervention was accredited for CME purposes (Fordis 2005; Harris 2008; Hugenholtz 2008; Le 2010; Levine 2011). In six trials, the duration of the e‐learning intervention, in terms of time needed to be spent on learning, was the same as the control intervention (Harris 2008; Hugenholtz 2008; Levine 2011; Maloney 2011; Perkins 2012; Simonsen 2014); in three trials, the duration of the educational session was longer in the control groups than in the e‐learning groups (Horiuchi 2009; Mäkinen 2006; Paladino 2007); in the remaining cases, investigators did not describe this information or confused it with the time the intervention was available to the participants. We considered the amount of time needed to be spent on learning as short (less than one week) in all trials except in Le 2010 and Levine 2011. In 11 trials e‐learning was administered alone, not in combination with other interventions; in the 5 remaining trials (Fordis 2005; Le 2010; Levine 2011; Maloney 2011; Perkins 2012), we considered e‐learning as being a core and essential element of a multifaceted educational intervention. The interactivity of the e‐learning tools was high (combination of at least three components) in nine trials and low in seven trials (Bredesen 2016; Harris 2008; Horiuchi 2009; Hugenholtz 2008; Paladino 2007; Sheen 2008; Wilson‐Sands 2015).
Outcome assessment
Investigators assessed patient outcomes by analysing administrative data; health professionals' behaviours, by auditing patients' charts and analysing administrative data and health professionals' skills, by administering written skills tests, simulations or objective structured clinical examinations. Trials assessed the 'knowledge' outcome through questionnaires: in four trials, the authors reported that the questionnaire was previously validated (Fordis 2005; Harris 2008; Khatony 2009; Perkins 2012), while the other studies did not specify.
Duration of follow‐up and outcome assessment times
The median follow‐up time from the conclusion of the educational intervention to the last outcome assessment was 1.5 weeks, ranging from 0 to 52 weeks. During the study, only three trials had more than one outcome assessment (Fordis 2005; Harris 2008; Le 2010).
For additional details on the studies, please refer to the Characteristics of included studies table.
Excluded studies
We excluded 121 studies for the following reasons: control group (no intervention at all, intervention on a different topic or different types of e‐learning in the control group), 51 studies; type of participants included (students or trainees), 30 studies; study design (non‐randomised trials), 21 studies; type of intervention used (not e‐learning, not delivered by the Internet, not core and essential or not compliant with CanMEDS criteria), 12 studies; type of outcome assessed (no outcome of interest or self‐reported outcome), 6 studies; incompleteness of data concerning the number of participants randomised per group, as well as the authors' inability to answer our request for clarification, 1 study (Esche 2015).
For additional details on the studies refer to the Characteristics of excluded studies table.
Ongoing trials
We did not identify any ongoing trials.
Risk of bias in included studies
We summarised decisions regarding individual domains within the Cochrane 'Risk of bias' tool in the 'Risk of bias' graph (Figure 2) and summary (Figure 3). We provided full details of review authors' judgments and support for judgments for each study within the 'Risk of bias' tables in the Characteristics of included studies.

Risk of bias graph: review authors' judgments about each risk of bias item presented as percentages across all included studies.
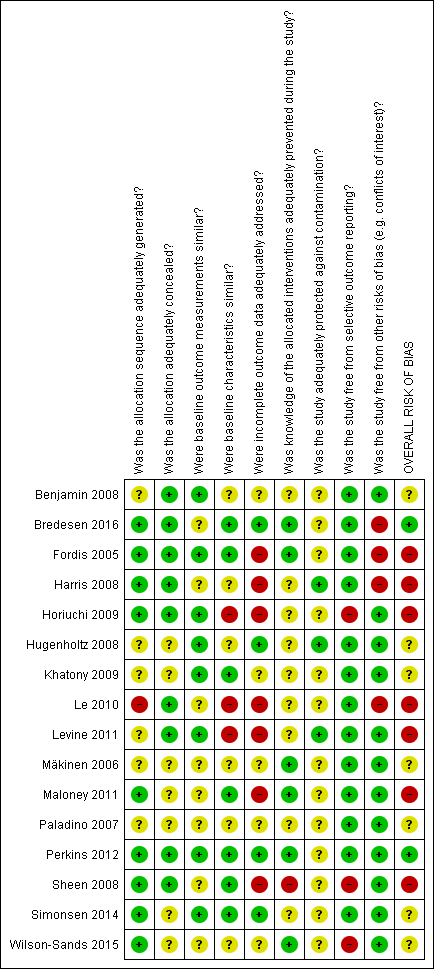
Risk of bias summary: review authors' judgments about each risk of bias item for each included study.
Was the allocation sequence adequately generated?
Nine studies used acceptable methods to generate the allocation sequence, including computerised random number generators (Fordis 2005; Horiuchi 2009; Maloney 2011; Perkins 2012; Simonsen 2014), a blind name draw (Harris 2008), a coin flip (Sheen 2008), or card or envelope shuffling (Bredesen 2016; Wilson‐Sands 2015); the remaining trials were at unclear risk of bias with the exception of one study that was at high risk of bias as participants from the same practice were matched into pairs before randomisation (Le 2010).
Was the allocation adequately concealed?
Nine studies clearly explained how the sequence was concealed (Benjamin 2008; Bredesen 2016; Fordis 2005; Harris 2008; Horiuchi 2009; Le 2010; Levine 2011; Perkins 2012; Sheen 2008), while the remaining ones did not mention the methods used by the investigators.
Were baseline outcome measurements similar?
Eight studies clearly reported similar baseline outcome measurements (Benjamin 2008, Fordis 2005, Horiuchi 2009, Hugenholtz 2008, Khatony 2009, Levine 2011, Perkins 2012, Simonsen 2014). We considered the remaining studies at unclear risk of bias because they did not report any information.
Were baseline characteristics similar?
Seven studies reported similar baseline characteristics (Bredesen 2016, Fordis 2005, Khatony 2009, Maloney 2011, Perkins 2012, Sheen 2008, Simonsen 2014) and six were unclear (Benjamin 2008, Harris 2008, Hugenholtz 2008, Mäkinen 2006, Paladino 2007, Wilson‐Sands 2015); we considered three trials at high risk of bias because of unbalance in the participants baseline characteristics (Horiuchi 2009, Le 2010, Levine 2011).
Were incomplete outcome data adequately addressed?
We judged seven studies to be at high risk of attrition bias (Fordis 2005; Harris 2008; Horiuchi 2009; Le 2010; Levine 2011; Maloney 2011; Sheen 2008): Sheen 2008 used a per‐protocol analysis, and the remaining six studies reported high loss to follow‐up, ranging from 15% in Fordis 2005 to 47% in Levine 2011. In four out of these studies, the attrition was bigger in the e‐learning group than in the control group (Fordis 2005; Harris 2008; Le 2010; Maloney 2011). We also judged four studies to be at low risk of attrition bias (Bredesen 2016; Hugenholtz 2008; Perkins 2012; Simonsen 2014), while five did not specify anything about loss to follow‐up (Benjamin 2008, Khatony 2009, Mäkinen 2006, Paladino 2007, Wilson‐Sands 2015).
Was knowledge of the allocated interventions adequately prevented during the study?
Participant blinding is not feasible in educational studies, so performance bias might be unavoidable in this setting. We considered the blinding of assessors, rating the risk of detection bias as high in Sheen 2008 because the authors clearly stated that the assessors were not blind. The study was so small that the assessors could possibly know and remember participants' allocation. Also in Perkins 2012, the authors were unable to ensure the blinding of the outcome assessors. However, this study was so large that we assumed some degree of separation between participants and assessors; besides, the process of measurement was well structured, limiting the risk of bias. Four studies reported that the knowledge of the allocated interventions was adequately prevented (Bredesen 2016, Fordis 2005; Mäkinen 2006; Maloney 2011) and we considered these studies as having low risk of bias. The remaining studies did not report any information on the blinding of the outcome assessors.
Was the study adequately protected against contamination?
Only three trials were clearly reported with respect to the protection against contamination (Harris 2008, Hugenholtz 2008, Levine 2011) while all the others were unclear.
Was the study free from selective outcome reporting?
We found inconsistencies between the outcomes declared in the methods section and the outcomes reported in the results section in three studies (Horiuchi 2009, Sheen 2008, Wilson‐Sands 2015).
Was the study free from other risks of bias?
We considered conflicts of interest to be a potential source of bias. Three studies were supported by private sponsor grants (Bredesen 2016; Fordis 2005; Harris 2008), and one received support in terms of evaluation tool or e‐learning modules development (Le 2010).
Overall risk of bias
Considering the risk of bias for allocation concealment, incomplete outcome data, and blinding of outcome assessors to be key domains we rated two trials as having a low risk of bias (Bredesen 2016, Perkins 2012), seven trials as having unclear risk of bias (Benjamin 2008, Hugenholtz 2008, Khatony 2009, Mäkinen 2006, Paladino 2007, Simonsen 2014, Wilson‐Sands 2015) and the remaining seven trials as having high risk of bias (Fordis 2005, Harris 2008, Horiuchi 2009, Le 2010, Levine 2011, Maloney 2011, Sheen 2008).
Effects of interventions
The summary of findings Table for the main comparison reports the effects of e‐learning compared to traditional learning in terms of patient outcomes and health professionals' behaviours, skills and knowledge.
Primary outcomes
Patient outcomes
One study addressed patient outcomes (Levine 2011). This study randomised 168 primary care clinics (847 health professionals) to highly interactive e‐learning versus face‐to‐face residential learning. After at least 12 months of exposure to the interventions, investigators used a patient administrative data review to compare the groups for two primary patient outcomes indicators. When compared with traditional learning, e‐learning may make little or no difference in terms of the proportion of patients with target levels of low‐density lipoprotein cholesterol (6399 patients; adjusted difference in improvement between the groups 4.0%, 95% CI −0.3 to 7.9) or the proportion of patients with target levels of glycated haemoglobin (3114 participants patients; adjusted difference in improvement between the groups 4.6%, 95% CI −1.5 to 9.8).
Health professionals' behaviours
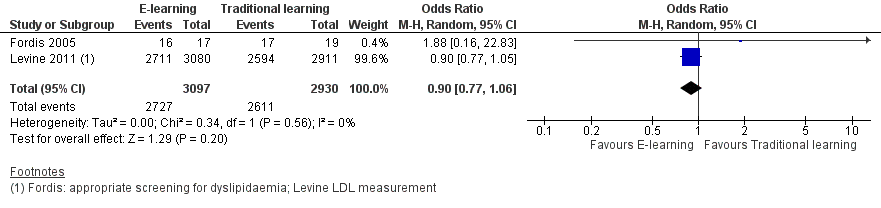
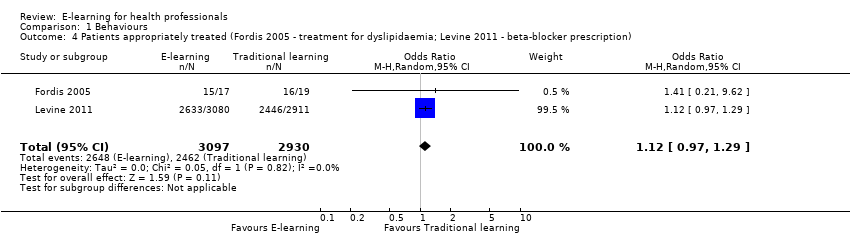
Two studies addressed this outcome in 950 health professionals (Fordis 2005; Levine 2011). Fordis 2005 randomised 103 primary care physicians to highly interactive and multifaceted e‐learning versus face‐to‐face residential learning. After 12 weeks, investigators performed a patient chart review for 20 randomly selected doctors per group, comparing the groups in terms of appropriate screening for and treatment of dyslipidaemia. Levine 2011 reported data from three performance indicators, which we considered as behaviour outcomes: beta‐blocker prescription, statin prescription, angiotensin‐converting‐enzyme (ACE) inhibitor or angiotensin‐receptor antagonist prescription. In order to assess consistency, we explored all the possible combinations between the indicators reported by the two studies. When compared with traditional learning, e‐learning may make little or no difference in terms of the proportion of patients appropriately screened or treated. In any combination of outcomes in meta‐analysis, the resulting 95% CI always included both a beneficial and a harmful effect (Analysis 1.1, Figure 4; Analysis 1.2, Figure 5; Analysis 1.3; Analysis 1.4; Analysis 1.5). These results are from meta‐analyses using random‐effects models. The fixed‐effect model yielded similar results (data not shown).

Forest plot of comparison: 1 Behaviours, outcome: 1.1 Patients appropriately screened (Fordis 2005 ‐ screening for dyslipidaemia; Levine 2011 ‐ LDL measurement).
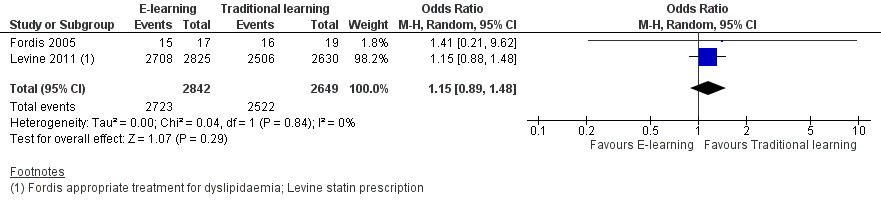
Forest plot of comparison: 1 Behaviours, outcome: 1.2 Patients appropriately treated (Fordis 2005 ‐ treatment for dyslipidaemia; Levine 2011 ‐ statin prescription).
Secondary outcomes
Health professionals' skills
It is uncertain whether e‐learning improves or reduces health professionals' skills more than traditional learning, as we assessed the certainty of the evidence as very low: we included six trials in 2912 participants (0 to 12 weeks' follow‐up) (Bredesen 2016; Mäkinen 2006; Perkins 2012; Sheen 2008; Simonsen 2014; Wilson‐Sands 2015), but we could only pool data for two (Bredesen 2016; Simonsen 2014; Analysis 2.1; SMD 0.03, 95% CI −0.25 to 0.31, I2 = 61%, 201 participants, 12 weeks' follow‐up). We were unable to include the results from the largest trial, Perkins 2012, and two more trials (Mäkinen 2006, Sheen 2008), favouring traditional learning (2640 participants), or one trial favouring e‐learning (Wilson‐Sands 2015).
Perkins 2012 assessed performance in a cardiac arrest simulation test (CASTest). The full analysis on the mixed population of participants showed little or no difference between the e‐learning and the traditional learning group. However, the study authors provided us with unpublished data (Kimani 2015 [pers comm]) excluding students and participants with missing professional status from the analysis (2562 health professionals, 91% of all the professionals for skill outcomes). A separate analysis on the remaining participants showed that the proportion of health professionals passing the test was higher in the traditional learning group than the e‐learning group (OR 1.46, 95% CI 1.22 to 1.76; Analysis 2.2).
Health professionals' knowledge
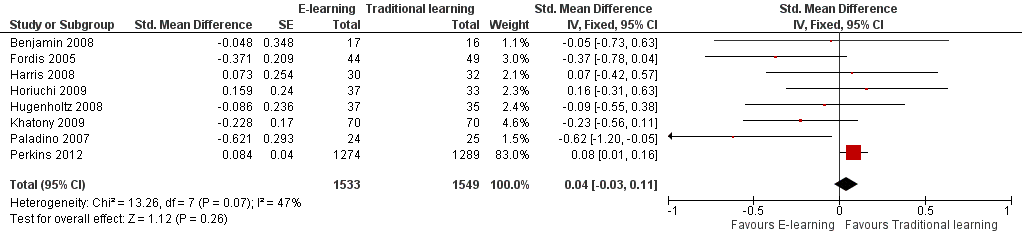
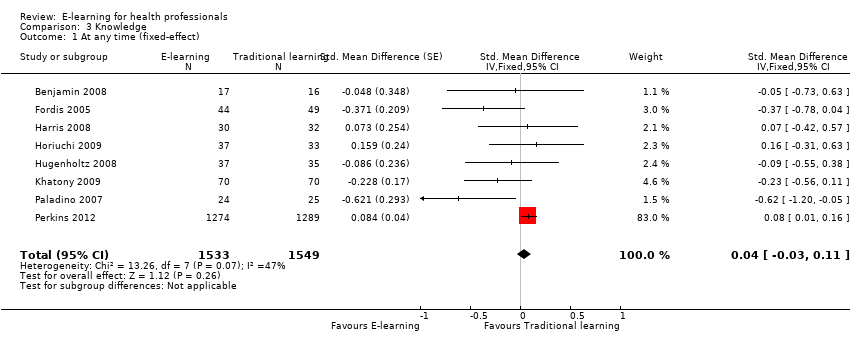
Eleven trials (3236 participants) assessed this outcome. Three trials in 154 participants reported the data poorly, precluding meta‐analysis (Le 2010; Maloney 2011; Sheen 2008), but we could pool results from the remaining eight trials (3082 health professionals). Seven studies (3012 participants) assessed results immediately after the training intervention took place (Benjamin 2008; Fordis 2005; Harris 2008; Horiuchi 2009; Hugenholtz 2008; Khatony 2009; Paladino 2007; Perkins 2012). Three studies in 225 participants carried out the assessment 4 to 12 weeks after the training (Fordis 2005; Harris 2008; Horiuchi 2009): one of these studies assessed the outcome only after 4 weeks (Horiuchi 2009). For each study we used the longest follow‐up data available.
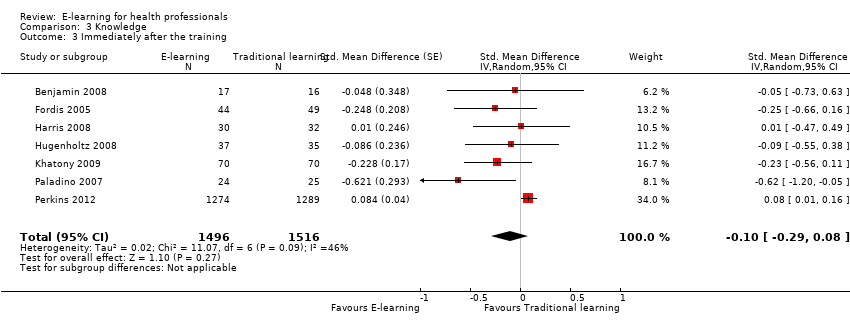
E‐learning may make little or no difference in health professionals' knowledge. We report results under both a fixed‐effect model (SMD 0.04, 95% CI −0.03 to 0.11; Figure 6) and a random‐effects model (SMD −0.09, 95% CI −0.27 to 0.09; Figure 7). The heterogeneity among the eight studies contributing to our meta‐analyses was moderate (I2 = 47%).

Forest plot of comparison: 3 Knowledge, outcome: 3.1 At any time (fixed‐effect).

Forest plot of comparison: 3 Knowledge, outcome: 3.2 At any time (random‐effects).
Separate analyses of studies with outcome measurement immediately after the training (Analysis 3.3) and after three or more months of follow‐up (Analysis 3.4) provided similar results.
Assessment of reporting bias
We did not have enough data to perform reporting bias analyses.
Subgroup analysis and investigation of heterogeneity
Owing to paucity of data, we decided not to perform subgroup analyses.
Sensitivity analysis
Excluding studies assessed as being at overall high or unclear risk of bias was not applicable because we rated all the studies at high or unclear risk of bias except Perkins 2012; we did not identify any cross‐over trials.
Discussion
Summary of main results
This systematic review included 16 randomised studies: most of the these were small trials (only three trials involved more than 150 participants) at high or unclear risk of bias due to poor reporting. Our results suggest that compared to traditional learning, e‐learning may lead to little or no difference in patient outcomes or health professionals' behaviours (low‐certainty evidence), while the effect on health professionals' skills is unclear (very low‐certainty evidence). E‐learning may also make little or no difference compared to more traditional instructional methods on health professionals' knowledge (low‐certainty evidence). In broad terms, e‐learning is associated with no important benefits compared to traditional learning. The only large trial considered, at low risk of bias, favoured traditional learning for skills. However, readers should interpret this noteworthy difference with great caution: our systematic review highlights how results of randomised trials were partially heterogenous, inconclusive and associated with negligible effect sizes.
Overall completeness and applicability of evidence
The randomised trials included in the review seemed to be sufficiently homogeneous in terms of included populations, comparison between e‐learning versus traditional learning, and outcome measures. With the exception of one study involving childcare health consultants, all studies included doctors or nurses. However, reporting within the studies was often poor, with few details on educational content, systems and implementation factors. The description of the setting usually lacked information about how innovative e‐learning was in the experimental context (e.g. early adoption, standard practice, etc.). In most cases it seems that e‐learning was an innovative intervention being compared to the conventional approach.
Twelve trials compared an e‐learning intervention with face‐to‐face learning, and two trials evaluated e‐learning against guideline dissemination or availability. We believe these comparisons are relevant for many decisions on whether to choose one educational approach or another.
Certainty of evidence
Overall, we identified several methodological limitations during our assessment of risk of bias, prompting us to downgrade the certainty of evidence to low for all outcomes except health professionals' knowledge (Figure 2; Figure 3; summary of findings Table for the main comparison). Incomplete outcome data was the dimension at highest risk of bias in terms of the number of studies assessed at high risk for this item. The number of participants who withdrew from or dropped out of the studies was more than 20% in five trials; in five more studies, authors did not state the percentage. The loss to follow‐up may have introduced imbalances between the groups included in the analyses.
Potential biases in the review process
We identified several trials through our search strategy, but we did not search the grey literature or databases that might be relevant for some health professionals but do not primarily focus on randomised trials (e.g. CINAHL). We report differences between protocol and review below. We judge these differences as having no influence on the original objectives of this review, or not as potential sources of bias to our findings.
Agreements and disagreements with other studies or reviews
Previous systematic reviews have found e‐learning to be associated with small positive effects compared with traditional educational interventions. In 2008, Cook and McDonald published a quantitative meta‐analysis including 201 studies of Internet‐based learning (Cook 2008a). The apparent discrepancy between our findings and their findings may be due to differences in the type of studies included: while we only considered randomised trials involving licensed health professionals, Cook 2008a also included non‐randomised trials and studies with undergraduate participants. Just 2 of the 76 studies included in Cook's work had the same PICO framework of our review (Fordis 2005; Mäkinen 2006). Only 14% of participants in the studies they included were practicing health professionals (the other participants were all students).
A document from the US Department of Education reported the results of a review and meta‐analysis of online learning studies for undergraduate students. They found that on average, the students in online learning environments performed modestly better than those receiving face‐to‐face instructions. We found little or no effect on learning outcomes, and one might speculate that e‐learning tools fare better in younger populations. This phenomenon is well known in social sciences research as a 'cohort effect', defined as "the effect that having been born in a certain time, region, period or having experienced the same life experience (in the same time period) has on the development of a particular group" (Glen 2005).
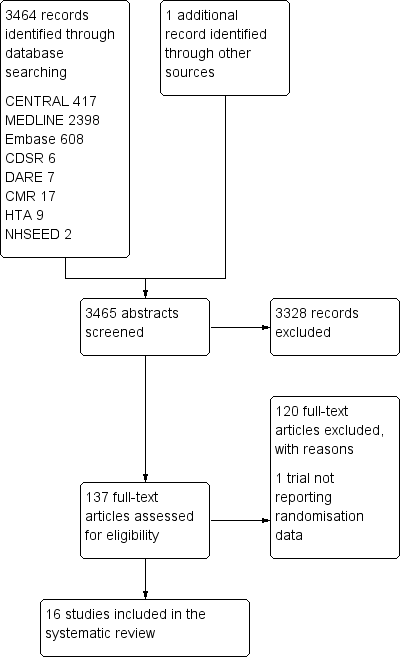
Study flow diagram
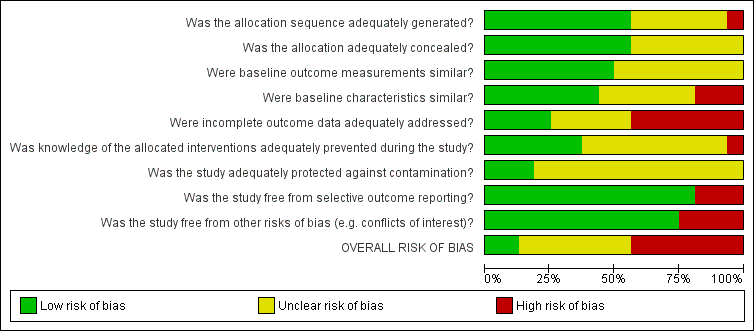
Risk of bias graph: review authors' judgments about each risk of bias item presented as percentages across all included studies.

Risk of bias summary: review authors' judgments about each risk of bias item for each included study.
Forest plot of comparison: 1 Behaviours, outcome: 1.1 Patients appropriately screened (Fordis 2005 ‐ screening for dyslipidaemia; Levine 2011 ‐ LDL measurement).

Forest plot of comparison: 1 Behaviours, outcome: 1.2 Patients appropriately treated (Fordis 2005 ‐ treatment for dyslipidaemia; Levine 2011 ‐ statin prescription).
Forest plot of comparison: 3 Knowledge, outcome: 3.1 At any time (fixed‐effect).

Forest plot of comparison: 3 Knowledge, outcome: 3.2 At any time (random‐effects).

Comparison 1 Behaviours, Outcome 1 Patients appropriately screened (Fordis 2005 ‐ screening for dyslipidaemia; Levine 2011 ‐ LDL measurement).

Comparison 1 Behaviours, Outcome 2 Patients appropriately treated (Fordis 2005 ‐ treatment for dyslipidaemia; Levine 2011 ‐ statin prescription).

Comparison 1 Behaviours, Outcome 3 Patients appropriately screened (Fordis 2005 ‐ screening for dyslipidaemia; Levine 2011 ‐ HbA1c measurement).
Comparison 1 Behaviours, Outcome 4 Patients appropriately treated (Fordis 2005 ‐ treatment for dyslipidaemia; Levine 2011 ‐ beta‐blocker prescription).

Comparison 1 Behaviours, Outcome 5 Patients appropriately treated (Fordis 2005 ‐ treatment for dyslipidaemia; Levine 2011 ‐ ACEI/ARB prescription).

Comparison 2 Skills, Outcome 1 Drug dose calculation accuracy (Simonsen 2014); ulcer classification accuracy (Bredesen 2016).

Comparison 2 Skills, Outcome 2 Cardiac arrest simulation test (CASTest).
Comparison 3 Knowledge, Outcome 1 At any time (fixed‐effect).

Comparison 3 Knowledge, Outcome 2 At any time (random‐effects).
Comparison 3 Knowledge, Outcome 3 Immediately after the training.

Comparison 3 Knowledge, Outcome 4 After 3 or more months.
| E‐learning versus traditional learning for health professionals | ||||
| Patient or population: licensed health professionals (doctors, nurses and allied health professionals fully licensed to practice without supervision) Settings: postgraduate education in any setting Intervention: e‐learning (any intervention in which clinical content is distributed primarily by the Internet, Extranet or Intranet) Comparison: traditional learning (any intervention not distributed through the media mentioned above) | ||||
| Outcomes | Impact* | No of participants | Certainty of the evidence | Comments |
| Patient outcomes Follow‐up: 12 months | E‐learning may make lead to little or no difference between the groups in proportion of patients with LDL cholesterol < 100 mg/dL (adjusted difference 4.0% (95% CI −0.3 to 7.9; 6399 patients) or glycated haemoglobin level < 8% (adjusted difference 4.6%, 95% CI −1.5 to 9.8; 3114 patients) | 168 primary care clinics; 847 health professionals (1 study) | ⊕⊕⊝⊝ | — |
| Health professionals' behaviours Follow‐up: 3‐12 months | E‐learning may make little or no difference between the groups in terms of screening for dyslipidaemia (OR 0.90, 95% CI 0.77 to 1.06, 6027 patients) or treatment for dyslipidaemia (OR 1.15, 95% CI 0.89 to 1.48; 5491 patients) | 950 health professionals (2 studies) | ⊕⊕⊝⊝ | Studies reported multiple outcomes without specifying the primary outcome: to assess consistency, we explored 3 other possible combinations between the 2 study indicators. |
| Health professionals' skills Follow‐up: 0‐12 weeks | We are uncertain whether e‐learning improves or reduces health professionals' skills (SMD 0.03, 95% CI −0.25 to 0.31, I2 = 61%, 201 participants, 12 weeks' follow‐up). | 2912 health professionals (6 studies) | ⊕⊝⊝⊝ Very lowc | The results from the largest trial and 2 more trials, favouring traditional learning (2640 participants), and from one trial favouring e‐learning could not be included in the meta‐analysis. The meta‐analysis included 2 trials studying different professional skills (drug dose calculation and accuracy in pressure ulcers classification). |
| Health professionals' knowledge Any follow‐up: 0‐12 weeks | E‐learning may make little or no difference in health professionals' knowledge: 8 trials provided data to the meta‐analysis (SMD 0.04, 95% CI ‐0.03 to 0.11, I2 = 47%, 3082 participants). | 3236 health professionals (11 studies) | ⊕⊕⊝⊝ | 3 additional studies (154 participants) reported this outcome but no data were available for pooling. |
| CI: confidence interval; LDL: low‐density lipoprotein; OR: odds ratio; SD: standard deviation; SMD: standardised mean difference. *We interpreted SMDs using the following rules suggested by Higgins 2011a: < 0.40 represents a small effect size; 0.40 to 0.70, a moderate effect size; and > 0.70, a large effect size. | ||||
| GRADE Working Group grades of evidence: | ||||
| aDowngraded for study limitations (risk of bias and imprecision) and imprecision surrounding surrogate outcomes. Important benefits cannot be ruled out. | ||||
| Outcome or subgroup title | No. of studies | No. of participants | Statistical method | Effect size |
| 1 Patients appropriately screened (Fordis 2005 ‐ screening for dyslipidaemia; Levine 2011 ‐ LDL measurement) Show forest plot | 2 | 6027 | Odds Ratio (M‐H, Random, 95% CI) | 0.90 [0.77, 1.06] |
| 2 Patients appropriately treated (Fordis 2005 ‐ treatment for dyslipidaemia; Levine 2011 ‐ statin prescription) Show forest plot | 2 | 5491 | Odds Ratio (M‐H, Random, 95% CI) | 1.15 [0.89, 1.48] |
| 3 Patients appropriately screened (Fordis 2005 ‐ screening for dyslipidaemia; Levine 2011 ‐ HbA1c measurement) Show forest plot | 2 | 3056 | Odds Ratio (M‐H, Random, 95% CI) | 0.85 [0.69, 1.06] |
| 4 Patients appropriately treated (Fordis 2005 ‐ treatment for dyslipidaemia; Levine 2011 ‐ beta‐blocker prescription) Show forest plot | 2 | 6027 | Odds Ratio (M‐H, Random, 95% CI) | 1.12 [0.97, 1.29] |
| 5 Patients appropriately treated (Fordis 2005 ‐ treatment for dyslipidaemia; Levine 2011 ‐ ACEI/ARB prescription) Show forest plot | 2 | 6027 | Odds Ratio (M‐H, Random, 95% CI) | 1.06 [0.94, 1.19] |
| Outcome or subgroup title | No. of studies | No. of participants | Statistical method | Effect size |
| 1 Drug dose calculation accuracy (Simonsen 2014); ulcer classification accuracy (Bredesen 2016) Show forest plot | 2 | 201 | Std. Mean Difference (Fixed, 95% CI) | 0.03 [‐0.25, 0.31] |
| 2 Cardiac arrest simulation test (CASTest) Show forest plot | 1 | 2562 | Odds Ratio (M‐H, Random, 95% CI) | 1.46 [1.22, 1.76] |
| Outcome or subgroup title | No. of studies | No. of participants | Statistical method | Effect size |
| 1 At any time (fixed‐effect) Show forest plot | 8 | 3082 | Std. Mean Difference (Fixed, 95% CI) | 0.04 [‐0.03, 0.11] |
| 2 At any time (random‐effects) Show forest plot | 8 | 3082 | Std. Mean Difference (Random, 95% CI) | ‐0.09 [‐0.27, 0.09] |
| 3 Immediately after the training Show forest plot | 7 | 3012 | Std. Mean Difference (Random, 95% CI) | ‐0.10 [‐0.29, 0.08] |
| 4 After 3 or more months Show forest plot | 3 | 225 | Std. Mean Difference (Random, 95% CI) | ‐0.07 [‐0.41, 0.27] |