نقش مکملیاری ویتامین D برای بیماریهای مزمن کبدی در بزرگسالان
چکیده
پیشینه
کمبود ویتامین D اغلب در افراد مبتلا به بیماری مزمن کبدی گزارش میشود. بنابراین، بهبود وضعیت ویتامین D میتواند تاثیر سودمندی بر افراد مبتلا به بیماری مزمن کبدی داشته باشد.
اهداف
ارزیابی تاثیرات مفید و مضر مکملیاری ویتامین D در افراد مبتلا به بیماریهای مزمن کبدی.
روشهای جستوجو
پایگاه ثبت کارآزماییهای کنترل شده گروه هپاتوبیلیاری در کاکرین؛ پایگاه ثبت مرکزی کارآزماییهای کنترل شده کاکرین (CENTRAL)؛ MEDLINE؛ Embase؛ Science Citation Index Expanded و نمايهنامه استنادی مقالات کنفرانسهای علمی را جستوجو کردیم. همچنین بانکهای اطلاعاتی کارآزماییهای در حال انجام و پلتفرم بینالمللی پایگاه ثبت کارآزماییهای بالینی سازمان جهانی بهداشت را جستوجو کردیم. کتابشناختیهای مقالات مرتبط را بررسی کرده و از کارشناسان و شرکتهای داروسازی برای یافتن کارآزماییهای بیشتر سوال پرسیدیم. همه جستوجوها تا ژانویه 2017 بودند.
معیارهای انتخاب
کارآزماییهای بالینی تصادفیسازی شده که ویتامین D را در هر دوز، مدت زمان، و نحوه مصرف در برابر دارونما (placebo) یا عدم مداخله در بزرگسالان مبتلا به بیماریهای مزمن کبدی مقایسه کردند. ویتامین D میتواند به صورت مکمل ویتامین D3 (کلهکلسیفرول (cholecalciferol)) یا ویتامین D2 (ارگوکلسیفرول (ergocalciferol))، یا فرم فعال ویتامین D، یعنی 1‐آلفا‐هیدروکسی ویتامین D یا آلفاکلسیدول؛ 25‐هیدروکسی ویتامین D (کلسیدیول (calcidiol)) یا 1,25‐دی هیدروکسی ویتامین D (کلسیتریول (calcitriol)).
گردآوری و تجزیهوتحلیل دادهها
از پروسیجرهای استاندارد روششناسی مورد انتظار مرکز همکاریهای کاکرین استفاده کردیم. با نویسندگان کارآزماییها تماس گرفتیم تا برای اطلاعات از دسترفته درخواست دهیم. متاآنالیز اثرات‐تصادفی و اثر‐ثابت را انجام دادیم. برای پیامدهای دو‐حالتی، خطر نسبی (RR)، و برای پیامدهای پیوسته، تفاوت میانگین (MD) را با 95% فاصله اطمینان (CI) و CIهای تعدیل شده تجزیهوتحلیلهای مرحلهای کارآزمایی (Trial Sequential Analyses) محاسبه کردیم. نسبت شانس (OR) پتو را برای نرخ عوارض محاسبه کردیم. خطر سوگیری (bias) را در حوزههای ارزیابی خطر خطاهای سیستماتیک ارزیابی کردیم. برای کنترل خطر خطاهای تصادفی، تجزیهوتحلیلهای مرحلهای کارآزمایی را انجام دادیم. کیفیت شواهد را با استفاده از سیستم درجهبندی توصیه، ارزیابی، توسعه و ارزشیابی (GRADE) ارزیابی کردیم.
نتایج اصلی
15 کارآزمایی بالینی تصادفیسازی شده را با 1034 شرکتکننده تصادفیسازی شده وارد کردیم. تمام کارآزماییها دارای طراحی گروه موازی بودند. نه کارآزمایی در کشورهای با سطح درآمد بالا و شش کارآزمایی در کشورهای با سطح درآمد متوسط انجام شد. تمام کارآزماییها در معرض خطر بالای سوگیری قرار داشتند. شش کارآزمایی شامل شرکتکنندگان مبتلا به هپاتیت مزمن C، چهار کارآزمایی شامل شرکتکنندگان مبتلا به سیروز کبدی، چهار کارآزمایی شامل شرکتکنندگان مبتلا به بیماری کبد چرب غیر‐الکلی و یک کارآزمایی شامل دریافتکنندگان پیوند کبد بودند. تمام کارآزماییهای وارد شده وضعیت ویتامین D شرکتکنندگان را در خط پایه گزارش کردند. شرکتکنندگان در شش کارآزمایی دارای خط پایه مقادیر 25‐هیدروکسی ویتامین D در حد کافی یا بالای مقدار مناسب بودند (20 نانوگرم/میلیلیتر)، در حالی که شرکتکنندگان در نه کارآزمایی باقی مانده دارای ویتامین D کافی نبودند (کمتر از 20 نانوگرم/میلیلیتر). تمام کارآزماییها ویتامین D را به صورت خوراکی ارائه کردند. میانگین مدت زمان مصرف مکملیاری ویتامین D معادل 0.5 سال و مدت پیگیری 0.6 سال بود. یازده کارآزمایی (831 شرکتکننده؛ 40% زن؛ میانگین سن 52 سال) ویتامین D3، یک کارآزمایی (18 مرد؛ میانگین سنی 61 سال) را با سه گروه مداخله ویتامین D2و 25‐دیهیدروکسیویتامین D را در گروههای جداگانه بررسی کرد و سه کارآزمایی (185 شرکتکننده؛ 55% زن؛ میانگین سن 55 سال) 1,25‐دیهیدروکسیویتامین D را تست کردند. هفت کارآزمایی از دارونما (placebo) و هشت کارآزمایی از عدم مداخله در گروه کنترل استفاده کردند.
تاثیر ویتامین D بر مورتالیتی به هر علتی در پایان پیگیری نامطمئن بود زیرا نتایج غیر‐دقیق بودند (Peto OR: 0.70؛ 95% فاصله اطمینان (CI): 0.09 تا 5.38؛ 32% = I2؛ 15 کارآزمایی؛ 1034 شرکتکننده؛ شواهد با کیفیت بسیار پائین). تجزیهوتحلیل مرحلهای کارآزمایی در مورد مورتالیتی به هر علتی بر اساس نرخ مرگومیر در گروه کنترل به میزان 10%، کاهش نسبت خطر (relative risk) معادل 28% در گروه مداخله آزمایشی، خطای نوع یک = 2.5% و خطای نوع دو = 10% انجام شد (90% قدرت). هیچ نوع تنوع (diversity) وجود نداشت. اندازه اطلاعات مورد نیاز 6396 شرکتکننده بود. منحنی تجمعی Z مرز پایش مرحلهای کارآزمایی برای مزیت و آسیب پس از پانزدهمین کارآزمایی را رد نکرد، و CI تعدیل شده تجزیهوتحلیلهای مرحلهای کارآزمایی از 0.00 تا 2534 متغیر بود.
تاثیر ویتامین D بر مرگومیر مرتبط با کبد (RR: 1.62؛ 95% CI؛ 0.08 تا 34.66؛ 1 کارآزمایی؛ 18 شرکتکننده) و حوادث جانبی جدی مانند هیپرکلیسمی (RR: 5.00؛ 95% CI؛ 0.25 تا 100.8؛ 1 کارآزمایی؛ 76 شرکتکننده)، انفارکتوس میوکارد (RR: 0.75؛ 95% CI؛ 0.08 تا 6.81؛ 2 کارآزمایی؛ 86 شرکتکننده) و تیروئیدیت (RR: 0.33؛ 95% CI؛ 0.01 تا 7.91؛ 1 کارآزمایی؛ 68 شرکتکننده) نامطمئن بود، زیرا نتایج غیر‐دقیق بودند. کیفیت شواهد مربوط به تمام این پیامدها بسیار پائین است. تاثیر ویتامین D3 بر حوادث جانبی غیر‐جدی مانند گلوسیت (glossitis)؛ (RR: 3.70؛ 95% CI؛ 0.16 تا 87.6؛ 1 کارآزمایی؛ 65 شرکتکننده؛ شواهد با کیفیت بسیار پائین) نامطمئن است زیرا این نتیجه غیر‐دقیق بود.
با توجه به تعداد کم دادهها، ما تجزیهوتحلیل مرحلهای کارآزمایی را در مورد مورتالیتی مرتبط با کبد، و حوادث جانبی جدی و غیر‐جدی انجام ندادیم.
ما هیچ دادهای را در مورد موربیدیتی مرتبط با کبد و کیفیت زندگی مرتبط با سلامت در کارآزماییهای تصادفیسازی شده وارد شده در این مرور نیافتیم.
نتیجهگیریهای نویسندگان
ما مطمئن نیستیم که مکملهای ویتامین D به شکل ویتامین D3، ویتامین D2؛ 1,25‐دیهیدروکسی ویتامین D یا 25‐دیهیدروکسی ویتامین D تاثیر مهمی بر مورتالیتی به هر علتی، مرگومیر مرتبط با کبد یا حوادث جانبی جدی یا غیر‐جدی دارند چرا که نتایج غیر‐دقیق بودند. هیچ شواهدی در مورد تاثیر مکملیاری ویتامین D بر موربیدیتی مرتبط با کبد و کیفیت زندگی مرتبط با سلامت وجود ندارد. نتیجهگیریهای ما بر اساس کارآزماییهای اندک با تعداد کمی شرکتکننده و بر فقدان داده در مورد پیامدهای بالینی مهم استوار است. علاوه بر این، کارآزماییهای مورد تجزیهوتحلیل در معرض خطر بالای سوگیری همراه با ناهمگونی قابل توجه درونی (intertrial heterogeneity) قرار داشتند. کیفیت کلی شواهد بسیار پائین است.
PICO
خلاصه به زبان ساده
مکملیاری ویتامین D برای بیماریهای مزمن کبدی
سوال مطالعه مروری
آیا مکملیاری ویتامین D برای افراد مبتلا به بیماری مزمن کبدی سودمند هستند یا مضر؟
پیشینه
شواهد موجود در مورد ویتامین D و بیماریهای مزمن کبدی غیر‐قطعی است. بسیاری از مطالعات مشاهدهای (یک مطالعه در مورد گروهی از افرادی که محقق به علت نگرانیهای اخلاقی یا محدودیتهای لجستیکی قادر به کنترل درمانها و بیماریها نیست) نشان میدهند که بیماریهای مزمن کبدی با سطح پائین ویتامین D خون مرتبط هستند. بنابراین، بهبود سطح ویتامین D میتواند تاثیرات مفیدی بر بیماریهای مزمن کبدی داشته باشد. نتایج به دست آمده از کارآزماییهای بالینی تصادفیسازی شده (کارآزماییهایی که در آن افراد به صورت تصادفی به یکی از دو یا چند گروه درمان اختصاص داده میشوند) در مورد تست کردن تاثیر مکملیاری ویتامین D برای بیماریهای مزمن کبدی، متناقض هستند. هدف از این مرور سیستماتیک (خلاصهای از نتایج کارآزماییهای مربوط به مراقبت سلامت موجود)، تجزیهوتحلیل مزایا و آسیبهای اشکال مختلف ویتامین D در افراد مبتلا به بیماریهای مزمن کبدی بود.
ویژگیهای مطالعه
پانزده کارآزمایی دادههایی را برای این مرور ارائه کردند؛ 1034 شرکتکننده بزرگسال به صورت تصادفی به گروه دریافت کننده ویتامین D برای مقایسه با دارونما (placebo) یا عدم درمان اختصاص داده شدند. نه کارآزمایی در کشورهای با سطح درآمد بالا و شش کارآزمایی در کشورهای با سطح درآمد متوسط انجام شد. تمام کارآزماییها در معرض خطر سوگیری (bias) بالا قرار گرفتند (که در آنها مزایا بیش از حد انتظار برآورد شد و آسیبها کمتر از حد انتظار برآورد شدند). سن شرکتکنندگان بین 18 تا 84 سال بود و بهطور میانگین 42% از شرکتکنندگان زن بودند. شش کارآزمایی شامل شرکتکنندگان مبتلا به هپاتیت مزمن C، چهار کارآزمایی شامل شرکتکنندگان مبتلا به سیروز کبدی، چهار کارآزمایی شامل شرکتکنندگان مبتلا به بیماری کبد چرب غیر‐الکلی و یک کارآزمایی شامل دریافتکنندگان پیوند کبد بودند. بسیاری از کارآزماییهای وارد شده وضعیت اولیه ویتامین D شرکتکنندگان را گزارش کردند. تجویز ویتامین D بهطور میانگین شش ماه طول کشید و اکثر کارآزماییها از شکل کلهکلسیفرول (cholecalciferol) (ویتامین D3) استفاده کردند.
بودجه و منابع مالی
شش کارآزمایی به نظر میرسد فارغ از حمایت مالی صنعت یا نوع دیگر حمایت انتفاعی بودند که این موضوع ممکن است منجر به سوگیری نتایج مطالعات شود. هشت کارآزمایی ممکن است فارغ از سوگیری برای سودآوری (for‐profit bias) نباشند چرا که هیچ گونه اطلاعاتی در مورد پشتیبانی یا حمایت مالی کارآزماییهای بالینی را ارائه نکردند. یک کارآزمایی با حمایت مالی صنعت انجام شده بود.
نتایج کلیدی
این مرور نشان میدهد که ویتامین D تاثیرات مفید یا مضری بر بیماریهای مزمن کبدی ندارد. با این حال، کارآزماییهای بسیار کمی در مورد تشخیص فردی بیماریهای مزمن کبدی وجود داشت و شرکتکنندگان بسیار کمی در کارآزماییهای مجزا و همچنین در متاآنالیز ما وجود داشتند. بنابراین، نمیتوان مزایا و آسیبها را نادیده گرفت.
کیفیت شواهد
تمام کارآزماییها در معرض خطر بالای سوگیری قضاوت شدند (یعنی، احتمالا مزایا بیش از حد انتظار و آسیبها کمتر از حد انتظار برآورد شدند).
بهروز بودن شواهد
این شواهد تا ژانویه 2017 بهروز است.
Authors' conclusions
Summary of findings
| Vitamin D compared to placebo or no intervention for chronic liver diseases in adults | ||||||
| Patient or population: adults with chronic liver diseases. | ||||||
| Outcomes | Anticipated absolute effects* (95% CI) | Relative effect | № of participants | Quality of the evidence | Comments | |
| Risk with placebo or no intervention | Risk with vitamin D | |||||
| All‐cause mortality at the end of follow‐up Follow‐up: 0.1 to 1.4, mean 0.6 years | Study population | OR 0.70 | 1034 | ⊕⊝⊝⊝ | Trial Sequential Analyses‐adjusted CI was 0.00 to 2534. | |
| 4 per 1.000 | 3 per 1.000 | |||||
| Liver‐related mortality Follow‐up: mean 1 year | Study population | RR 1.62 | 18 | ⊕⊝⊝⊝ | Due to few data, we did not conduct Trial Sequential Analysis which would only have revealed larger imprecision. | |
| 0 per 1.000 | 0 per 1.000 | |||||
| Serious adverse events ‐ hypercalcaemia Follow‐up: mean 1 year | Study population | RR 5.00 | 76 | ⊕⊝⊝⊝ | Due to few data, we did not conduct Trial Sequential Analysis which would only have revealed larger imprecision. | |
| 0 per 1.000 | 0 per 1.000 | |||||
| Serious adverse events ‐ myocardial infarction Follow‐up: 0.2 to 1, mean 0.6 years | Study population | RR 0.75 | 86 | ⊕⊝⊝⊝ | Due to few data, we did not conduct Trial Sequential Analysis which would only have revealed larger imprecision. | |
| 25 per 1.000 | 19 per 1.000 | |||||
| Serious adverse events ‐ thyroiditis Follow‐up: mean 0.2 years | Study population | RR 0.33 | 68 | ⊕⊝⊝⊝ | Due to few data, we did not conduct Trial Sequential Analysis which would only have revealed larger imprecision. | |
| 29 per 1.000 | 10 per 1.000 | |||||
| Failure of sustained virological response Follow‐up: 0.3 to 1.4, mean 0.9 years | Study population | RR 0.59 | 422 | ⊕⊝⊝⊝ Very low 1,2,3,6 | The trial sequential monitoring boundary is ignored due to little information use (0.6%). | |
| 465 per 1.000 | 275 per 1.000 | |||||
| Acute cellular rejection in liver transplant recipients Follow‐up: mean 0.08 years | Study population | RR 0.33 | 75 | ⊕⊝⊝⊝ Very low 1,3,7 | The trial sequential monitoring boundary is ignored due to little information use (0.84%). | |
| 120 per 1.000 | 40 per 1.000 | |||||
| *The risk in the intervention group (and its 95% confidence interval) is based on the assumed risk in the comparison group and the relative effect of the intervention (and its 95% CI). | ||||||
| GRADE Working Group grades of evidence
| ||||||
| 1 Downgraded one level due to risk of bias: all trials were at high risk of bias. | ||||||
Background
Vitamin D is either synthesised in the skin (vitamin D3 (cholecalciferol)) or is obtained from dietary sources (vitamin D3 or vitamin D2 (ergocalciferol)). Vitamin D3 and D2 do not have biological activity. Both forms are metabolised within the liver to 25‐hydroxyvitamin D (calcidiol) and within the kidneys to the biologically active form known as 1,25‐dihydroxyvitamin D (calcitriol), which functions as a steroid‐like hormone (Wesley Pike 2005). The effects of 1,25‐dihydroxyvitamin D are mediated by its binding to vitamin D receptors in the cells (Wesley Pike 2005). Renal production of 1,25‐dihydroxyvitamin D is regulated by parathyroid hormone levels, by serum calcium and phosphorus levels, and by the phosphaturic hormone fibroblast growth factor‐23 (Kovesdy 2013).
Description of the condition
Vitamin D status is determined by the measurement of the serum 25‐hydroxyvitamin D level which is functional indicator of vitamin D status (Lips 2004; Dawson‐Hughes 2005; Bischoff‐Ferrari 2009). A number of methods are used to measure vitamin D status (radioimmunoassay, high performance/pressure liquid chromatography (HPLC), liquid chromatography‐tandem mass spectrometry (LC‐MS/MS), and more recently chemiluminescent immunoassay (CLIA) (Atef 2017). The accuracy of these methods vary significantly. HPLC and LC‐MS/MS can measure vitamin D2 and D3 independently and has been considered as the gold standard (Hollis 2008). Optimal sun exposure and dietary intake are related to optimal vitamin D status. The US Institute of Medicine recommended target serum 25‐hydroxyvitamin D levels of 20 ng/mL (50 nmol/L) (IOM 2011). Based on the systematic review prepared by the US Institute of Medicine, there are insufficient data to determine the safe upper limit of serum 25‐hydroxyvitamin D levels (IOM 2011). However, serum 25‐hydroxyvitamin D concentrations above 50 ng/mL (125 nmol/L) were considered potentially harmful (IOM 2011). The International Osteoporosis Foundation and the Endocrine Society Task Force recommend a target serum 25‐hydroxyvitamin D level of 30 ng/mL (75 nmol/L) (Dawson‐Hughes 2010; Holick 2011). The worldwide prevalence of suboptimal vitamin D status is estimated to be high (Lips 2010; van Schoor 2011; Hilger 2014). The major causes of vitamin D deficiency are insufficient exposure to sunlight, decreased dietary intake, skin pigmentation, obesity, and advanced age (Lips 2006; Holick 2007; Tsiaras 2011; SACN 2016). One systematic review of prospective and intervention studies that assessed the effect of vitamin D status on non‐skeletal outcomes suggested that low vitamin D status in a wide spectrum of diseases may be a marker of ill health (Autier 2014).
Vitamin D undergoes important biotransformation in the liver. The liver also plays a critical role in the inactivation of vitamin D. Because vitamin D is metabolised by the liver, abnormal vitamin D metabolism might be expected to be associated with chronic liver diseases. Vitamin D deficiency has been frequently reported in people with chronic liver diseases (Arteh 2010; Malham 2011; Kitson 2012; Lim 2012; Stokes 2013; Skaaby 2014). There is evidence that low vitamin D status is associated with increased mortality in chronic liver diseases (Putz‐Bankuti 2012; Wang 2013; Stokes 2014; Finkelmeier 2015; Paternostro 2017).
Description of the intervention
Vitamin D could be administered as supplemental vitamin D (vitamin D3 (cholecalciferol) or vitamin D2 (ergocalciferol)) or as an active form of vitamin D (1α‐hydroxyvitamin D (alfacalcidol), 25‐hydroxyvitamin D (calcidiol), or 1,25‐dihydroxyvitamin D (calcitriol)). Vitamin D supplementation prevents osteoporosis and osteomalacia (Lips 2006). It is speculated that vitamin D supplementation may confer benefits beyond the skeletal system, including chronic liver diseases (Davis 2007; Kitson 2012; Han 2013; Elangovan 2017).
How the intervention might work
There is the evidence that vitamin D supplementation may have beneficial effects on bone disorders in people with chronic liver diseases (Guañabens 2010; Luxon 2011). However, vitamin D supplementation has been suggested as a potential therapeutic in people with chronic hepatitis B infection (Farnik 2013; Mahamid 2013), chronic hepatitis C infection (Petta 2010; Gutierrez 2011; Bitetto 2012; Cacopardo 2012; Cholongitas 2012; Luong 2012), autoimmune hepatitis (Luong 2013a), non‐alcoholic fatty liver disease (Geier 2011; Eliades 2013; Kwok 2013; Eliades 2015), primary biliary cirrhosis (Li 2013; Luong 2013b), alcoholic cirrhosis (Trépo 2013; Konstantakis 2016), and hepatocellular carcinoma (Chiang 2011; Lange 2013). It is presently unclear how vitamin D exerts its postulated beneficial effects apart from maybe correcting vitamin D levels in the serum to something looking more normal (Zittermann 2014).
Why it is important to do this review
Observational studies reported a high prevalence of vitamin D insufficiency across a spectrum of chronic liver diseases (Arteh 2010; Lim 2012; Han 2013; Finkelmeier 2014). However, the available evidence on the benefits and harms of vitamin D supplementation in people with chronic liver diseases is insufficient and inconsistent. Meta‐analyses of observational and interventional studies in people with hepatitis C virus infection found contradictory results (Villar 2013; Kitson 2014). Results of our systematic reviews indicate that vitamin D3 supplementation may prolong life span in adults (Bjelakovic 2014a), and it does not seem to have an effect on cancer occurrence (Bjelakovic 2014b).
Objectives
To assess the beneficial and harmful effects of vitamin D supplementation in people with chronic liver diseases.
Methods
Criteria for considering studies for this review
Types of studies
Randomised clinical trials, irrespective of blinding, publication status, or language. We also considered quasi‐randomised and observational studies for inclusion if identified during our searches to identify data on harm. We are aware that this will focus more on possible beneficial effects and less on possible harms.
Types of participants
Adults (aged 18 years or over) who were diagnosed with a chronic liver disease.
Types of interventions
Experimental
Vitamin D at any dose and for any duration, administered as monotherapy or in combination with calcium. The route of administration could be enteral or parenteral. Vitamin D could be administered as supplemental vitamin D (vitamin D3 (cholecalciferol) or vitamin D2 (ergocalciferol)) or as an active form of vitamin D (1α‐hydroxyvitamin D (alfacalcidol), 25‐hydroxyvitamin D (calcidiol), or 1,25‐dihydroxyvitamin D (calcitriol)).
Control
Placebo (identical in appearance and smell) or no intervention.
Concomitant interventions were allowed if used equally in all intervention groups.
Types of outcome measures
Primary outcomes
-
All‐cause mortality.
-
Liver‐related mortality.
-
Serious adverse events. Depending on the availability of data, we attempted to classify adverse events as serious or non‐serious. Serious adverse events were defined as any outward medical occurrence that was life threatening; resulted in death, or persistent or significant disability; or any medical event that may have jeopardised the person; or required intervention to prevent it (ICH‐GCP 1997). We considered all other adverse events as non‐serious (see Secondary outcomes below).
Secondary outcomes
-
Liver‐related morbidity (gastrointestinal bleeding, hepatic encephalopathy, hepatorenal syndrome, ascites, jaundice, liver cancer).
-
Health‐related quality of life (any valid continuous outcome scale used by the trialists).
-
Non‐serious adverse events.
Exploratory outcomes
-
Failure of virological response at week four (rapid virological response), at week 12 (early virological response), and six months after treatment (sustained virological response) (e.g. without clearance of hepatitis B virus DNA (HBV‐DNA) or hepatitis B virus ribonucleic acid (HCV‐RNA) from serum).
-
Acute cellular rejection in liver transplant recipients.
-
Vitamin D status.
-
Bone mineral density.
-
Biochemical indices (aspartate aminotransferase, alanine aminotransferase, alkaline phosphatase, gamma glutamyl transpeptidase, albumin, bilirubin, triglyceride, cholesterol, and calcium).
Covariates, effect modifiers, and confounders
We recorded any possible covariates, effect modifiers, and confounders such as dosage and form of vitamin D, dosing schedule, duration of supplementation, duration of follow‐up, mean age, risk of bias, calcium coadministration, other medications, compliance, and attrition.
Timing of outcome measurement
We applied no restrictions regarding duration of the intervention or length of follow‐up. We assessed outcome data at the end of the trial follow‐up period.
Search methods for identification of studies
Electronic searches
We used the following sources for the identification of trials:
-
The Cochrane Hepato‐Biliary Group Controlled Trials Register (Gluud 2017);
-
Cochrane Central Register of Controlled Trials (CENTRAL) in the Cochrane Library (2016, Issue 11);
-
MEDLINE (OvidSP; 1946 to January 2017);
-
Embase (OvidSP; 1974 to January 2017);
-
Science Citation Index Expanded and Conference Proceedings Citation Index ‐ Science (Web of Science; 1900 to January 2017) (Royle 2003).
We also searched ClinicalTrials.gov (www.clinicaltrials.gov/) and the World Health Organization International Clinical Trials Registry Platform (www.who.int/ictrp/en/)). For detailed search strategies, see Appendix 1. There were no language limitations.
Searching other resources
We contacted experts and main manufacturers of vitamin D to ask for unpublished randomised trials. We identified additional trials by searching the reference lists of included trials and systematic reviews, meta‐analyses, and health technology assessment reports.
Data collection and analysis
One review author (GB) performed the electronic searches. Three review authors (GB, DN, and MB) independently participated in the manual searches and identified trials eligible for inclusion from the search results.
Selection of studies
To determine the studies to be assessed further, two review authors (GB and DN) independently scanned the abstract, title, or both sections of every record retrieved. We investigated all potentially relevant articles as full text. One review author (GB) listed the excluded studies with the reason for exclusion. When a discrepancy occurred in the trial selection extraction, we consulted one review author (CG) to reach consensus. If resolving disagreement was not possible, we added the article to those 'awaiting assessment', and we contacted the trial authors for clarification. We also contacted trial authors when the information we needed was not to be found in the published trial reports.. Inter‐rater agreement for trial selection was measured using the Kappa statistic (Cohen 1960). Agreement between the review authors was very good (Kappa = 0.85). We included an adapted PRISMA flow diagram of study selection (Moher 2009).
Data extraction and management
For studies that fulfilled the inclusion criteria, three review authors (GB, DN, and MB) independently extracted relevant population, intervention characteristics, and risk of bias components using standard data extraction templates. We identified duplicate publications. Disagreements were resolved by discussion, or when required by consultation with another review author (CG).
Dealing with duplicate publications and companion papers
In the case of duplicate publications and companion papers of a primary study, we maximised our yield of information by simultaneous evaluation of all available data.
Assessment of risk of bias in included studies
Two review authors (GB and DN) independently assessed the risk of bias of each included trial according to the recommendations in the Cochrane Handbook for Systematic Reviews of Interventions (Higgins 2011), the Cochrane Hepato‐Biliary Group Module (Gluud 2017), and methodological studies (Schulz 1995; Moher 1998; Kjaergard 2001; Wood 2008; Savović 2012a; Savović 2012b; Lundh 2017). We used the following definitions in the assessment of risk of bias.
Allocation sequence generation
-
Low risk of bias: sequence generation performed using computer random number generation or a random number table. Drawing lots, tossing a coin, shuffling cards, and throwing dice were adequate if an independent person not otherwise involved in the study performed them.
-
Unclear risk of bias: method of sequence generation not mentioned.
-
High risk of bias: sequence generation method was not random. We included such studies only for assessment of harms.
Allocation concealment
-
Low risk of bias: the participant allocations could not have been foreseen in advance of, or during, enrolment. A central and independent randomisation unit controlled allocation. Investigators were unaware of allocation sequence (e.g. if allocation sequence was hidden in sequentially numbered, opaque, and sealed envelopes).
-
Unclear risk of bias: method used to conceal the allocation not mentioned so intervention allocations may have been foreseen before, or during, enrolment.
-
High risk of bias: likely that the investigators who assigned the participants knew the allocation sequence. We included such studies only for assessment of harms
Blinding of participants and personnel
-
Low risk of bias: any of the following: no blinding or incomplete blinding, but we judged that the outcome was not likely to be influenced by lack of blinding; or blinding of participants and key study personnel ensured, and it was unlikely that the blinding could have been broken.
-
Unclear risk of bias: any of the following: insufficient information to permit judgement of 'low risk' or 'high risk'; or the trial did not address this outcome.
-
High risk of bias: any of the following: no blinding or incomplete blinding, and the outcome was likely to be influenced by lack of blinding; or blinding of key study participants and personnel attempted, but likely that the blinding could have been broken, and the outcome was likely to be influenced by lack of blinding.
Blinded outcome assessment
-
Low risk of bias: any of the following: no blinding of outcome assessment, but we judged that the outcome measurement was not likely to be influenced by lack of blinding; or blinding of outcome assessment ensured, and unlikely that the blinding could have been broken.
-
Unclear risk of bias: any of the following: insufficient information to permit judgement of 'low risk' or 'high risk'; or the trial did not address this outcome.
-
High risk of bias: any of the following: no blinding of outcome assessment, and the outcome measurement was likely to be influenced by lack of blinding; or blinding of outcome assessment, but likely that the blinding could have been broken, and the outcome measurement was likely to be influenced by lack of blinding.
Incomplete outcome data
-
Low risk of bias: missing data were unlikely to make treatment effects depart from plausible values. The study used sufficient methods, such as multiple imputation, to handle missing data.
-
Unclear risk of bias: there was insufficient information to assess whether missing data in combination with the method used to handle missing data were likely to induce bias on the results.
-
High risk of bias: the results were likely to be biased due to missing data.
Selective outcome reporting
-
Low risk of bias: the trial reported all predefined outcomes. If the original trial protocol was available, the outcomes should have been those called for in that protocol. If the trial protocol was obtained from a trial registry (e.g. www.clinicaltrials.gov), the outcomes sought should have been those enumerated in the original protocol if the trial protocol was registered before or at the time that the trial was begun. If the trial protocol was registered after the trial was begun, we did not consider those outcomes to be reliable.
-
Unclear risk of bias: the study authors did not report all predefined outcomes fully, or it was unclear whether the study authors recorded data on these outcomes.
-
High risk of bias: the study authors did not report one or more of the predefined outcomes.
For‐profit bias
-
Low risk of bias: the trial appeared to be free of industry sponsorship or other type of for‐profit support that could manipulate the trial design, conductance, or trial results.
-
Unclear risk of bias: the trial may or may not have been free of for‐profit bias as the trial did not provide any information on clinical trial support or sponsorship.
-
High risk of bias: the trial was sponsored by industry or received other type of for‐profit support.
Other bias
-
Low risk of bias: the trial appeared to be free of other components (e.g. academic bias) that could put it at risk of bias.
-
Unclear risk of bias: the trial may or may not have been free of other components that could put it at risk of bias.
-
High risk of bias: there were other factors in the trial that could put it at risk of bias (e.g. authors had conducted trials on the same topic).
Overall risk of bias
We judged trials to be at overall low risk of bias if we assessed them at 'low risk of bias' in all bias risk domains. We judged trials to be at high risk of bias if we assessed them as having an unclear risk of bias or a high risk of bias in one or more of the bias risk domains. We based our primary conclusions on the outcome results of our primary outcomes with low risk of bias.
Measures of treatment effect
Dichotomous outcomes
For dichotomous outcomes, we calculated and presented risk ratios (RR) with 95% and Trial Sequential Analysis‐adjusted confidence intervals (CI). We calculated and presented Peto odds ratio (OR) for rare events.
Continuous outcomes
For continuous outcomes, we calculated and presented mean differences (MD) with 95% CI and Trial Sequential Analysis‐adjusted CI.
Unit of analysis issues
Trial participants as randomised per intervention group. In the trials with parallel group design with more than two intervention groups and additional therapy, we compared the vitamin D arm alone versus placebo or no intervention group. In the trials with parallel group design with more than two intervention groups and without additional therapy, we compared the combined vitamin D groups versus placebo or no intervention group.
Dealing with missing data
We tried to obtain relevant missing data from authors whenever we lacked important numerical data such as number of screened or randomised participants, or lack of data regarding the performance of intention‐to‐treat (ITT) analyses, or data on as‐treated or per‐protocol participant analyses to perform our analyses appropriately. We investigated attrition rates (e.g. dropouts, losses to follow‐up, and withdrawals) and critically appraised issues of missing data (e.g. last observation carried forward and imputation methods).
Regarding the primary outcomes, we included trial participants with incomplete or missing data in sensitivity analyses by imputing them according to the following scenarios (Hollis 1999).
-
Extreme‐case analysis favouring the experimental intervention ('best‐worse' case scenario: none of the dropouts/participants lost from the experimental arm, but all the dropouts/participants lost from the control arm experienced the outcome, including all randomised participants in the denominator.
-
Extreme‐case analysis favouring the control ('worst‐best' case scenario): all dropouts/participants lost from the experimental arm, but none from the control arm experienced the outcome, including all randomised participants in the denominator.
Assessment of heterogeneity
We identified heterogeneity by visual inspection of the forest plots, by using a standard Chi² test and a significance level of α = 0.1, in view of the low power of such tests. We specifically examined heterogeneity using the I² statistic (Higgins 2002), where I² values of 50% or more indicated a substantial level of heterogeneity (Higgins 2003). For heterogeneity adjustment of the required information size in the trials sequential analyses, we used diversity (D2 ), as I² statistic used for this purpose consistently underestimates the required information size (Wetterslev 2009).
When we found heterogeneity, we attempted to determine the potential reasons for it by examining the individual trial and subgroup characteristics.
Assessment of reporting biases
We used funnel plots in an exploratory data analysis to assess the potential existence of bias in small trials. There are several explanations for the asymmetry of a funnel plot, including true heterogeneity of effect with respect to trial size, poor methodological design of small trials, and publication bias.
We performed adjusted rank correlation (Begg 1994) and a regression asymmetry test (Egger 1997) for detection of bias. We considered a P value less than 0.10 as significant in these analyses.
Data synthesis
Meta‐analysis
We performed statistical analyses according to the statistical guidelines referenced in the Cochrane Handbook for Systematic Reviews of Interventions (Higgins 2011).
For the statistical analyses, we used Review Manager 5 (RevMan 2014), Trial Sequential Analysis version 0.9.5.10 beta (TSA 2017), STATA 8.2 (STATA Corp, College Station, TX), and Sigma Stat 3.0 (SPSS Inc, Chicago, IL). We analysed the data using both fixed‐effect (DeMets 1987) and random‐effects (DerSimonian 1986) model meta‐analyses. If there were statistically significant discrepancies in the results (e.g. one model giving a significant intervention effect and the other model giving no significant intervention effect), we reported the more conservative point estimate of the two (Jakobsen 2014). The more conservative point estimate is the estimate closest to zero effect. If the two‐point estimates were equal, we used the estimate with the widest CI as our main result of the two analyses. We considered a P value of 0.025 or less, two‐tailed, as statistically significant if the required information size was reached due to our three primary outcomes (Jakobsen 2014). We used an eight‐step procedure to assess whether the thresholds for significance were crossed (Jakobsen 2014). For dichotomous outcomes, we calculated RRs, and for continuous outcomes we calculated MD. For all association measures, we used 95% CIs and Trial Sequential Analysis‐adjusted CIs. We performed the analyses using the ITT principle, including all randomised participants irrespective of completeness of data. Participants with missing data were included in the analyses using a carry forward of the last observed response. Accordingly, participants who had been lost to follow‐up were counted as being alive.
Review Manager 5 does not include trials with zero events in both intervention groups when calculating RR (RevMan 2014). To account for trials with zero events, we repeated meta‐analyses of dichotomous data using Peto OR. The influence of trials with zero events in the treatment, control, or both groups was also assessed by recalculating the random‐effects model meta‐analyses with 0.01 as the empirical continuity correction (Sweeting 2004; Bradburn 2007) using Trial Sequential Analysis version 0.9.5.10 beta (TSA 2017).
We compared the intervention effects in subgroups of trials using the method described by Borenstein and colleagues (Borenstein 2009) and implemented in Review Manager 5 for all types of meta‐analyses.
Trial Sequential Analysis
We examined apparently significant beneficial and harmful intervention effects (potential type I errors) and neutral intervention effects (potential type II errors) with Trial Sequential Analysis to evaluate if these effects could be caused by random errors (Brok 2008; Wetterslev 2008; Brok 2009; Thorlund 2009; Wetterslev 2009; Thorlund 2011a; Thorlund 2011b; TSA 2017; Wetterslev 2017).
We used Trial Sequential Analysis because cumulative meta‐analyses are at risk of producing random errors due to sparse data and repetitive testing of the accumulating data (Wetterslev 2008). To control random errors, we calculated the required information size (i.e. the number of participants needed in a meta‐analysis to detect or reject a certain intervention effect) (Wetterslev 2008). The required information size calculation should account for the diversity present in the meta‐analysis (Wetterslev 2008; Wetterslev 2009).
In our Trial Sequential Analysis, the diversity‐adjusted required information size was based on the event proportion in the control group; assumption of a plausible relative risk reduction of 28%; a risk of type I error of 2.5%; a risk of type II error of 10%; and the observed diversity of the included trials in the meta‐analysis (Wetterslev 2009; Wetterslev 2017). The underlying assumption of Trial Sequential Analysis is that testing for significance may be performed each time a new trial is added to the meta‐analysis. We added the trials according to the year of publication, and if more than one trial was published in a year, we added trials alphabetically according to the last name of the first author.
On the basis of the diversity‐adjusted required information size, we constructed trial sequential monitoring boundaries (Thorlund 2011a). These boundaries determined the statistical inference one may draw regarding the cumulative meta‐analysis that has not reached the required information size. If the cumulative Z‐curve crosses the trial sequential monitoring boundary for benefit or harm before the diversity‐adjusted required information size is reached, firm evidence may perhaps be established and further trials may be superfluous. In contrast, if the boundary is not surpassed, it is most probably necessary to continue doing trials to detect or reject a certain intervention effect. That can be determined by assessing if the cumulative Z‐curve crosses the trial sequential monitoring boundaries for futility.
A more detailed description of Trial Sequential Analysis can be found at www.ctu.dk/tsa/ (Thorlund 2011a) and in Wetterslev 2017.
Subgroup analysis and investigation of heterogeneity
We performed subgroup analyses primarily if one of the primary outcome measures demonstrated a statistically significant difference between the intervention groups.
We performed the following subgroup analyses:
-
trials at low risk of bias compared to trials at high risk of bias;
-
vitamin D3 compared to placebo or no intervention;
-
vitamin D2 compared to placebo or no intervention;
-
25‐dihydroxyvitamin D compared to placebo or no intervention;
-
1,25‐dihydroxyvitamin D compared to placebo or no intervention.
Sensitivity analysis
See Dealing with missing data.
'Summary of findings' table
We created 'Summary of findings' tables using GRADEpro (GRADEpro). We used the GRADE approach which appraises the quality of a body of evidence based on the extent to which one can be confident that an estimate of effect or association reflects the item being assessed. The quality of a body of evidence considers within‐study risk of bias, indirectness of the evidence (population, intervention, control, outcomes), unexplained heterogeneity or inconsistency of results (including problems with subgroup analyses); imprecision of results (wide CIs as evaluated with our Trial Sequential Analyses) (Jakobsen 2014), and risk of publication bias (Balshem 2011; Guyatt 2011a; Guyatt 2011b; Guyatt 2011c; Guyatt 2011d; Guyatt 2011e; Guyatt 2011f; Guyatt 2011g; Guyatt 2011h; Guyatt 2013a; Guyatt 2013b; Guyatt 2013c; Mustafa 2013).
These grades are defined as follows.
-
High quality: this research provides a very good indication of the likely effect; the likelihood that the effect will be substantially different is low.
-
Moderate quality: this research provides a good indication of the likely effect; the likelihood that the effect will be substantially different is moderate.
-
Low quality: this research provides some indication of the likely effect; however, the likelihood that it will be substantially different is high.
-
Very low quality: this research does not provide a reliable indication of the likely effect; the likelihood that the effect will be substantially different is very high.
Results
Description of studies
Results of the search
We identified 2931 references of possible interest through searching The Cochrane Hepato‐Biliary Group Controlled Trials Register (37 references), the Cochrane Central Register of Controlled Trials in the Cochrane Library (503 references), MEDLINE (299 references), Embase (1390 references), Science Citation Index Expanded (695), and reference lists (seven references). We identified an additional two ongoing trials through searching databases of ongoing trials. We will include data from the ongoing trials in updates of this review. We excluded 644 duplicates and 2256 clearly irrelevant references through reading the abstracts. Accordingly, we retrieved 30 references for further assessment. Of these, we excluded 14 references because they were not randomised trials. In total, 15 randomised trials described in 17 references fulfilled our inclusion criteria (Figure 1). Details of the trials are shown in the Characteristics of included studies table; Table 1; Table 2; and Table 3.

Study flow diagram
| Study ID | Protocol | Design | Groups | Bias | Blinding | Participants | Women | Mean |
| Yes | Parallel | 2 | High | NI | 72 | 44 | 47 | |
| No | Parallel | 2 | High | NI | 115 | 50 | 64 | |
| Yes | Parallel | 2 | High | PL | 65 | 35 | 59 | |
| No | Parallel | 2 | High | NI | 101 | 25 | 40 | |
| Yes | Parallel | 2 | High | PL | 60 | 52 | 48 | |
| Yes | Parallel | 3 | High | PL | 120 | 38 | 41 | |
| No | Parallel | 3 | High | NI | 18 | 0 | 61 | |
| No | Parallel | 2 | High | NI | 50 | 58 | 47 | |
| Yes | Parallel | 2 | High | PL | 36 | 25 | 61 | |
| No | Parallel | 2 | High | PL | 60 | 51 | 60 | |
| No | Parallel | 2 | High | NI | 76 | 66 | 61 | |
| No | Parallel | 2 | High | NI | 34 | 100 | 56 | |
| Yes | Parallel | 2 | High | NI | 68 | 13 | 42 | |
| No | Parallel | 3 | High | PL | 75 | 17 | 48 | |
| No | Parallel | 2 | High | NI | 84 | 49 | 59 |
n: number of participants; NI: no intervention; PL: placebo.
| Study ID | Participants | Outcome measures | Sponsor | Country |
| Chronic hepatitis C genotype 1 | Sustained virological response | No information | Israel | |
| Chronic hepatitis C genotype 1 | Sustained virological response | No information | Japan | |
| NAFLD | Liver steatosis, liver function | No | Italy | |
| Chronic hepatitis C genotype 4 | Sustained virological response | No information | Egypt | |
| NAFLD | Liver steatosis, liver function | No | Iran | |
| NAFLD | Liver function, body fat | No | Iran | |
| Liver cirrhosis | Bone mineral density | Yes | USA | |
| Chronic hepatitis C genotype 2 or 3 | Sustained virological response | No information | Israel | |
| Liver cirrhosis | Vitamin D status, liver function | No | Austria | |
| NAFLD | Liver function, insulin resistance index | No | Iran | |
| Liver cirrhosis | Bone mineral density | No information | Japan | |
| Primary biliary cirrhosis | Bone mineral density | No information | Japan | |
| Chronic hepatitis C genotype 1,2,3,4 | Early virological response | No | Iran | |
| Liver transplant recipients | Acute cellular rejection rate | No | China | |
| Chronic hepatitis C genotype 1 | Sustained virological response | No information | Japan |
NAFLD: non‐alcoholic fatty liver disease.
| Study ID | Vitamin | Calcium | Regimen* | Treatment | Follow‐up | Cointervention | |||
| D3 | D2 | 25(OH)D | 1,25(OH)2D | ||||||
| 2000 | ‐ | ‐ | ‐ | ‐ | Daily | 48 | 72 | PEG‐INF, RBV | |
| 2000 | ‐ | ‐ | ‐ | ‐ | Daily | 16 | 16 | PEG‐INF, RBV, SP | |
| 2000 | ‐ | ‐ | ‐ | ‐ | Daily | 24 | 24 | ‐ | |
| 2143 | ‐ | ‐ | ‐ | ‐ | Weekly | 48 | 72 | PEG‐INF, RBV | |
| 7143 | ‐ | ‐ | ‐ | ‐ | Weekly | 10 | 10 | ‐ | |
| 1000 | ‐ | ‐ | ‐ | 500 | Daily | 10 | 12 | ‐ | |
| ‐ | 17,857 | 2400 | ‐ | ‐ | Daily | 52 | 52 | ‐ | |
| 2000 | ‐ | ‐ | ‐ | ‐ | Daily | 24 | 48 | PEG‐INF, RBV | |
| 2800 | ‐ | ‐ | ‐ | ‐ | Daily | 8 | 8 | ‐ | |
| 3571 | ‐ | ‐ | ‐ | ‐ | Twice a week | 16 | 16 | ‐ | |
| ‐ | ‐ | ‐ | 1 | ‐ | Daily | 52 | 52 | ‐ | |
| ‐ | ‐ | ‐ | 1 | ‐ | Daily | 52 | 52 | ‐ | |
| 1600 | ‐ | ‐ | ‐ | ‐ | Daily | 12 | 12 | PEG‐INF, RBV | |
| ‐ | ‐ | ‐ | 0.25 | 1000 | Daily | 4 | 4 | ‐ | |
| 1000 | ‐ | ‐ | ‐ | ‐ | Daily | 16 | 24 | PEG‐INF, RBV | |
* Vitamin D was administered orally in all trials.
1,25(OH)2D: calcitriol; 25(OH)D: calcidiol; PEG‐INF: pegylated‐interferon; RBV: ribavirin; SP: simeprevir.
Included studies
All 15 included trials used a parallel‐group design with two (Shiomi 1999a; Shiomi 1999b; Abu‐Mouch 2011; Nimer 2012; Sharifi 2014; Yokoyama 2014; Esmat 2015; Atsukawa 2016; Barchetta 2016; Foroughi 2016; Pilz 2016: Vosoghinia 2016) or three intervention groups (Mobarhan 1984; Xing 2013; Lorvand Amiri 2016). The trials were published from 1984 to 2016 (Table 1).
The trials were conducted in Africa (Esmat 2015), Asia (Shiomi 1999a; Shiomi 1999b; Abu‐Mouch 2011; Nimer 2012; Xing 2013; Sharifi 2014; Yokoyama 2014; Atsukawa 2016, Foroughi 2016; Lorvand Amiri 2016; Vosoghinia 2016), Europe (Barchetta 2016; Pilz 2016), and North America (Mobarhan 1984). Nine trials were conducted in high‐income countries (Mobarhan 1984; Shiomi 1999a; Shiomi 1999b; Abu‐Mouch 2011; Nimer 2012; Yokoyama 2014; Atsukawa 2016; Barchetta 2016; Pilz 2016), and six trials in middle‐income countries (Xing 2013; Sharifi 2014; Esmat 2015; Foroughi 2016; Lorvand Amiri 2016; Vosoghinia 2016) (Table 2).
Participants
A total of 1034 participants were randomly assigned in the 15 trials. The number of participants in each trial ranged from 18 to 120 (median 68). The mean age of participants was 53 years (range 18 years to 84 years). The mean proportion of women was 42% (Table 1).
Six trials included participants with chronic hepatitis C (Abu‐Mouch 2011; Nimer 2012; Yokoyama 2014; Esmat 2015; Atsukawa 2016; Vosoghinia 2016), four trials included participants with liver cirrhosis (Mobarhan 1984; Shiomi 1999a; Shiomi 1999b; Pilz 2016), four trials included participants with non‐alcoholic fatty liver disease (Sharifi 2014; Barchetta 2016; Foroughi 2016; Lorvand Amiri 2016), and one trial included liver transplant recipients (Xing 2013) (Table 2).
All included trials reported the baseline vitamin D status of participants based on serum 25‐hydroxyvitamin D levels. Participants in six trials had baseline 25‐hydroxyvitamin D levels at or above vitamin D adequacy (20 ng/mL) (Abu‐Mouch 2011; Nimer 2012; Yokoyama 2014; Atsukawa 2016; Foroughi 2016; Vosoghinia 2016). Participants in the remaining nine trials had baseline 25‐hydroxyvitamin D levels considered vitamin D insufficient (less than 20 ng/mL) (Mobarhan 1984; Shiomi 1999a; Shiomi 1999b; Xing 2013; Sharifi 2014; Esmat 2015; Barchetta 2016; Lorvand Amiri 2016; Pilz 2016).
Experimental interventions
Vitamin D3 (cholecalciferol)
Vitamin D was administered as vitamin D3 (cholecalciferol) in 10 trials ((831 participants; 40% women; mean age 52 years) (Abu‐Mouch 2011; Nimer 2012; Sharifi 2014; Yokoyama 2014; Esmat 2015; Atsukawa 2016; Barchetta 2016; Foroughi 2016; Lorvand Amiri 2016; Pilz 2016; Vosoghinia 2016). Vitamin D3 was tested orally in all trials. Vitamin D3 was administered daily in eight trials (Abu‐Mouch 2011; Nimer 2012; Yokoyama 2014; Atsukawa 2016; Barchetta 2016; Pilz 2016; Lorvand Amiri 2016; Vosoghinia 2016), weekly in two trials (Esmat 2015; Foroughi 2016), and twice a week in one trial (Sharifi 2014). Mean daily dose of the vitamin D3 was 2478 international units (IU). The duration of supplementation in trials using vitamin D3 was 8 to 48 weeks (mean 21 weeks), and the length of the follow‐up period was from 8 to 72 weeks (mean 29 weeks) (Table 3).
Vitamin D2 (ergocalciferol)
Vitamin D was administered as vitamin D2 (ergocalciferol) in one trial (18 participants; 0% women; mean age 52 years) (Mobarhan 1984). Vitamin D2 was tested in a dose of 50,000 IU, orally, two or three times weekly for one year (Mobarhan 1984) (Table 3).
1,25‐dihydroxyvitamin D (calcitriol)
Vitamin D was administered as 1,25‐dihydroxyvitamin D in three trials (185 participants; 55% women; mean age 55 years) (Shiomi 1999a; Shiomi 1999b; Xing 2013). 1,25‐dihydroxyvitamin D was tested singly, orally, and daily in two trials (Shiomi 1999a; Shiomi 1999b). One trial administered 1,25‐dihydroxyvitamin D combined with calcium (Xing 2013). The dose of 1,25‐dihydroxyvitamin D was 1.0 μg in two trials (Shiomi 1999a; Shiomi 1999b), and 0.25 μg in one trial (Xing 2013). The duration of supplementation and follow‐up in trials using 1,25‐dihydroxyvitamin D was one month to one year (mean 0.7 years) (Table 3).
25‐hydroxyvitamin D (calcidiol)
Vitamin D was administered as 25‐hydroxyvitamin D in one trial (18 participants; 0% women; mean age 52 years) (Mobarhan 1984). 25‐hydroxyvitamin D was tested at a dose of 800 IU/day to 2000 IU/day, orally, for one year (Table 3).
Control interventions
Seven trials used placebo (Xing 2013; Sharifi 2014; Esmat 2015; Barchetta 2016; Foroughi 2016; Lorvand Amiri 2016; Pilz 2016), and eight trials used no intervention in the control group (Mobarhan 1984; Shiomi 1999a; Shiomi 1999b; Abu‐Mouch 2011; Nimer 2012; Yokoyama 2014; Atsukawa 2016; Vosoghinia 2016) (Table 1).
Cointerventions
Five trials used pegylated‐interferon and ribavirin combined with vitamin D3 in the intervention groups versus no intervention (Abu‐Mouch 2011; Nimer 2012; Yokoyama 2014; Esmat 2015; Vosoghinia 2016). One trial used pegylated‐interferon, ribavirin, and simeprevir (direct‐acting antiviral agent) combined with vitamin D3 in the intervention group versus no intervention (Atsukawa 2016). One trial with three intervention groups administered 1,25‐dihydroxyvitamin D combined with calcium gluconate in one intervention group, and calcium gluconate in another intervention group (Xing 2013). Thus, we compared the 1,25‐dihydroxyvitamin D plus calcium gluconate group versus the calcium gluconate group and placebo group combined. Another trial with three intervention groups used vitamin D3 singly in one of the intervention groups, vitamin D3 combined with calcium carbonate in another intervention group, and placebo in a third intervention group (Lorvand Amiri 2016) (Table 3). Thus, we compared the first two groups together versus the placebo group.
A detailed description of the characteristics of included studies is presented in the Characteristics of included studies table; Table 1; Table 2; and Table 3.
Excluded studies
A detailed description of the characteristics of excluded studies is presented in the Characteristics of excluded studies table.
Risk of bias in included studies
All trials were at high risk of bias (had unclear or high risk of bias control in one or more domains assessed) (Figure 2; Figure 3; Table 1). Inspection of the funnel plot did not suggest potential bias (asymmetry) (Figure 4). The adjusted‐rank correlation test (P = 0.34) and a regression asymmetry test (P = 0.48) found no significant evidence of bias.

Risk of bias graph: review authors' judgements about each risk of bias item presented as percentages across all included studies.
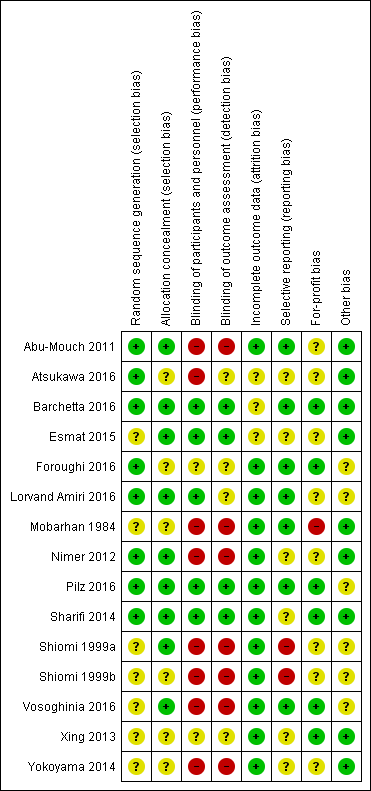
Risk of bias summary: review authors' judgements about each risk of bias item for each included study.

Funnel plot of comparison: 1 Vitamin D versus placebo or no intervention, outcome: 1.1 All‐cause mortality.
Allocation
Eight trials described the generation of allocation sequence adequately (Abu‐Mouch 2011; Nimer 2012; Sharifi 2014; Atsukawa 2016; Barchetta 2016; Foroughi 2016; Lorvand Amiri 2016; Pilz 2016). The remaining seven trials were described as being randomised, but the method used for sequence generation was not described or was insufficiently described.
Nine trials described the method used to conceal allocation adequately (Shiomi 1999a; Abu‐Mouch 2011; Nimer 2012; Sharifi 2014; Esmat 2015; Barchetta 2016; Lorvand Amiri 2016; Pilz 2016; Vosoghinia 2016). The remaining six trials were described as being randomised, but the method used for allocation concealment was not described or was insufficiently described.
Blinding
Five trials performed and adequately described the blinding of participants and personnel (Sharifi 2014; Esmat 2015; Barchetta 2016; Lorvand Amiri 2016; Pilz 2016). Eight trials did not blind participants and personnel (Mobarhan 1984; Shiomi 1999a; Shiomi 1999b; Abu‐Mouch 2011; Nimer 2012; Yokoyama 2014; Atsukawa 2016; Vosoghinia 2016), while in two trials the method used for blinding of participants and personnel was not described or was insufficiently described (Xing 2013; Foroughi 2016).
Four trials performed and adequately described the blinding of outcome assessors (Sharifi 2014; Esmat 2015; Barchetta 2016; Pilz 2016). The method for blinding of outcome assessors for the remaining 11 trials was not described or was insufficiently described.
Incomplete outcome data
Twelve trials adequately addressed incomplete outcome data (Mobarhan 1984; Shiomi 1999a; Shiomi 1999b; Abu‐Mouch 2011; Nimer 2012; Xing 2013; Yokoyama 2014; Sharifi 2014; Foroughi 2016; Lorvand Amiri 2016; Pilz 2016; Vosoghinia 2016). In three trials, the information was insufficient to allow assessment of whether missing data in combination with the method used to handle missing data were likely to induce bias on the effect estimate (Esmat 2015; Atsukawa 2016; Barchetta 2016).
Selective reporting
Seven trials reported the outcomes stated in their respective protocols (Mobarhan 1984; Abu‐Mouch 2011; Barchetta 2016; Foroughi 2016; Lorvand Amiri 2016; Pilz 2016; Vosoghinia 2016). It was unclear whether the other six trials reported all predefined and clinically relevant and reasonably expected outcomes (Nimer 2012; Xing 2013; Yokoyama 2014; Sharifi 2014; Esmat 2015; Atsukawa 2016). The study authors did not report all predefined outcomes fully in two trials (Shiomi 1999a; Shiomi 1999b).
For‐profit bias
Six trials reported how they were funded and appeared to be free of industry sponsorship or other type of for‐profit support that may bias the results of the trials (Xing 2013; Sharifi 2014; Barchetta 2016; Foroughi 2016; Pilz 2016; Vosoghinia 2016). Eight trials may not have been free of for‐profit bias as they did not provide any information on clinical trial support or sponsorship (Shiomi 1999a; Shiomi 1999b; Abu‐Mouch 2011; Nimer 2012; Yokoyama 2014; Esmat 2015; Atsukawa 2016; Lorvand Amiri 2016). One trial was funded by industry (Mobarhan 1984) (Table 2).
Other potential sources of bias
We did not identify any certain signs of academic bias or other potential sources of bias in nine trials (Mobarhan 1984; Abu‐Mouch 2011; Nimer 2012; Xing 2013; Sharifi 2014; Yokoyama 2014; Esmat 2015; Atsukawa 2016; Barchetta 2016). Six trials may or may not have been free of other components that could put them at risk of bias (Shiomi 1999a; Shiomi 1999b; Foroughi 2016; Lorvand Amiri 2016; Pilz 2016; Vosoghinia 2016).
Effects of interventions
Primary outcomes
All‐cause mortality
We are uncertain as to whether vitamin D has an effect on all‐cause mortality at end of follow‐up because the results were imprecise (Peto OR 0.69, 95% CI 0.09 to 5.40; I2 = 66%; 15 trials; 1034 participants; Analysis 1.1).
Trial Sequential Analysis on mortality in the 15 vitamin D trials was performed based on a mortality rate in the control group of 10%, a relative risk reduction (RRR) of 28% in the intervention group, a type I error of 2.5%, and type II error of 10% (90% power). There was no diversity. The required information size was 6396 participants. The cumulative Z‐curve did not cross the trial sequential monitoring boundary for benefit or harm, and did not enter the trial sequential monitoring area for futility (Figure 5). The Trial Sequential Analysis‐adjusted CI was 0.00 to 2534.2.

Trial Sequential Analysis on all‐cause mortality up to 1.4‐year follow‐up in 15 vitamin D trials, based on mortality rate in the control group of 10%, a relative risk reduction of 28% in the intervention group, a type I error of 2.5%, and type II error of 10% (90% power). There was no diversity. The required information size was 6396 participants. The cumulative Z‐curve (blue line) did not cross the trial sequential monitoring boundary for benefit or harm (red inward sloping lines) and did not enter the trial sequential monitoring area for futility (inner‐wedge with red outward sloping lines).
Sensitivity analyses taking attrition into consideration
In six trials, there were no losses to follow‐up (Shiomi 1999a; Shiomi 1999b; Abu‐Mouch 2011; Nimer 2012; Xing 2013; Foroughi 2016). In the remaining nine included trials, authors reported the exact numbers of participants with missing outcomes in the intervention and control groups. A total of 30 out of 518 (5.8%) participants had missing outcomes in the vitamin D group versus 30 of 516 (5.8%) participants in the control group.
'Best‐worst' case scenario
When we assumed that all participants lost to follow‐up in the experimental intervention group survived and all those with missing outcomes in the control intervention group died, vitamin D supplementation significantly decreased mortality (Peto OR 0.11, 95% CI 0.05 to 0.24; P < 0.00001; I2 = 0%; 1034 participants; 15 trials; Analysis 1.2).
'Worst‐best' case scenario
When we assumed that all participants lost to follow‐up in the experimental intervention group died and all those with missing outcomes in the control intervention group survived, vitamin D supplementation significantly increased mortality (Peto OR 7.80, 95% CI 3.67 to 16.57; P < 0.00001; I2 = 0%; 1034 participants; 15 trials; Analysis 1.2).
Liver‐related mortality
We are uncertain as to whether vitamin D has an important effect on liver‐related mortality because the result was imprecise (RR 1.62, 95% CI 0.08 to 34.7; 1 trial; 18 participants; Analysis 1.3). Due to few data, we did not conduct Trial Sequential Analysis which would only have revealed larger imprecision.
Serious adverse events
We are uncertain as to whether the active form of vitamin D, 1,25‐dihydroxyvitamin D, has an important effect on hypercalcaemia because the result was imprecise (RR 5.00, 95% CI 0.25 to 100.8; 1 trial; 76 participants; Analysis 1.4). We are also uncertain as to whether vitamin D has an important effect on myocardial infarction (RR 0.75, 95% CI 0.08 to 6.81; 2 trials; 86 participants; Analysis 1.4) or thyroiditis (RR 0.33, 95% CI 0.01 to 7.91; 1 trial; 68 participants; Analysis 1.4) because the results were imprecise. Due to few data, we did not conduct Trial Sequential Analysis which would only have revealed larger imprecision.
Secondary outcomes
Liver‐related morbidity
We found no data on liver‐related morbidity.
Health‐related quality of life
We found no data on health‐related quality of life.
Non‐serious adverse events
We are uncertain as to whether vitamin D3 has an important effect on glossitis because the results were imprecise (RR 3.70, 95% CI 0.16 to 87.58; 1 trial; 65 participants; Analysis 1.5).
There were several reported non‐serious adverse events in people with chronic hepatitis C treated with combination of vitamin D and pegylated‐interferon and ribavirin. These were similar in both groups and consistent with typical interferon‐ribavirin‐induced systemic symptoms such as nausea, headache, insomnia, chills, myalgia, pyrexia, pruritus, mild neutropenia, mild thrombocytopenia, and mild anaemia (Abu‐Mouch 2011; Nimer 2012; Yokoyama 2014; Esmat 2015; Atsukawa 2016).
Exploratory outcomes
Rapid virological response in people with chronic viral hepatitis C
We are uncertain as to whether vitamin D3 has an important effect on rapid virological response in people with chronic hepatitis C because the results were imprecise (RR 0.70, 95% CI 0.52 to 0.94, I2 = 0%; 2 trials; 187 participants; Analysis 1.6).
Trial Sequential Analysis on rapid virological response in the two vitamin D trials was performed based on a mortality rate in the control group of 5%, a relative risk reduction (RRR) of 30% in the intervention group, a type I error of 2.5%, and type II error of 10% (90% power). There was no diversity. The required information size was 11958 participants. The cumulative Z‐curve crossed the conventional monitoring boundary for benefit. The trial sequential monitoring boundary is ignored due to little information use (1.56%) (Figure 6).

Trial Sequential Analysis on rapid virological response in the two vitamin D trials was performed based on a mortality rate in the control group of 5%, a relative risk reduction (RRR) of 30% in the intervention group, a type I error of 2.5%, and type II error of 10% (90% power). There was no diversity. The required information size was 11958 participants. The cumulative Z‐curve crossed the conventional monitoring boundary for benefit. The trial sequential monitoring boundary is ignored due to little information use (1.56%).
Early virological response in people with chronic viral hepatitis C
We are uncertain as to whether the vitamin D3 has an important effect on early virological response in people with chronic hepatitis C because the results were imprecise (RR 0.10, 95% CI 0.03 to 0.33; 2 trials; 140 participants; Analysis 1.7).
Trial Sequential Analysis on early virological response in the two vitamin D trials was performed based on a mortality rate in the control group of 5%, a relative risk reduction (RRR) of 30% in the intervention group, a type I error of 2.5%, and type II error of 10% (90% power). There was no diversity. The required information size was 11958 participants. The cumulative Z‐curve crossed the conventional monitoring boundary for benefit. The trial sequential monitoring boundary is ignored due to little information use (1.17%) (Figure 7).

Trial Sequential Analysis on early virological response in the two vitamin D trials was performed based on a mortality rate in the control group of 5%, a relative risk reduction (RRR) of 30% in the intervention group, a type I error of 2.5%, and type II error of 10% (90% power). There was no diversity. The required information size was 11958 participants. The cumulative Z‐curve crossed the conventional monitoring boundary for benefit. The trial sequential monitoring boundary is ignored due to little information use (1.17%).
Sustained virological response in people with chronic viral hepatitis C
Vitamin D3 had no significant effect on sustained virological response in people with chronic hepatitis C (RR 0.59, 95% CI 0.28 to 1.21, I2 = 84%; 5 trials; 422 participants; Analysis 1.8).
Trial Sequential Analysis on sustained virological response in the five vitamin D trials was performed based on a mortality rate in the control group of 5%, a relative risk reduction (RRR) of 30% in the intervention group, a type I error of 2.5%, and type II error of 10% (90% power). There was no diversity. The required information size was 69798 participants. The trial sequential monitoring boundary is ignored due to little information use (0.6%) (Figure 8).

Trial Sequential Analysis on sustained virological response in the five vitamin D trials was performed based on a mortality rate in the control group of 5%, a relative risk reduction (RRR) of 30% in the intervention group, a type I error of 2.5%, and type II error of 10% (90% power). There was no diversity. The required information size was 69798 participants. The trial sequential monitoring boundary is ignored due to little information use (0.45%).
Acute cellular rejection in liver transplant recipients
We are uncertain as to whether the 1,25‐dihydroxyvitamin D has an important effect on acute cellular rejection in liver transplant recipients because the results were imprecise (RR 0.33, 95% CI 0.04 to 2.62; 1 trial; 75 participants; Analysis 1.9).
Trial Sequential Analysis on rapid acute cellular rejection in the one vitamin D trial was performed based on a mortality rate in the control group of 5%, a relative risk reduction (RRR) of 30% in the intervention group, a type I error of 2.5%, and type II error of 10% (90% power). There was no diversity. The required information size was 8979 participants. The cumulative Z‐curve did not cross the conventional monitoring boundary. The trial sequential monitoring boundary is ignored due to little information use (0.84%) (Figure 9).

Trial Sequential Analysis on acute cellular rejection in the one vitamin D trial was performed based on a mortality rate in the control group of 5%, a relative risk reduction (RRR) of 30% in the intervention group, a type I error of 2.5%, and type II error of 10% (90% power). There was no diversity. The required information size was 11958 participants. The cumulative Z‐curve did not cross the conventional monitoring boundary. The trial sequential monitoring boundary is ignored due to little information use (0.84%).
Vitamin D status
Vitamin D supplementation significantly increased vitamin D status of participants in the intervention group (MD 17.24 ng/mL, 95% CI 12.5 to 22.0, I2 = 94%; 6 trials; 424 participants; Analysis 1.10).
Bone mineral density
We were unable to extract relevant data from the included trials.
Biochemical indices
Vitamin D had no significant effect on activity of aspartate aminotransferase (MD ‐1.40 IU/L, 95% CI ‐2.88 to 0.08; I2 = 62%; 6 trials; 313 participants); and activity of alanine aminotransferase (MD ‐0.52 IU/L, 95% CI ‐5.10 to 4.06, I2 = 91%; 6 trials; 313 participants) (Analysis 1.11). We are uncertain as to whether vitamin D has an important effect on the following biochemical indices because the results were imprecise: serum activity of alkaline phosphatase (MD 7.39 IU/L, 95% CI ‐39.89 to 54.67; I2 = 96%; 2 trials; 96 participants); serum activity of gamma‐glutamyl transpeptidase (MD 3.64 IU/L, 95% CI 0.33 to 6.96; I2 = 0%; 2 trials; 101 participants); serum concentration of albumin (MD ‐0.10 g/L, 95% CI ‐0.40 to 0.20, I2 = 0%; 2 trials, 48 participants); serum concentration of bilirubin (MD 0.38 mg/dL, 95% CI 0.21 to 0.55, I2 = 0%; 2 trials; 48 participants); serum concentration of triglyceride (MD 23.69 mg/dL, 95% CI ‐13.90 to 61.27, I2 = 95%; 2 trials; 115 participants); serum concentration of cholesterol (MD 2.75 mg/dL, 95% CI ‐4.75 to 10.25; 1 trial; 55 participants); and serum concentration of calcium (MD 2.01 mg/dL, 95% CI ‐0.53 to 4.56, I2 = 97%; 2 trials; 72 participants (Analysis 1.11).
Summary of Findings
'summary of findings Table for the main comparison presents our findings on the outcomes: all‐cause mortality with mean follow‐up of 0.6 years; liver‐related mortality with a mean follow‐up of one year; serious adverse events such as hypercalcaemia (mean follow‐up of one year), myocardial infarction (mean follow‐up of mean 0.6 years), thyroiditis (mean follow‐up of 0.2 years), failure of sustained virological response (mean follow‐up of mean 0.9 years), glossitis (mean follow‐up of 0.5 years), acute cellular rejection in liver transplant recipients (mean follow‐up of 0.08 years). The quality of the evidence of the presented outcomes is very low.
Discussion
Summary of main results
We are uncertain as to whether vitamin D supplements in the form of vitamin D3, vitamin D2, 1,25‐dihydroxyvitamin D, or 25‐dihydroxyvitamin D have significant effect on all‐cause mortality, liver‐related mortality, or serious or non‐serious adverse events because the results were imprecise. Neither did vitamin D seem beneficial in increasing the number of people with sustained virological response or decreasing the number of people with acute cellular rejection in liver transplant recipients. Analyses of three trials in people with chronic hepatitis C suggested that we are uncertain as to whether vitamin D3 might be beneficial in increasing the number of people with rapid and early virological response because the results were imprecise (Abu‐Mouch 2011; Atsukawa 2016; Vosoghinia 2016). Vitamin D status of participants with chronic liver diseases was significantly increased after supplementation with vitamin D. We found no significant changes in biochemical indices after supplementation. There was insufficient evidence on the effect of vitamin D supplementation on liver‐related morbidity and health‐related quality of life in people with chronic liver diseases.
The results of our systematic review should be interpreted with great caution because all included trials were at high risk of bias. Due to the small number of included trials and selective outcome reporting, we were unable to conduct subgroup analyses according to the different forms of vitamin D. The number of people and outcome data were insufficient which adds to our risk of making both type I and type II errors due to paucity of data (Keus 2010). Our Trial Sequential Analysis CI revealed that we have insufficient information for making valid conclusions.
Although vitamin D deficiency is considered common in people with a variety of liver diseases (Chen 2014; Iruzubieta 2014; Elangovan 2017), we found no convincing evidence that vitamin D supplementation has therapeutic impact in chronic liver diseases.
Overall completeness and applicability of evidence
Our published protocol described our plan to analyse the effect of vitamin D on chronic liver diseases in randomised trials in adults (Bjelakovic 2015). We included all eligible randomised trials up to January 2017. We found only a small number of randomised trials with a small number of participants. All trials were at high risk of bias. We found significant statistical heterogeneity in some of our analyses. This decreases the precision and power of our analyses (Higgins 2011; Turner 2013). Our analyses revealed that outcome reporting was missing on approximately 6% of trial participants. Accordingly, our 'best‐worst case' and 'worst‐best case' analyses revealed that our results were compatible with both a large beneficial effect and a large detrimental effect of vitamin D on mortality. Although these extreme sensitivity analyses are unlikely analyses, they reveal how missing participants can substantially change our findings of great benefit into a null effect or maybe even harm. Therefore, we advise critical application of our findings.
Quality of the evidence
Our review followed the overall plan of a published, peer‐reviewed Cochrane protocol (Bjelakovic 2015). We were unable to find earlier meta‐analyses of trials of vitamin D on chronic liver diseases in the literature. We conducted a thorough review in accordance with Cochrane methodology (Higgins 2011) and implemented findings of methodological studies (Schulz 1995; Moher 1998; Kjaergard 2001; Wood 2008; Savović 2012a; Savović 2012b; Lundh 2017).
We repeatedly searched several databases and contacted authors of trials and industry producing vitamin D supplements. Therefore, we believe that we have not overlooked important randomised clinical trials. As stated below, we may have missed trials only reported to regulatory authorities. However, such trials are often neutral or negative. We found no significant evidence of publication bias (Johnson 2007). However, only about every second trial is reported (Gluud 2008), so we cannot exclude reporting biases. We have also performed Trial Sequential Analysis, based on the estimation of the diversity‐adjusted required information size to avoid an undue risk of random errors in a cumulative meta‐analysis and to prevent premature statements of superiority of vitamin D or of lack of effect (Brok 2008; Wetterslev 2008; Brok 2009; Thorlund 2009; Wetterslev 2009; Thorlund 2011a; Thorlund 2011b; TSA 2017; Wetterslev 2017).
We used GRADE to construct a 'Summary of findings' table. The GRADE assessments showed that the quality if the evidence was very low for all‐cause mortality, liver‐related mortality, serious adverse events (hypercalcaemia, myocardial infarction, thyroiditis), failure of sustained virological response, glossitis, or acute cellular rejection in liver transplant recipients. We applied the results of Trial Sequential Analysis for rating imprecision. If there was insufficient evidence to reach a conclusion, that is, if the Trial Sequential Analysis indicated that the required information size had not been reached, we downgraded the quality of the evidence. We also used risk of attrition bias for rating imprecision, significant between‐trial heterogeneity for rating inconsistency, and design errors for rating indirectness.
Potential biases in the review process
Certain limitations of this review warrant consideration. As with all systematic reviews, our findings and interpretations are limited by the quality and quantity of available evidence on the effects of vitamin D on chronic liver diseases. Despite extensive speculations in the literature and a number of epidemiological studies that claimed possible beneficial effects of vitamin D in people with chronic liver diseases, only few randomised trials assessed such effects. The duration of supplementation and duration of follow‐up were short in some of the included trials. This may make it difficult to detect any effects, beneficial or harmful. All 15 included trials were at high risk of bias. Instead of reporting clinical outcomes, most of the trials based their analysis on surrogate outcomes. Many of the included trials were not adequately powered. These factors corrupt the validity of our results (Schulz 1995; Moher 1998; Kjaergard 2001; Wood 2008; Savović 2012a; Savović 2012b). Adverse events were insufficiently reported. It has been pointed out that adverse events are very often neglected in randomised trials (Ioannidis 2009). In a number of trials in people with chronic hepatitis C, vitamin D was administered in combination with pegylated‐interferon and ribavirin, which made it difficult to judge its beneficial or harmful effects, or to which intervention one should assign any of the observed adverse events. Significant between‐trial heterogeneity was present in some of our meta‐analyses. This may emphasise the inconsistency of our findings and may additionally question our review findings.
Most of included trials used vitamin D3, three trials tested 1,25‐dihydroxyvitamin D, one trial tested vitamin D2, and one trial tested 25‐dihydroxyvitamin D. We were unable to perform subgroup analyses comparing different forms of vitamin D used for supplementation.
We did not search files of regulatory agencies such as Food and Drug Administration and European Medicine Agency. This may bias our selection of trials. We did not conduct searches after observational studies on harms. This may bias our findings towards benefits of the interventions with less focus on harms (Storebø 2015).
Different types of bias can influence the results of our meta‐analyses including selective reporting of some results in trial publications (Chan 2004; Williamson 2005; Furukawa 2007). Outcome reporting in the included trials was insufficient and inconsistent. There are several possible explanations for selective reporting of outcomes in randomised trials. Trials in which the outcome was not reported may not have measured outcomes of interest. Researchers may not have reported unexpected results or results may have not satisfied sponsors (Lesser 2007). Pharmaceutical companies provided vitamin D in one of the 15 included trials. This number may be higher because this information was not available in seven trials. It could be that researchers have selectively omitted to report some of the outcomes. We are well aware of the difficulties in collecting data on outcomes in clinical trials that focus on safety and efficacy evaluations. The worst result of outcome reporting bias and suppression of some significant or non‐significant findings could be the use of harmful interventions. The results of meta‐analyses may underestimate the true effects of interventions when there is exaggerated outcome reporting bias. One would wish that results of randomised clinical trials are reported in greater details (Nordic Trial Alliance 2015). In some of the trials, instead of full reporting, we found partial or qualitative reporting. The huge human efforts of investigators and the high cost of randomised clinical trials should be justified with more rigour in their reporting. In spite of the large investment in the reviewed trials, a number of questions remain unanswered.
Other types of bias, such as academic bias, bias from trials with deficiencies in the trial design (Schulz 1995; Moher 1998; Kjaergard 2001), and small trial bias (Siersma 2007), could probably influence our results. Meta‐analysis of randomised trials increases the power and precision of the estimated intervention effect, but this effect may be influenced by systematic errors or random errors and can lead to a report of false significant results (Gluud 2006; Wetterslev 2008). It is probable that the results of our meta‐analysis are influenced by random errors and systematic errors.
A number of design errors may influence our results. First, abuse of surrogate outcomes. In most trials, the authors used non‐validated surrogate outcomes such as biochemical indices, liver steatosis, or bone mineral density, assuming that normal levels are beneficial. The ideal primary outcome in randomised clinical trials is one that is relevant to the person's quality of life or course of disease. Relying on non‐validated potential surrogate outcomes is potentially dangerous when assessing new therapies (Gluud 2007; Garattini 2016). We lack validated surrogate outcome measures in hepatology. Some trials included in this review examined early, rapid, or sustained virological response as a surrogate outcome for successful treatment. Improved early, rapid, or sustained virological response do not definitely mean significant improvement in clinical outcomes (Gluud 2007; Jakobsen 2017). The use of new interventions in hepatology should not be justified until these have been confirmed to be beneficial on clinical outcomes (Gluud 2006; Jakobsen 2017). These issues could be resolved with the development and application of agreed sets of outcomes, known as core outcome sets (www.comet‐initiative.org). The increase in the number of hepato‐biliary randomised trials will never be considered a sufficient valuable source for data if aspects of trial design, such as sample size, completeness of data reporting, duration of follow‐up, and bias risk, are not improved.
Agreements and disagreements with other studies or reviews
Efforts in evaluating the benefits and harms of vitamin D supplementation in people with chronic liver diseases resulted in neutral results. It is likely that vitamin D deficiency is not a pathogenetic mechanism contributing to liver damage. There is also the possibility that vitamin D deficiency is the consequence but not the cause of chronic liver diseases. Inflammatory processes involved in the pathogenesis of chronic liver diseases, as well as other chronic diseases, reduce serum vitamin D levels, which can explain their low vitamin D status (Autier 2014). Life style could also be related to vitamin D status (Skaaby 2016). Vitamin D supplementation had neutral effect on mortality which can be a result that included randomised clinical trials focused on a group of people with well‐compensated liver diseases at low risk of mortality.
Four trials in the present review included people with liver cirrhosis. We found no evidence that vitamin D supplementation may decrease mortality in people with liver cirrhosis. This finding is contrary to earlier claims in the literature that vitamin D deficiency is associated with increased mortality in people with advanced cirrhosis (Putz‐Bankuti 2012; Wang 2013; Stokes 2014; Finkelmeier 2015; Paternostro 2017). It seems that vitamin D status in people with liver cirrhosis is not only related to liver dysfunction (Lim 2012). Earlier it was thought that people with cholestatic liver disease were more likely to be vitamin D deficient. It is now evident that people with liver cirrhosis, non‐alcoholic fatty liver disease, and chronic hepatitis C are also at risk for low vitamin D levels. Vitamin D deficiency in these people is likely to be multifactorial in aetiology including decreased intake and absorption, altered activity of hepatic 25‐hydroxylase, and insufficient exposure to sunlight (Lim 2012). Trials including people with liver cirrhosis reported biochemical indices after vitamin D supplementation. There was no significant difference between supplemented and control group in most of the recorded values.
Our review did not confirm suggestions that vitamin D supplementation can be beneficial as an adjuvant to other drugs such as interferon or ribavirin (Luong 2012). Meta‐analysis of six trials that included participants with chronic hepatitis C revealed no effect of vitamin D3 on sustained virological response, and beneficial effect on rapid and early virological response. One study suggested no effect of vitamin D supplementation in people with advanced chronic hepatitis C (Corey 2012). Oliveira and colleagues observed no association between vitamin D and the degree of liver fibrosis in people with chronic hepatitis C (Oliveira 2017). Our results are contrary to the result of one meta‐analysis that found a positive relationship between high vitamin D status and sustained virological response in people with hepatitis C virus infection (Villar 2013), and in agreement with the results of another meta‐analysis by Kitson and colleagues that found that baseline vitamin D status was not associated with sustained virological response in people with chronic hepatitis C (Kitson 2014). However, due to paucity of data, we warn that our results may be deeply influenced by systematic and random errors. We found no randomised trials that tested vitamin D supplementation in people with chronic hepatitis B. Farnik and colleagues found that low vitamin D levels were associated with increased hepatitis B virus replication in people with chronic hepatitis B (Farnik 2013), while Mahamid and colleagues showed a correlation between normal vitamin D levels and spontaneous hepatitis B surface antigen seroclearance (Mahamid 2013). Hoan and colleagues observed vitamin D deficiency in the majority of hepatitis B‐infected people (Hoan 2016). However, whether vitamin D deficiency is the cause or is a consequence of chronic hepatitis is still unknown (Bitetto 2011).
Non‐alcoholic fatty liver disease has become the most common form of chronic liver disease in high‐income countries (Sayiner 2016; Younossi 2016). There is a growing interest to explore the relationship between vitamin D deficiency and severity of non‐alcoholic fatty liver disease. Four trials included in our review administered vitamin D3 to participants with non‐alcoholic fatty liver disease. We were unable to extract data on clinically important outcomes from these trials. We found no significant effect of vitamin D3 on surrogate outcomes such as liver function tests. Two meta‐analysis of case‐control and cross‐sectional studies found that people with non‐alcoholic fatty liver disease were more likely to be vitamin D deficient than people in the control groups, suggesting that vitamin D may play a role in the development of non‐alcoholic fatty liver disease (Eliades 2013; Wang 2015). However, we found that vitamin D supplementation may not be beneficial in this population.
We lack sufficient evidence on the effect of vitamin D supplementation on liver‐related morbidity and health‐related quality of life.
Although two included randomised trials analysed the influence of vitamin D supplementation on bone mineral density in people with liver cirrhosis, we were unable to extract relevant data from published reports, and the authors did not respond to our request for additional information. One systematic review and meta‐analysis concluded that vitamin D supplementation for osteoporosis prevention in community‐dwelling adults without specific risk factors for vitamin D deficiency seemed to be inappropriate (Reid 2014). In the same way, another updated systematic evidence review for the US Preventive Service Task Force found no benefit from vitamin D supplementation for prevention of cancer and cardiovascular disease (Fortmann 2013). Bolland and colleagues found that vitamin D did not reduce skeletal, vascular, or cancer outcomes (Bolland 2014).
It seems that health claims are again ahead of the evidence. Great enthusiasm for vitamin D as a cure for a myriad of diseases, reinforced by observational studies showing that healthy people have higher vitamin D status, has not been supported by the evidence obtained from randomised clinical trials. It is very likely that low vitamin D status is not the cause but rather the consequence of chronic diseases (Grey 2010; Guallar 2010; Harvey 2012; Kupferschmidt 2012; Autier 2014). We have now some evidence that vitamin D status is a biomarker of health status (Skaaby 2016). It is likely that less healthy people are obese, less active, and more sunlight‐deprived than healthier people, and therefore have lower vitamin D status (Lucas 2005; Bolland 2006; Grey 2010; Autier 2016; Skaaby 2016). It seems that the cautionary tale of antioxidant supplements is reiterated (Garattini 2016). Current evidence does not support the use of vitamin D supplementation to prevent or cure chronic liver diseases. Results of ongoing randomised trials will help us further in resolving the vitamin D enigma. Until then, it is prudent to get vitamin D from sun exposure and from a balanced diet.
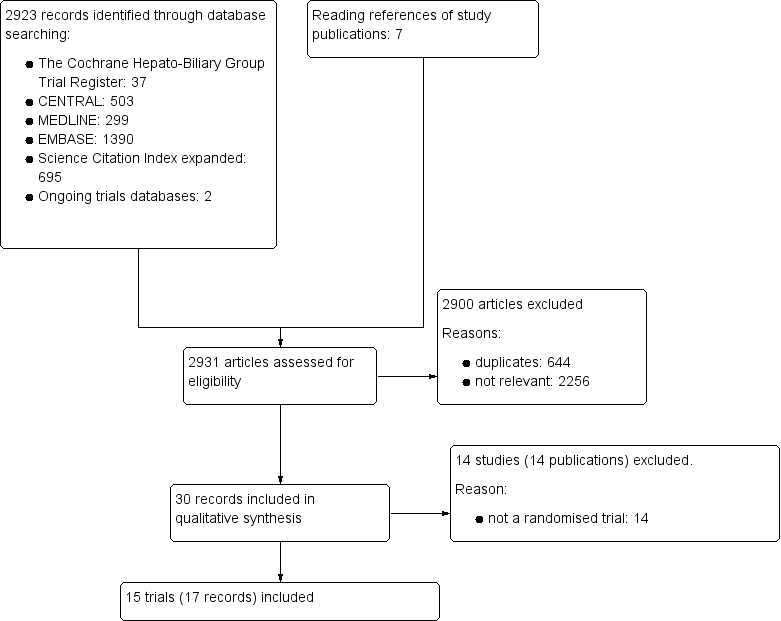
Study flow diagram
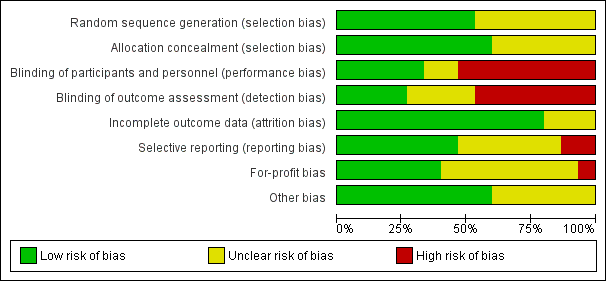
Risk of bias graph: review authors' judgements about each risk of bias item presented as percentages across all included studies.

Risk of bias summary: review authors' judgements about each risk of bias item for each included study.

Funnel plot of comparison: 1 Vitamin D versus placebo or no intervention, outcome: 1.1 All‐cause mortality.

Trial Sequential Analysis on all‐cause mortality up to 1.4‐year follow‐up in 15 vitamin D trials, based on mortality rate in the control group of 10%, a relative risk reduction of 28% in the intervention group, a type I error of 2.5%, and type II error of 10% (90% power). There was no diversity. The required information size was 6396 participants. The cumulative Z‐curve (blue line) did not cross the trial sequential monitoring boundary for benefit or harm (red inward sloping lines) and did not enter the trial sequential monitoring area for futility (inner‐wedge with red outward sloping lines).
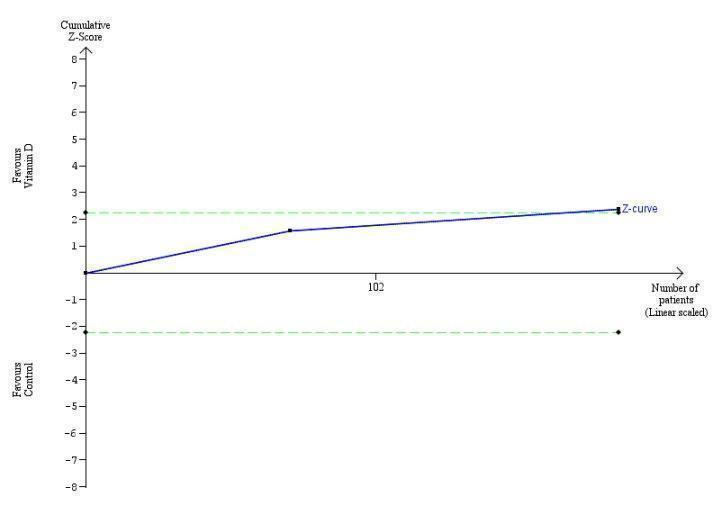
Trial Sequential Analysis on rapid virological response in the two vitamin D trials was performed based on a mortality rate in the control group of 5%, a relative risk reduction (RRR) of 30% in the intervention group, a type I error of 2.5%, and type II error of 10% (90% power). There was no diversity. The required information size was 11958 participants. The cumulative Z‐curve crossed the conventional monitoring boundary for benefit. The trial sequential monitoring boundary is ignored due to little information use (1.56%).

Trial Sequential Analysis on early virological response in the two vitamin D trials was performed based on a mortality rate in the control group of 5%, a relative risk reduction (RRR) of 30% in the intervention group, a type I error of 2.5%, and type II error of 10% (90% power). There was no diversity. The required information size was 11958 participants. The cumulative Z‐curve crossed the conventional monitoring boundary for benefit. The trial sequential monitoring boundary is ignored due to little information use (1.17%).

Trial Sequential Analysis on sustained virological response in the five vitamin D trials was performed based on a mortality rate in the control group of 5%, a relative risk reduction (RRR) of 30% in the intervention group, a type I error of 2.5%, and type II error of 10% (90% power). There was no diversity. The required information size was 69798 participants. The trial sequential monitoring boundary is ignored due to little information use (0.45%).

Trial Sequential Analysis on acute cellular rejection in the one vitamin D trial was performed based on a mortality rate in the control group of 5%, a relative risk reduction (RRR) of 30% in the intervention group, a type I error of 2.5%, and type II error of 10% (90% power). There was no diversity. The required information size was 11958 participants. The cumulative Z‐curve did not cross the conventional monitoring boundary. The trial sequential monitoring boundary is ignored due to little information use (0.84%).

Comparison 1 Vitamin D versus placebo or no intervention, Outcome 1 All‐cause mortality.

Comparison 1 Vitamin D versus placebo or no intervention, Outcome 2 All‐cause mortality ('best‐worst' case and 'worst‐best' case scenarios).

Comparison 1 Vitamin D versus placebo or no intervention, Outcome 3 Liver‐related mortality.

Comparison 1 Vitamin D versus placebo or no intervention, Outcome 4 Serious adverse events.

Comparison 1 Vitamin D versus placebo or no intervention, Outcome 5 Non‐serious adverse events.

Comparison 1 Vitamin D versus placebo or no intervention, Outcome 6 Failure of rapid virological response.
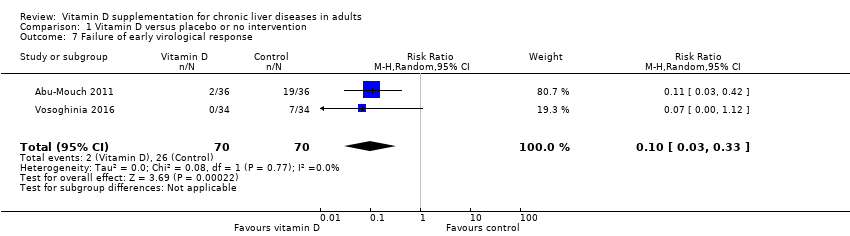
Comparison 1 Vitamin D versus placebo or no intervention, Outcome 7 Failure of early virological response.
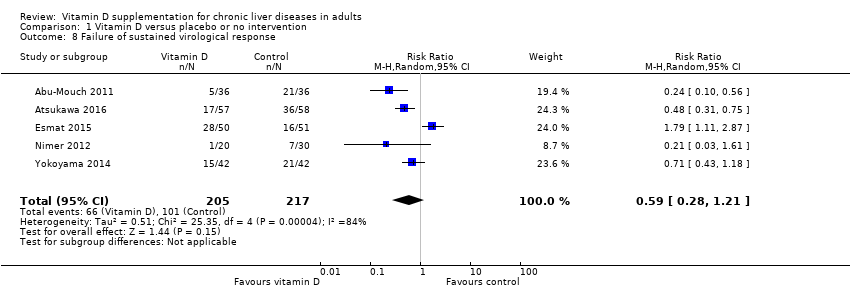
Comparison 1 Vitamin D versus placebo or no intervention, Outcome 8 Failure of sustained virological response.
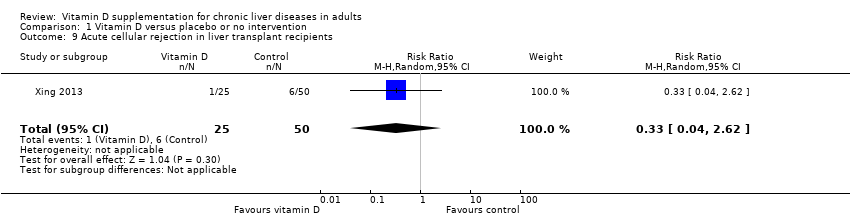
Comparison 1 Vitamin D versus placebo or no intervention, Outcome 9 Acute cellular rejection in liver transplant recipients.

Comparison 1 Vitamin D versus placebo or no intervention, Outcome 10 Vitamin D status (ng/mL).
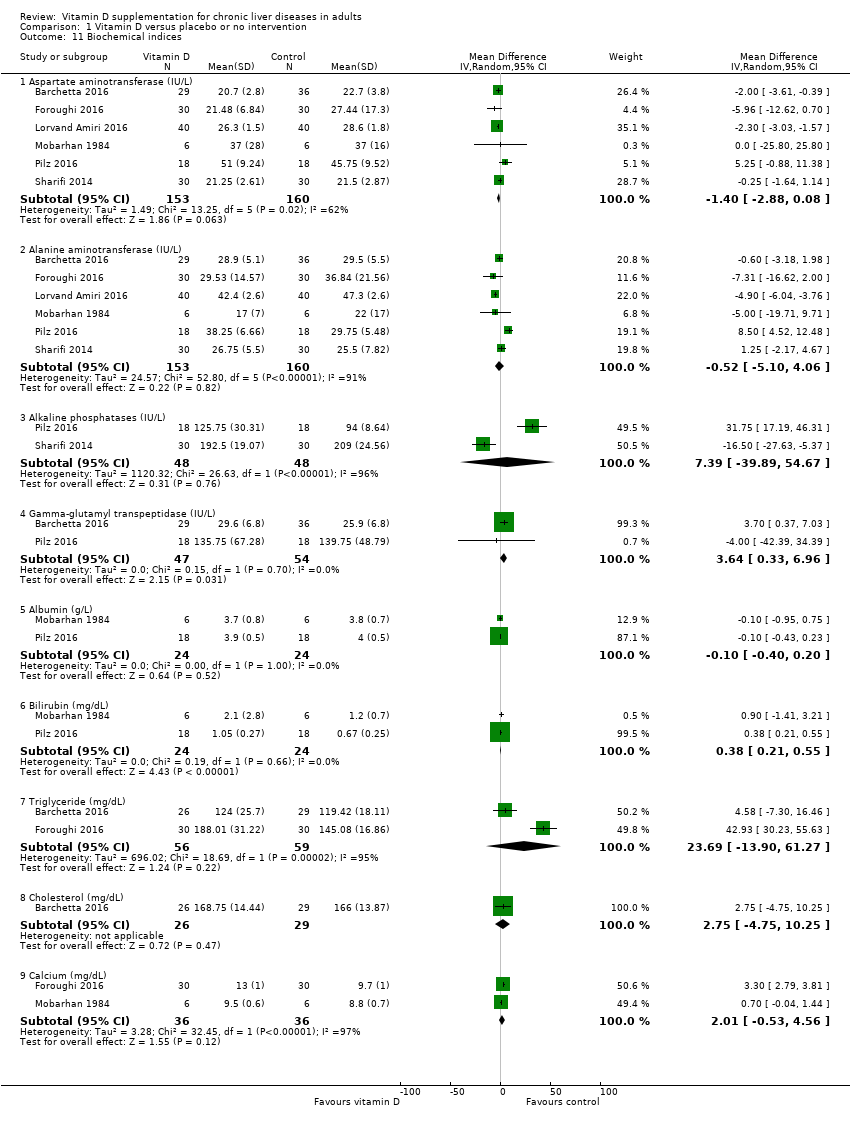
Comparison 1 Vitamin D versus placebo or no intervention, Outcome 11 Biochemical indices.
| Vitamin D compared to placebo or no intervention for chronic liver diseases in adults | ||||||
| Patient or population: adults with chronic liver diseases. | ||||||
| Outcomes | Anticipated absolute effects* (95% CI) | Relative effect | № of participants | Quality of the evidence | Comments | |
| Risk with placebo or no intervention | Risk with vitamin D | |||||
| All‐cause mortality at the end of follow‐up Follow‐up: 0.1 to 1.4, mean 0.6 years | Study population | OR 0.70 | 1034 | ⊕⊝⊝⊝ | Trial Sequential Analyses‐adjusted CI was 0.00 to 2534. | |
| 4 per 1.000 | 3 per 1.000 | |||||
| Liver‐related mortality Follow‐up: mean 1 year | Study population | RR 1.62 | 18 | ⊕⊝⊝⊝ | Due to few data, we did not conduct Trial Sequential Analysis which would only have revealed larger imprecision. | |
| 0 per 1.000 | 0 per 1.000 | |||||
| Serious adverse events ‐ hypercalcaemia Follow‐up: mean 1 year | Study population | RR 5.00 | 76 | ⊕⊝⊝⊝ | Due to few data, we did not conduct Trial Sequential Analysis which would only have revealed larger imprecision. | |
| 0 per 1.000 | 0 per 1.000 | |||||
| Serious adverse events ‐ myocardial infarction Follow‐up: 0.2 to 1, mean 0.6 years | Study population | RR 0.75 | 86 | ⊕⊝⊝⊝ | Due to few data, we did not conduct Trial Sequential Analysis which would only have revealed larger imprecision. | |
| 25 per 1.000 | 19 per 1.000 | |||||
| Serious adverse events ‐ thyroiditis Follow‐up: mean 0.2 years | Study population | RR 0.33 | 68 | ⊕⊝⊝⊝ | Due to few data, we did not conduct Trial Sequential Analysis which would only have revealed larger imprecision. | |
| 29 per 1.000 | 10 per 1.000 | |||||
| Failure of sustained virological response Follow‐up: 0.3 to 1.4, mean 0.9 years | Study population | RR 0.59 | 422 | ⊕⊝⊝⊝ Very low 1,2,3,6 | The trial sequential monitoring boundary is ignored due to little information use (0.6%). | |
| 465 per 1.000 | 275 per 1.000 | |||||
| Acute cellular rejection in liver transplant recipients Follow‐up: mean 0.08 years | Study population | RR 0.33 | 75 | ⊕⊝⊝⊝ Very low 1,3,7 | The trial sequential monitoring boundary is ignored due to little information use (0.84%). | |
| 120 per 1.000 | 40 per 1.000 | |||||
| *The risk in the intervention group (and its 95% confidence interval) is based on the assumed risk in the comparison group and the relative effect of the intervention (and its 95% CI). | ||||||
| GRADE Working Group grades of evidence
| ||||||
| 1 Downgraded one level due to risk of bias: all trials were at high risk of bias. | ||||||
| Study ID | Protocol | Design | Groups | Bias | Blinding | Participants | Women | Mean |
| Yes | Parallel | 2 | High | NI | 72 | 44 | 47 | |
| No | Parallel | 2 | High | NI | 115 | 50 | 64 | |
| Yes | Parallel | 2 | High | PL | 65 | 35 | 59 | |
| No | Parallel | 2 | High | NI | 101 | 25 | 40 | |
| Yes | Parallel | 2 | High | PL | 60 | 52 | 48 | |
| Yes | Parallel | 3 | High | PL | 120 | 38 | 41 | |
| No | Parallel | 3 | High | NI | 18 | 0 | 61 | |
| No | Parallel | 2 | High | NI | 50 | 58 | 47 | |
| Yes | Parallel | 2 | High | PL | 36 | 25 | 61 | |
| No | Parallel | 2 | High | PL | 60 | 51 | 60 | |
| No | Parallel | 2 | High | NI | 76 | 66 | 61 | |
| No | Parallel | 2 | High | NI | 34 | 100 | 56 | |
| Yes | Parallel | 2 | High | NI | 68 | 13 | 42 | |
| No | Parallel | 3 | High | PL | 75 | 17 | 48 | |
| No | Parallel | 2 | High | NI | 84 | 49 | 59 | |
| n: number of participants; NI: no intervention; PL: placebo. | ||||||||
| Study ID | Participants | Outcome measures | Sponsor | Country |
| Chronic hepatitis C genotype 1 | Sustained virological response | No information | Israel | |
| Chronic hepatitis C genotype 1 | Sustained virological response | No information | Japan | |
| NAFLD | Liver steatosis, liver function | No | Italy | |
| Chronic hepatitis C genotype 4 | Sustained virological response | No information | Egypt | |
| NAFLD | Liver steatosis, liver function | No | Iran | |
| NAFLD | Liver function, body fat | No | Iran | |
| Liver cirrhosis | Bone mineral density | Yes | USA | |
| Chronic hepatitis C genotype 2 or 3 | Sustained virological response | No information | Israel | |
| Liver cirrhosis | Vitamin D status, liver function | No | Austria | |
| NAFLD | Liver function, insulin resistance index | No | Iran | |
| Liver cirrhosis | Bone mineral density | No information | Japan | |
| Primary biliary cirrhosis | Bone mineral density | No information | Japan | |
| Chronic hepatitis C genotype 1,2,3,4 | Early virological response | No | Iran | |
| Liver transplant recipients | Acute cellular rejection rate | No | China | |
| Chronic hepatitis C genotype 1 | Sustained virological response | No information | Japan | |
| NAFLD: non‐alcoholic fatty liver disease. | ||||
| Study ID | Vitamin | Calcium | Regimen* | Treatment | Follow‐up | Cointervention | |||
| D3 | D2 | 25(OH)D | 1,25(OH)2D | ||||||
| 2000 | ‐ | ‐ | ‐ | ‐ | Daily | 48 | 72 | PEG‐INF, RBV | |
| 2000 | ‐ | ‐ | ‐ | ‐ | Daily | 16 | 16 | PEG‐INF, RBV, SP | |
| 2000 | ‐ | ‐ | ‐ | ‐ | Daily | 24 | 24 | ‐ | |
| 2143 | ‐ | ‐ | ‐ | ‐ | Weekly | 48 | 72 | PEG‐INF, RBV | |
| 7143 | ‐ | ‐ | ‐ | ‐ | Weekly | 10 | 10 | ‐ | |
| 1000 | ‐ | ‐ | ‐ | 500 | Daily | 10 | 12 | ‐ | |
| ‐ | 17,857 | 2400 | ‐ | ‐ | Daily | 52 | 52 | ‐ | |
| 2000 | ‐ | ‐ | ‐ | ‐ | Daily | 24 | 48 | PEG‐INF, RBV | |
| 2800 | ‐ | ‐ | ‐ | ‐ | Daily | 8 | 8 | ‐ | |
| 3571 | ‐ | ‐ | ‐ | ‐ | Twice a week | 16 | 16 | ‐ | |
| ‐ | ‐ | ‐ | 1 | ‐ | Daily | 52 | 52 | ‐ | |
| ‐ | ‐ | ‐ | 1 | ‐ | Daily | 52 | 52 | ‐ | |
| 1600 | ‐ | ‐ | ‐ | ‐ | Daily | 12 | 12 | PEG‐INF, RBV | |
| ‐ | ‐ | ‐ | 0.25 | 1000 | Daily | 4 | 4 | ‐ | |
| 1000 | ‐ | ‐ | ‐ | ‐ | Daily | 16 | 24 | PEG‐INF, RBV | |
| * Vitamin D was administered orally in all trials. | |||||||||
| Outcome or subgroup title | No. of studies | No. of participants | Statistical method | Effect size |
| 1 All‐cause mortality Show forest plot | 15 | 1034 | Peto Odds Ratio (Peto, Fixed, 95% CI) | 0.70 [0.09, 5.38] |
| 2 All‐cause mortality ('best‐worst' case and 'worst‐best' case scenarios) Show forest plot | 15 | Peto Odds Ratio (Peto, Fixed, 95% CI) | Subtotals only | |
| 2.1 'Best‐worst' case scenario | 15 | 1034 | Peto Odds Ratio (Peto, Fixed, 95% CI) | 0.11 [0.05, 0.24] |
| 2.2 'Worst‐best' case scenario | 15 | 1034 | Peto Odds Ratio (Peto, Fixed, 95% CI) | 7.80 [3.67, 16.57] |
| 3 Liver‐related mortality Show forest plot | 1 | 18 | Risk Ratio (M‐H, Random, 95% CI) | 1.62 [0.08, 34.66] |
| 4 Serious adverse events Show forest plot | 3 | Risk Ratio (M‐H, Random, 95% CI) | Subtotals only | |
| 4.1 Hypercalcaemia | 1 | 76 | Risk Ratio (M‐H, Random, 95% CI) | 5.0 [0.25, 100.80] |
| 4.2 Myocardial infarction | 2 | 86 | Risk Ratio (M‐H, Random, 95% CI) | 0.75 [0.08, 6.81] |
| 4.3 Thyroiditis | 1 | 68 | Risk Ratio (M‐H, Random, 95% CI) | 0.33 [0.01, 7.91] |
| 5 Non‐serious adverse events Show forest plot | 1 | Risk Ratio (M‐H, Random, 95% CI) | Subtotals only | |
| 5.1 Glossitis | 1 | 65 | Risk Ratio (M‐H, Random, 95% CI) | 3.70 [0.16, 87.58] |
| 6 Failure of rapid virological response Show forest plot | 2 | 187 | Risk Ratio (M‐H, Random, 95% CI) | 0.70 [0.52, 0.94] |
| 7 Failure of early virological response Show forest plot | 2 | 140 | Risk Ratio (M‐H, Random, 95% CI) | 0.10 [0.03, 0.33] |
| 8 Failure of sustained virological response Show forest plot | 5 | 422 | Risk Ratio (M‐H, Random, 95% CI) | 0.59 [0.28, 1.21] |
| 9 Acute cellular rejection in liver transplant recipients Show forest plot | 1 | 75 | Risk Ratio (M‐H, Random, 95% CI) | 0.33 [0.04, 2.62] |
| 10 Vitamin D status (ng/mL) Show forest plot | 6 | 424 | Mean Difference (IV, Random, 95% CI) | 17.24 [12.46, 22.02] |
| 11 Biochemical indices Show forest plot | 6 | Mean Difference (IV, Random, 95% CI) | Subtotals only | |
| 11.1 Aspartate aminotransferase (IU/L) | 6 | 313 | Mean Difference (IV, Random, 95% CI) | ‐1.40 [‐2.88, 0.08] |
| 11.2 Alanine aminotransferase (IU/L) | 6 | 313 | Mean Difference (IV, Random, 95% CI) | ‐0.52 [‐5.10, 4.06] |
| 11.3 Alkaline phosphatases (IU/L) | 2 | 96 | Mean Difference (IV, Random, 95% CI) | 7.39 [‐39.89, 54.67] |
| 11.4 Gamma‐glutamyl transpeptidase (IU/L) | 2 | 101 | Mean Difference (IV, Random, 95% CI) | 3.64 [0.33, 6.96] |
| 11.5 Albumin (g/L) | 2 | 48 | Mean Difference (IV, Random, 95% CI) | ‐0.10 [‐0.40, 0.20] |
| 11.6 Bilirubin (mg/dL) | 2 | 48 | Mean Difference (IV, Random, 95% CI) | 0.38 [0.21, 0.55] |
| 11.7 Triglyceride (mg/dL) | 2 | 115 | Mean Difference (IV, Random, 95% CI) | 23.69 [‐13.90, 61.27] |
| 11.8 Cholesterol (mg/dL) | 1 | 55 | Mean Difference (IV, Random, 95% CI) | 2.75 [‐4.75, 10.25] |
| 11.9 Calcium (mg/dL) | 2 | 72 | Mean Difference (IV, Random, 95% CI) | 2.01 [‐0.53, 4.56] |