Tratamiento no quirúrgico versus tratamiento quirúrgico para el cáncer esofágico
Información
- DOI:
- https://doi.org/10.1002/14651858.CD011498.pub2Copiar DOI

- Base de datos:
-
- Cochrane Database of Systematic Reviews
- Versión publicada:
-
- 29 marzo 2016see what's new
- Tipo:
-
- Intervention
- Etapa:
-
- Review
- Grupo Editorial Cochrane:
-
Grupo Cochrane de Salud digestiva
- Copyright:
-
- Copyright © 2016 The Cochrane Collaboration. Published by John Wiley & Sons, Ltd.
Cifras del artículo
Altmetric:
Citado por:
Autores
Contributions of authors
KG conceived the protocol and review.
LB and KG designed the protocol and review.
LB and KG co‐ordinated the protocol and review.
KG designed the search strategies.
LB wrote the protocol and review.
KG and MM provided critical comments on the design and content of the review.
KG secured funding for the protocol.
Performed previous work that was the foundation of the current study: not applicable.
Sources of support
Internal sources
-
University College London, UK.
External sources
-
National Institute for Health Research, UK.
This project was supported by the National Institute for Health Research, via Cochrane Infrastructure, Cochrane Programme Grant or Cochrane Incentive funding to the Upper Gastro‐intestinal and Pancreatic Diseases group (UGPD) and Cochrane‐Hepato Biliary Group (CHBG). The views and opinions expressed therein are those of the review authors and do not necessarily reflect those of the Systematic Reviews Programme, NIHR, NHS or the Department of Health.
Declarations of interest
This report is independent research and is funded by the National Institute for Health Research (NIHR Cochrane Programme Grants, 13/89/03 ‐ Evidence‐based diagnosis and management of upper digestive, hepato‐biliary, and pancreatic disorders). The views expressed in this publication are those of the review authors and not necessarily those of the NHS, the National Institute for Health Research, or the Department of Health.
Acknowledgements
We thank Karin Dearness, Managing Editor of the Cochrane Upper Gastrointestinal and Pancreatic Diseases Group (UGPD), for providing administrative and logistical support for this Cochrane review.
We thank the peer reviewers, copy editors, and the Cochrane Editorial Unit for their comments.
We thank the study authors who provided further information.
Version history
| Published | Title | Stage | Authors | Version |
| 2016 Mar 29 | Non‐surgical versus surgical treatment for oesophageal cancer | Review | Lawrence MJ Best, Muntzer Mughal, Kurinchi Selvan Gurusamy | |
| 2015 Jan 28 | Surgical versus non‐surgical treatment for oesophageal cancer | Protocol | Lawrence M J Best, Kurinchi Selvan Gurusamy | |
Differences between protocol and review
-
We reversed the intervention and control since surgical treatment is currently considered the standard treatment for oesophagectomy.
-
We revised the search strategy since the original search did not identify some trials.
-
We included dysphagia at maximal follow‐up as one of the secondary outcomes as this is an important patient symptom.
-
We performed a further subgroup analysis in which we compared definitive chemoradiotherapy versus oesophagectomy with neoadjuvant chemotherapy or chemoradiotherapy. This is because neoadjuvant chemotherapy or chemoradiotherapy along with surgery provides better survival than surgery alone (Sjoquist 2011) and is the treatment recommended by the European Society for Medical Oncology (ESMO) guidelines (Stahl 2013).
Keywords
MeSH
Medical Subject Headings (MeSH) Keywords
Medical Subject Headings Check Words
Humans;
PICO
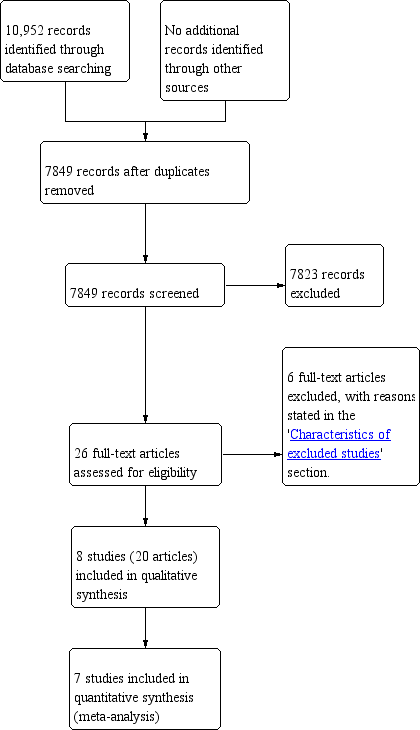
Study flow diagram.

'Risk of bias' graph: review authors' judgements about each 'Risk of bias' item presented as percentages across all included studies.

'Risk of bias' summary: review authors' judgements about each 'Risk of bias' item for each included study.

Comparison 1 Surgical versus non‐surgical treatment of oesophageal cancer, Outcome 1 Short‐term mortality.

Comparison 1 Surgical versus non‐surgical treatment of oesophageal cancer, Outcome 2 Long‐term mortality (binary).
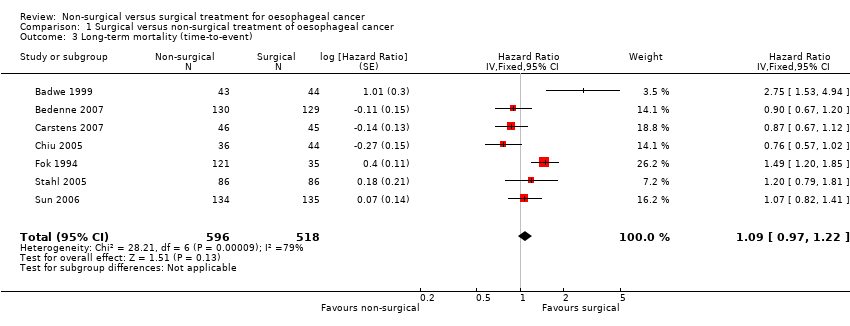
Comparison 1 Surgical versus non‐surgical treatment of oesophageal cancer, Outcome 3 Long‐term mortality (time‐to‐event).

Comparison 1 Surgical versus non‐surgical treatment of oesophageal cancer, Outcome 4 Proportion with a serious adverse event within 3 months.

Comparison 1 Surgical versus non‐surgical treatment of oesophageal cancer, Outcome 5 Short‐term health‐related quality of life.

Comparison 1 Surgical versus non‐surgical treatment of oesophageal cancer, Outcome 6 Medium‐term health‐related quality of life.

Comparison 1 Surgical versus non‐surgical treatment of oesophageal cancer, Outcome 7 Long‐term recurrence (binary).
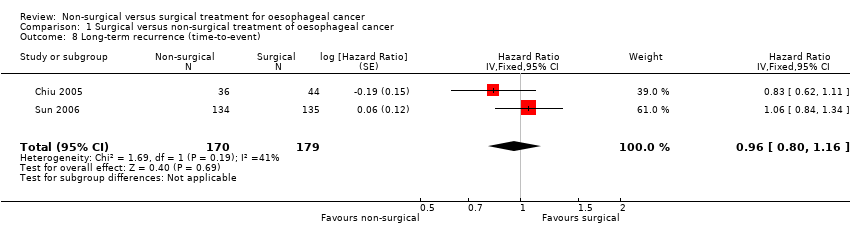
Comparison 1 Surgical versus non‐surgical treatment of oesophageal cancer, Outcome 8 Long‐term recurrence (time‐to‐event).
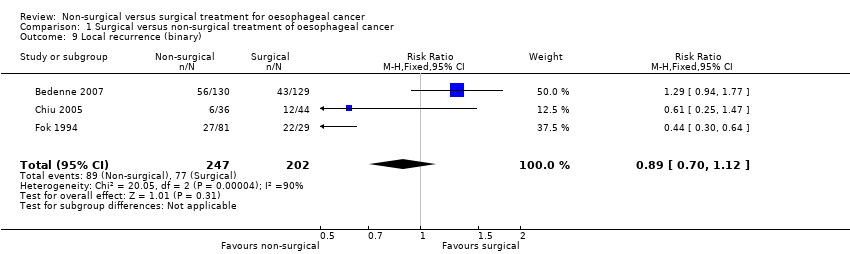
Comparison 1 Surgical versus non‐surgical treatment of oesophageal cancer, Outcome 9 Local recurrence (binary).

Comparison 1 Surgical versus non‐surgical treatment of oesophageal cancer, Outcome 10 Proportion with any adverse event within 3 months.

Comparison 1 Surgical versus non‐surgical treatment of oesophageal cancer, Outcome 11 Length of hospital stay (days).

Comparison 1 Surgical versus non‐surgical treatment of oesophageal cancer, Outcome 12 Dysphagia at maximal follow‐up.

Comparison 1 Surgical versus non‐surgical treatment of oesophageal cancer, Outcome 13 Long‐term mortality (time‐to‐event): stratified by treatment.
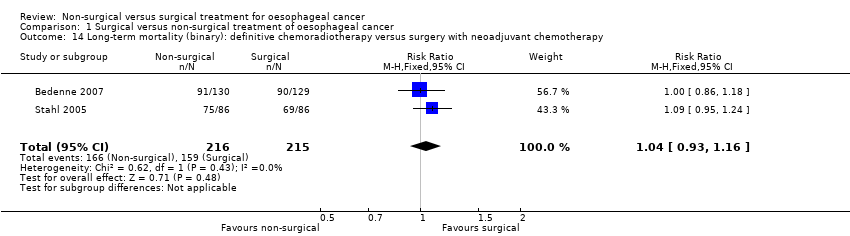
Comparison 1 Surgical versus non‐surgical treatment of oesophageal cancer, Outcome 14 Long‐term mortality (binary): definitive chemoradiotherapy versus surgery with neoadjuvant chemotherapy.

Comparison 1 Surgical versus non‐surgical treatment of oesophageal cancer, Outcome 15 Long‐term mortality (time‐to‐event): definitive chemoradiotherapy versus surgery with neoadjuvant chemotherapy or chemoradiotherapy.
| Non‐surgical versus surgical treatment of oesophageal cancer | |||||
| Patient or population: people with oesophageal cancer | |||||
| Outcomes | Illustrative comparative risks* (95% CI) | Relative effect | Number of participants | Quality of the evidence | |
| Assumed risk | Corresponding risk | ||||
| Surgical treatment | Non‐surgical treatment | ||||
| Short‐term mortality | 78 per 10001 | 30 per 1000 | RR 0.39 | 689 | ⊕⊝⊝⊝ |
| Long‐term mortality (binary outcome) | 691 per 10001 | 712 per 1000 | RR 1.03 | 511 | ⊕⊕⊝⊝ |
| Long‐term mortality (time‐to‐event outcome): chemoradiotherapy versus surgery | 349 per 10001 | 314 per 1000 | HR 0.88 | 602 | ⊕⊕⊝⊝ |
| Long‐term mortality (time‐to‐event outcome): radiotherapy versus surgery | 350 per 10001 | 451 per 1000 | HR 1.39 | 512 | ⊕⊝⊝⊝ |
| Long‐term mortality (binary): definitive chemoradiotherapy versus surgery with neoadjuvant chemotherapy All‐cause mortality for the duration of follow‐up | 740 per 1000 | 769 per 1000 | RR 1.04 | 431 | ⊕⊝⊝⊝ |
| Long‐term mortality (time‐to‐event): definitive chemoradiotherapy versus surgery with neoadjuvant chemotherapy or chemoradiotherapy All‐cause mortality for the duration of follow‐up | 349 per 1000 | 346 per 1000 | HR 0.99 | 431 | ⊕⊝⊝⊝ |
| Proportion with a serious adverse event within 3 months | 273 per 10001 | 166 per 1000 | RR 0.61 | 80 | ⊕⊝⊝⊝ |
| Short‐term health‐related quality of life | The mean short‐term health‐related quality of life in the control groups was | The mean short‐term health‐related quality of life in the intervention groups was | ‐ | 165 | ⊕⊝⊝⊝ |
| Medium‐term health‐related quality of life | The mean medium‐term health‐related quality of life in the control groups was | The mean medium‐term health‐related quality of life in the intervention groups was | ‐ | 62 | ⊕⊝⊝⊝ |
| *The basis for the assumed risk is provided in footnotes. The corresponding risk (and its 95% CI) is based on the assumed risk in the comparison group and the relative effect of the intervention (and its 95% CI). | |||||
| GRADE Working Group grades of evidence | |||||
| 1The basis for control risk is the event rate across all studies (i.e. the sum of all events in the surgical group across all studies reporting the outcome divided by the sum of all people in the surgical group in the trials reporting the outcome) for all outcomes except long‐term mortality (time‐to‐event) where a control group risk of 0.35 was used (based on similar control group risks at 2 years in a number of trials included in this analysis) and long‐term recurrence (time‐to‐event) where a control group risk of 0.4 was used (based on similar control group risk at 2 year in a trial included for this analysis). | |||||
| Non‐surgical versus surgical treatment of oesophageal cancer | ||||||
| Patient or population: people with oesophageal cancer | ||||||
| Outcomes | Illustrative comparative risks* (95% CI) | Relative effect | Number of participants | Quality of the evidence | Comments | |
| Assumed risk | Corresponding risk | |||||
| Surgical treatment | Non‐surgical treatment | |||||
| Long‐term recurrence (binary outcome) | 526 per 10001 | 552 per 1000 | RR 1.05 | 339 | ⊕⊝⊝⊝ | ‐ |
| Long‐term recurrence (time‐to‐event outcome) | 508 per 10001 | 494 per 1000 | HR 0.96 | 349 | ⊕⊕⊝⊝ | ‐ |
| Local recurrence (binary) | 381 per 1000 | 339 per 1000 | RR 0.89 | 449 | ⊕⊝⊝⊝ | ‐ |
| Proportion with any adverse event within 3 months | 386 per 10001 | 668 per 1000 | RR 1.73 | 80 | ⊕⊝⊝⊝ | ‐ |
| Length of hospital stay (days) | See comment | See comment | Not estimable | 342 | ⊕⊝⊝⊝ | Significant heterogeneity present (I² statistic = 93%, P = 0.0001) making meta‐analysis inappropriate. The mean hospital stay was 16 days shorter (3 days shorter to 29 days shorter) in non‐surgical treatment than surgical treatment in 1 trial (Bedenne 2007) and 14 days longer (5 days longer to 23 days longer) in non‐surgical treatment than surgical treatment in another trial (Chiu 2005). |
| Dysphagia at maximal follow‐up | 367 per 1000 | 543 per 1000 | RR 1.48 | 139 | ⊕⊝⊝⊝ | ‐ |
| *The basis for the assumed risk is provided in footnotes. The corresponding risk (and its 95% CI) is based on the assumed risk in the comparison group and the relative effect of the intervention (and its 95% CI). | ||||||
| GRADE Working Group grades of evidence | ||||||
| 1The basis for control risk is the event rate across all studies (i.e. the sum of all events in the surgical group across all studies reporting the outcome divided by the sum of all people in the surgical group in the trials reporting the outcome). | ||||||
| Outcome or subgroup title | No. of studies | No. of participants | Statistical method | Effect size |
| 1 Short‐term mortality Show forest plot | 5 | 689 | Risk Ratio (M‐H, Random, 95% CI) | 0.39 [0.11, 1.35] |
| 2 Long‐term mortality (binary) Show forest plot | 3 | 511 | Risk Ratio (M‐H, Fixed, 95% CI) | 1.03 [0.92, 1.14] |
| 3 Long‐term mortality (time‐to‐event) Show forest plot | 7 | 1114 | Hazard Ratio (Fixed, 95% CI) | 1.09 [0.97, 1.22] |
| 4 Proportion with a serious adverse event within 3 months Show forest plot | 1 | Risk Ratio (M‐H, Fixed, 95% CI) | Totals not selected | |
| 5 Short‐term health‐related quality of life Show forest plot | 1 | Mean Difference (IV, Fixed, 95% CI) | Subtotals only | |
| 6 Medium‐term health‐related quality of life Show forest plot | 1 | Mean Difference (IV, Fixed, 95% CI) | Totals not selected | |
| 7 Long‐term recurrence (binary) Show forest plot | 2 | 339 | Risk Ratio (M‐H, Fixed, 95% CI) | 1.05 [0.87, 1.28] |
| 8 Long‐term recurrence (time‐to‐event) Show forest plot | 2 | 349 | Hazard Ratio (Fixed, 95% CI) | 0.96 [0.80, 1.16] |
| 9 Local recurrence (binary) Show forest plot | 3 | 449 | Risk Ratio (M‐H, Fixed, 95% CI) | 0.89 [0.70, 1.12] |
| 10 Proportion with any adverse event within 3 months Show forest plot | 1 | Risk Ratio (M‐H, Fixed, 95% CI) | Totals not selected | |
| 11 Length of hospital stay (days) Show forest plot | 2 | Mean Difference (IV, Fixed, 95% CI) | Subtotals only | |
| 12 Dysphagia at maximal follow‐up Show forest plot | 1 | 139 | Risk Ratio (M‐H, Fixed, 95% CI) | 1.48 [1.01, 2.19] |
| 13 Long‐term mortality (time‐to‐event): stratified by treatment Show forest plot | 7 | 1114 | Hazard Ratio (Fixed, 95% CI) | 1.09 [0.97, 1.22] |
| 13.1 Chemoradiotherapy | 4 | 602 | Hazard Ratio (Fixed, 95% CI) | 0.88 [0.76, 1.03] |
| 13.2 Radiotherapy | 3 | 512 | Hazard Ratio (Fixed, 95% CI) | 1.39 [1.18, 1.64] |
| 14 Long‐term mortality (binary): definitive chemoradiotherapy versus surgery with neoadjuvant chemotherapy Show forest plot | 2 | 431 | Risk Ratio (M‐H, Fixed, 95% CI) | 1.04 [0.93, 1.16] |
| 15 Long‐term mortality (time‐to‐event): definitive chemoradiotherapy versus surgery with neoadjuvant chemotherapy or chemoradiotherapy Show forest plot | 2 | 431 | Hazard Ratio (Fixed, 95% CI) | 0.99 [0.78, 1.26] |