长期苯二氮卓类药物使用者停用苯二氮卓的药物干预
摘要
研究背景
尽管临床建议短期使用苯二氮卓类药物,但长期使用其进行治疗是常见的做法。大约4%的普通人群使用苯二氮卓类药物,精神病患者和老年人的患病率增加。长期使用后,由于心理和生理依赖性,通常难以停用苯二氮卓类药物。本系统综述调查了药物干预是否可以促进苯二氮卓类药物逐渐减量。
研究目的
评价药物干预促进停止长期使用苯二氮卓类药物的益处和伤害。
检索策略
我们检索了以下电子数据库,检索日期截至2017年10月:Cochrane药品和酒精组试验专业注册库(Cochrane Drugs and Alcohol Group's Specialised Register of Trials)、CENTRAL、PubMed、Embase、CINAHL以及ISI Web of Science。我们还检索了美国临床试验注册平台(ClinicalTrials.gov)、WHO ICTRP、以及ISRCTN注册库,并筛选了已纳入的研究的参考文献列表以进一步参考相关的随机对照试验。
纳入排除标准
我们纳入了将药物干预与安慰剂或不实施干预与其他药学干预进行比较的随机对照试验,这些试验针对接受至少两个月苯二氮卓类药物治疗和/或满足苯二氮卓类药物依赖标准(任何标准)的成人。
资料收集与分析
我们使用Cochrane推荐的标准方法学流程。
主要结果
我们纳入了38项试验(涉及2543名受试者),但是我们只从涉及2295名受试者的35项试验中提取了资料。这些试验研究了许多不同的干预措施,但没有对单一干预措施在多于四项试验中进行评价。我们从18种不同的比较中提取了资料。除一项试验外,所有试验的偏倚风险都很高。试验序贯分析显示所有的比较都存在不精确性。
关于停用苯二氮卓类药物,我们发现丙戊酸钠在干预结束时存在可能的益处(1项研究,涉及27名受试者;风险比(risk ratio, RR)=2.55, 95%置信区间(confidence interval, CI) [1.08, 6.03];极低质量证据),三环抗抑郁药在最长随访期内也存在可能的益处(1项研究,涉及47名受试者;RR=2.20, 95%CI [1.27, 3.82];低质量证据)。
我们发现在干预结束时,普瑞巴林(1项研究,涉及106名受试者;均差(mean difference, MD)=‐3.10分, 95%CI [‐3.51, ‐2.69];极低质量证据)、卡普托胺(1项研究,涉及81名受试者;MD=‐1.00分, 95%CI [‐1.13, ‐0.87];极低质量证据)、帕罗西汀(2项研究,涉及99名受试者;MD=‐3.57分,95%CI [‐5.34, ‐1.80];极低质量证据)、三环抗抑郁药(1项研究,涉及38名受试者;MD=‐19.78分,95%CI [‐20.25, ‐19.31];极低质量证据)以及氟马西尼(3项研究,涉及58名受试者;标准化均差=‐0.95, 95%CI [‐1.71, ‐0.19];极低质量证据)对苯二氮卓戒断症状有潜在的积极影响。然而,帕罗西汀对苯二氮卓类药物戒断症状的积极作用并未持续至最长随访期(1项研究,涉及54名受试者;MD=‐0.13分,95%CI [‐4.03, 3.77];极低质量证据)。
以下药物干预可减轻干预结束时的焦虑症状:卡马西平(1项研究,涉及36名受试者;MD=‐6.00分,95%CI [‐9.58, ‐2.42];极低质量证据)、普瑞巴林(1项研究,涉及106名受试者;MD=‐4.80分,95%CI [‐5.28, ‐4.32];极低质量证据)、卡普托胺(1项研究,涉及81名受试者;MD=‐5.70分,95%CI [‐6.05, ‐5.35];极低质量证据)、帕罗西汀(2项研究,涉及99名受试者;MD=‐6.75分,95%CI [‐9.64, ‐3.86];极低质量证据)以及氟马西尼(1项研究,涉及18名受试者;MD=‐1.30分,95%CI [‐2.28, ‐0.32];极低质量证据)。
两种药物治疗似乎降低了再次使用苯二氮卓类药物的受试者比例:丙戊酸钠(1项研究,涉及27名受试者;RR=0.31, 95%CI [0.11, 0.90];极低质量证据)和氰美马嗪(1项研究,涉及124名受试者;RR=0.33, 95%CI [0.14, 0.78];极低质量证据)。阿吡坦降低了停用苯二氮卓类药的受试者比例(1项研究,涉及25名受试者;RR=0.41, 95%CI [0.17, 0.99];额外有害结局需治疗人数(NNTH)为2.3名受试者;低质量证据),增加了戒断综合征的发生率(1项研究,涉及145名受试者;RR=4.86, 95%CI [1.12, 21.14]; NNTH=5.9名受试者;低质量证据)。同样,天冬氨酸镁降低了停用苯二氮卓类药物的受试者比例(1项研究,涉及144名受试者;RR=0.80, 95%CI [0.66, 0.96]; NNTH=5.8;极低质量证据)。
总之,不良事件的报告不足。其中,一项关于氟马西尼试验的由于受试者严重的恐慌反应而中止。
作者结论
鉴于所报告的结局的证据质量为低质量到极低质量,以及检索到的试验数量较少且每项比较所涉及受试者人数有限,因此无法得出关于药物干预以促进苯二氮卓类药物长期使用者停用该药物的确切结论。由于报告不佳,无法在试验中可靠地评价不良事件。需要更多系统误差(“偏倚”)和随机误差(随机性)风险更小的随机对照试验,且能够更好、更全面地报告以患者为中心的长期临床结局。此类试验应独立于行业参与进行。
PICO
简语概要
停止长期使用苯二氮卓类药物
系统综述背景
尽管苯二氮卓类药物仅被建议短期使用,但其仍被广泛地长期使用。由于身体和心理依赖的发展,通常难以在治疗超过几周后停止使用苯二氮卓类药物。本系统综述旨在评价促进苯二氮卓类药物长期使用者停用苯二氮卓类药物的效果和安全性。
检索日期
证据检索截至2017年10月。
研究特征
我们确定了38项随机对照试验,涉及2543名受试者,这些受试者要么接受了两个多月的苯二氮卓类药物治疗,要么被诊断为苯二氮卓类药物依赖。无论这些研究是否将苯二氮卓类药物用于治疗焦虑、失眠或任何其他疾病,我们都将其纳入了。
受试者的平均年龄约为50岁,在大多数研究中,大部分受试者为女性。共24项试验在欧洲进行;8项试验在美国或加拿大进行;还有6项试验在亚洲进行。这些试验涉及广泛的药物,以促进减少或停止使用苯二氮卓类药物。共38项纳入的研究中,有14项研究部分由药品制造商资助;9项研究由政府机构资助;15项研究没有说明资金来源。试验持续时间为1至24周;平均试验时间为9周。
主要研究结果
我们在总共涉及2295名受试者的18项不同比较中提取了资料。我们不确定丙戊酸盐和三环类抗抑郁药是否会增加停用苯二氮卓类药物的机率,以及普瑞巴林、卡托二安、帕罗西汀、三环类抗抑郁药和氟马西尼是否能减轻苯二氮卓类药物戒断症状,因为我们认为其证据质量极低。我们不确定卡马西平、普瑞巴林、卡托二安、帕罗西汀和氟马西尼是否能减轻苯二氮卓类药物停药后的焦虑症状,因为我们认为其证据质量极低。由于偏倚风险(高估益处和低估伤害的系统性误差)和偶然发生的风险(给出任何结果的随机误差),所评价药物的效果过于不确定,无法告知临床实践。所纳入的研究对其耐受性和安全性报告不佳,因此无法评价可能的益处和不良反应之间的平衡。因此,无法就干预措施的有效性得出任何结论。
证据质量
由于试验数量较少且其中每项比较的受试者数量有限;不同研究的结果不同;研究设计不佳;以及制药行业明显的财务介入,证据质量普遍为低质量或极低质量。因此,仍需要进行无偏倚风险的随机对照试验,以及涉及在没有行业参与的情况下对受试者进行的长期评价的随机重要结果。
Authors' conclusions
Summary of findings
| Valproate compared with placebo or no intervention for benzodiazepine discontinuation in chronic benzodiazepine users | ||||||
| Patient or population: adults who withdraw from chronic benzodiazepine use | ||||||
| Outcomes | Illustrative comparative risks* (95% CI) | Relative effect | No. of participants | Quality of the evidence | Comments | |
| Assumed risk | Corresponding risk | |||||
| Placebo or no intervention | Valproate | |||||
| Benzodiazepine discontinuation, end of intervention | Study population | RR 2.55 | 27 | ⊕⊝⊝⊝ | The required information size of 1918 participants was not met. | |
| 679 per 1000 | 1000 per 1000 | |||||
| Benzodiazepine discontinuation, longest follow‐up | Study population | RR 1.57 | 24 | ⊕⊝⊝⊝ | ||
| 500 per 1000 | 785 per 1000 | |||||
| Benzodiazepine withdrawal symptoms, end of intervention | The mean benzodiazepine withdrawal symptoms in the intervention groups was | 56 | ⊕⊝⊝⊝ | SMD ‐0.15 (‐0.68 to 0.37). As a rule of thumb, 0.2 represents a small effect, 0.5 a moderate effect, and 0.8 a large effect. | ||
| Benzodiazepine withdrawal symptoms, longest follow‐up | Not estimable | ‐ | (0 study) | No included study measured this outcome. | ||
| *The basis for the assumed risk (e.g. the median control group risk across studies) is provided in footnotes. The corresponding risk (and its 95% confidence interval) is based on the assumed risk in the comparison group and the relative effect of the intervention (and its 95% CI). | ||||||
| GRADE Working Group grades of evidence | ||||||
| 1No details provided regarding random sequence generation, allocation concealment, and blinding, leading to unclear risk of selection bias, performance and detection bias (downgraded one level). | ||||||
| Carbamazepine compared with placebo for benzodiazepine discontinuation in chronic benzodiazepine users | ||||||
| Patient or population: adults who withdraw from chronic benzodiazepine use | ||||||
| Outcomes | Illustrative comparative risks* (95% CI) | Relative effect | No. of participants | Quality of the evidence | Comments | |
| Assumed risk | Corresponding risk | |||||
| Placebo | Carbamazepine | |||||
| Benzodiazepine discontinuation, end of intervention | Study population | RR 1.33 | 147 | ⊕⊕⊝⊝ | Trial Sequential Analysis showed that only 7.0% of the required information size (2109) was reached, indicating that insufficient information has been obtained. | |
| 480 per 1000 | 638 per 1000 | |||||
| Benzodiazepine discontinuation, longest follow‐up | Study population | RR 1.41 | 40 | ⊕⊝⊝⊝ | ||
| 524 per 1000 | 739 per 1000 | |||||
| Benzodiazepine withdrawal symptoms, end of intervention | The mean benzodiazepine withdrawal symptoms in the intervention groups was | 76 | ⊕⊝⊝⊝ | SMD ‐1.14 (‐2.43 to 0.16). As a rule of thumb, 0.2 represents a small effect, 0.5 a moderate effect, and 0.8 a large effect. | ||
| Benzodiazepine withdrawal symptoms, longest follow‐up | Not estimable | ‐ | (0 study) | No included study measured this outcome. | ||
| *The basis for the assumed risk (e.g. the median control group risk across studies) is provided in footnotes. The corresponding risk (and its 95% confidence interval) is based on the assumed risk in the comparison group and the relative effect of the intervention (and its 95% CI). | ||||||
| GRADE Working Group grades of evidence | ||||||
| 1Unclear risk of selection bias. One study with high risk of attrition, reporting, and other bias (downgraded one level). | ||||||
| Lithium compared with placebo for benzodiazepine discontinuation in chronic benzodiazepine users | ||||||
| Patient or population: adults who withdraw from chronic benzodiazepine use | ||||||
| Outcomes | Illustrative comparative risks* (95% CI) | Relative effect | No. of participants | Quality of the evidence | Comments | |
| Assumed risk | Corresponding risk | |||||
| Placebo | Lithium | |||||
| Benzodiazepine discontinuation, end of intervention | Study population | RR 1.05 | 230 | ⊕⊕⊝⊝ | The required information size of 1918 participants was not met. | |
| 617 per 1000 | 648 per 1000 | |||||
| Benzodiazepine discontinuation, longest follow‐up | Not estimable | ‐ | ‐ | (0 study) | ‐ | No included studies measured this outcome. |
| Benzodiazepine withdrawal symptoms, end of intervention | Not estimable | ‐ | ‐ | (0 study) | ‐ | No included studies measured this outcome. |
| Benzodiazepine withdrawal symptoms, longest follow‐up | Not estimable | ‐ | ‐ | (0 study) | ‐ | No included study measured this outcome. |
| *The basis for the assumed risk (e.g. the median control group risk across studies) is provided in footnotes. The corresponding risk (and its 95% confidence interval) is based on the assumed risk in the comparison group and the relative effect of the intervention (and its 95% CI). | ||||||
| GRADE Working Group grades of evidence | ||||||
| 1Unclear risk of selection, attrition, and reporting bias (downgraded one level). | ||||||
| Pregabalin compared with placebo for benzodiazepine discontinuation in chronic benzodiazepine users | ||||||
| Patient or population: adults who withdraw from chronic benzodiazepine use | ||||||
| Outcomes | Illustrative comparative risks* (95% CI) | Relative effect | No. of participants | Quality of the evidence | Comments | |
| Assumed risk | Corresponding risk | |||||
| Placebo | Pregabalin | |||||
| Benzodiazepine discontinuation, end of intervention | Study population | RR 1.44 | 106 | ⊕⊝⊝⊝ | The required information size of 1918 participants was not met. | |
| 360 per 1000 | 518 per 1000 | |||||
| Benzodiazepine discontinuation, longest follow‐up | Not estimable | ‐ | ‐ | (0 study) | ‐ | No included studies measured this outcome. |
| Benzodiazepine withdrawal symptoms, Physician Withdrawal Checklist (PWCL), end of intervention | ‐ | The mean benzodiazepine withdrawal symptoms, PWCL, end of intervention in the intervention group was | ‐ | 106 | ⊕⊝⊝⊝ | MD ‐3.10 (‐3.51 to ‐2.69) |
| Benzodiazepine withdrawal symptoms, longest follow‐up | Not estimable | ‐ | ‐ | (0 study) | ‐ | No included study measured this outcome. |
| *The basis for the assumed risk (e.g. the median control group risk across studies) is provided in footnotes. The corresponding risk (and its 95% confidence interval) is based on the assumed risk in the comparison group and the relative effect of the intervention (and its 95% CI). | ||||||
| GRADE Working Group grades of evidence | ||||||
| 1Unclear risk of selection bias and high risk of attrition and other bias (downgraded two levels). | ||||||
| Captodiame compared with placebo for benzodiazepine discontinuation in chronic benzodiazepine users | ||||||
| Patient or population: adults who withdraw from chronic benzodiazepine use | ||||||
| Outcomes | Illustrative comparative risks* (95% CI) | Relative effect | No. of participants | Quality of the evidence | Comments | |
| Assumed risk | Corresponding risk | |||||
| Placebo | Captodiame | |||||
| Benzodiazepine discontinuation, end of intervention | Not estimable | ‐ | ‐ | (0 study) | ‐ | No included studies measured this outcome. |
| Benzodiazepine discontinuation, longest follow‐up | Not estimable | ‐ | ‐ | (0 study) | ‐ | No included studies measured this outcome. |
| Benzodiazepine withdrawal symptoms, Benzodiazepine Withdrawal Symptom Questionnaire (BWSQ), end of intervention | ‐ | The mean benzodiazepine withdrawal symptoms, BWSQ, end of intervention in the intervention group was | ‐ | 81 | ⊕⊝⊝⊝ | MD ‐1.00 (‐1.13 to ‐0.87) The required information size of 229 participants was not met. |
| Benzodiazepine withdrawal symptoms, longest follow‐up | Not estimable | ‐ | ‐ | (0 study) | ‐ | No included study measured this outcome. |
| *The basis for the assumed risk (e.g. the median control group risk across studies) is provided in footnotes. The corresponding risk (and its 95% confidence interval) is based on the assumed risk in the comparison group and the relative effect of the intervention (and its 95% CI). | ||||||
| GRADE Working Group grades of evidence | ||||||
| 1Unclear risk of selection and reporting bias. High risk of other bias (downgraded one level). | ||||||
| Paroxetine compared with placebo or no intervention for benzodiazepine discontinuation in chronic benzodiazepine users | ||||||
| Patient or population: adults who withdraw from chronic benzodiazepine use | ||||||
| Outcomes | Illustrative comparative risks* (95% CI) | Relative effect | No. of participants | Quality of the evidence | Comments | |
| Assumed risk | Corresponding risk | |||||
| Placebo or Control | Paroxetine | |||||
| Benzodiazepine discontinuation, end of intervention | Study population | RR 1.45 | 221 | ⊕⊝⊝⊝ | Trial Sequential Analysis showed that only 2.34% of the required information size (9448) was reached, indicating that insufficient information has been obtained. | |
| 504 per 1000 | 731 per 1000 | |||||
| Benzodiazepine discontinuation, longest follow‐up | Not estimable | ‐ | (0 study) | ‐ | No included study measured this outcome. | |
| Benzodiazepine withdrawal symptoms, BWSQ, end of intervention | ‐ | The mean benzodiazepine withdrawal symptoms, BWSQ, end of intervention in the intervention groups was | ‐ | 99 | ⊕⊝⊝⊝ | MD ‐3.57 (‐5.34 to ‐1.8). Trial Sequential Analysis showed that the required information size of 229 participants was not reached. However, the alpha‐spending boundaries for benefit were crossed, indicating that sufficient information was obtained, and the result was not due to random error. |
| Benzodiazepine withdrawal symptoms, BWSQ, longest follow‐up: 6 months | ‐ | The mean benzodiazepine withdrawal symptoms, BWSQ, longest follow‐up: 6 months in the intervention group was | ‐ | 54 | ⊕⊝⊝⊝ | MD ‐0.13 (‐4.03 to 3.77) |
| *The basis for the assumed risk (e.g. the median control group risk across studies) is provided in footnotes. The corresponding risk (and its 95% confidence interval) is based on the assumed risk in the comparison group and the relative effect of the intervention (and its 95% CI). | ||||||
| GRADE Working Group grades of evidence | ||||||
| 1Unclear risk of selection and attrition bias. High risk of performance, detection, reporting, and other bias (downgraded two levels). | ||||||
| Tricyclic antidepressants compared with placebo for benzodiazepine discontinuation in chronic benzodiazepine users | ||||||
| Patient or population: adults who withdraw from chronic benzodiazepine use | ||||||
| Outcomes | Illustrative comparative risks* (95% CI) | Relative effect | No. of participants | Quality of the evidence | Comments | |
| Assumed risk | Corresponding risk | |||||
| Placebo | Tricyclic antidepressants | |||||
| Benzodiazepine discontinuation, end of intervention | Study population | RR 0.82 | 105 | ⊕⊝⊝⊝ | Trial Sequential Analysis showed that only 7.82% of the required information size (1343) was reached, indicating that insufficient information has been obtained. | |
| 451 per 1000 | 370 per 1000 | |||||
| Benzodiazepine discontinuation, longest follow‐up | Study population | RR 2.2 | 47 | ⊕⊕⊝⊝ | ||
| 375 per 1000 | 825 per 1000 | |||||
| Benzodiazepine withdrawal symptoms, Physician Withdrawal Checklist, end of intervention | ‐ | The mean benzodiazepine withdrawal symptoms in the intervention group was | ‐ | 38 (1 study) | ⊕⊝⊝⊝ | MD ‐19.78 (‐20.25 to ‐19.31) |
| Benzodiazepine withdrawal symptoms, longest follow‐up | Not estimable | ‐ | ‐ | (0 study) | ‐ | No included study measured this outcome. |
| *The basis for the assumed risk (e.g. the median control group risk across studies) is provided in footnotes. The corresponding risk (and its 95% confidence interval) is based on the assumed risk in the comparison group and the relative effect of the intervention (and its 95% CI). | ||||||
| GRADE Working Group grades of evidence | ||||||
| 1Unclear risk of selection bias and high risk of attrition and other bias (downgraded one level). | ||||||
| Alpidem compared with placebo for benzodiazepine discontinuation in chronic benzodiazepine users | ||||||
| Patient or population: adults who withdraw from chronic benzodiazepine use | ||||||
| Outcomes | Illustrative comparative risks* (95% CI) | Relative effect | No. of participants | Quality of the evidence | Comments | |
| Assumed risk | Corresponding risk | |||||
| Placebo | Alpidem | |||||
| Benzodiazepine discontinuation, end of intervention | Study population | RR 0.41 | 25 | ⊕⊕⊝⊝ | The required information size of 1918 participants was not met. | |
| 750 per 1000 | 308 per 1000 | |||||
| Benzodiazepine discontinuation, longest follow‐up | Not estimable | ‐ | ‐ | (0 study) | ‐ | No included study measured this outcome. |
| Withdrawal syndrome (clinical diagnosis), end of intervention | Study population | RR 4.86 | 145 | ⊕⊝⊝⊝ | ||
| 29 per 1000 | 143 per 1000 | |||||
| Benzodiazepine withdrawal symptoms, longest follow‐up | Not estimable | ‐ | ‐ | (0 study) | ‐ | No included study measured this outcome. |
| *The basis for the assumed risk (e.g. the median control group risk across studies) is provided in footnotes. The corresponding risk (and its 95% confidence interval) is based on the assumed risk in the comparison group and the relative effect of the intervention (and its 95% CI). | ||||||
| GRADE Working Group grades of evidence | ||||||
| 1Required information size not met (downgraded two levels due to imprecision). 3Unclear risk of selection and other bias, high risk of attrition bias (downgraded one level) | ||||||
| Buspirone compared with placebo for benzodiazepine discontinuation in chronic benzodiazepine users | ||||||
| Patient or population: adults who withdraw from chronic benzodiazepine use | ||||||
| Outcomes | Illustrative comparative risks* (95% CI) | Relative effect | No. of participants | Quality of the evidence | Comments | |
| Assumed risk | Corresponding risk | |||||
| Placebo | Buspirone | |||||
| Benzodiazepine discontinuation, end of intervention | Study population | RR 0.82 | 143 | ⊕⊕⊝⊝ | Trial Sequential Analysis showed that only 4.23% of the required information size (3381) was reached, indicating that insufficient information has been obtained. | |
| 563 per 1000 | 462 per 1000 | |||||
| Benzodiazepine discontinuation, longest follow‐up | Study population | RR 0.60 | 23 | ⊕⊕⊝⊝ | ||
| 917 per 1000 | 550 per 1000 | |||||
| Benzodiazepine withdrawal symptoms, end of intervention | ‐ | The mean benzodiazepine withdrawal symptoms, end of intervention in the intervention groups was | ‐ | 17 | ⊕⊝⊝⊝ | MD 4.69 (‐14.47 to 23.87) |
| Benzodiazepine withdrawal symptoms, longest follow‐up | ‐ | The mean benzodiazepine withdrawal symptoms, longest follow‐up in the intervention groups was | ‐ | 15 | ⊕⊝⊝⊝ | MD ‐1.34 (‐14.31 to 11.63) |
| *The basis for the assumed risk (e.g. the median control group risk across studies) is provided in footnotes. The corresponding risk (and its 95% confidence interval) is based on the assumed risk in the comparison group and the relative effect of the intervention (and its 95% CI). | ||||||
| GRADE Working Group grades of evidence | ||||||
| 1Unclear risk of selection, performance, and reporting bias. High risk of attrition and other bias (downgraded one level). | ||||||
| Melatonin compared with placebo for benzodiazepine discontinuation in chronic benzodiazepine users | ||||||
| Patient or population: adults who withdraw from chronic benzodiazepine use | ||||||
| Outcomes | Illustrative comparative risks* (95% CI) | Relative effect | No. of participants | Quality of the evidence | Comments | |
| Assumed risk | Corresponding risk | |||||
| Placebo | Melatonin | |||||
| Benzodiazepine discontinuation, end of intervention | Study population | RR 1.20 | 219 | ⊕⊝⊝⊝ | Trial Sequential Analysis showed that only 6.37% of the required information size (3438) was reached, indicating that insufficient information has been obtained. | |
| 417 per 1000 | 500 per 1000 | |||||
| Benzodiazepine discontinuation, longest follow‐up | Study population | RR 1.03 | 38 | ⊕⊝⊝⊝ | ||
| 389 per 1000 | 401 per 1000 | |||||
| Benzodiazpine withdrawal symptoms, end of intervention | Not estimable | ‐ | ‐ | (0 study) | ‐ | No included study measured this outcome. |
| Benzodiazepine withdrawal symptoms, longest follow‐up | Not estimable | ‐ | ‐ | (0 study) | ‐ | No included study measured this outcome. |
| *The basis for the assumed risk (e.g. the median control group risk across studies) is provided in footnotes. The corresponding risk (and its 95% confidence interval) is based on the assumed risk in the comparison group and the relative effect of the intervention (and its 95% CI). | ||||||
| GRADE Working Group grades of evidence | ||||||
| 1Unclear risk of selection, attrition, and reporting bias. High risk of other bias (downgraded one level). | ||||||
| Flumazenil compared with placebo for benzodiazepine discontinuation in chronic benzodiazepine users | ||||||
| Patient or population: adults who withdraw from chronic benzodiazepine use | ||||||
| Outcomes | Illustrative comparative risks* (95% CI) | Relative effect | No. of participants | Quality of the evidence | Comments | |
| Assumed risk | Corresponding risk | |||||
| Placebo | Flumazenil | |||||
| Benzodiazepine discontinuation, end of intervention | Not estimable | ‐ | ‐ | (0 study) | ‐ | No included study measured this outcome. |
| Benzodiazepine discontinuation, longest follow‐up | Not estimable | ‐ | ‐ | (0 study) | ‐ | No included study measured this outcome. |
| Benzodiazepine withdrawal symptoms, end of intervention | ‐ | The mean benzodiazepine withdrawal symptoms, end of intervention in the intervention groups was | ‐ | 58 | ⊕⊝⊝⊝ | SMD ‐0.95 (‐1.71 to ‐0.19) As a rule of thumb, 0.2 represents a small effect, 0.5 a moderate effect, and 0.8 a large effect. |
| Benzodiazepine withdrawal symptoms, longest follow‐up | Not estimable | ‐ | ‐ | (0 study) | ‐ | No included study measured this outcome. |
| *The basis for the assumed risk (e.g. the median control group risk across studies) is provided in footnotes. The corresponding risk (and its 95% confidence interval) is based on the assumed risk in the comparison group and the relative effect of the intervention (and its 95% CI). | ||||||
| GRADE Working Group grades of evidence | ||||||
| 1Unclear risk of selection bias and high risk of performance, detection, and other bias (downgraded one level). | ||||||
| Progesterone compared with placebo for benzodiazepine discontinuation in chronic benzodiazepine users | ||||||
| Patient or population: adults who withdraw from chronic benzodiazepine use | ||||||
| Outcomes | Illustrative comparative risks* (95% CI) | Relative effect | No. of participants | Quality of the evidence | Comments | |
| Assumed risk | Corresponding risk | |||||
| Placebo | Progesterone | |||||
| Benzodiazepine discontinuation, end of intervention | Study population | RR 1.15 | 35 | ⊕⊝⊝⊝ | The required information size of 1918 participants was not met. | |
| 417 per 1000 | 479 per 1000 | |||||
| Benzodiazepine discontinuation, longest follow‐up | Not estimable | ‐ | ‐ | (0 study) | ‐ | No included study measured this outcome. |
| Benzodiazepine withdrawal symptoms, end of intervention | Not estimable | ‐ | ‐ | (0 study) | ‐ | No included study measured this outcome. |
| Benzodiazepine withdrawal symptoms, longest follow‐up | Not estimable | ‐ | ‐ | (0 study) | ‐ | No included study measured this outcome. |
| *The basis for the assumed risk (e.g. the median control group risk across studies) is provided in footnotes. The corresponding risk (and its 95% confidence interval) is based on the assumed risk in the comparison group and the relative effect of the intervention (and its 95% CI). | ||||||
| GRADE Working Group grades of evidence | ||||||
| 1Unclear risk of selection and attrition bias (downgraded one level). | ||||||
| Magnesium aspartate compared with placebo for benzodiazepine discontinuation in chronic benzodiazepine users | ||||||
| Patient or population: adults who withdraw from chronic benzodiazepine use | ||||||
| Outcomes | Illustrative comparative risks* (95% CI) | Relative effect | No. of participants | Quality of the evidence | Comments | |
| Assumed risk | Corresponding risk | |||||
| Placebo | Magnesium aspartate | |||||
| Benzodiazepine discontinuation, end of intervention | Study population | RR 0.80 | 144 | ⊕⊝⊝⊝ | The required information size of 1918 participants was not met. | |
| 853 per 1000 | 683 per 1000 | |||||
| Benzodiazepine discontinuation, longest follow‐up | Not estimable | ‐ | ‐ | (0 study) | ‐ | No included study measured this outcome. |
| Benzodiazepine withdrawal symptoms, end of intervention | Not estimable | ‐ | ‐ | (0 study) | ‐ | No included study measured this outcome. |
| Benzodiazepine withdrawal symptoms, longest follow‐up | Not estimable | ‐ | ‐ | (0 study) | ‐ | No included study measured this outcome. |
| *The basis for the assumed risk (e.g. the median control group risk across studies) is provided in footnotes. The corresponding risk (and its 95% confidence interval) is based on the assumed risk in the comparison group and the relative effect of the intervention (and its 95% CI). | ||||||
| GRADE Working Group grades of evidence | ||||||
| 1Unclear risk of selection, detection, and attrition bias (downgraded one level). | ||||||
| Homéogène 46/Sedatif PC (homeopathic drugs) compared with placebo for benzodiazepine discontinuation in chronic benzodiazepine users | ||||||
| Patient or population: adults who withdraw from chronic benzodiazepine use | ||||||
| Outcomes | Illustrative comparative risks* (95% CI) | Relative effect | No. of participants | Quality of the evidence | Comments | |
| Assumed risk | Corresponding risk | |||||
| Placebo | Homéogène 46/Sedatif PC (homeopathic drugs) | |||||
| Benzodiazepine discontinuation, end of intervention | Study population | RR 0.79 | 51 | ⊕⊝⊝⊝ | The required information size was not met. | |
| 381 per 1000 | 301 per 1000 | |||||
| Benzodiazepine discontinuation, longest follow‐up | Not estimable | ‐ | ‐ | (0 study) | ‐ | No included study measured this outcome. |
| Benzodiazepine withdrawal symptoms, end of intervention | Not estimable | ‐ | ‐ | (0 study) | ‐ | No included study measured this outcome. |
| Benzodiazepine withdrawal symptoms, longest follow‐up | Not estimable | ‐ | ‐ | (0 study) | ‐ | No included study measured this outcome. |
| *The basis for the assumed risk (e.g. the median control group risk across studies) is provided in footnotes. The corresponding risk (and its 95% confidence interval) is based on the assumed risk in the comparison group and the relative effect of the intervention (and its 95% CI). | ||||||
| GRADE Working Group grades of evidence | ||||||
| 1Unclear risk of selection, attrition, and other bias (downgraded one level). | ||||||
| Carbamazepine compared with tricyclic antidepressant for benzodiazepine discontinuation in chronic benzodiazepine users | ||||||
| Patient or population: adults who withdraw from chronic benzodiazepine use | ||||||
| Outcomes | Illustrative comparative risks* (95% CI) | Relative effect | No. of participants | Quality of the evidence | Comments | |
| Assumed risk | Corresponding risk | |||||
| Tricyclic antidepressant | Carbamazepine | |||||
| Benzodiazepine discontinuation, end of intervention | Study population | RR 1.00 | 48 | ⊕⊕⊝⊝ | The required information size was not met. | |
| 833 per 1000 | 833 per 1000 | |||||
| Benzodiazepine discontinuation, longest follow‐up | Not estimable | ‐ | ‐ | (0 study) | ‐ | No included study measured this outcome. |
| Benzodiazepine withdrawal symptoms, end of intervention | Not estimable | ‐ | ‐ | (0 study) | ‐ | No included study measured this outcome. |
| Benzodiazepine withdrawal symptoms, longest follow‐up | Not estimable | ‐ | ‐ | (0 study) | ‐ | No included study measured this outcome. |
| *The basis for the assumed risk (e.g. the median control group risk across studies) is provided in footnotes. The corresponding risk (and its 95% confidence interval) is based on the assumed risk in the comparison group and the relative effect of the intervention (and its 95% CI). | ||||||
| GRADE Working Group grades of evidence | ||||||
| 1Unclear risk of selection, detection, and attrition bias (downgraded one level). | ||||||
Background
Description of the condition
Benzodiazepines are widely prescribed, and consumption remains high despite a modest overall decline during the last couple of decades (Islam 2014; Tsimtsiou 2009). A US national survey indicated a prevalence of benzodiazepine consumption of 3.8% among non‐institutionalised adults (Paulose‐Ram 2007), and the prevalence approached 8% in a Dutch survey of elderly people (Sonnenberg 2012). Another US survey reported an increase in the percentage of adults filling a benzodiazepine prescription from 4.1% in 1996 to 5.6% in 2013 (Bachhuber 2016). A survey in a New Zealand psychiatric outpatient setting documented that one‐third of the patients were prescribed benzodiazepines or benzodiazepine‐like drugs, and the majority of prescriptions were long‐standing (Huthwaite 2013).
Benzodiazepines are indicated for short‐term treatment of anxiety and insomnia, but prescriptions are often prolonged due to the development of dependence and a lack of knowledge of non‐pharmacological management of anxiety, insomnia, and similar symptoms (Ashton 2005; Huthwaite 2013; O'Brien 2005). Gradual dose reduction of benzodiazepines is recommended above abrupt discontinuation to minimise withdrawal symptoms, including the risk of withdrawal seizures (Dell'osso 2013). The importance of individual adjustment of withdrawal rate is emphasised in clinical practice guidelines. The individually adjusted withdrawal rate should include consideration of benzodiazepine type and dosage, original reason for prescribing, environmental stressors, and amount of available support (Ashton 2005). The duration of tapering is thus sometimes prolonged for months or years; however, very slow tapering rates do not seem superior to faster tapering regimens (Parr 2009). Withdrawal symptoms may manifest both physically (e.g. flu‐like complaints, muscle cramps) and psychologically (e.g. irritability, insomnia, perceptual changes, anxiety, depersonalisation, derealisation) (Baldwin 2013). Withdrawal symptoms therefore often resemble the symptoms that led to the initial benzodiazepine prescription, erroneously leading patients and caregivers to assume that continued prescription is required. Discontinuation is thus complicated by a mixture of withdrawal symptoms and original symptoms that might reoccur in an exaggerated form (rebound symptoms). Psychological interventions (e.g. relaxation training, psycho‐education) for managing rebound symptoms are superior to gradual dose reduction alone in patients in primary care settings (Parr 2009). Adverse reactions associated with benzodiazepine treatment include cognitive impairment (Barker 2004; Glass 2005), psychomotor impairments with increased risk of falls, Woolcott 2009, and accidents (Smink 2010), daytime sedation (Glass 2005), and increased risk of dementia (Billioti 2012; Gallacher 2012; Wu 2009). Although benzodiazepines initially improve sleep continuity parameters (e.g. sleep latency, total sleep time) (Buscemi 2007a), the drugs decrease the amount of deep sleep (Parrino 1996), thereby exerting a negative effect on the overall sleep architecture. Moreover, development of tolerance to the sedative effects implies that the original dose of the drug has progressively less effect, and higher doses are needed to obtain the desired effect (Vinkers 2012). Another concern associated with prolonged benzodiazepine use is the increased mortality reported in a number of observational studies (Bachhuber 2016; Kripke 1998; Kripke 2012; Mallon 2009; Weich 2014). However, this issue is controversial because of conflicting results (Gisev 2011; Hausken 2007; Jaussent 2013), and the lack of appropriate confounder control in many of the studies showing increased mortality (Kripke 1998; Kripke 2012; Mallon 2009).
The majority of benzodiazepine prescriptions occur in general practice, where the following characteristics are associated with increased risk of long‐term use: psychiatric comorbidity, older age, being less educated, being lonely, and using more avoidant coping behaviour (Zandstra 2004). In the elderly, benzodiazepine prescribing rates are especially high, and in this population prescriptions are associated with female sex, low level of education, low income, chronic physical diseases, functional limitations, cognitive impairment, depression, anxiety, and insomnia (Sonnenberg 2012). In opioid users, the additional use of benzodiazepines is associated with increased risk of adverse reactions and overdose due to the depression of the central nervous system exerted by both types of drugs, in particular in combination with alcohol intake (Jones 2014). Use of opioids is increasing, especially in the US, both as analgesics for people with chronic pain and as illicit drug use (Manchikanti 2008; Manchikanti 2012). The management of benzodiazepine dependence in subpopulations with comorbid substance abuse including opioid use therefore warrants attention.
Description of the intervention
Currently, no drugs are recommended or approved for the management of benzodiazepine dependence or facilitation of withdrawal after long‐term use. Theoretically, a drug can facilitate benzodiazepine discontinuation in several ways: by ameliorating physical withdrawal symptoms (e.g. propranolol to reduce tremor and tachycardia); by reducing psychological craving (i.e. administering non‐benzodiazepine sedating drugs); or by treating underlying insomnia or anxiety symptoms (e.g. melatonin, buspirone, imipramine). Antiepileptics and antidepressants are among the drugs most often evaluated, but with conflicting results (Parr 2009; Voshaar 2006). Abrupt cessation of benzodiazepine treatment followed by administration of flumazenil (a benzodiazepine receptor antagonist) has also been investigated (Gerra 2002), but the feasibility of this approach is limited by the intravenous administration formulation and the need for continuous medical monitoring. An intervention to facilitate benzodiazepine discontinuation can be administered with the aim of 1) benzodiazepine cessation and thereafter discontinuation of the experimental drug, or 2) substituting the ongoing benzodiazepine treatment, that is replacing the benzodiazepine treatment with another temporary or chronic drug with a more favourable adverse reaction profile.
How the intervention might work
A Cochrane Review covering the literature until October 2004 investigated pharmacological interventions for management of benzodiazepine mono‐dependence in outpatient settings (Denis 2006). The conclusion was that gradual taper was preferable to abrupt discontinuation, and that carbamazepine, but not other investigated compounds, might be an effective intervention for gradual benzodiazepine discontinuation. However, the evidence was not strong enough to guide clinical recommendation. A meta‐analysis including both inpatient and outpatient settings reported that augmentation of guided discontinuation programmes with imipramine was more effective than guided discontinuation alone (Voshaar 2006). Another systematic review of approaches to benzodiazepine discontinuation in general practice and outpatient settings published in 2009 did not support substitutive pharmacotherapies to assist benzodiazepine discontinuation (Parr 2009). Psychological interventions have been found to be superior to gradual dose reduction (Parr 2009; Voshaar 2006), and are the topic of another recently published Cochrane Review (Darker 2015).
The pharmacological interventions hitherto investigated have tried to address the pharmacology of benzodiazepines and have thereby theoretically tried to counteract the withdrawal symptoms or to treat re‐emerging insomnia and anxiety. In this respect, carbamazepine has been one of the most promising drugs so far (Denis 2006), but other drugs are accessible such as melatonin to counteract insomnia developed as part of the withdrawal syndrome (Garfinkel 1999), or pregabalin to reduce symptoms of general anxiety emerging or worsening when benzodiazepines are withdrawn (Hadley 2012).
Why it is important to do this review
Long‐term benzodiazepine use is generally inappropriate due to adverse reactions (e.g. impaired psychomotor and cognitive functioning) and the risks of development of dependence and addiction. Distressing adverse reactions often complicate withdrawal attempts, and therefore it is important to evaluate whether any pharmacological intervention may facilitate the withdrawal or discontinuation of benzodiazepines. This could potentially minimise both individual and societal costs associated with the often extensive and prolonged withdrawal regimens. Since the previous reviews were conducted (Denis 2006; Parr 2009; Voshaar 2006), new studies investigating how to facilitate benzodiazepine discontinuation have been published, and a new systematic review was therefore warranted.
Objectives
To assess the benefits and harms of pharmacological interventions to facilitate discontinuation of chronic benzodiazepine use.
Methods
Criteria for considering studies for this review
Types of studies
We included relevant randomised controlled trials irrespective of publication type, publication date, publication language, and publication status. We did not include quasi‐randomised clinical studies and observational studies. In making this decision we are well aware that we achieve more focus on potential benefits and less on potential harms, since rare adverse events that develop only after long‐term exposure are underestimated in randomised controlled trials.
Types of participants
Adult (aged 18 years or older) chronic benzodiazepine users defined as daily use of benzodiazepines for a minimum duration of two months; or people diagnosed with benzodiazepine dependence by any diagnostic criteria (e.g. International Classification of Diseases (ICD)‐10: F13.1 or F13.2). We also included participants with psychiatric or somatic comorbidities. Benzodiazepines in this review included the benzodiazepine‐like compounds (sometimes referred to as Z‐drugs, e.g. zolpidem and zopiclone).
Types of interventions
Experimental intervention
The experimental intervention could be any drug administered to facilitate benzodiazepine withdrawal or to switch from benzodiazepine treatment to another drug. We included interventions conducted in general practice, outpatient settings, and in hospitalised patients.
Control intervention
The control interventions included:
-
treatment as usual, as defined by the trialists;
-
placebo;
-
any active pharmacological comparator.
Co‐interventions
Co‐interventions of any kind were allowed, as long as they were delivered equally in both intervention groups.
Types of outcome measures
We assessed all outcomes at two time points:
-
end of intervention, as defined by the trialists. This was the primary outcome time point in the review;
-
longest follow‐up, as defined by the trialists.
Primary outcomes
-
Benzodiazepine discontinuation (defined as cessation) measured by examining the blood or urine concentration of the participant or by self reported use.
-
Benzodiazepine withdrawal symptoms as measured by relevant questionnaires.
-
Serious adverse events, defined as any adverse event that results in death, is life‐threatening, requires hospitalisation or prolongation of existing hospitalisation, results in persistent or significant disability or incapacity, or is a congenital anomaly or birth defect (ICH GCP).
Secondary outcomes
-
Benzodiazepine mean dose.
-
Insomnia as measured by any relevant questionnaire.
-
Anxiety as measured by any relevant questionnaire.
-
Comorbid substance abuse as measured by self reported use of other drugs or alcohol.
-
Non‐serious adverse events, defined as any non‐serious undesirable medical event experienced by participants during a clinical trial that does not necessarily have a causal relationship with the intervention (ICH GCP).
-
Relapse to benzodiazepine use (defined according to the trialists), assessed only at longest follow‐up after end of intervention among the subgroup of participants who discontinued benzodiazepine use at end of intervention.
-
Discontinuation due to adverse events assessed only at the end of intervention.
Search methods for identification of studies
We aimed to identify all relevant randomised controlled trials regardless of language or publication status (published, unpublished, in press, or in progress).
Electronic searches
We searched the following electronic databases:
-
Cochrane Drugs and Alcohol Group's Specialised Register of Trials (searched on 17 October 2017);
-
The Cochrane Central Register of Controlled Trials (CENTRAL; 2017, Issue 9);
-
PubMed (January 1966 to 17 October 2017);
-
Embase (Embase.com) (January 1974 to 17 October 2017);
-
CINAHL (Cumulative Index to Nursing and Allied Health Literature) (EbscoHOST) (1982 to 17 October 2017);
-
Web of Knowledge, Web of Science (1990 to 17 October 2017).
We searched the databases using MeSH and free‐text terms relating to substance use disorders. We combined the PubMed search with the Cochrane Highly Sensitive Search Strategy for identifying randomised trials in MEDLINE: sensitivity‐ and precision‐maximising version (2008 revision) (Lefebvre 2011). Detailed search strategies were developed for each database used, accounting for differences in controlled vocabulary and syntax rules. For details see Appendix 1; Appendix 2; Appendix 3; Appendix 4; Appendix 5; Appendix 6.
We searched the following trials registries on 17 October 2017:
-
ClinicalTrials.gov (clinicaltrials.gov);
-
World Health Organization (WHO) International Clinical Trials Registry Platform (ICTRP) (www.who.int/ictrp);
-
the ISRCTN registry (www.isrctn.com).
Searching other resources
We searched for further relevant trials by screening reference lists of previous review papers and those of all articles selected for inclusion.
Where possible, we contacted the first author of each included study to seek information about further relevant published and unpublished trials.
Data collection and analysis
Selection of studies
Two review authors (LB and BE, or LB and JR) independently screened titles of all studies obtained by the search strategy. After excluding all obviously irrelevant articles, we screened the abstracts of all remaining publications. We obtained all potentially relevant studies in full text, and two review authors independently assessed these studies for inclusion in the review (LB and BE, or LB and JR). During this process, we linked multiple reports of the same trial.
Data extraction and management
Two review authors (LB and BE, or LB and JR) extracted data from the included studies using a standard extraction form. Any disagreements were resolved by consensus between raters (LB and BE, or LB and JR), and if not possible by judgement of authors JL and CG.
We extracted the following data.
-
General information: publication status, title, authors’ names, source, country, contact address, language of publication, year of publication, duplicate publication.
-
Trial characteristics: design and setting.
-
Interventions: type of pharmacological intervention, dose, duration, type of control intervention.
-
Participants: inclusion and exclusion criteria, number of participants in intervention and control groups, participant demographics such as sex and age, baseline characteristics, and number of participants lost to follow‐up.
-
Outcomes: please see Types of outcome measures above.
-
Risk of bias: please see Assessment of risk of bias in included studies below.
Assessment of risk of bias in included studies
We assessed the risk of bias for randomised controlled trials using the criteria recommended by the Cochrane Handbook for Systematic Reviews of Interventions (Higgins 2011). The recommended approach for assessing risk of bias in studies included in a Cochrane Review is a two‐part tool, addressing seven specific domains, namely sequence generation and allocation concealment (selection bias), blinding of participants and providers (performance bias), blinding of outcome assessor (detection bias), incomplete outcome data (attrition bias), selective outcome reporting (reporting bias), and other sources of bias including industry bias (Lundh 2017). The first part of the tool involves describing what was reported to have happened in the trial. The second part of the tool involves assigning a judgement relating to the risk of bias for that entry, in terms of low, high, or unclear risk. To make these judgements we used the criteria indicated by the Cochrane Handbook adapted to the addiction field. See Appendix 7 for details.
We addressed the domains of sequence generation and allocation concealment (avoidance of selection bias) in the tool by a single entry for each study.
Regarding blinding of participants, personnel, and outcome assessor (avoidance of performance bias and detection bias), we planned to consider these items separately for objective outcomes (e.g. urine drug screening) and subjective outcomes (e.g. severity of signs and symptoms of withdrawal, adverse events). However, since all available outcomes were self reported, the dichotomisation into objective and subjective outcomes was not relevant.
We considered incomplete outcome data (avoidance of attrition bias) for all outcomes.
Overall assessment of risk of bias
We classified a trial as at low risk of bias only if all of the bias components described in the above paragraphs were classified as at low risk of bias. If one or more of the bias domains were classified as at unclear or high risk of bias, we classified the trial as at high risk of bias. If we found no trials at low risk of bias or only a very few trials at low risk of bias, we planned to identify a group of trials with lower risk of bias, defined as those having low risk of bias in the following domains: generation of allocation sequence, allocation concealment, and blinding of participants and treatment providers. However, since we classified only one trial as at low risk of bias, and thus the majority of the trials (k = 37; 97%) as at high risk of bias, it was not possible to apply this classification in the current review.
Measures of treatment effect
For dichotomous outcomes, we calculated a risk ratio (RR) with 95% confidence interval (CI), and in case of a significant result based on trials at low risk of bias, we reported the number needed to treat for an additional beneficial outcome (NNTB) or the number needed to treat for an additional harmful outcome (NNTH) as the inverse of the absolute risk difference.
For continuous data, we calculated the mean difference (MD) between groups. We did not calculate effect size measures (standardised mean difference (SMD)) for all outcomes because of the inherent limitations associated with this measure (Higgins 2011). However, if scales of very considerable similarity were used, we could presume there was a small difference in the different measurements, and we calculated the effect size and planned to transform the effect back to the units of one or more of the specific instruments. However, due to marked differences in among‐participant variability, we did not find it relevant to re‐express the SMD using one of the specific measurement instruments.
Unit of analysis issues
The trial participant was the unit of analysis.
1. Cluster trials
No cluster‐randomised trials were included. If one or more cluster‐randomised trials had been included, we would have calculated the ‘design effect’ as described in our protocol (Baandrup 2015).
2. Cross‐over trials
We used data only from the first phase of cross‐over trials.
3. Studies with multiple intervention groups
Where a trial involved more than two intervention groups, we included both when relevant, or included data from the most relevant comparison if it was not appropriate from a clinical point of view to combine the experimental intervention groups into a single group (Higgins 2011).
Dealing with missing data
We tried to contact the first authors of studies to supply any missing data with regard to the defined outcomes. However, many of the included studies were old and the reported author contact details were outdated. It was thus impossible to contact many of the authors, and even the authors of newer studies did not reply to our queries for missing data.
Dichotomous data
For dichotomous outcomes, we did not impute missing values and analysed data as a complete‐case analysis.
Continuous data
If standard deviations (SDs) were not reported, we calculated them, if possible, using other data from the trial. If calculation of the SD was impossible, we imputed SDs from trials with similar characteristics if we considered this to be a valid approach.
Assessment of heterogeneity
We assessed statistical heterogeneity in the trials both by visual inspection of a forest plot and by using a standard Chi2 value with a significance level of P = 0.10. We assessed heterogeneity by use of the I2 statistic. We interpreted an I2 estimate greater than or equal to 50% and a significant Chi2 statistic as evidence of substantial heterogeneity (Higgins 2011). If this was the case, we explored the reasons for heterogeneity. If there was high inconsistency, and a clear reason was found, we planned to present data separately. We only performed a meta‐analysis if a sufficient number of studies were identified and if combining these studies was feasible as judged by clinical and statistical characteristics.
Assessment of reporting biases
We planned to inspect funnel plot symmetry when at least 10 trials were included in the meta‐analysis (Egger 1997; Macaskill 2001), bearing in mind that publication bias does not necessarily cause asymmetry, and that asymmetry may have other causes than publication bias. The inspection by funnel plot was not possible because none of the meta‐analyses included at least 10 trials.
For each included study, we investigated whether a study protocol was available. We searched PubMed, other major reference databases, and the Internet for a study protocol if a web address was not specifically stated in the article. This search could reveal abstracts or presentations relating to the study, and a comparison of outcomes with published outcomes was then possible. For newer studies, we searched for information on predefined outcome measures in trial registries. We had planned to construct a matrix containing recorded outcomes in each study, which then could indicate which studies did not report outcomes reported by the majority of included studies. However, during the process of data extraction and quality assessment, it was very evident which trials were associated with reporting bias, since these trials did not report the most evident outcome, namely some measure of benzodiazepine consumption.
Data synthesis
We divided the analyses according to type of experimental drug and pooling of drugs where a class effect could be expected (i.e. pooling of data from trials investigating drugs with a similar pharmacological profile, if clinical and statistical heterogeneity allowed). We performed meta‐analyses according to the recommendations in the Cochrane Handbook for Systematic Reviews of Interventions (Higgins 2011), using the software Review Manager 5 (RevMan 2014). We further conducted Trial Sequential Analysis using the software available from CTU 2011.
Meta‐analysis
We performed meta‐analyses using a random‐effects model based on expectations of substantial heterogeneity among included trials (Deeks 2011; DeMets 1987; DerSimonian 1986). However, in case we found that one or two trials dominated the reported evidence (i.e. constituted more than 75% of the evidence), and there was substantial heterogeneity, we planned to synthesise data when appropriate and to emphasise results from the fixed‐effect model. However, due to the nature of the extracted data this scenario was not relevant.
Trial Sequential Analysis
We applied Trial Sequential Analysis, CTU 2011; Thorlund 2011b, because cumulative meta‐analyses are at risk of producing random errors due to sparse data and repetitive testing of the accumulating data (Brok 2008; Brok 2009; Thorlund 2009; Thorlund 2010; Wetterslev 2008; Wetterslev 2009). To minimise random errors, we calculated the required information size (i.e. the number of participants needed in a meta‐analysis to detect or reject a certain intervention effect) (Thorlund 2011a; Wetterslev 2008; Wetterslev 2017). The required information size for a meta‐analysis corresponds to the sample size for a single trial (Wetterslev 2017). The required information size takes into account: the event proportion in the control group; the assumption of a plausible risk ratio (RR) reduction, or the RR reduction observed in the included trials with low risk of bias; and the assumed heterogeneity, Turner 2014, or diversity of the meta‐analysis (Wetterslev 2008; Wetterslev 2009; Wetterslev 2017).
Trial Sequential Analysis enables testing for significance each time a new trial is added to the meta‐analysis (Thorlund 2011b; Wetterslev 2008; Wetterslev 2017). We added the trials according to the year of publication, and if more than one trial had been published in a year, we added trials alphabetically according to the last name of the first author. On the basis of the required information size and risk of type I and type II errors, we further constructed trial sequential monitoring boundaries. These boundaries determine the statistical inference one may draw from a meta‐analysis that has not reached the required information size. If the trial sequential boundary is crossed before the required information size is reached, firm evidence may perhaps be established and further trials may turn out to be superfluous. On the other hand, it is probably necessary to continue doing trials in order to detect or reject a certain intervention effect, if the trial sequential boundaries are not crossed.
As default, we originally planned to use a type I error of 5%, and a type II error of 20%. However, to account for multiplicity, we decreased the risk of type I error for the three primary outcomes to 2.5%, and to 1.25% for the seven secondary outcomes (Jakobsen 2014). Furthermore, we decreased the risk of type II error to 10%. For dichotomous outcomes, we had planned to estimate the required information size based on the proportion of participants with an outcome in the control group, a risk ratio of 20% or as suggested by the trials with low risk of bias, a diversity of 30% and 60%, or as suggested by the trials in the meta‐analysis. Specifically, for the primary dichotomised outcome 'benzodiazepine discontinuation', we used a control event proportion of 48% for all analyses, as this was the observed mean for trials assessing this outcome. For continuous outcomes, we estimated the required information size based on the SD observed in the control group of trials with low risk of bias and a minimal relevant difference of 50% of this SD, a diversity of 30% and 60%, or as suggested by the trials in the meta‐analysis. Specifically, for the secondary continuous outcome 'anxiety', assessed with the Hamilton Anxiety Rating Scale (HAM‐A), we used a variance of 103 (corresponding to an SD of 10 points), and a minimal relevant difference of 5 points for all analyses, as this was the highest observed variance in the trials assessing this outcome. Likewise, we used a variance of 20 points (corresponding to an SD of 4.5 points), and a minimal relevant difference of 2.25 points for all analyses of benzodiazepine withdrawal symptoms assessed with the Benzodiazepine Withdrawal Symptom Questionnaire (BWSQ), as this was the highest observed variance in the trials assessing this outcome.
It was only possible to conduct Trial Sequential Analysis for eight outcomes, because fewer than two trials reported the same outcome, using the same instrument. In such situations the accrued information is such a small proportion of the required information size that Trial Sequential Analysis figures become uninterpretable.
Subgroup analysis and investigation of heterogeneity
We had planned to group the results from included studies according to the following methodological or clinical issues.
-
Trials at low risk of bias compared to trials at high risk of bias, or if we found no trials with low risk of bias, we would compare trials at lower risk of bias to trials at high risk of bias.
-
Type of benzodiazepine or benzodiazepine‐related drug.
-
Trials with different types of treatment setting (e.g. general practice compared to outpatient setting compared to inpatient setting).
-
Trials with different modes of benzodiazepine tapering (e.g. prescheduled or symptom‐guided).
-
Participants with concurrent psychiatric illness compared to participants without concurrent psychiatric illness.
-
Trials with different duration of the intervention: short (0 to 2 months), medium (3 to 6 months), and long (> 6 months).
-
Trials including inpatients compared to trials including outpatients.
-
Participants with other substance dependence versus participants with only benzodiazepine dependence/chronic use.
However, due to the high number of different pharmacological add‐on agents with few trials per agent, we chose not to perform any of our planned subgroup analyses.
Sensitivity analysis
We had planned to perform a sensitivity analysis to examine the impact of our assumptions regarding missing data. Furthermore, we had planned a sensitivity analysis to investigate the influence of trials with low compliance with study medication compared to trials with high compliance with study medication (compliance as defined by the trialists).
Assumption for lost dichotomous data
We had planned to perform two sensitivity analyses:
-
’Best‐worst‐case’ scenario: It will be assumed that all participants lost to follow‐up in the experimental group had no outcome, and that all participants lost to follow‐up in the control group had the outcome.
-
’Worst‐best‐case’ scenario: It will be assumed that all participants lost to follow‐up in the experimental group had the outcome, and that all participants lost to follow‐up in the control group had no outcome.
Assumptions for lost continuous data
Where assumptions had to be made regarding missing SDs (see: Dealing with missing data), we had planned sensitivity analysis to test how prone results were to change when 'completer' data only were compared to the imputed data using the above assumption. If there was a substantial difference, we had planned to report results and discuss them but continue to employ our assumption. Imputation of data turned out to be relevant for only one comparison: alpidem versus placebo (anxiety; Analysis 8.3).
However, due to the high number of different pharmacological add‐on agents with few trials per agent, we chose not to perform any of our planned sensitivity analyses.
'Summary of findings'
We used the GRADE system to assess the quality of the body of evidence and constructed 'Summary of findings' tables for the two primary outcomes on benzodiazepine consumption, employing GRADEpro software (GRADE). We assessed five factors of the study design and implementation of available trials that may downgrade the quality of the evidence, namely: risk of bias; indirectness of evidence (population, intervention, control, outcomes); unexplained heterogeneity or inconsistency of results (including problems with subgroup analyses); imprecision of results; and high probability of publication bias.
Based on this, we defined the levels of evidence as follows (Balshem 2011).
-
High‐quality evidence when "we are very confident that the true effect lies close to that of the estimate of the effect".
-
Moderate‐quality evidence when "we are moderately confident in the effect estimate: the true effect is likely to be close to the estimate of the effect, but there is a possibility that it is substantially different".
-
Low‐quality evidence when the following statement applies: "Our confidence in the effect estimate is limited: the true effect may be substantially different from the estimate of the effect".
-
Very low‐quality evidence when the following statement applies: "We have very little confidence in the effect estimate: the true effect is likely to be substantially different from the estimate of effect".
Results
Description of studies
See Characteristics of included studies section.
Results of the search
Our search strategy identified 3280 unique records. After removal of duplicates and irrelevant records, the number was reduced to 1239. Of these, we excluded 1174 after screening, and a further 22 after reviewing the full texts (Figure 1).
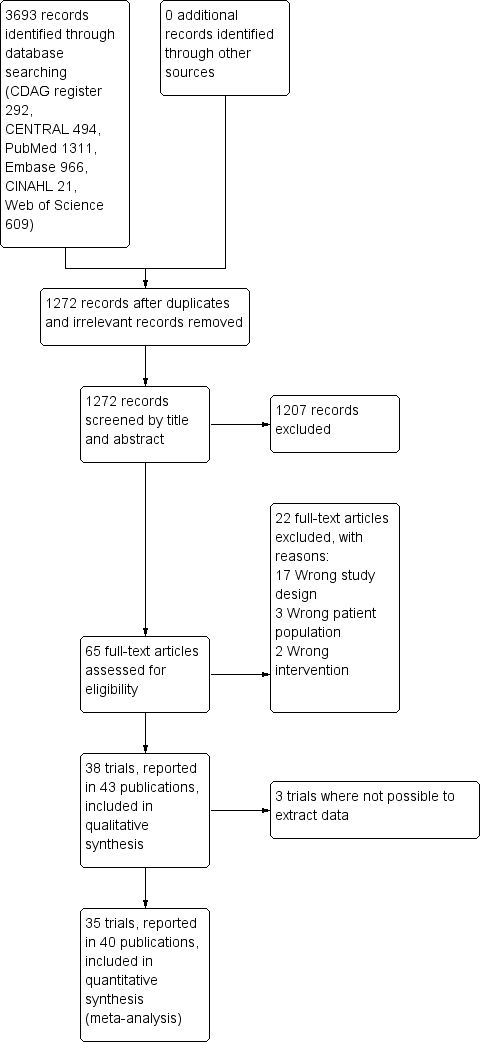
Study flow diagram.
Included studies
We included 43 publications reporting on 38 trials. Due to general poor reporting of the trials, we were not able to extract relevant data from all of the trials, even after attempting to contact the authors where possible. For this reason, we have not extracted data from Romach 1998 (experimental drug: ondansetron), Saul 1989 (experimental drug: atenolol), and Mariani 2016 (experimental drug: gabapentin). As a result, we included 35 trials involving 2295 participants with data in the quantitative meta‐analyses. See Characteristics of included studies.
Most of the trials (n = 35) involved a comparison between an active medication versus placebo or no intervention, while three trials investigated the experimental drug against another active comparator. The experimental drugs investigated were diverse, which limited the pooled analyses that were possible. If clinically relevant, we grouped investigational drugs with a similar mechanism, for example tricyclic antidepressants. To retain the clinical relevance of the meta‐analyses, we did not group medications with dissimilar pharmacological action even though they may belong to the same Anatomical Therapeutic Chemical‐group, for example valproate and carbamazepine trials were not pooled. The interventions investigated and included in the quantitative meta‐analyses were as follows.
-
Valproate versus placebo, Rickels 1999, or no intervention (Vorma 2011).
-
Carbamazepine versus placebo (Di Costanzo 1992; Klein 1994; Schweizer 1991).
-
Lithium versus placebo (Lecrubier 2005).
-
Pregabalin versus placebo (Hadley 2012).
-
Captodiame versus placebo (Mercier‐Guyon 2004).
-
Paroxetine versus placebo, GlaxoSmithKline 2002; Zitman 2001, or no intervention (Nakao 2006).
-
Tricyclic antidepressants (dosulepin (Tyrer 1996), imipramine (Rickels 2000; Rynn 2003), or trazodone (Zhang 2013)) versus placebo.
-
Alpidem versus placebo (Cassano 1996; Lader 1993).
-
Buspirone versus placebo (Ashton 1990; Lader 1987; Morton 1995; Udelman 1990).
-
Melatonin (short‐acting, Peles 2007; Vissers 2007, and prolonged‐release, Baandrup 2016; Garfinkel 1999) versus placebo.
-
Flumazenil versus placebo (Gerra 1993; Gerra 2002; Harrison‐Read 1996).
-
Propranolol versus placebo (Tyrer 1981).
-
Progesterone versus placebo (Schweizer 1995).
-
Magnesium aspartate versus placebo (Hantouche 1998).
-
Homeopathic drugs versus placebo (Cialdella 2001).
-
Carbamazepine versus tricyclic antidepressant (tianeptine) (Kornowski 2002).
-
Bromazepam versus cyamemazine (Lemoine 2006).
-
Zopiclone versus flunitrazepam (Pat‐Horenczyk 1998).
Out of the 38 trials, 24 were single‐centre (Ashton 1990; Baandrup 2016; Cialdella 2001; Di Costanzo 1992; Garfinkel 1999; Gerra 1993; Gerra 2002; Harrison‐Read 1996; Klein 1994; Kornowski 2002; Mariani 2016; Morton 1995; Nakao 2006; Pat‐Horenczyk 1998; Peles 2007; Rickels 1999; Rickels 2000; Romach 1998; Rynn 2003; Schweizer 1991; Schweizer 1995; Tyrer 1996; Vorma 2011; Zhang 2013), and 14 were multicentre (Cassano 1996; GlaxoSmithKline 2002; Hadley 2012; Hantouche 1998; Lader 1987; Lader 1993; Lecrubier 2005; Lemoine 2006; Mercier‐Guyon 2004; Saul 1989; Tyrer 1981; Udelman 1990; Vissers 2007; Zitman 2001).
The majority of the trials were performed in outpatient settings. The three trials investigating intravenous injection of flumazenil were conducted in inpatient settings (Gerra 1993; Gerra 2002; Harrison‐Read 1996), as was a trial with rapid benzodiazepine dose reduction in opioid maintenance patients (Vorma 2011). In Gerra 1993 and Gerra 2002, participants were hospitalised for the duration of the trial (seven and eight days, respectively) whereas participants in Harrison‐Read 1996 were hospitalised as they received a challenge with flumazenil and were thereafter treated as outpatients. Twenty‐four trials were conducted in Europe; eight trials in the US or Canada; and six trials in Asia.
Nine trials reported the source of funding as research grants (Baandrup 2016; Cialdella 2001; Mariani 2016; Peles 2007; Rickels 1999; Rickels 2000; Schweizer 1991; Schweizer 1995; Vorma 2011), and the funding was unclear for 15 trials (Cassano 1996; Di Costanzo 1992; Gerra 1993; Gerra 2002; Hantouche 1998; Kornowski 2002; Lader 1987; Lader 1993; Lecrubier 2005; Nakao 2006; Saul 1989; Tyrer 1981; Tyrer 1996; Vissers 2007; Zhang 2013). Fourteen trials used medications provided by the manufacturing company (Ashton 1990; Garfinkel 1999; GlaxoSmithKline 2002; Hantouche 1998; Harrison‐Read 1996; Klein 1994; Lemoine 2006; Mercier‐Guyon 2004; Morton 1995; Pat‐Horenczyk 1998; Romach 1998; Rynn 2003; Udelman 1990; Zitman 2001), and in all but one of these studies information regarding the degree of involvement of the pharmaceutical company was insufficient.
The trials investigated participants with a varying clinical picture dominated by anxiety. Three trials specifically investigated participants in opioid maintenance treatment (Mariani 2016; Peles 2007; Vorma 2011). In most trials, the majority of participants were women. The mean age was around 50 years (+/‐ 10 years) in most trials, and mean duration of benzodiazepine use was between 5 and 10 years in most trials. In eight trials there was no information at all on baseline characteristics. Eight trials applied abrupt discontinuation of benzodiazepine treatment with follow‐up periods between 1 and 8 weeks, whereas the remainder of the trials applied a gradual benzodiazepine dosage reduction regimen lasting between 2 and 24 weeks.
Trial duration ranged between 1 and 24 weeks, and mean trial duration was 9.4 weeks.
Excluded studies
We excluded 22 studies that were considered potentially relevant and assessed in detail (Figure 1). The reasons for exclusion were: 17 studies had a study design not fulfilling our inclusion criteria; 3 studies had a patient population not fulfilling our inclusion criteria; and 2 studies had interventions not fulfilling our inclusion criteria. For further details see Characteristics of excluded studies section.
Risk of bias in included studies
The overall risk of bias associated with the included studies is summarised in Figure 2 and Figure 3. Please also see Characteristics of included studies table.

Risk of bias summary: review authors' judgements about each risk of bias item for each included study.

Risk of bias graph: review authors' judgements about each risk of bias item presented as percentages across all included studies.
Allocation
Sequence generation
We judged only two trials as at low risk of bias because the random sequence was described as computer‐generated (Baandrup 2016; Zitman 2001). For all other trials (n = 36; 95%), information on random sequence generation was not provided and they were therefore judged as at unclear risk of selection bias.
Allocation concealment
We judged five trials as at low risk of bias because they sufficiently described how the randomisation was administered in a way that staff and trial participants could not anticipate to which group the next participant would be randomised. In two trials, randomisation was administered by a third party who paced and distributed the trial medication using numbered medication containers (Baandrup 2016; Zitman 2001); in one trial consecutive container numbers were used (Peles 2007); in one trial allocation was performed by an independent pharmacist (Harrison‐Read 1996); and one trial used sealed envelopes (Vorma 2011). We judged all other studies (n = 33; 87%) as at unclear risk of selection bias due to lack of information on allocation concealment.
Blinding
Performance bias
We evaluated 13 trials as at unclear risk of performance bias due to insufficient description of blinding procedures for participants and personnel (Cassano 1996; Cialdella 2001; Di Costanzo 1992; Hadley 2012; Hantouche 1998; Kornowski 2002; Mercier‐Guyon 2004; Peles 2007; Rickels 1999; Tyrer 1996; Vissers 2007; Zhang 2013; Zitman 2001). We considered more than half of the trials (n = 21; 55%) as at low risk of performance bias due to sufficient blinding procedures of participants and personnel. Four of the included trials were not blinded for participants and personnel and were therefore judged as at high risk of performance bias (Gerra 1993; Gerra 2002; Nakao 2006; Vorma 2011).
Detection bias
The majority of included trials (n = 25; 66%) were associated with unclear risk of detection bias due to insufficient descriptions of what was done to ensure blinding of outcome assessors. Three of the included trials were not blinded for outcome assessors and were therefore judged as at high risk of detection bias (Gerra 1993; Gerra 2002; Nakao 2006). We judged 10 trials as at low risk of detection bias because they provided sufficient information on blinding of outcome assessors (Baandrup 2016; Cassano 1996; Garfinkel 1999; Lader 1987; Lader 1993; Peles 2007; Schweizer 1991; Tyrer 1981; Vorma 2011; Zitman 2001).
Incomplete outcome data
We judged 14 studies (37%) as at high risk of attrition bias due to unacceptably high dropout rates, that is close to 50% (Ashton 1990; Cassano 1996; Hadley 2012; Klein 1994; Lader 1987; Mariani 2016; Pat‐Horenczyk 1998; Saul 1989; Schweizer 1991; Schweizer 1995; Tyrer 1981; Tyrer 1996; Udelman 1990; Zitman 2001). We judged six studies (16%) as at unclear risk of attrition bias due to missing information on flow of participants through the trials (Cialdella 2001; Hantouche 1998; Peles 2007; Rickels 2000; Romach 1998; Vorma 2011). We judged the remaining studies (n = 18; 47%) as at low risk of attrition bias.
Selective reporting
We judged four studies (11%) as at high risk of reporting bias because important outcome measures were not reported, that is benzodiazepine dosage at follow‐up (GlaxoSmithKline 2002; Klein 1994; Zhang 2013), or reporting of an unusual primary outcome (Lemoine 2006). We judged seven studies (18%) as at unclear risk of reporting bias due to insufficient information regarding whether selective reporting was present (Lader 1987; Lecrubier 2005; Mercier‐Guyon 2004; Peles 2007; Vissers 2007; Vorma 2011; Zitman 2001). We judged the remaining studies (n = 27; 71%) as at low risk of reporting bias.
Other potential sources of bias
We judged nine trials (24%) as at unclear risk of other bias mostly due to unclear or lacking description of funding. We rated 14 (37%) of the included trials as at high risk of other bias due to missing information on how the funding pharmaceutical company was involved in designing the trial as well as in analysing and interpreting the results.
Overall risk of bias
According to criteria described above, we could classify only one trial as at low risk of bias (Baandrup 2016), and no other trial qualified as at lower risk of bias. The large majority of the trials were thus at high risk of bias.
Effects of interventions
See: Summary of findings for the main comparison Valproate compared with placebo or no intervention for benzodiazepine discontinuation in chronic benzodiazepine users; Summary of findings 2 Carbamazepine compared with placebo for benzodiazepine discontinuation in chronic benzodiazepine users; Summary of findings 3 Lithium compared with placebo for benzodiazepine discontinuation in chronic benzodiazepine users; Summary of findings 4 Pregabalin compared with placebo for benzodiazepine discontinuation in chronic benzodiazepine users; Summary of findings 5 Captodiame compared with placebo for benzodiazepine discontinuation in chronic benzodiazepine users; Summary of findings 6 Paroxetine compared with placebo or no intervention for benzodiazepine discontinuation in chronic benzodiazepine users; Summary of findings 7 Tricyclic antidepressants compared with placebo for benzodiazepine discontinuation in chronic benzodiazepine users; Summary of findings 8 Alpidem compared with placebo for benzodiazepine discontinuation in chronic benzodiazepine users; Summary of findings 9 Buspirone compared with placebo for benzodiazepine discontinuation in chronic benzodiazepine users; Summary of findings 10 Melatonin compared with placebo for benzodiazepine discontinuation in chronic benzodiazepine users; Summary of findings 11 Flumazenil compared with placebo for benzodiazepine discontinuation in chronic benzodiazepine users; Summary of findings 12 Progesterone compared with placebo for benzodiazepine discontinuation in chronic benzodiazepine users; Summary of findings 13 Magnesium aspartate compared with placebo for benzodiazepine discontinuation in chronic benzodiazepine users; Summary of findings 14 Homéogène 46/Sedatif PC (homeopathic drugs) compared with placebo for benzodiazepine discontinuation in chronic benzodiazepine users; Summary of findings 15 Carbamazepine compared with tricyclic antidepressant for benzodiazepine discontinuation in chronic benzodiazepine users
Valproate versus placebo or no intervention
Results for this comparison were mainly from a small trial comparing valproate versus placebo (Rickels 1999). Results showed a beneficial effect of valproate on benzodiazepine discontinuation at end of intervention (Analysis 1.1: 1 study, 27 participants; RR 2.55, 95% CI 1.08 to 6.03; GRADE: very low‐quality evidence) and on benzodiazepine relapse at end of intervention (Analysis 1.2: 1 study, 27 participants; RR 0.31, 95% CI 0.11 to 0.90; GRADE: very low‐quality evidence). However, there was no effect on benzodiazepine discontinuation at longest follow‐up (Analysis 1.3: 1 study, 24 participants; RR 1.57, 95% CI 0.80 to 3.09; GRADE: very low‐quality evidence), benzodiazepine relapse at longest follow‐up (Analysis 1.4: 1 study, 24 participants; RR 0.43, 95% CI 0.13 to 1.39; GRADE: very low‐quality evidence), or symptoms of anxiety at end of intervention (Analysis 1.5: 1 study, 27 participants; MD ‐0.40 points, 95% CI ‐6.47 to 5.67; GRADE: very low‐quality evidence).
For benzodiazepine discontinuation, we calculated the required information size to be 1918 participants, using a control event proportion of 48%, a relative risk reduction of 20%, type I error of 2.5%, power of 90%, and a diversity of 30%. We could not perform Trial Sequential Analysis as there was only one trial.
For benzodiazepine withdrawal symptoms, it was possible to perform a meta‐analysis using data from Rickels 1999 and data from another small trial investigating benzodiazepine withdrawal in methadone maintenance users, Vorma 2011, comparing valproate versus no intervention. This meta‐analysis indicated no difference between intervention groups (Analysis 1.6: 2 studies, 56 participants; SMD ‐0.15, 95% CI ‐0.68 to 0.37; GRADE: very low‐quality evidence). Due to marked differences in among‐participant variability, we did not re‐express the SMD using one of the specific measurement instruments. Results were similar if analysing placebo or no intervention separately as control group.
Please see summary of findings Table for the main comparison.
Carbamazepine versus placebo
Results for this comparison stem from three smaller trials (Di Costanzo 1992; Klein 1994; Schweizer 1991), not all of which contribute data to all outcomes. It was possible to perform a meta‐analysis for benzodiazepine discontinuation at end of intervention, where no significant differences between groups were detected (Analysis 2.1: 3 studies, 147 participants; RR 1.33, 95% CI 0.99 to 1.80; GRADE: low quality‐evidence). Trial Sequential Analysis showed that the diversity‐adjusted required information size of 2109 participants was not reached, as the accrued number of participants was only 147 (7.0%), showing that insufficient information has been accrued (Figure 4).
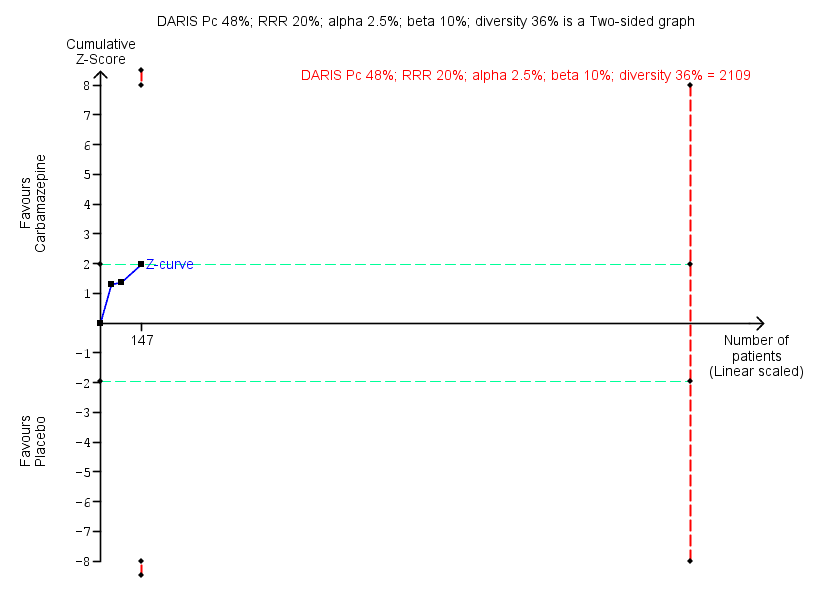
Trial Sequential Analysis of comparison: 2 Carbamazepine versus placebo, outcome: 2.1 Benzodiazepine discontinuation. Trial Sequential Analysis on benzodiazepine discontinuation in three trials was performed based on the proportion with benzodiazepine discontinuation in the control group set at 48%, a relative risk reduction (RRR) of 20%, a type I error of 2.5%, a type II error of 10% (90% power), and diversity of 36% as observed in the trials. The diversity‐adjusted required information size (DARIS) was 2109 participants, and the Trial Sequential Analysis‐adjusted confidence interval is 0.24 to 2.38. The blue line represents the cumulative Z‐score of the meta‐analysis. The green lines represent the conventional statistical boundaries of P = 5%. The cumulative Z‐curve (blue line) touches the conventional statistical boundaries, but does not cross the trial sequential monitoring boundaries, and the diversity‐adjusted required information size is not met, showing that insufficient information has been accrued.
For benzodiazepine withdrawal symptoms, results did not favour carbamazepine (Analysis 2.2: 2 studies, 76 participants; SMD ‐1.14, 95% CI ‐2.43 to 0.16; GRADE: very low quality‐evidence). Due to marked differences in among‐participant variability, we did not re‐express the SMD using one of the specific measurement instruments.
For the following outcomes, only data from single trials were available, finding no differences between groups regarding benzodiazepine discontinuation at longest follow‐up (Analysis 2.3: 1 study, 40 participants; RR 1.41, 95% CI 0.86 to 2.29; GRADE: very low‐quality evidence), relapse to benzodiazepine use (Analysis 2.4: 1 study, 36 participants; RR 0.33, 95% CI 0.08 to 1.44; GRADE: very low‐quality evidence), and non‐serious adverse events (Analysis 2.6: 1 study, 36 participants; RR 7.00, 95% CI 0.39 to 126.48; GRADE: very low‐quality evidence). Data from a single trial found carbamazepine superior to placebo regarding symptoms of anxiety (Analysis 2.7: 1 study, 36 participants; MD ‐6.00 points, 95% CI ‐9.58 to ‐2.42; GRADE: very low‐quality evidence).
When evaluating benzodiazepine withdrawal symptoms, the results were associated with significant heterogeneity. We could identify no obvious reason for this heterogeneity.
Please see summary of findings Table 2.
Lithium versus placebo
One trial of moderate size investigated lithium versus placebo for benzodiazepine discontinuation and found no difference between groups regarding benzodiazepine discontinuation (Analysis 3.1: 1 study, 230 participants; RR 1.05, 95% CI 0.86 to 1.28; GRADE: low‐quality evidence), non‐serious adverse events (Analysis 3.3: 1 study, 230 participants; RR 1.06, 95% CI 0.75 to 1.49; GRADE: very low‐quality evidence), and discontinuation due to adverse events (Analysis 3.4: 1 study, 230 participants; RR 1.38, 95% CI 0.13 to 15.03; GRADE: very low‐quality evidence) (Lecrubier 2005). Data on other outcomes specified in this review were not available.
For benzodiazepine discontinuation, we calculated the required information size to be 1918 participants, using a control event proportion of 48%, a relative risk reduction of 20%, type I error of 2.5%, power of 90%, and a diversity of 30%. We could not perform Trial Sequential Analysis as there was only one trial.
Please see summary of findings Table 3.
Pregabalin versus placebo
One smaller trial investigated this comparison (Hadley 2012), finding no significant difference between groups regarding benzodiazepine discontinuation (Analysis 4.1: 1 study, 106 participants; RR 1.44, 95% CI 0.92 to 2.25; GRADE: very low‐quality evidence), but finding superior effect of pregabalin regarding benzodiazepine withdrawal symptoms (Analysis 4.2; 1 study, 106 participants; MD ‐3.10 points, 95% CI ‐3.51 to ‐2.69; GRADE: very low‐quality evidence) and symptoms of anxiety (Analysis 4.3: 1 study, 106 participants; MD ‐4.80 points, 95% CI ‐5.28 to ‐4.32; GRADE: very low‐quality evidence). There were no differences between groups for serious and non‐serious adverse events as well as for discontinuation due to side effects (Analysis 4.4; Analysis 4.5; Analysis 4.6).
For benzodiazepine discontinuation, we calculated the required information size to be 1918 participants, using a control event proportion of 48%, a relative risk reduction of 20%, type I error of 2.5%, power of 90%, and a diversity of 30%. We could not perform Trial Sequential Analysis as there was only one trial.
Please see summary of findings Table 4.
Captodiame versus placebo
One smaller trial compared captodiame (an antihistamine used as a sedative and anxiolytic) with placebo and found that captodiame had a beneficial effect in terms of benzodiazepine withdrawal symptoms (Analysis 5.1: 1 study, 81 participants; MD ‐1.00 points, 95% CI ‐1.13 to ‐0.87; GRADE: very low‐quality evidence) and symptoms of anxiety (Analysis 5.2: 1 study, 81 participants; MD ‐5.70 points, 95% CI ‐6.05 to ‐5.35) (Mercier‐Guyon 2004). Data on other outcomes specified in this review were not available.
For benzodiazepine withdrawal symptoms assessed with the Benzodiazepine Withdrawal Symptom Questionnaire (BWSQ), we calculated the required information size to be 229 participants, using a variance of 20 points, a minimal relative difference of 2.25 points, type I error of 2.5%, power of 90%, and a diversity of 30%. We could not perform Trial Sequential Analysis as there was only one trial.
Please see summary of findings Table 5.
Paroxetine versus placebo or no intervention
Three smaller trials evaluated paroxetine to facilitate benzodiazepine discontinuation: two versus placebo, GlaxoSmithKline 2002; Zitman 2001, and one versus no intervention (Nakao 2006). It was possible to perform a meta‐analysis for the following outcomes, where placebo and no intervention were pooled as control group.
-
Benzodiazepine discontinuation at end of intervention, where no intervention effect could be found (Analysis 6.1: 3 studies, 221 participants; RR 1.45, 95% CI 0.88 to 2.39; GRADE: very low‐quality evidence). Trial Sequential Analysis showed that the diversity‐adjusted required information size of 9448 participants was not reached, as the accrued number of participants was only 210 (2.34%), showing that insufficient information has been obtained (Figure 5). Results for benzodiazepine discontinuation were associated with significant heterogeneity (Analysis 6.1), for which we could not identify any obvious reason.
-
Benzodiazepine withdrawal symptoms at end of intervention, assessed with BWSQ, indicated a difference in favour of paroxetine (Analysis 6.2: 2 studies, 99 participants; MD ‐3.57 points, 95% CI ‐5.34 to ‐1.80; GRADE: very low‐quality evidence). Trial Sequential Analysis based on a minimal relevant clinical difference of 2.25 points, variance of 20 (empirical data), a type I error of 1.25%, a type II error of 10% (90% power), and diversity of 0% showed that the diversity‐adjusted required information size of 229 participants was not met (Figure 6). However, the cumulative Z‐curve touched the trial sequential monitoring boundaries for benefit, indicating that sufficient information had been obtained, and that the result was not due to random error.
-
Symptoms of anxiety, assessed with Hamilton Anxiety Rating Scale (HAM‐A), indicated a difference in favour of paroxetine (Analysis 6.3: 2 studies, 99 participants; MD ‐6.75 points, 95% CI ‐9.64 to ‐3.86; GRADE: very low‐quality evidence). We performed Trial Sequential Analysis on anxiety, assessed with HAM‐A, with a minimal relevant clinical difference of 5 points, variance of 103 points, based on a type I error of 1.25%, a type II error of 10% (90% power), and diversity of 0% (Figure 7). The diversity‐adjusted required information size of 236 participants was not met. However, the cumulative Z‐curve crossed the trial sequential monitoring boundaries for benefit, indicating that sufficient information had been obtained, and that the result was not due to random error.

Trial Sequential Analysis of comparison: 6 Paroxetine versus placebo, outcome: 6.1 Benzodiazepine discontinuation. Trial Sequential Analysis on benzodiazepine discontinuation in three trials was performed based on the proportion with benzodiazepine discontinuation in the control group set at 48%, a relative risk reduction of 20%, a type I error of 2.5%, a type II error of 10% (90% power), and diversity of 86% as observed in the trials. The diversity‐adjusted required information size was 9448 participants, and the Trial Sequential Analysis‐adjusted confidence interval could not be estimated due to lack of information. The blue line represents the cumulative Z‐score of the meta‐analysis. The green lines represent the conventional statistical boundaries of P = 5%. The cumulative Z‐curve (blue line) does not cross the conventional statistical boundaries. The trial sequential monitoring boundaries and the diversity‐adjusted required information size are not shown as the accrued number of participants only amounted to 221/9448 (2.34%), showing that insufficient information has been accrued.

Trial Sequential Analysis of comparison: 6 Paroxetine versus placebo, outcome: 6.2 Benzodiazepine withdrawal symptoms Benzodiazepine Withdrawal Symptom Questionnaire (BWSQ). Trial Sequential Analysis on benzodiazepine withdrawal symptoms assessed with BWSQ assessing a minimal relevant clinical difference (MIREDIF) of 2.25 points, and a variance of 20 points (empirical data), was performed based on a type I error of 1.25%, a type II error of 10% (90% power), and diversity of 0%. The diversity‐adjusted required information size (DARIS) was 229 participants, and the Trial Sequential Analysis‐adjusted confidence interval is ‐7.18 to 0.05. The blue line represents the cumulative Z‐score of the meta‐analysis. The green lines represent the conventional statistical boundaries of P = 0.05. The red inward‐sloping lines represent the trial sequential monitoring boundaries. The cumulative Z‐curve touches the trial sequential monitoring boundaries, indicating that sufficient information was provided.
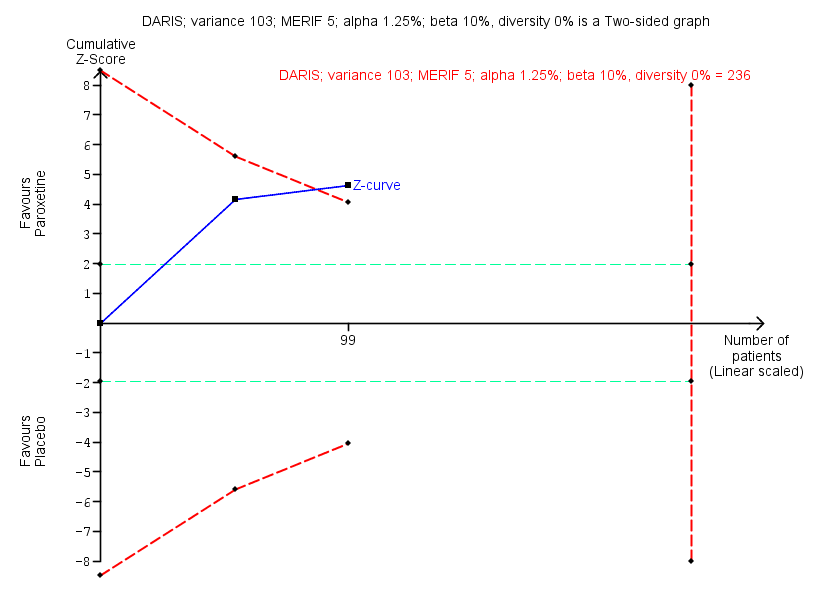
Trial Sequential Analysis of comparison: 6 Paroxetine versus placebo, outcome: 6.3 Anxiety, Hamilton Anxiety Rating Scale (HAM‐A). Trial Sequential Analysis on anxiety evaluated with HAM‐A assessing a minimal relevant clinical difference (MIREDIF) of 5 points, and a variance of 103 points, was performed based on a type I error of 1.25%, a type II error of 10% (90% power), and diversity of 0%. The diversity‐adjusted required information size (DARIS) was 236 participants, and the Trial Sequential Analysis‐adjusted confidence interval is ‐12.72 to ‐0.80. The blue line represents the cumulative Z‐score of the meta‐analysis. The green lines represent the conventional statistical boundaries of P = 0.05. The red inward‐sloping lines represent the trial sequential monitoring boundaries. The cumulative Z‐curve crosses the trial sequential monitoring boundaries, indicating that sufficient information was provided.
Results were similar if analysing placebo or no intervention separately as control group.
One trial evaluated benzodiazepine withdrawal symptoms at longest follow‐up, where no effect of paroxetine could be found (Analysis 6.4: 1 study, 54 participants; MD ‐0.13 points, 95% CI ‐4.03 to 3.77; GRADE: very low‐quality evidence). For non‐serious adverse events, no differences between intervention groups were found (Analysis 6.6).
Please see summary of findings Table 6.
Tricyclic antidepressants (dosulepin, imipramine, or trazodone) versus placebo
Four trials, each with a small sample size, investigated tricyclic antidepressants versus placebo (Rickels 2000; Rynn 2003; Tyrer 1996; Zhang 2013). It was possible to perform a meta‐analysis for benzodiazepine discontinuation at end of intervention, where results showed no difference between intervention groups (Analysis 7.1: 2 studies, 105 participants; RR 0.82, 95% CI 0.52 to 1.28; GRADE: very low‐quality evidence). Trial Sequential Analysis showed that the diversity‐adjusted required information size of 1343 participants was not reached, as the accrued number of participants was only 105 (7.81%), indicating that insufficient information has been obtained (Figure 8).

Trial Sequential Analysis of comparison: 7 Tricyclic antidepressants versus placebo, outcome: 7.1 Benzodiazepine discontinuation. Trial Sequential Analysis on benzodiazepine discontinuation in two trials was performed based on the proportion with benzodiazepine discontinuation in the control group set at 48%, a relative risk reduction (RRR) of 20%, a type I error of 2.5%, a type II error of 10% (90% power), and diversity of 0% as observed in the trials. The diversity‐adjusted required information size (DARIS) was 1343 participants, and the Trial Sequential Analysis‐adjusted confidence interval is 0.20 to 7.55. The blue line represents the cumulative Z‐score of the meta‐analysis. The green lines represent the conventional statistical boundaries of P = 5%. The cumulative Z‐curve (blue line) does not cross the conventional statistical boundaries or the trial sequential monitoring boundaries (red dotted lines), and the diversity‐adjusted required information size is not met, showing that insufficient information has been accrued.
Two trials reported symptoms of anxiety (Rynn 2003; Zhang 2013), with no difference between intervention groups (Analysis 7.2: 2 studies, 66 participants; MD ‐10.38 points, 95% CI ‐25.96 to 5.20; GRADE: very low‐quality evidence). These data were associated with significant heterogeneity, the reason for which was that the Chinese study, Zhang 2013, reported results that were far more positive in favour of the experimental drug than the remainder of the included trials.
The following outcomes were reported in one trial each: benzodiazepine discontinuation at longest follow‐up, showing a beneficial effect of tricyclic antidepressants (Analysis 7.3: 1 study, 47 participants; RR 2.20, 95% CI 1.27 to 3.82; GRADE: low‐quality evidence); benzodiazepine withdrawal symptoms (Analysis 7.4: 1 study, 38 participants; MD ‐19.78 points, 95% CI ‐20.25 to ‐19.31; GRADE: very low‐quality evidence) with a significant difference between groups in favour of tricyclic antidepressants; relapse to benzodiazepine use, showing no intervention effect (Analysis 7.5: 1 study, 36 participants; RR 2.00, 95% CI 0.73 to 5.47); and discontinuation due to adverse events, also showing no intervention effect (Analysis 7.6: 2 studies, 134 participants; RR 1.16, 95% CI 0.42 to 3.21; GRADE: very low‐quality evidence).
Please see summary of findings Table 7.
Alpidem versus placebo
Two smaller trials compared alpidem (an anxiolytic drug from the imidazopyridine family) with placebo for benzodiazepine discontinuation (Cassano 1996; Lader 1993), showing a disadvantage of alpidem for this outcome at end of intervention (Analysis 8.1: 1 study, 25 participants; RR 0.41, 95% CI 0.17 to 0.99; NNTH 2.3 participants; GRADE: low‐quality evidence). We calculated the required information size to be 1918 participants, using a control event proportion of 48%, a relative risk reduction of 20%, type I error of 2.5%, power of 90%, and a diversity of 30%. Withdrawal syndrome was also analysed, suggesting a disadvantage of alpidem (Analysis 8.2: 1 study, 145 participants; RR 4.86, 95% CI 1.12 to 21.14; NNTH 5.9 participants; GRADE: low‐quality evidence). We calculated the required information size to be 9202 participants, using a control event proportion of 15%, a relative risk reduction of 20%, type I error of 2.5%, power of 90%, and a diversity of 30%. We could not perform Trial Sequential Analysis for either of these outcomes because they were only reported in one trial.
It was possible to perform a meta‐analysis for symptoms of anxiety, as assessed by HAM‐A, where no intervention effect was found (Analysis 8.3: 2 studies, 170 participants; MD ‐1.60 points, 95% CI ‐4.64 to 1.45; GRADE: low‐quality evidence). In Trial Sequential Analysis using a minimal relevant clinical difference of 5 points, variance of 103 points, type I error of 1.25%, type II error of 10% (90% power), and diversity of 0% (Figure 9), we found that the diversity‐adjusted required information size of 235 participants was not met. However, the cumulative Z‐curve crossed the beta‐spending (futility) boundaries, indicating that an intervention effect, if any, was less than 5 points.

Trial Sequential Analysis of comparison: 8 Alpidem versus placebo, outcome: 8.3 Anxiety, Hamilton Anxiety Rating Scale (HAM‐A). Trial Sequential Analysis on anxiety evaluated with HAM‐A assessing a minimal relevant clinical difference (MIREDIF) of 5 points, and a variance of 103 points (empirical data), was performed based on a type I error of 1.25%, a type II error of 10% (90% power), and diversity of 0%. The diversity‐adjusted required information size (DARIS) was 235 participants, and the Trial Sequential Analysis‐adjusted confidence interval is ‐6.28 to 3.08. The blue line represents the cumulative Z‐score of the meta‐analysis. The green lines represent the conventional statistical boundaries of P = 0.05. The red inward‐sloping lines represent the trial sequential alpha‐spending monitoring boundaries, while the red outward‐sloping lines represent the beta‐spending (futility) boundaries. The cumulative Z‐curve crosses the beta‐spending (futility) boundaries, showing that an intervention effect, if any, is less than 5 points.
One trial reported relapse to benzodiazepine use, suggesting no intervention effect (Analysis 8.4: 1 study, 145 participants; RR 0.33, 95% CI 0.09 to 1.20; GRADE: very low‐quality evidence).
Please see summary of findings Table 8.
Buspirone versus placebo
Four trials examined use of buspirone compared with placebo (Ashton 1990; Lader 1987; Morton 1995; Udelman 1990), each with a small sample size. It was possible to perform a meta‐analysis with regard to benzodiazepine discontinuation at end of intervention, finding no difference between intervention groups (Analysis 9.1: 4 studies, 143 participants; RR 0.82, 95% CI 0.49 to 1.37; GRADE: low‐quality evidence). Trial Sequential Analysis showed that the diversity‐adjusted required information size of 3381 participants was not reached, as the accrued number of participants was only 143 (4.23%), showing that insufficient information has been accrued (Figure 10).
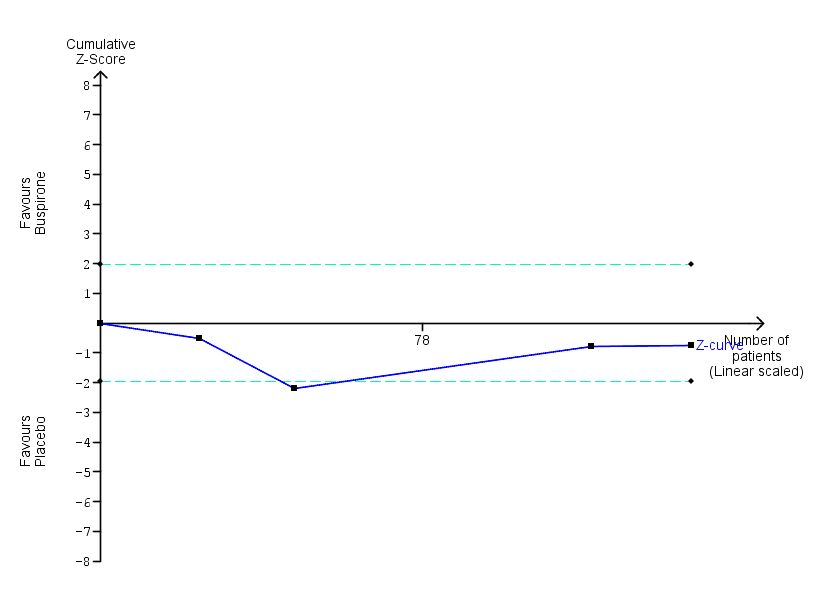
Trial Sequential Analysis of comparison: 9 Buspirone versus placebo, outcome: 9.1 Benzodiazepine discontinuation. Trial Sequential Analysis on benzodiazepine discontinuation in four trials was performed based on the proportion with benzodiazepine discontinuation in the control group set at 48%, a relative risk reduction of 20%, a type I error of 2.5%, a type II error of 10% (90% power), and diversity of 60% as observed in the trials. The diversity‐adjusted required information size was 3381 participants, and the Trial Sequential Analysis‐adjusted confidence interval could not be estimated due to lack of information. The blue line represents the cumulative Z‐score of the meta‐analysis. The green lines represent the conventional statistical boundaries of P = 5%. The cumulative Z‐curve (blue line) does not cross the conventional statistical boundaries. The trial sequential monitoring boundaries and the diversity‐adjusted required information size are not shown, as the accrued number of participants only amounted to 143/3381 (4.23%), showing that insufficient information has been accrued.
There was also no intervention effect for anxiety symptoms at end of intervention (Analysis 9.2: 2 studies, 41 participants; SMD 0.18, 95% CI ‐0.50 to 0.86; GRADE: very low‐quality evidence).
The following outcomes were reported in only one trial each and with no sign of intervention effect: benzodiazepine withdrawal symptoms at end of intervention (Analysis 9.3: 1 study, 17 participants; MD 4.69 points, 95% CI ‐14.47 to 23.85; GRADE: very low‐quality evidence), benzodiazepine discontinuation at longest follow‐up (Analysis 9.4: 1 study, 23 participants; RR 0.60, 95% CI 0.34 to 1.05; GRADE: low‐quality evidence), benzodiazepine withdrawal symptoms at longest follow‐up (Analysis 9.5: 1 study, 15 participants; MD ‐1.34 points, 95% CI ‐14.31 to 11.63; GRADE: very low‐quality evidence), and symptoms of anxiety at longest follow‐up (Analysis 9.6: 1 study, 12 participants; MD 2.75 points, 95% CI ‐2.83 to 8.33; GRADE: very low‐quality evidence). Due to marked differences in among‐participant variability, we did not re‐express the SMD using one of the specific measurement instruments.
Results for benzodiazepine discontinuation (Analysis 9.1) were associated with significant heterogeneity, with the most marked differences between Ashton 1990 (more in favour of placebo or no difference between groups) and Udelman 1990 (more in favour of buspirone). We could not identify any obvious reasons for the observed heterogeneity.
Please see summary of findings Table 9.
Melatonin versus placebo
Four trials of small to moderate sample size investigated melatonin (both short‐acting and prolonged release formulation) versus placebo for benzodiazepine discontinuation at end of intervention (Baandrup 2016; Garfinkel 1999; Peles 2007; Vissers 2007). It was possible to perform a meta‐analysis for benzodiazepine discontinuation at end of intervention, which showed no difference between intervention groups (Analysis 10.1: 4 studies, 219 participants; RR 1.20, 95% CI 0.73 to 1.96; GRADE: very low‐quality evidence). Trial Sequential Analysis showed that the diversity‐adjusted required information size of 3438 participants was not reached, as the accrued number of participants was only 219 (6.37%), showing that insufficient information has been accrued (Figure 11).
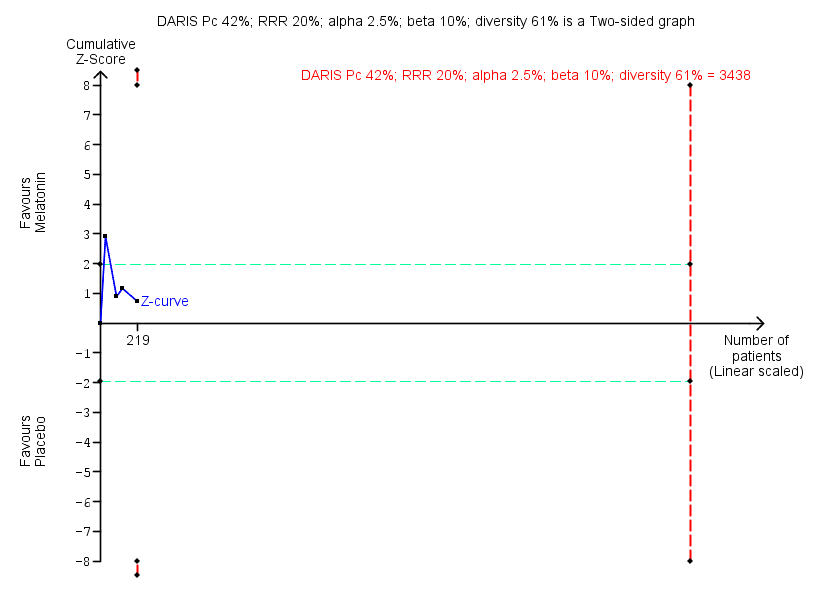
Trial Sequential Analysis of comparison: 10 Melatonin versus placebo, outcome: 10.1 Benzodiazepine discontinuation. Trial Sequential Analysis on benzodiazepine discontinuation in four trials was performed based on the proportion with benzodiazepine discontinuation in the control group set at 48%, a relative risk reduction (RRR) of 20%, a type I error of 2.5%, a type II error of 10% (90% power), and diversity of 61% as observed in the trials. The diversity‐adjusted required information size (DARIS) was 3438 participants, and the Trial Sequential Analysis‐adjusted confidence interval is 0.11 to 6.25. The blue line represents the cumulative Z‐score of the meta‐analysis. The green lines represent the conventional statistical boundaries of P = 5%. The cumulative Z‐curve (blue line) does not cross the conventional statistical boundaries or the trial sequential monitoring boundaries (red dotted lines), and the diversity‐adjusted required information size is not met, showing that insufficient information has been accrued.
We found no intervention effect likewise for insomnia (Analysis 10.2: 3 studies, 150 participants; SMD ‐1.23, 95% CI ‐2.70 to 0.23; GRADE: very low‐quality evidence) or discontinuation due to adverse events (Analysis 10.3: 2 studies, 120 participants; RR 2.10, 95% CI 0.20 to 22.26; GRADE: very low‐quality of evidence). The following outcomes were reported in one trial each: benzodiazepine discontinuation at longest follow‐up, showing no intervention effect (Analysis 10.4: 1 study, 38 participants; RR 1.03, 95% CI 0.47 to 2.27; GRADE: very low‐quality evidence), adverse events, with no intervention effect (Analysis 10.5: 1 study, 86 participants; RR 0.97, 95% CI 0.52 to 1.82; GRADE: very low‐quality evidence), and relapse to benzodiazepine use, also with no indication of intervention effect (Analysis 10.6: 1 study, 38 participants; RR 1.80, 95% CI 0.37 to 8.68; GRADE: very low‐quality evidence).
When evaluating insomnia, the results were associated with significant heterogeneity; this was explained by Garfinkel 1999, which showed a markedly significant result in favour of melatonin, whereas the two other the trials included in this meta‐analysis showed no or a much smaller difference between intervention groups (Baandrup 2016; Peles 2007). We could not identify any obvious reason for this observed heterogeneity, other than Garfinkel 1999 being the only one of these studies involved with a pharmaceutical company.
Please see summary of findings Table 10.
Flumazenil versus placebo
Three small trials examined whether flumazenil can aid in benzodiazepine discontinuation (Gerra 1993; Gerra 2002; Harrison‐Read 1996). It was possible to perform a meta‐analysis for benzodiazepine withdrawal symptoms at end of intervention, which showed a beneficial effect of flumazenil (Analysis 11.1: 3 studies, 58 participants; SMD ‐0.95, 95% CI ‐1.71 to ‐0.19; GRADE: very low‐quality evidence). Due to marked differences in among‐participant variability, we did not re‐express the SMD using one of the specific measurement instruments. We could not calculate the required information size because the trials did not use the same instrument, and results were reported using SMD.
The following outcomes were reported in one trial each: symptoms of anxiety, with results in favour of flumazenil (Analysis 11.2: 1 study, 18 participants; MD ‐1.30 points, 95% CI ‐2.28 to ‐0.32; GRADE: very low‐quality evidence) and benzodiazepine mean dose at end of intervention, with no difference between groups (Analysis 11.3: 1 study, 10 participants; MD ‐3.70 points, 95% CI ‐22.06 to 14.66; GRADE: very low‐quality evidence). As previously noted, one of the flumazenil studies was ended prematurely due to severe withdrawal symptoms elicited during the trial procedure (Harrison‐Read 1996).
When evaluating benzodiazepine withdrawal symptoms, the results were associated with significant heterogeneity for which no obvious reason could be identified.
Please see summary of findings Table 11.
Propranolol versus placebo
One small trial evaluated propranolol versus placebo (Tyrer 1981). Only data on relapse to benzodiazepine use at end of intervention were available, showing no effect of the study intervention (Analysis 12.1: 1 study, 40 participants; RR 0.64, 95% CI 0.31 to 1.30; GRADE: very low‐quality evidence).
Progesterone versus placebo
One small trial evaluated this comparison (Schweizer 1995), reporting no intervention effect on benzodiazepine discontinuation at end of intervention (Analysis 13.1: 1 study, 35 participants; RR 1.15, 95% CI 0.52 to 2.54; GRADE: very low‐quality evidence), and a difference between groups in favour of placebo for non‐serious adverse events (Analysis 13.2: 1 study, 35 participants; RR 3.13, 95% CI 1.15 to 8.54; GRADE: very low‐quality evidence).
For benzodiazepine discontinuation, we calculated the required information size to be 1918 participants, using a control event proportion of 48%, a relative risk reduction of 20%, type I error of 2.5%, power of 90%, and a diversity of 30%. We could not perform Trial Sequential Analysis as there was only one trial.
Please see summary of findings Table 12.
Magnesium aspartate versus placebo
One moderately sized trial compared magnesium aspartate (a mineral supplement) with placebo (Hantouche 1998), and found a beneficial effect of placebo for benzodiazepine discontinuation (Analysis 14.1: 1 study, 144 participants; RR 0.80, 95% CI 0.66 to 0.96; NNTH 5.8; GRADE: very low‐quality evidence), but no difference between groups for symptoms of anxiety (Analysis 14.2: 1 study, 144 participants; MD ‐0.80 points, 95% CI ‐2.73 to 1.13; GRADE: very low‐quality evidence), benzodiazepine relapse (Analysis 14.3: 1 study, 144 participants; RR 0.93, 95% CI 0.46 to 1.87; GRADE: very low‐quality evidence), non‐serious adverse events (Analysis 14.4: 1 study, 144 participants; RR 0.49, 95% CI 0.18 to 1.35; GRADE: very low‐quality evidence), and discontinuation due to adverse events (Analysis 14.5: 1 study, 144 participants; RR 0.40, 95% CI 0.13 to 1.18; GRADE: very low‐quality evidence).
For benzodiazepine discontinuation, we calculated the required information size to be 1918 participants, using a control event proportion of 48%, a relative risk reduction of 20%, type I error of 2.5%, power of 90%, and a diversity of 30%. We could not perform Trial Sequential Analysis because there was only one trial.
Please see summary of findings Table 13.
Homeopathic drugs versus placebo
One small trial compared two homeopathic drugs ("Homéogène 46" and "Sédatif PC") versus placebo (Cialdella 2001), from which it was only possible to extract data on benzodiazepine discontinuation. When combining the homeopathic drugs as one experimental group versus placebo, the results showed no intervention effect (Analysis 15.1: 1 study, 51 participants; RR 0.79, 95% CI 0.36 to 1.70; GRADE: very low‐quality evidence).
For benzodiazepine discontinuation, we calculated the required information size to be 1918 participants, using a control event proportion of 48%, a relative risk reduction of 20%, type I error of 2.5%, power of 90%, and a diversity of 30%. We could not perform Trial Sequential Analysis as there was only one trial.
Please see summary of findings Table 14.
Carbamazepine versus tricyclic antidepressant (tianeptine)
Only one trial examined this comparison (Kornowski 2002), finding no additional effect of carbamazepine compared with tricyclic antidepressant for benzodiazepine discontinuation at end of intervention (Analysis 16.1: 1 study, 48 participants; RR 1.00, 95% CI 0.78 to 1.29; GRADE: low‐quality evidence) and relapse to benzodiazepine use (Analysis 16.2: 1 study, 48 participants; RR 1.00, 95% CI 0.28 to 3.54; GRADE: low‐quality evidence). Data on other outcomes specified in this review were not available.
Please see summary of findings Table 15.
Bromazepam versus cyamemazine
One moderately sized trial examined bromazepam versus cyamemazine (a first‐generation antipsychotic drug of the phenothiazine class with anxiolytic efficacy) (Lemoine 2006), reporting a difference in favour of cyamemazine for relapse to benzodiazepine use (Analysis 17.1: 1 study, 124 participants; RR 0.33, 95% CI 0.14 to 0.78; GRADE: very low‐quality evidence), but no difference between groups for symptoms of anxiety (Analysis 17.2: 1 study, 160 participants; MD 0.50 points, 95% CI ‐1.23 to 2.23) or discontinuation due to adverse events (Analysis 17.3: 1 study, 160 participants; RR 2.87, 95% CI 0.79 to 10.44; GRADE: very low‐quality evidence). We identified a difference in favour of bromazepam for non‐serious adverse events (Analysis 17.4: 1 study, 160 participants; RR 1.68, 95% CI 1.01 to 2.78; GRADE: very low‐quality evidence).
Zopiclone versus flunitrazepam
One small trial examined zopiclone (a short‐acting benzodiazepine‐like drug) versus flunitrazepam (a potent intermediate‐acting benzodiazepine, which in many countries is no longer in use due to severe side effects) (Pat‐Horenczyk 1998), finding no indication of intervention effect for relapse to benzodiazepine use (Analysis 18.1: 1 study, 18 participants; RR 1.05, 95% CI 0.23 to 4.78; GRADE: very low‐quality evidence). Data on other outcomes specified in this review were not available.
Ondansetron, atenolol, and gabapentin
As described above, we were not able to extract data from three trials: Romach 1998 (ondansetron versus placebo), Saul 1989 (atenolol versus placebo), and Mariani 2016 (gabapentin versus placebo). None of these trials reported any effect on applied outcome measures of the respective experimental drug.
Adverse events
In general, adverse events were insufficiently reported, making it difficult to reliably assess the tolerability and safety of the investigated compounds.
Discussion
Summary of main results
We included 38 trials in this review, but were able to extract data from only 35 trials investigating a total of 18 different comparisons for the primary outcome of benzodiazepine discontinuation. Valproate and tricyclic antidepressants seemed to have a potentially positive effect on benzodiazepine discontinuation, whereas withdrawal symptoms seemed to be potentially ameliorated by pregabalin, captodiame, paroxetine, tricyclic antidepressants, and flumazenil. The following pharmacological agents seemed to potentially reduce symptoms of anxiety: carbamazepine, pregabalin, captodiame, paroxetine, and flumazenil. However, flumazenil seemed to be associated with a high risk of precipitating a severe withdrawal syndrome, since one of the trials was prematurely ended due to observation of unacceptable adverse events (severe panic reactions). Alpidem seemed to worsen both the probability of discontinuing benzodiazepines and the intensity of withdrawal symptoms and should not be further investigated for this use. Likewise, magnesium aspartate seemed to decrease the proportion of participants discontinuing benzodiazepines.
Overall completeness and applicability of evidence
A plethora of different drugs have been investigated in a number of small trials, many of which are of questionable quality, poorly reported, and thus difficult to extract data from. The data set is therefore not complete, but nevertheless judged by the review authors to give a full representation of the current body of evidence in this area. A substantial proportion of included trials were initiated and sponsored by the pharmaceutical industry.
Quality of the evidence
We generally rated the quality of the evidence as very low or low, representing small studies of generally poor methodology and poor reporting. Especially as many of the trials were of older date, modern standards of design and reporting were not fulfilled. As a result, the conclusions of this review should be considered tentative at best. Nonetheless, the review provides an overview of the current status of evidence and points to future directions for research on the development of pharmacotherapies for benzodiazepine dependence.
Potential biases in the review process
Some of the authors of this review also authored one of the included trials (Baandrup 2016). Data extraction and risk of bias assessment of this particular trial was done by LB and JR, the latter of whom was not involved in the trial in any way. The trial examined melatonin for benzodiazepine discontinuation. The meta‐analysis showed no benefit of melatonin for any of the reported outcomes, and thus we do not believe that our involvement in one the included trials in any way biased the results.
In our protocol, we planned to only focus our assessments on randomised controlled trials (Baandrup 2015). By doing so, we are well aware of the fact that we put an overemphasis on potential beneficial effects of the assessed interventions and ran the risks of overlooking harms. The reasons for these considerations are that harms are generally not well reported in randomised controlled trials, and that observational studies are usually needed to detect rare‐ and late‐occurring adverse events (Ioannidis 2004; Ioannidis 2009).
We did not search relevant databases of regulatory authorities as this was not planned in our protocol. We could therefore have overlooked relevant trials that have not been published in the usual literature. In all likelihood, such trials are at high risk of showing neutral or negative intervention effects, but for completeness of literature searches such databases of regulatory authorities need to be searched in future updates of this review (Schroll 2015).
Agreements and disagreements with other studies or reviews
A number of other reviews have been published on similar topics. A Cochrane Review investigating pharmacological interventions for benzodiazepine mono‐dependence management in outpatient settings in 35 studies pointed to a potential value of carbamazepine, but concluded that larger, controlled studies were needed (Denis 2006). The current review confirms the potential value of carbamazepine, but the body of evidence is too weak to translate this into a clinical recommendation.
Voshaar 2006 found that augmentation of systematic benzodiazepine discontinuation with imipramine was superior to systematic discontinuation alone. This conclusion is in agreement with the current review, although we could only identify a possible beneficial effect of tricyclic antidepressant on benzodiazepine discontinuation at longest follow‐up, based on data from a single trial. Furthermore, we report a potential favour of tricyclic antidepressants regarding benzodiazepine withdrawal symptoms, but this was also based on only one trial with results that generally seemed biased.
In Parr 2009, gradual dose reduction plus substitutive pharmacotherapies was compared with gradual dose reduction alone, restricted to general practice and outpatient settings. An evaluation of benzodiazepine cessation rate in 18 studies found promise for a few substitutive pharmacotherapies (melatonin, paroxetine, trazodone, and valproate), but concluded that the current evidence was insufficient to support their use. Our review, which included several more studies, adds further value to the suggestion of further investigating this topic, potentially involving paroxetine (and/or other selective serotonin reuptake inhibitors (SSRIs)) and valproate.
Darker 2015 examined psychosocial interventions for benzodiazepine withdrawal, finding a short‐term beneficial effect of cognitive behavioural therapy that did not last beyond three months. Motivational interviewing had no effect on benzodiazepine discontinuation. Other promising interventions investigated in single trials included a tailored letter from the general practitioner, standardised interview, and relaxation technique. The evidence base for using non‐pharmacological interventions to facilitate benzodiazepine use is unfortunately thus not much more convincing than the evidence gathered in the current review on pharmacological interventions.

Study flow diagram.

Risk of bias summary: review authors' judgements about each risk of bias item for each included study.
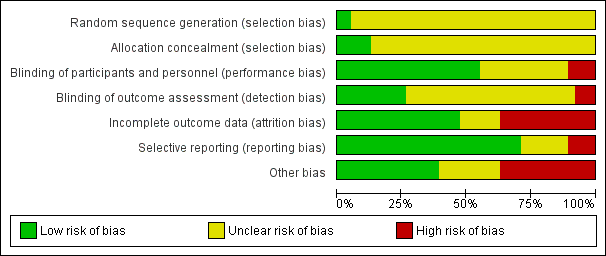
Risk of bias graph: review authors' judgements about each risk of bias item presented as percentages across all included studies.

Trial Sequential Analysis of comparison: 2 Carbamazepine versus placebo, outcome: 2.1 Benzodiazepine discontinuation. Trial Sequential Analysis on benzodiazepine discontinuation in three trials was performed based on the proportion with benzodiazepine discontinuation in the control group set at 48%, a relative risk reduction (RRR) of 20%, a type I error of 2.5%, a type II error of 10% (90% power), and diversity of 36% as observed in the trials. The diversity‐adjusted required information size (DARIS) was 2109 participants, and the Trial Sequential Analysis‐adjusted confidence interval is 0.24 to 2.38. The blue line represents the cumulative Z‐score of the meta‐analysis. The green lines represent the conventional statistical boundaries of P = 5%. The cumulative Z‐curve (blue line) touches the conventional statistical boundaries, but does not cross the trial sequential monitoring boundaries, and the diversity‐adjusted required information size is not met, showing that insufficient information has been accrued.

Trial Sequential Analysis of comparison: 6 Paroxetine versus placebo, outcome: 6.1 Benzodiazepine discontinuation. Trial Sequential Analysis on benzodiazepine discontinuation in three trials was performed based on the proportion with benzodiazepine discontinuation in the control group set at 48%, a relative risk reduction of 20%, a type I error of 2.5%, a type II error of 10% (90% power), and diversity of 86% as observed in the trials. The diversity‐adjusted required information size was 9448 participants, and the Trial Sequential Analysis‐adjusted confidence interval could not be estimated due to lack of information. The blue line represents the cumulative Z‐score of the meta‐analysis. The green lines represent the conventional statistical boundaries of P = 5%. The cumulative Z‐curve (blue line) does not cross the conventional statistical boundaries. The trial sequential monitoring boundaries and the diversity‐adjusted required information size are not shown as the accrued number of participants only amounted to 221/9448 (2.34%), showing that insufficient information has been accrued.

Trial Sequential Analysis of comparison: 6 Paroxetine versus placebo, outcome: 6.2 Benzodiazepine withdrawal symptoms Benzodiazepine Withdrawal Symptom Questionnaire (BWSQ). Trial Sequential Analysis on benzodiazepine withdrawal symptoms assessed with BWSQ assessing a minimal relevant clinical difference (MIREDIF) of 2.25 points, and a variance of 20 points (empirical data), was performed based on a type I error of 1.25%, a type II error of 10% (90% power), and diversity of 0%. The diversity‐adjusted required information size (DARIS) was 229 participants, and the Trial Sequential Analysis‐adjusted confidence interval is ‐7.18 to 0.05. The blue line represents the cumulative Z‐score of the meta‐analysis. The green lines represent the conventional statistical boundaries of P = 0.05. The red inward‐sloping lines represent the trial sequential monitoring boundaries. The cumulative Z‐curve touches the trial sequential monitoring boundaries, indicating that sufficient information was provided.

Trial Sequential Analysis of comparison: 6 Paroxetine versus placebo, outcome: 6.3 Anxiety, Hamilton Anxiety Rating Scale (HAM‐A). Trial Sequential Analysis on anxiety evaluated with HAM‐A assessing a minimal relevant clinical difference (MIREDIF) of 5 points, and a variance of 103 points, was performed based on a type I error of 1.25%, a type II error of 10% (90% power), and diversity of 0%. The diversity‐adjusted required information size (DARIS) was 236 participants, and the Trial Sequential Analysis‐adjusted confidence interval is ‐12.72 to ‐0.80. The blue line represents the cumulative Z‐score of the meta‐analysis. The green lines represent the conventional statistical boundaries of P = 0.05. The red inward‐sloping lines represent the trial sequential monitoring boundaries. The cumulative Z‐curve crosses the trial sequential monitoring boundaries, indicating that sufficient information was provided.

Trial Sequential Analysis of comparison: 7 Tricyclic antidepressants versus placebo, outcome: 7.1 Benzodiazepine discontinuation. Trial Sequential Analysis on benzodiazepine discontinuation in two trials was performed based on the proportion with benzodiazepine discontinuation in the control group set at 48%, a relative risk reduction (RRR) of 20%, a type I error of 2.5%, a type II error of 10% (90% power), and diversity of 0% as observed in the trials. The diversity‐adjusted required information size (DARIS) was 1343 participants, and the Trial Sequential Analysis‐adjusted confidence interval is 0.20 to 7.55. The blue line represents the cumulative Z‐score of the meta‐analysis. The green lines represent the conventional statistical boundaries of P = 5%. The cumulative Z‐curve (blue line) does not cross the conventional statistical boundaries or the trial sequential monitoring boundaries (red dotted lines), and the diversity‐adjusted required information size is not met, showing that insufficient information has been accrued.

Trial Sequential Analysis of comparison: 8 Alpidem versus placebo, outcome: 8.3 Anxiety, Hamilton Anxiety Rating Scale (HAM‐A). Trial Sequential Analysis on anxiety evaluated with HAM‐A assessing a minimal relevant clinical difference (MIREDIF) of 5 points, and a variance of 103 points (empirical data), was performed based on a type I error of 1.25%, a type II error of 10% (90% power), and diversity of 0%. The diversity‐adjusted required information size (DARIS) was 235 participants, and the Trial Sequential Analysis‐adjusted confidence interval is ‐6.28 to 3.08. The blue line represents the cumulative Z‐score of the meta‐analysis. The green lines represent the conventional statistical boundaries of P = 0.05. The red inward‐sloping lines represent the trial sequential alpha‐spending monitoring boundaries, while the red outward‐sloping lines represent the beta‐spending (futility) boundaries. The cumulative Z‐curve crosses the beta‐spending (futility) boundaries, showing that an intervention effect, if any, is less than 5 points.

Trial Sequential Analysis of comparison: 9 Buspirone versus placebo, outcome: 9.1 Benzodiazepine discontinuation. Trial Sequential Analysis on benzodiazepine discontinuation in four trials was performed based on the proportion with benzodiazepine discontinuation in the control group set at 48%, a relative risk reduction of 20%, a type I error of 2.5%, a type II error of 10% (90% power), and diversity of 60% as observed in the trials. The diversity‐adjusted required information size was 3381 participants, and the Trial Sequential Analysis‐adjusted confidence interval could not be estimated due to lack of information. The blue line represents the cumulative Z‐score of the meta‐analysis. The green lines represent the conventional statistical boundaries of P = 5%. The cumulative Z‐curve (blue line) does not cross the conventional statistical boundaries. The trial sequential monitoring boundaries and the diversity‐adjusted required information size are not shown, as the accrued number of participants only amounted to 143/3381 (4.23%), showing that insufficient information has been accrued.

Trial Sequential Analysis of comparison: 10 Melatonin versus placebo, outcome: 10.1 Benzodiazepine discontinuation. Trial Sequential Analysis on benzodiazepine discontinuation in four trials was performed based on the proportion with benzodiazepine discontinuation in the control group set at 48%, a relative risk reduction (RRR) of 20%, a type I error of 2.5%, a type II error of 10% (90% power), and diversity of 61% as observed in the trials. The diversity‐adjusted required information size (DARIS) was 3438 participants, and the Trial Sequential Analysis‐adjusted confidence interval is 0.11 to 6.25. The blue line represents the cumulative Z‐score of the meta‐analysis. The green lines represent the conventional statistical boundaries of P = 5%. The cumulative Z‐curve (blue line) does not cross the conventional statistical boundaries or the trial sequential monitoring boundaries (red dotted lines), and the diversity‐adjusted required information size is not met, showing that insufficient information has been accrued.

Comparison 1 Valproate versus placebo or no intervention, Outcome 1 Benzodiazepine discontinuation, end of intervention.

Comparison 1 Valproate versus placebo or no intervention, Outcome 2 Relapse to benzodiazepine use, end of intervention.
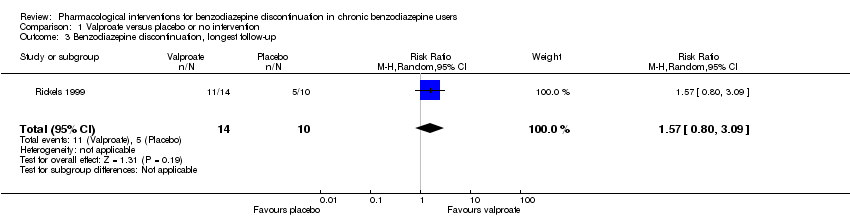
Comparison 1 Valproate versus placebo or no intervention, Outcome 3 Benzodiazepine discontinuation, longest follow‐up.

Comparison 1 Valproate versus placebo or no intervention, Outcome 4 Relapse to benzodiazepine use, longest follow‐up.
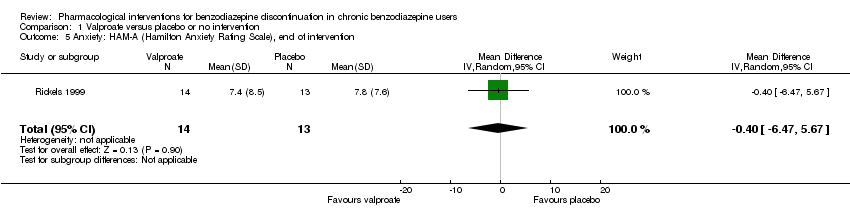
Comparison 1 Valproate versus placebo or no intervention, Outcome 5 Anxiety: HAM‐A (Hamilton Anxiety Rating Scale), end of intervention.

Comparison 1 Valproate versus placebo or no intervention, Outcome 6 Benzodiazepine withdrawal symptoms, end of intervention.
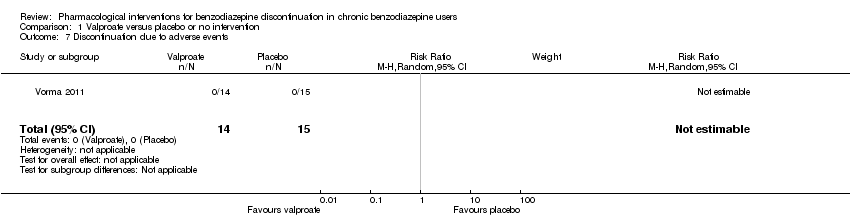
Comparison 1 Valproate versus placebo or no intervention, Outcome 7 Discontinuation due to adverse events.
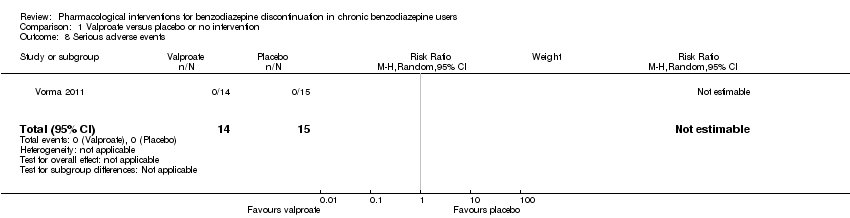
Comparison 1 Valproate versus placebo or no intervention, Outcome 8 Serious adverse events.

Comparison 2 Carbamazepine versus placebo, Outcome 1 Benzodiazepine discontinuation, end of intervention.

Comparison 2 Carbamazepine versus placebo, Outcome 2 Benzodiazepine withdrawal symptoms.

Comparison 2 Carbamazepine versus placebo, Outcome 3 Benzodiazepine discontinuation, longest follow‐up.

Comparison 2 Carbamazepine versus placebo, Outcome 4 Relapse to benzodiazepine use.

Comparison 2 Carbamazepine versus placebo, Outcome 5 Serious adverse events.
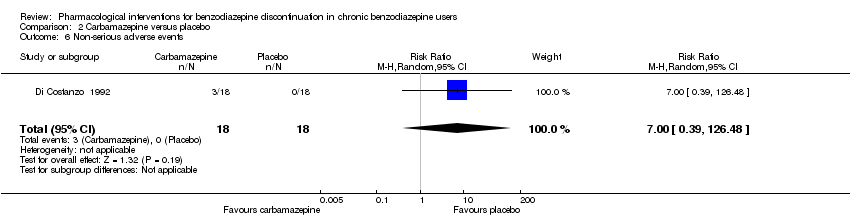
Comparison 2 Carbamazepine versus placebo, Outcome 6 Non‐serious adverse events.

Comparison 2 Carbamazepine versus placebo, Outcome 7 Anxiety, HAM‐A.
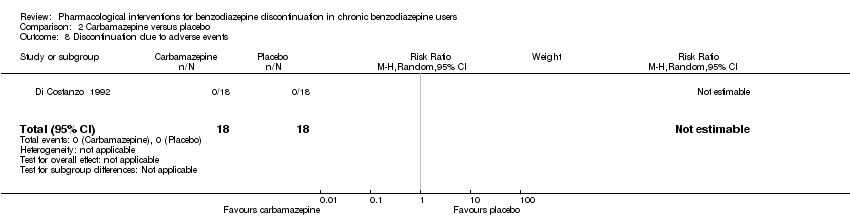
Comparison 2 Carbamazepine versus placebo, Outcome 8 Discontinuation due to adverse events.

Comparison 3 Lithium versus placebo, Outcome 1 Benzodiazepine discontinuation.
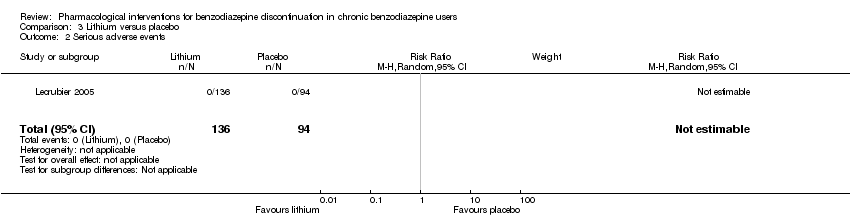
Comparison 3 Lithium versus placebo, Outcome 2 Serious adverse events.
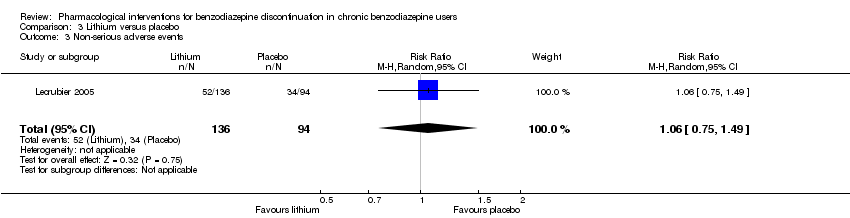
Comparison 3 Lithium versus placebo, Outcome 3 Non‐serious adverse events.
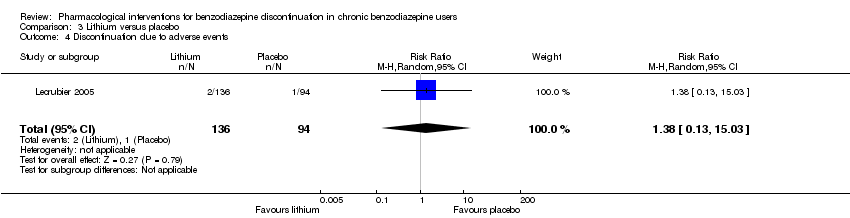
Comparison 3 Lithium versus placebo, Outcome 4 Discontinuation due to adverse events.

Comparison 4 Pregabalin versus placebo, Outcome 1 Benzodiazepine discontinuation, end of intervention.
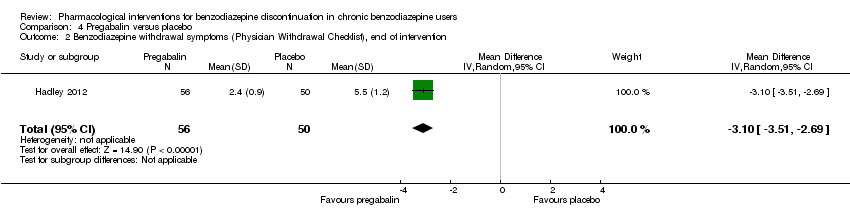
Comparison 4 Pregabalin versus placebo, Outcome 2 Benzodiazepine withdrawal symptoms (Physician Withdrawal Checklist), end of intervention.
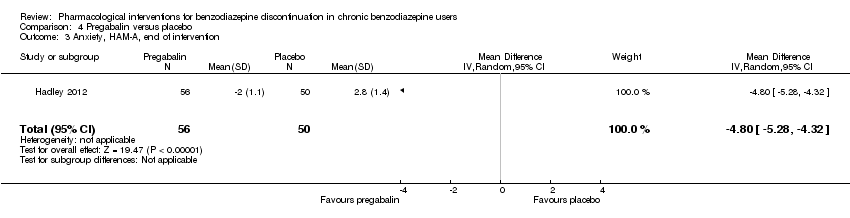
Comparison 4 Pregabalin versus placebo, Outcome 3 Anxiety, HAM‐A, end of intervention.

Comparison 4 Pregabalin versus placebo, Outcome 4 Serious adverse events.

Comparison 4 Pregabalin versus placebo, Outcome 5 Non‐serious adverse events.
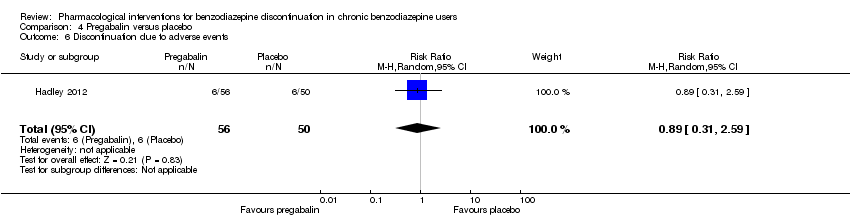
Comparison 4 Pregabalin versus placebo, Outcome 6 Discontinuation due to adverse events.
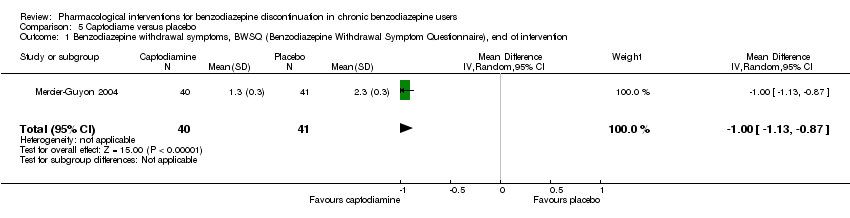
Comparison 5 Captodiame versus placebo, Outcome 1 Benzodiazepine withdrawal symptoms, BWSQ (Benzodiazepine Withdrawal Symptom Questionnaire), end of intervention.

Comparison 5 Captodiame versus placebo, Outcome 2 Anxiety, HAM‐A, end of intervention.

Comparison 5 Captodiame versus placebo, Outcome 3 Serious adverse events.
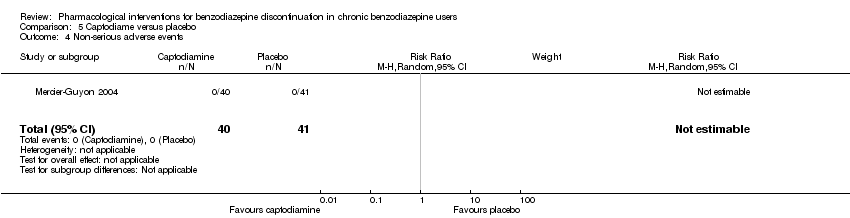
Comparison 5 Captodiame versus placebo, Outcome 4 Non‐serious adverse events.

Comparison 6 Paroxetine versus placebo or no intervention, Outcome 1 Benzodiazepine discontinuation, end of intervention.

Comparison 6 Paroxetine versus placebo or no intervention, Outcome 2 Benzodiazepine withdrawal symptoms: BWSQ, end of intervention.

Comparison 6 Paroxetine versus placebo or no intervention, Outcome 3 Anxiety: HAM‐A, end of intervention.
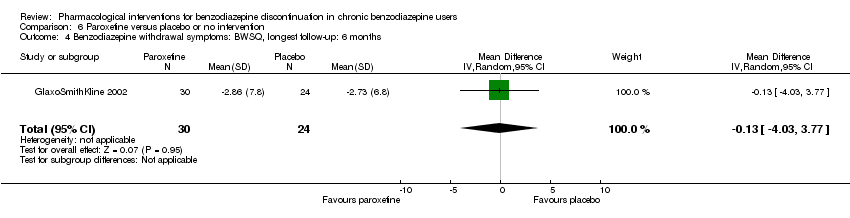
Comparison 6 Paroxetine versus placebo or no intervention, Outcome 4 Benzodiazepine withdrawal symptoms: BWSQ, longest follow‐up: 6 months.

Comparison 6 Paroxetine versus placebo or no intervention, Outcome 5 Serious adverse events.
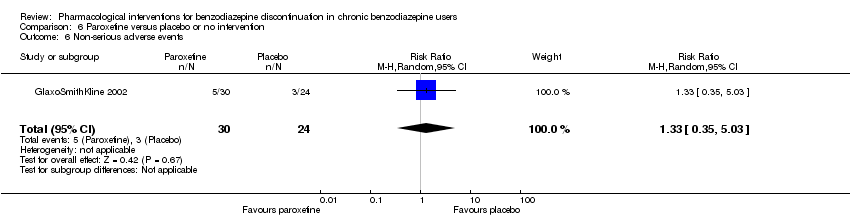
Comparison 6 Paroxetine versus placebo or no intervention, Outcome 6 Non‐serious adverse events.

Comparison 7 Tricyclic antidepressants versus placebo, Outcome 1 Benzodiazepine discontinuation, end of intervention.
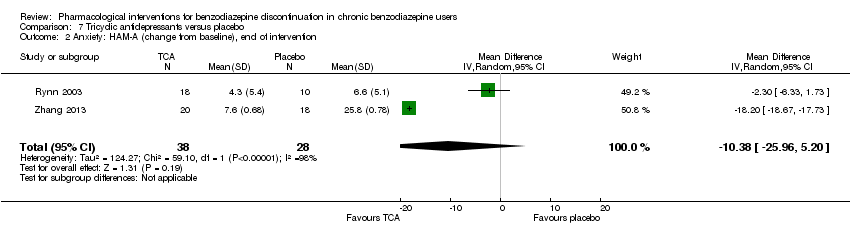
Comparison 7 Tricyclic antidepressants versus placebo, Outcome 2 Anxiety: HAM‐A (change from baseline), end of intervention.

Comparison 7 Tricyclic antidepressants versus placebo, Outcome 3 Benzodiazepine discontinuation, longest follow‐up.
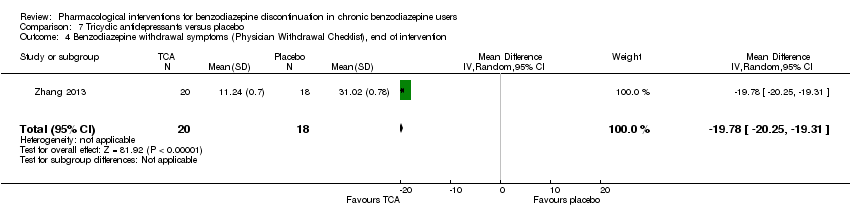
Comparison 7 Tricyclic antidepressants versus placebo, Outcome 4 Benzodiazepine withdrawal symptoms (Physician Withdrawal Checklist), end of intervention.
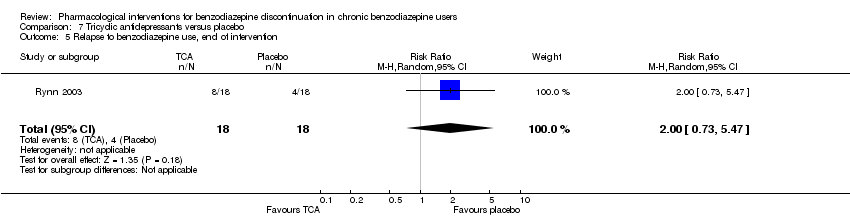
Comparison 7 Tricyclic antidepressants versus placebo, Outcome 5 Relapse to benzodiazepine use, end of intervention.

Comparison 7 Tricyclic antidepressants versus placebo, Outcome 6 Discontinuation due to adverse events.
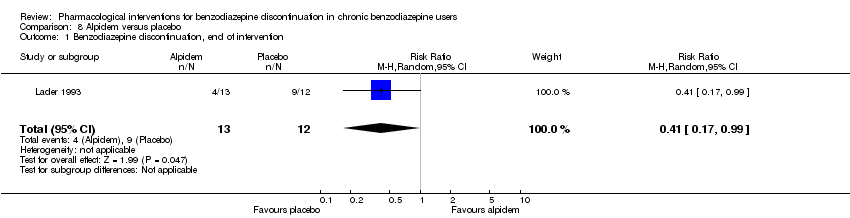
Comparison 8 Alpidem versus placebo, Outcome 1 Benzodiazepine discontinuation, end of intervention.

Comparison 8 Alpidem versus placebo, Outcome 2 Withdrawal syndrome (clinical diagnosis), end of intervention.

Comparison 8 Alpidem versus placebo, Outcome 3 Anxiety, HAM‐A, end of intervention.

Comparison 8 Alpidem versus placebo, Outcome 4 Relapse to benzodiazepine use, end of intervention.

Comparison 8 Alpidem versus placebo, Outcome 5 Serious adverse events.

Comparison 8 Alpidem versus placebo, Outcome 6 Discontinuation due to adverse events.

Comparison 9 Buspirone versus placebo, Outcome 1 Benzodiazepine discontinuation, end of intervention.
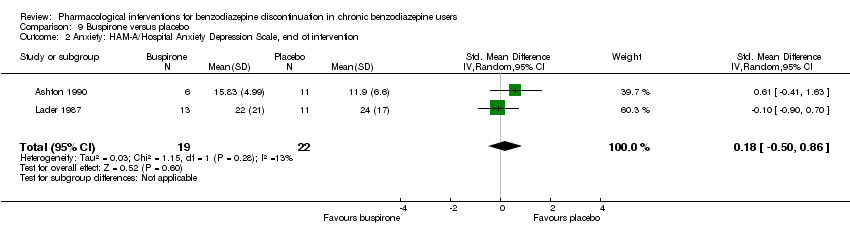
Comparison 9 Buspirone versus placebo, Outcome 2 Anxiety: HAM‐A/Hospital Anxiety Depression Scale, end of intervention.
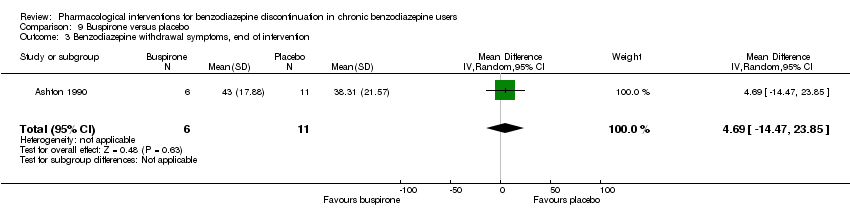
Comparison 9 Buspirone versus placebo, Outcome 3 Benzodiazepine withdrawal symptoms, end of intervention.

Comparison 9 Buspirone versus placebo, Outcome 4 Benzodiazepine discontinuation, longest follow‐up.
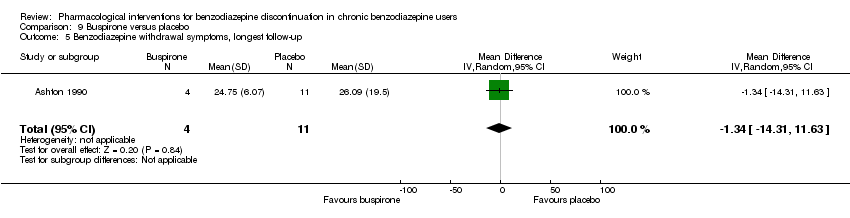
Comparison 9 Buspirone versus placebo, Outcome 5 Benzodiazepine withdrawal symptoms, longest follow‐up.
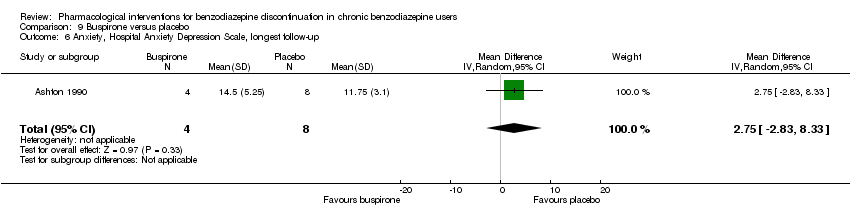
Comparison 9 Buspirone versus placebo, Outcome 6 Anxiety, Hospital Anxiety Depression Scale, longest follow‐up.

Comparison 9 Buspirone versus placebo, Outcome 7 Discontinuation due to adverse events.

Comparison 10 Melatonin versus placebo, Outcome 1 Benzodiazepine discontinuation, end of intervention.

Comparison 10 Melatonin versus placebo, Outcome 2 Insomnia.
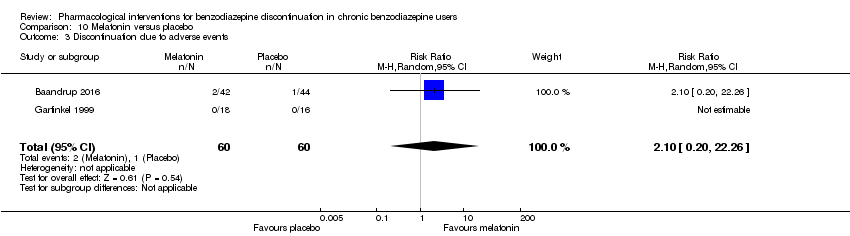
Comparison 10 Melatonin versus placebo, Outcome 3 Discontinuation due to adverse events.

Comparison 10 Melatonin versus placebo, Outcome 4 Benzodiazepine discontinuation, longest follow‐up.
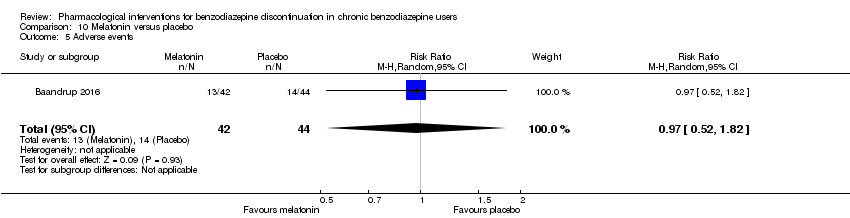
Comparison 10 Melatonin versus placebo, Outcome 5 Adverse events.
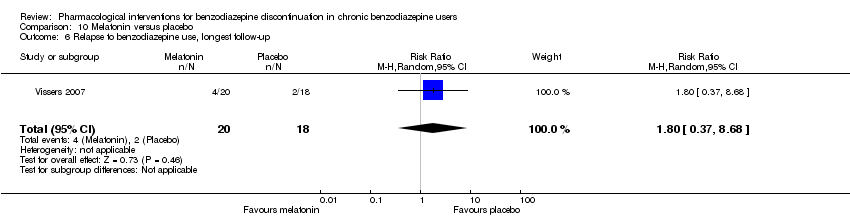
Comparison 10 Melatonin versus placebo, Outcome 6 Relapse to benzodiazepine use, longest follow‐up.
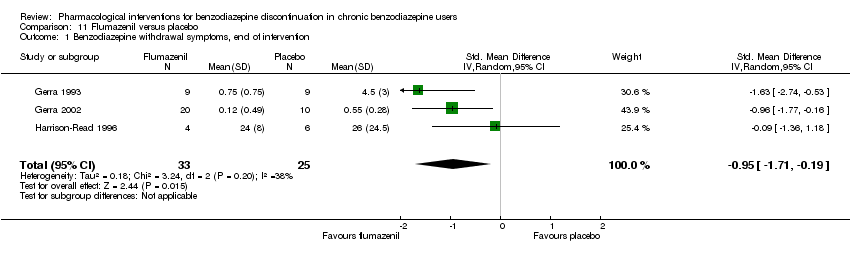
Comparison 11 Flumazenil versus placebo, Outcome 1 Benzodiazepine withdrawal symptoms, end of intervention.

Comparison 11 Flumazenil versus placebo, Outcome 2 Anxiety, HAM‐D (Hamilton Depression Rating Scale), end of intervention.

Comparison 11 Flumazenil versus placebo, Outcome 3 Benzodiazepine mean dose, end of intervention.

Comparison 12 Propranolol versus placebo, Outcome 1 Relapse to benzodiazepine use, end of intervention: 2 weeks.

Comparison 13 Progesterone versus placebo, Outcome 1 Benzodiazepine discontinuation, end of intervention.

Comparison 13 Progesterone versus placebo, Outcome 2 Non‐serious adverse events.
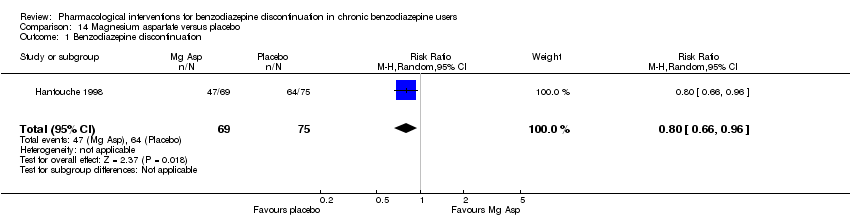
Comparison 14 Magnesium aspartate versus placebo, Outcome 1 Benzodiazepine discontinuation.

Comparison 14 Magnesium aspartate versus placebo, Outcome 2 Anxiety.

Comparison 14 Magnesium aspartate versus placebo, Outcome 3 Relapse to benzodiazepine use.
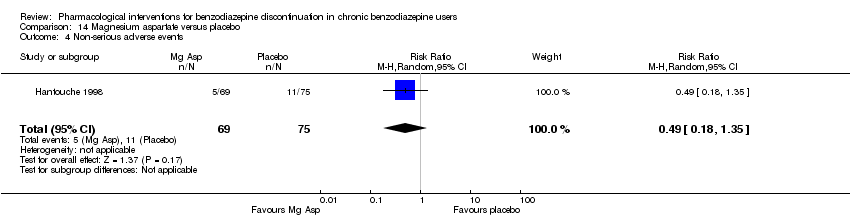
Comparison 14 Magnesium aspartate versus placebo, Outcome 4 Non‐serious adverse events.

Comparison 14 Magnesium aspartate versus placebo, Outcome 5 Discontinuation due to adverse events.
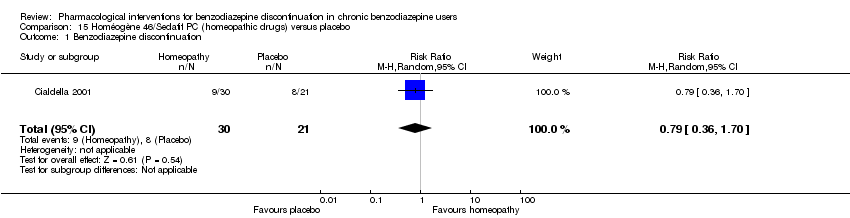
Comparison 15 Homéogène 46/Sedatif PC (homeopathic drugs) versus placebo, Outcome 1 Benzodiazepine discontinuation.
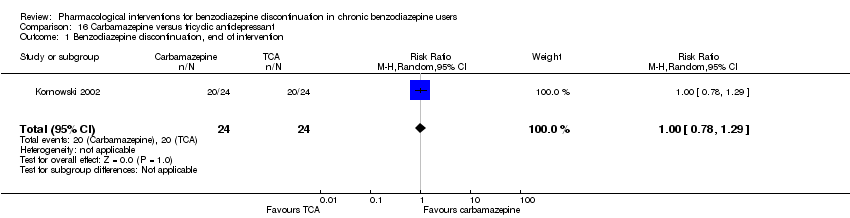
Comparison 16 Carbamazepine versus tricyclic antidepressant, Outcome 1 Benzodiazepine discontinuation, end of intervention.
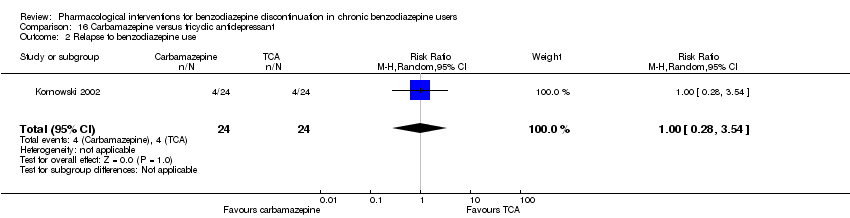
Comparison 16 Carbamazepine versus tricyclic antidepressant, Outcome 2 Relapse to benzodiazepine use.
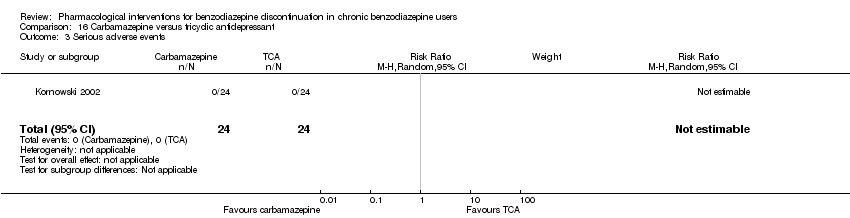
Comparison 16 Carbamazepine versus tricyclic antidepressant, Outcome 3 Serious adverse events.
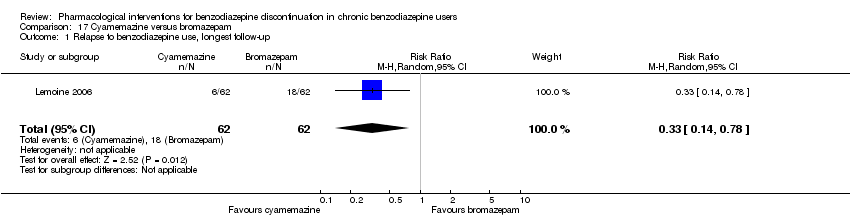
Comparison 17 Cyamemazine versus bromazepam, Outcome 1 Relapse to benzodiazepine use, longest follow‐up.

Comparison 17 Cyamemazine versus bromazepam, Outcome 2 Anxiety: Maximum amplitude of rebound (HAM‐A), end of intervention.

Comparison 17 Cyamemazine versus bromazepam, Outcome 3 Discontinuation due to adverse events.
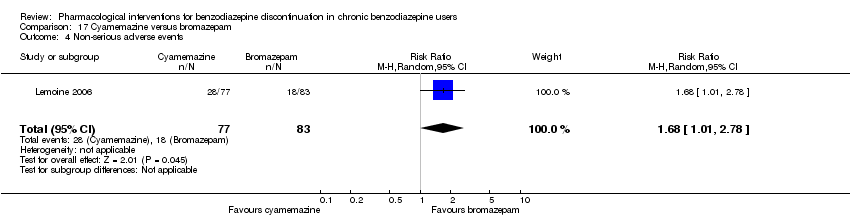
Comparison 17 Cyamemazine versus bromazepam, Outcome 4 Non‐serious adverse events.

Comparison 18 Zopiclone versus flunitrazepam, Outcome 1 Relapse to benzodiazepine use, longest follow‐up.
| Valproate compared with placebo or no intervention for benzodiazepine discontinuation in chronic benzodiazepine users | ||||||
| Patient or population: adults who withdraw from chronic benzodiazepine use | ||||||
| Outcomes | Illustrative comparative risks* (95% CI) | Relative effect | No. of participants | Quality of the evidence | Comments | |
| Assumed risk | Corresponding risk | |||||
| Placebo or no intervention | Valproate | |||||
| Benzodiazepine discontinuation, end of intervention | Study population | RR 2.55 | 27 | ⊕⊝⊝⊝ | The required information size of 1918 participants was not met. | |
| 679 per 1000 | 1000 per 1000 | |||||
| Benzodiazepine discontinuation, longest follow‐up | Study population | RR 1.57 | 24 | ⊕⊝⊝⊝ | ||
| 500 per 1000 | 785 per 1000 | |||||
| Benzodiazepine withdrawal symptoms, end of intervention | The mean benzodiazepine withdrawal symptoms in the intervention groups was | 56 | ⊕⊝⊝⊝ | SMD ‐0.15 (‐0.68 to 0.37). As a rule of thumb, 0.2 represents a small effect, 0.5 a moderate effect, and 0.8 a large effect. | ||
| Benzodiazepine withdrawal symptoms, longest follow‐up | Not estimable | ‐ | (0 study) | No included study measured this outcome. | ||
| *The basis for the assumed risk (e.g. the median control group risk across studies) is provided in footnotes. The corresponding risk (and its 95% confidence interval) is based on the assumed risk in the comparison group and the relative effect of the intervention (and its 95% CI). | ||||||
| GRADE Working Group grades of evidence | ||||||
| 1No details provided regarding random sequence generation, allocation concealment, and blinding, leading to unclear risk of selection bias, performance and detection bias (downgraded one level). | ||||||
| Carbamazepine compared with placebo for benzodiazepine discontinuation in chronic benzodiazepine users | ||||||
| Patient or population: adults who withdraw from chronic benzodiazepine use | ||||||
| Outcomes | Illustrative comparative risks* (95% CI) | Relative effect | No. of participants | Quality of the evidence | Comments | |
| Assumed risk | Corresponding risk | |||||
| Placebo | Carbamazepine | |||||
| Benzodiazepine discontinuation, end of intervention | Study population | RR 1.33 | 147 | ⊕⊕⊝⊝ | Trial Sequential Analysis showed that only 7.0% of the required information size (2109) was reached, indicating that insufficient information has been obtained. | |
| 480 per 1000 | 638 per 1000 | |||||
| Benzodiazepine discontinuation, longest follow‐up | Study population | RR 1.41 | 40 | ⊕⊝⊝⊝ | ||
| 524 per 1000 | 739 per 1000 | |||||
| Benzodiazepine withdrawal symptoms, end of intervention | The mean benzodiazepine withdrawal symptoms in the intervention groups was | 76 | ⊕⊝⊝⊝ | SMD ‐1.14 (‐2.43 to 0.16). As a rule of thumb, 0.2 represents a small effect, 0.5 a moderate effect, and 0.8 a large effect. | ||
| Benzodiazepine withdrawal symptoms, longest follow‐up | Not estimable | ‐ | (0 study) | No included study measured this outcome. | ||
| *The basis for the assumed risk (e.g. the median control group risk across studies) is provided in footnotes. The corresponding risk (and its 95% confidence interval) is based on the assumed risk in the comparison group and the relative effect of the intervention (and its 95% CI). | ||||||
| GRADE Working Group grades of evidence | ||||||
| 1Unclear risk of selection bias. One study with high risk of attrition, reporting, and other bias (downgraded one level). | ||||||
| Lithium compared with placebo for benzodiazepine discontinuation in chronic benzodiazepine users | ||||||
| Patient or population: adults who withdraw from chronic benzodiazepine use | ||||||
| Outcomes | Illustrative comparative risks* (95% CI) | Relative effect | No. of participants | Quality of the evidence | Comments | |
| Assumed risk | Corresponding risk | |||||
| Placebo | Lithium | |||||
| Benzodiazepine discontinuation, end of intervention | Study population | RR 1.05 | 230 | ⊕⊕⊝⊝ | The required information size of 1918 participants was not met. | |
| 617 per 1000 | 648 per 1000 | |||||
| Benzodiazepine discontinuation, longest follow‐up | Not estimable | ‐ | ‐ | (0 study) | ‐ | No included studies measured this outcome. |
| Benzodiazepine withdrawal symptoms, end of intervention | Not estimable | ‐ | ‐ | (0 study) | ‐ | No included studies measured this outcome. |
| Benzodiazepine withdrawal symptoms, longest follow‐up | Not estimable | ‐ | ‐ | (0 study) | ‐ | No included study measured this outcome. |
| *The basis for the assumed risk (e.g. the median control group risk across studies) is provided in footnotes. The corresponding risk (and its 95% confidence interval) is based on the assumed risk in the comparison group and the relative effect of the intervention (and its 95% CI). | ||||||
| GRADE Working Group grades of evidence | ||||||
| 1Unclear risk of selection, attrition, and reporting bias (downgraded one level). | ||||||
| Pregabalin compared with placebo for benzodiazepine discontinuation in chronic benzodiazepine users | ||||||
| Patient or population: adults who withdraw from chronic benzodiazepine use | ||||||
| Outcomes | Illustrative comparative risks* (95% CI) | Relative effect | No. of participants | Quality of the evidence | Comments | |
| Assumed risk | Corresponding risk | |||||
| Placebo | Pregabalin | |||||
| Benzodiazepine discontinuation, end of intervention | Study population | RR 1.44 | 106 | ⊕⊝⊝⊝ | The required information size of 1918 participants was not met. | |
| 360 per 1000 | 518 per 1000 | |||||
| Benzodiazepine discontinuation, longest follow‐up | Not estimable | ‐ | ‐ | (0 study) | ‐ | No included studies measured this outcome. |
| Benzodiazepine withdrawal symptoms, Physician Withdrawal Checklist (PWCL), end of intervention | ‐ | The mean benzodiazepine withdrawal symptoms, PWCL, end of intervention in the intervention group was | ‐ | 106 | ⊕⊝⊝⊝ | MD ‐3.10 (‐3.51 to ‐2.69) |
| Benzodiazepine withdrawal symptoms, longest follow‐up | Not estimable | ‐ | ‐ | (0 study) | ‐ | No included study measured this outcome. |
| *The basis for the assumed risk (e.g. the median control group risk across studies) is provided in footnotes. The corresponding risk (and its 95% confidence interval) is based on the assumed risk in the comparison group and the relative effect of the intervention (and its 95% CI). | ||||||
| GRADE Working Group grades of evidence | ||||||
| 1Unclear risk of selection bias and high risk of attrition and other bias (downgraded two levels). | ||||||
| Captodiame compared with placebo for benzodiazepine discontinuation in chronic benzodiazepine users | ||||||
| Patient or population: adults who withdraw from chronic benzodiazepine use | ||||||
| Outcomes | Illustrative comparative risks* (95% CI) | Relative effect | No. of participants | Quality of the evidence | Comments | |
| Assumed risk | Corresponding risk | |||||
| Placebo | Captodiame | |||||
| Benzodiazepine discontinuation, end of intervention | Not estimable | ‐ | ‐ | (0 study) | ‐ | No included studies measured this outcome. |
| Benzodiazepine discontinuation, longest follow‐up | Not estimable | ‐ | ‐ | (0 study) | ‐ | No included studies measured this outcome. |
| Benzodiazepine withdrawal symptoms, Benzodiazepine Withdrawal Symptom Questionnaire (BWSQ), end of intervention | ‐ | The mean benzodiazepine withdrawal symptoms, BWSQ, end of intervention in the intervention group was | ‐ | 81 | ⊕⊝⊝⊝ | MD ‐1.00 (‐1.13 to ‐0.87) The required information size of 229 participants was not met. |
| Benzodiazepine withdrawal symptoms, longest follow‐up | Not estimable | ‐ | ‐ | (0 study) | ‐ | No included study measured this outcome. |
| *The basis for the assumed risk (e.g. the median control group risk across studies) is provided in footnotes. The corresponding risk (and its 95% confidence interval) is based on the assumed risk in the comparison group and the relative effect of the intervention (and its 95% CI). | ||||||
| GRADE Working Group grades of evidence | ||||||
| 1Unclear risk of selection and reporting bias. High risk of other bias (downgraded one level). | ||||||
| Paroxetine compared with placebo or no intervention for benzodiazepine discontinuation in chronic benzodiazepine users | ||||||
| Patient or population: adults who withdraw from chronic benzodiazepine use | ||||||
| Outcomes | Illustrative comparative risks* (95% CI) | Relative effect | No. of participants | Quality of the evidence | Comments | |
| Assumed risk | Corresponding risk | |||||
| Placebo or Control | Paroxetine | |||||
| Benzodiazepine discontinuation, end of intervention | Study population | RR 1.45 | 221 | ⊕⊝⊝⊝ | Trial Sequential Analysis showed that only 2.34% of the required information size (9448) was reached, indicating that insufficient information has been obtained. | |
| 504 per 1000 | 731 per 1000 | |||||
| Benzodiazepine discontinuation, longest follow‐up | Not estimable | ‐ | (0 study) | ‐ | No included study measured this outcome. | |
| Benzodiazepine withdrawal symptoms, BWSQ, end of intervention | ‐ | The mean benzodiazepine withdrawal symptoms, BWSQ, end of intervention in the intervention groups was | ‐ | 99 | ⊕⊝⊝⊝ | MD ‐3.57 (‐5.34 to ‐1.8). Trial Sequential Analysis showed that the required information size of 229 participants was not reached. However, the alpha‐spending boundaries for benefit were crossed, indicating that sufficient information was obtained, and the result was not due to random error. |
| Benzodiazepine withdrawal symptoms, BWSQ, longest follow‐up: 6 months | ‐ | The mean benzodiazepine withdrawal symptoms, BWSQ, longest follow‐up: 6 months in the intervention group was | ‐ | 54 | ⊕⊝⊝⊝ | MD ‐0.13 (‐4.03 to 3.77) |
| *The basis for the assumed risk (e.g. the median control group risk across studies) is provided in footnotes. The corresponding risk (and its 95% confidence interval) is based on the assumed risk in the comparison group and the relative effect of the intervention (and its 95% CI). | ||||||
| GRADE Working Group grades of evidence | ||||||
| 1Unclear risk of selection and attrition bias. High risk of performance, detection, reporting, and other bias (downgraded two levels). | ||||||
| Tricyclic antidepressants compared with placebo for benzodiazepine discontinuation in chronic benzodiazepine users | ||||||
| Patient or population: adults who withdraw from chronic benzodiazepine use | ||||||
| Outcomes | Illustrative comparative risks* (95% CI) | Relative effect | No. of participants | Quality of the evidence | Comments | |
| Assumed risk | Corresponding risk | |||||
| Placebo | Tricyclic antidepressants | |||||
| Benzodiazepine discontinuation, end of intervention | Study population | RR 0.82 | 105 | ⊕⊝⊝⊝ | Trial Sequential Analysis showed that only 7.82% of the required information size (1343) was reached, indicating that insufficient information has been obtained. | |
| 451 per 1000 | 370 per 1000 | |||||
| Benzodiazepine discontinuation, longest follow‐up | Study population | RR 2.2 | 47 | ⊕⊕⊝⊝ | ||
| 375 per 1000 | 825 per 1000 | |||||
| Benzodiazepine withdrawal symptoms, Physician Withdrawal Checklist, end of intervention | ‐ | The mean benzodiazepine withdrawal symptoms in the intervention group was | ‐ | 38 (1 study) | ⊕⊝⊝⊝ | MD ‐19.78 (‐20.25 to ‐19.31) |
| Benzodiazepine withdrawal symptoms, longest follow‐up | Not estimable | ‐ | ‐ | (0 study) | ‐ | No included study measured this outcome. |
| *The basis for the assumed risk (e.g. the median control group risk across studies) is provided in footnotes. The corresponding risk (and its 95% confidence interval) is based on the assumed risk in the comparison group and the relative effect of the intervention (and its 95% CI). | ||||||
| GRADE Working Group grades of evidence | ||||||
| 1Unclear risk of selection bias and high risk of attrition and other bias (downgraded one level). | ||||||
| Alpidem compared with placebo for benzodiazepine discontinuation in chronic benzodiazepine users | ||||||
| Patient or population: adults who withdraw from chronic benzodiazepine use | ||||||
| Outcomes | Illustrative comparative risks* (95% CI) | Relative effect | No. of participants | Quality of the evidence | Comments | |
| Assumed risk | Corresponding risk | |||||
| Placebo | Alpidem | |||||
| Benzodiazepine discontinuation, end of intervention | Study population | RR 0.41 | 25 | ⊕⊕⊝⊝ | The required information size of 1918 participants was not met. | |
| 750 per 1000 | 308 per 1000 | |||||
| Benzodiazepine discontinuation, longest follow‐up | Not estimable | ‐ | ‐ | (0 study) | ‐ | No included study measured this outcome. |
| Withdrawal syndrome (clinical diagnosis), end of intervention | Study population | RR 4.86 | 145 | ⊕⊝⊝⊝ | ||
| 29 per 1000 | 143 per 1000 | |||||
| Benzodiazepine withdrawal symptoms, longest follow‐up | Not estimable | ‐ | ‐ | (0 study) | ‐ | No included study measured this outcome. |
| *The basis for the assumed risk (e.g. the median control group risk across studies) is provided in footnotes. The corresponding risk (and its 95% confidence interval) is based on the assumed risk in the comparison group and the relative effect of the intervention (and its 95% CI). | ||||||
| GRADE Working Group grades of evidence | ||||||
| 1Required information size not met (downgraded two levels due to imprecision). 3Unclear risk of selection and other bias, high risk of attrition bias (downgraded one level) | ||||||
| Buspirone compared with placebo for benzodiazepine discontinuation in chronic benzodiazepine users | ||||||
| Patient or population: adults who withdraw from chronic benzodiazepine use | ||||||
| Outcomes | Illustrative comparative risks* (95% CI) | Relative effect | No. of participants | Quality of the evidence | Comments | |
| Assumed risk | Corresponding risk | |||||
| Placebo | Buspirone | |||||
| Benzodiazepine discontinuation, end of intervention | Study population | RR 0.82 | 143 | ⊕⊕⊝⊝ | Trial Sequential Analysis showed that only 4.23% of the required information size (3381) was reached, indicating that insufficient information has been obtained. | |
| 563 per 1000 | 462 per 1000 | |||||
| Benzodiazepine discontinuation, longest follow‐up | Study population | RR 0.60 | 23 | ⊕⊕⊝⊝ | ||
| 917 per 1000 | 550 per 1000 | |||||
| Benzodiazepine withdrawal symptoms, end of intervention | ‐ | The mean benzodiazepine withdrawal symptoms, end of intervention in the intervention groups was | ‐ | 17 | ⊕⊝⊝⊝ | MD 4.69 (‐14.47 to 23.87) |
| Benzodiazepine withdrawal symptoms, longest follow‐up | ‐ | The mean benzodiazepine withdrawal symptoms, longest follow‐up in the intervention groups was | ‐ | 15 | ⊕⊝⊝⊝ | MD ‐1.34 (‐14.31 to 11.63) |
| *The basis for the assumed risk (e.g. the median control group risk across studies) is provided in footnotes. The corresponding risk (and its 95% confidence interval) is based on the assumed risk in the comparison group and the relative effect of the intervention (and its 95% CI). | ||||||
| GRADE Working Group grades of evidence | ||||||
| 1Unclear risk of selection, performance, and reporting bias. High risk of attrition and other bias (downgraded one level). | ||||||
| Melatonin compared with placebo for benzodiazepine discontinuation in chronic benzodiazepine users | ||||||
| Patient or population: adults who withdraw from chronic benzodiazepine use | ||||||
| Outcomes | Illustrative comparative risks* (95% CI) | Relative effect | No. of participants | Quality of the evidence | Comments | |
| Assumed risk | Corresponding risk | |||||
| Placebo | Melatonin | |||||
| Benzodiazepine discontinuation, end of intervention | Study population | RR 1.20 | 219 | ⊕⊝⊝⊝ | Trial Sequential Analysis showed that only 6.37% of the required information size (3438) was reached, indicating that insufficient information has been obtained. | |
| 417 per 1000 | 500 per 1000 | |||||
| Benzodiazepine discontinuation, longest follow‐up | Study population | RR 1.03 | 38 | ⊕⊝⊝⊝ | ||
| 389 per 1000 | 401 per 1000 | |||||
| Benzodiazpine withdrawal symptoms, end of intervention | Not estimable | ‐ | ‐ | (0 study) | ‐ | No included study measured this outcome. |
| Benzodiazepine withdrawal symptoms, longest follow‐up | Not estimable | ‐ | ‐ | (0 study) | ‐ | No included study measured this outcome. |
| *The basis for the assumed risk (e.g. the median control group risk across studies) is provided in footnotes. The corresponding risk (and its 95% confidence interval) is based on the assumed risk in the comparison group and the relative effect of the intervention (and its 95% CI). | ||||||
| GRADE Working Group grades of evidence | ||||||
| 1Unclear risk of selection, attrition, and reporting bias. High risk of other bias (downgraded one level). | ||||||
| Flumazenil compared with placebo for benzodiazepine discontinuation in chronic benzodiazepine users | ||||||
| Patient or population: adults who withdraw from chronic benzodiazepine use | ||||||
| Outcomes | Illustrative comparative risks* (95% CI) | Relative effect | No. of participants | Quality of the evidence | Comments | |
| Assumed risk | Corresponding risk | |||||
| Placebo | Flumazenil | |||||
| Benzodiazepine discontinuation, end of intervention | Not estimable | ‐ | ‐ | (0 study) | ‐ | No included study measured this outcome. |
| Benzodiazepine discontinuation, longest follow‐up | Not estimable | ‐ | ‐ | (0 study) | ‐ | No included study measured this outcome. |
| Benzodiazepine withdrawal symptoms, end of intervention | ‐ | The mean benzodiazepine withdrawal symptoms, end of intervention in the intervention groups was | ‐ | 58 | ⊕⊝⊝⊝ | SMD ‐0.95 (‐1.71 to ‐0.19) As a rule of thumb, 0.2 represents a small effect, 0.5 a moderate effect, and 0.8 a large effect. |
| Benzodiazepine withdrawal symptoms, longest follow‐up | Not estimable | ‐ | ‐ | (0 study) | ‐ | No included study measured this outcome. |
| *The basis for the assumed risk (e.g. the median control group risk across studies) is provided in footnotes. The corresponding risk (and its 95% confidence interval) is based on the assumed risk in the comparison group and the relative effect of the intervention (and its 95% CI). | ||||||
| GRADE Working Group grades of evidence | ||||||
| 1Unclear risk of selection bias and high risk of performance, detection, and other bias (downgraded one level). | ||||||
| Progesterone compared with placebo for benzodiazepine discontinuation in chronic benzodiazepine users | ||||||
| Patient or population: adults who withdraw from chronic benzodiazepine use | ||||||
| Outcomes | Illustrative comparative risks* (95% CI) | Relative effect | No. of participants | Quality of the evidence | Comments | |
| Assumed risk | Corresponding risk | |||||
| Placebo | Progesterone | |||||
| Benzodiazepine discontinuation, end of intervention | Study population | RR 1.15 | 35 | ⊕⊝⊝⊝ | The required information size of 1918 participants was not met. | |
| 417 per 1000 | 479 per 1000 | |||||
| Benzodiazepine discontinuation, longest follow‐up | Not estimable | ‐ | ‐ | (0 study) | ‐ | No included study measured this outcome. |
| Benzodiazepine withdrawal symptoms, end of intervention | Not estimable | ‐ | ‐ | (0 study) | ‐ | No included study measured this outcome. |
| Benzodiazepine withdrawal symptoms, longest follow‐up | Not estimable | ‐ | ‐ | (0 study) | ‐ | No included study measured this outcome. |
| *The basis for the assumed risk (e.g. the median control group risk across studies) is provided in footnotes. The corresponding risk (and its 95% confidence interval) is based on the assumed risk in the comparison group and the relative effect of the intervention (and its 95% CI). | ||||||
| GRADE Working Group grades of evidence | ||||||
| 1Unclear risk of selection and attrition bias (downgraded one level). | ||||||
| Magnesium aspartate compared with placebo for benzodiazepine discontinuation in chronic benzodiazepine users | ||||||
| Patient or population: adults who withdraw from chronic benzodiazepine use | ||||||
| Outcomes | Illustrative comparative risks* (95% CI) | Relative effect | No. of participants | Quality of the evidence | Comments | |
| Assumed risk | Corresponding risk | |||||
| Placebo | Magnesium aspartate | |||||
| Benzodiazepine discontinuation, end of intervention | Study population | RR 0.80 | 144 | ⊕⊝⊝⊝ | The required information size of 1918 participants was not met. | |
| 853 per 1000 | 683 per 1000 | |||||
| Benzodiazepine discontinuation, longest follow‐up | Not estimable | ‐ | ‐ | (0 study) | ‐ | No included study measured this outcome. |
| Benzodiazepine withdrawal symptoms, end of intervention | Not estimable | ‐ | ‐ | (0 study) | ‐ | No included study measured this outcome. |
| Benzodiazepine withdrawal symptoms, longest follow‐up | Not estimable | ‐ | ‐ | (0 study) | ‐ | No included study measured this outcome. |
| *The basis for the assumed risk (e.g. the median control group risk across studies) is provided in footnotes. The corresponding risk (and its 95% confidence interval) is based on the assumed risk in the comparison group and the relative effect of the intervention (and its 95% CI). | ||||||
| GRADE Working Group grades of evidence | ||||||
| 1Unclear risk of selection, detection, and attrition bias (downgraded one level). | ||||||
| Homéogène 46/Sedatif PC (homeopathic drugs) compared with placebo for benzodiazepine discontinuation in chronic benzodiazepine users | ||||||
| Patient or population: adults who withdraw from chronic benzodiazepine use | ||||||
| Outcomes | Illustrative comparative risks* (95% CI) | Relative effect | No. of participants | Quality of the evidence | Comments | |
| Assumed risk | Corresponding risk | |||||
| Placebo | Homéogène 46/Sedatif PC (homeopathic drugs) | |||||
| Benzodiazepine discontinuation, end of intervention | Study population | RR 0.79 | 51 | ⊕⊝⊝⊝ | The required information size was not met. | |
| 381 per 1000 | 301 per 1000 | |||||
| Benzodiazepine discontinuation, longest follow‐up | Not estimable | ‐ | ‐ | (0 study) | ‐ | No included study measured this outcome. |
| Benzodiazepine withdrawal symptoms, end of intervention | Not estimable | ‐ | ‐ | (0 study) | ‐ | No included study measured this outcome. |
| Benzodiazepine withdrawal symptoms, longest follow‐up | Not estimable | ‐ | ‐ | (0 study) | ‐ | No included study measured this outcome. |
| *The basis for the assumed risk (e.g. the median control group risk across studies) is provided in footnotes. The corresponding risk (and its 95% confidence interval) is based on the assumed risk in the comparison group and the relative effect of the intervention (and its 95% CI). | ||||||
| GRADE Working Group grades of evidence | ||||||
| 1Unclear risk of selection, attrition, and other bias (downgraded one level). | ||||||
| Carbamazepine compared with tricyclic antidepressant for benzodiazepine discontinuation in chronic benzodiazepine users | ||||||
| Patient or population: adults who withdraw from chronic benzodiazepine use | ||||||
| Outcomes | Illustrative comparative risks* (95% CI) | Relative effect | No. of participants | Quality of the evidence | Comments | |
| Assumed risk | Corresponding risk | |||||
| Tricyclic antidepressant | Carbamazepine | |||||
| Benzodiazepine discontinuation, end of intervention | Study population | RR 1.00 | 48 | ⊕⊕⊝⊝ | The required information size was not met. | |
| 833 per 1000 | 833 per 1000 | |||||
| Benzodiazepine discontinuation, longest follow‐up | Not estimable | ‐ | ‐ | (0 study) | ‐ | No included study measured this outcome. |
| Benzodiazepine withdrawal symptoms, end of intervention | Not estimable | ‐ | ‐ | (0 study) | ‐ | No included study measured this outcome. |
| Benzodiazepine withdrawal symptoms, longest follow‐up | Not estimable | ‐ | ‐ | (0 study) | ‐ | No included study measured this outcome. |
| *The basis for the assumed risk (e.g. the median control group risk across studies) is provided in footnotes. The corresponding risk (and its 95% confidence interval) is based on the assumed risk in the comparison group and the relative effect of the intervention (and its 95% CI). | ||||||
| GRADE Working Group grades of evidence | ||||||
| 1Unclear risk of selection, detection, and attrition bias (downgraded one level). | ||||||
| Outcome or subgroup title | No. of studies | No. of participants | Statistical method | Effect size |
| 1 Benzodiazepine discontinuation, end of intervention Show forest plot | 1 | 27 | Risk Ratio (M‐H, Random, 95% CI) | 2.55 [1.08, 6.03] |
| 2 Relapse to benzodiazepine use, end of intervention Show forest plot | 1 | 27 | Risk Ratio (M‐H, Random, 95% CI) | 0.31 [0.11, 0.90] |
| 3 Benzodiazepine discontinuation, longest follow‐up Show forest plot | 1 | 24 | Risk Ratio (M‐H, Random, 95% CI) | 1.57 [0.80, 3.09] |
| 4 Relapse to benzodiazepine use, longest follow‐up Show forest plot | 1 | 24 | Risk Ratio (M‐H, Random, 95% CI) | 0.43 [0.13, 1.39] |
| 5 Anxiety: HAM‐A (Hamilton Anxiety Rating Scale), end of intervention Show forest plot | 1 | 27 | Mean Difference (IV, Random, 95% CI) | ‐0.40 [‐6.47, 5.67] |
| 6 Benzodiazepine withdrawal symptoms, end of intervention Show forest plot | 2 | 56 | Std. Mean Difference (IV, Random, 95% CI) | ‐0.15 [‐0.68, 0.37] |
| 6.1 Physician Withdrawal Checklist | 1 | 27 | Std. Mean Difference (IV, Random, 95% CI) | ‐0.01 [‐0.77, 0.74] |
| 6.2 CIWA‐B (Clinical Institute Withdrawal Assessment Scale ‐ Benzodiazepines) | 1 | 29 | Std. Mean Difference (IV, Random, 95% CI) | ‐0.28 [‐1.01, 0.45] |
| 7 Discontinuation due to adverse events Show forest plot | 1 | 29 | Risk Ratio (M‐H, Random, 95% CI) | 0.0 [0.0, 0.0] |
| 8 Serious adverse events Show forest plot | 1 | 29 | Risk Ratio (M‐H, Random, 95% CI) | 0.0 [0.0, 0.0] |
| Outcome or subgroup title | No. of studies | No. of participants | Statistical method | Effect size |
| 1 Benzodiazepine discontinuation, end of intervention Show forest plot | 3 | 147 | Risk Ratio (M‐H, Random, 95% CI) | 1.33 [0.99, 1.80] |
| 2 Benzodiazepine withdrawal symptoms Show forest plot | 2 | 76 | Std. Mean Difference (IV, Random, 95% CI) | ‐1.14 [‐2.43, 0.16] |
| 2.1 Physician Withdrawal Checklist | 1 | 36 | Std. Mean Difference (IV, Random, 95% CI) | ‐1.82 [‐2.61, ‐1.03] |
| 2.2 Patient Withdrawal Checklist | 1 | 40 | Std. Mean Difference (IV, Random, 95% CI) | ‐0.50 [‐1.13, 0.13] |
| 3 Benzodiazepine discontinuation, longest follow‐up Show forest plot | 1 | 40 | Risk Ratio (M‐H, Random, 95% CI) | 1.41 [0.86, 2.29] |
| 4 Relapse to benzodiazepine use Show forest plot | 1 | 36 | Risk Ratio (M‐H, Random, 95% CI) | 0.33 [0.08, 1.44] |
| 5 Serious adverse events Show forest plot | 1 | 36 | Risk Ratio (M‐H, Random, 95% CI) | 0.0 [0.0, 0.0] |
| 6 Non‐serious adverse events Show forest plot | 1 | 36 | Risk Ratio (M‐H, Random, 95% CI) | 7.0 [0.39, 126.48] |
| 7 Anxiety, HAM‐A Show forest plot | 1 | 36 | Mean Difference (IV, Random, 95% CI) | ‐6.0 [‐9.58, ‐2.42] |
| 8 Discontinuation due to adverse events Show forest plot | 1 | 36 | Risk Ratio (M‐H, Random, 95% CI) | 0.0 [0.0, 0.0] |
| Outcome or subgroup title | No. of studies | No. of participants | Statistical method | Effect size |
| 1 Benzodiazepine discontinuation Show forest plot | 1 | 230 | Risk Ratio (M‐H, Random, 95% CI) | 1.05 [0.86, 1.28] |
| 2 Serious adverse events Show forest plot | 1 | 230 | Risk Ratio (M‐H, Random, 95% CI) | 0.0 [0.0, 0.0] |
| 3 Non‐serious adverse events Show forest plot | 1 | 230 | Risk Ratio (M‐H, Random, 95% CI) | 1.06 [0.75, 1.49] |
| 4 Discontinuation due to adverse events Show forest plot | 1 | 230 | Risk Ratio (M‐H, Random, 95% CI) | 1.38 [0.13, 15.03] |
| Outcome or subgroup title | No. of studies | No. of participants | Statistical method | Effect size |
| 1 Benzodiazepine discontinuation, end of intervention Show forest plot | 1 | 106 | Risk Ratio (M‐H, Random, 95% CI) | 1.44 [0.92, 2.25] |
| 2 Benzodiazepine withdrawal symptoms (Physician Withdrawal Checklist), end of intervention Show forest plot | 1 | 106 | Mean Difference (IV, Random, 95% CI) | ‐3.1 [‐3.51, ‐2.69] |
| 3 Anxiety, HAM‐A, end of intervention Show forest plot | 1 | 106 | Mean Difference (IV, Random, 95% CI) | ‐4.8 [‐5.28, ‐4.32] |
| 4 Serious adverse events Show forest plot | 1 | 106 | Risk Ratio (M‐H, Random, 95% CI) | 0.67 [0.16, 2.85] |
| 5 Non‐serious adverse events Show forest plot | 1 | 106 | Risk Ratio (M‐H, Random, 95% CI) | 1.08 [0.84, 1.40] |
| 6 Discontinuation due to adverse events Show forest plot | 1 | 106 | Risk Ratio (M‐H, Random, 95% CI) | 0.89 [0.31, 2.59] |
| Outcome or subgroup title | No. of studies | No. of participants | Statistical method | Effect size |
| 1 Benzodiazepine withdrawal symptoms, BWSQ (Benzodiazepine Withdrawal Symptom Questionnaire), end of intervention Show forest plot | 1 | 81 | Mean Difference (IV, Random, 95% CI) | 1.00 [‐1.13, ‐0.87] |
| 2 Anxiety, HAM‐A, end of intervention Show forest plot | 1 | 81 | Mean Difference (IV, Random, 95% CI) | ‐5.7 [‐6.05, ‐5.35] |
| 3 Serious adverse events Show forest plot | 1 | 81 | Risk Ratio (M‐H, Random, 95% CI) | 0.0 [0.0, 0.0] |
| 4 Non‐serious adverse events Show forest plot | 1 | 81 | Risk Ratio (M‐H, Random, 95% CI) | 0.0 [0.0, 0.0] |
| Outcome or subgroup title | No. of studies | No. of participants | Statistical method | Effect size |
| 1 Benzodiazepine discontinuation, end of intervention Show forest plot | 3 | 221 | Risk Ratio (M‐H, Random, 95% CI) | 1.45 [0.88, 2.39] |
| 2 Benzodiazepine withdrawal symptoms: BWSQ, end of intervention Show forest plot | 2 | 99 | Mean Difference (IV, Random, 95% CI) | ‐3.57 [‐5.34, ‐1.80] |
| 3 Anxiety: HAM‐A, end of intervention Show forest plot | 2 | 99 | Mean Difference (IV, Random, 95% CI) | ‐6.75 [‐9.64, ‐3.86] |
| 4 Benzodiazepine withdrawal symptoms: BWSQ, longest follow‐up: 6 months Show forest plot | 1 | 54 | Mean Difference (IV, Random, 95% CI) | ‐0.13 [‐4.03, 3.77] |
| 5 Serious adverse events Show forest plot | 2 | 176 | Risk Ratio (M‐H, Random, 95% CI) | 0.0 [0.0, 0.0] |
| 6 Non‐serious adverse events Show forest plot | 1 | 54 | Risk Ratio (M‐H, Random, 95% CI) | 1.33 [0.35, 5.03] |
| Outcome or subgroup title | No. of studies | No. of participants | Statistical method | Effect size |
| 1 Benzodiazepine discontinuation, end of intervention Show forest plot | 2 | 105 | Risk Ratio (M‐H, Random, 95% CI) | 0.82 [0.52, 1.28] |
| 2 Anxiety: HAM‐A (change from baseline), end of intervention Show forest plot | 2 | 66 | Mean Difference (IV, Random, 95% CI) | ‐10.38 [‐25.96, 5.20] |
| 3 Benzodiazepine discontinuation, longest follow‐up Show forest plot | 1 | 47 | Risk Ratio (M‐H, Random, 95% CI) | 2.20 [1.27, 3.82] |
| 4 Benzodiazepine withdrawal symptoms (Physician Withdrawal Checklist), end of intervention Show forest plot | 1 | 38 | Mean Difference (IV, Random, 95% CI) | ‐19.78 [‐20.25, ‐19.31] |
| 5 Relapse to benzodiazepine use, end of intervention Show forest plot | 1 | 36 | Risk Ratio (M‐H, Random, 95% CI) | 2.0 [0.73, 5.47] |
| 6 Discontinuation due to adverse events Show forest plot | 2 | 134 | Risk Ratio (M‐H, Random, 95% CI) | 1.16 [0.42, 3.21] |
| Outcome or subgroup title | No. of studies | No. of participants | Statistical method | Effect size |
| 1 Benzodiazepine discontinuation, end of intervention Show forest plot | 1 | 25 | Risk Ratio (M‐H, Random, 95% CI) | 0.41 [0.17, 0.99] |
| 2 Withdrawal syndrome (clinical diagnosis), end of intervention Show forest plot | 1 | 145 | Risk Ratio (M‐H, Random, 95% CI) | 4.86 [1.12, 21.14] |
| 3 Anxiety, HAM‐A, end of intervention Show forest plot | 2 | 170 | Mean Difference (IV, Random, 95% CI) | ‐1.60 [‐4.64, 1.45] |
| 4 Relapse to benzodiazepine use, end of intervention Show forest plot | 1 | 145 | Risk Ratio (M‐H, Random, 95% CI) | 0.33 [0.09, 1.20] |
| 5 Serious adverse events Show forest plot | 1 | 25 | Risk Ratio (M‐H, Random, 95% CI) | 0.0 [0.0, 0.0] |
| 6 Discontinuation due to adverse events Show forest plot | 1 | 25 | Risk Ratio (M‐H, Random, 95% CI) | 0.46 [0.05, 4.46] |
| Outcome or subgroup title | No. of studies | No. of participants | Statistical method | Effect size |
| 1 Benzodiazepine discontinuation, end of intervention Show forest plot | 4 | 143 | Risk Ratio (M‐H, Random, 95% CI) | 0.82 [0.49, 1.37] |
| 2 Anxiety: HAM‐A/Hospital Anxiety Depression Scale, end of intervention Show forest plot | 2 | 41 | Std. Mean Difference (IV, Random, 95% CI) | 0.18 [‐0.50, 0.86] |
| 3 Benzodiazepine withdrawal symptoms, end of intervention Show forest plot | 1 | 17 | Mean Difference (IV, Random, 95% CI) | 4.69 [‐14.47, 23.85] |
| 4 Benzodiazepine discontinuation, longest follow‐up Show forest plot | 1 | 23 | Risk Ratio (M‐H, Random, 95% CI) | 0.60 [0.34, 1.05] |
| 5 Benzodiazepine withdrawal symptoms, longest follow‐up Show forest plot | 1 | 15 | Mean Difference (IV, Random, 95% CI) | ‐1.34 [‐14.31, 11.63] |
| 6 Anxiety, Hospital Anxiety Depression Scale, longest follow‐up Show forest plot | 1 | 12 | Mean Difference (IV, Random, 95% CI) | 2.75 [‐2.83, 8.33] |
| 7 Discontinuation due to adverse events Show forest plot | 1 | 72 | Risk Ratio (M‐H, Random, 95% CI) | 0.33 [0.01, 7.92] |
| Outcome or subgroup title | No. of studies | No. of participants | Statistical method | Effect size |
| 1 Benzodiazepine discontinuation, end of intervention Show forest plot | 4 | 219 | Risk Ratio (M‐H, Random, 95% CI) | 1.20 [0.73, 1.96] |
| 2 Insomnia Show forest plot | 3 | 150 | Std. Mean Difference (IV, Random, 95% CI) | ‐1.23 [‐2.70, 0.23] |
| 2.1 PSQI (Pittsburgh Sleep Quality Index) global score (higher = worse), end of intervention | 2 | 116 | Std. Mean Difference (IV, Random, 95% CI) | ‐0.31 [‐0.92, 0.31] |
| 2.2 Sleep quality (1 poorest, 10 excellent), end of intervention | 1 | 34 | Std. Mean Difference (IV, Random, 95% CI) | ‐3.34 [‐4.42, ‐2.26] |
| 3 Discontinuation due to adverse events Show forest plot | 2 | 120 | Risk Ratio (M‐H, Random, 95% CI) | 2.10 [0.20, 22.26] |
| 4 Benzodiazepine discontinuation, longest follow‐up Show forest plot | 1 | 38 | Risk Ratio (M‐H, Random, 95% CI) | 1.03 [0.47, 2.27] |
| 5 Adverse events Show forest plot | 1 | 86 | Risk Ratio (M‐H, Random, 95% CI) | 0.97 [0.52, 1.82] |
| 6 Relapse to benzodiazepine use, longest follow‐up Show forest plot | 1 | 38 | Risk Ratio (M‐H, Random, 95% CI) | 1.8 [0.37, 8.68] |
| Outcome or subgroup title | No. of studies | No. of participants | Statistical method | Effect size |
| 1 Benzodiazepine withdrawal symptoms, end of intervention Show forest plot | 3 | 58 | Std. Mean Difference (IV, Random, 95% CI) | ‐0.95 [‐1.71, ‐0.19] |
| 2 Anxiety, HAM‐D (Hamilton Depression Rating Scale), end of intervention Show forest plot | 1 | 18 | Mean Difference (IV, Random, 95% CI) | ‐1.3 [‐2.28, ‐0.32] |
| 3 Benzodiazepine mean dose, end of intervention Show forest plot | 1 | 10 | Mean Difference (IV, Random, 95% CI) | ‐3.70 [‐22.06, 14.66] |
| Outcome or subgroup title | No. of studies | No. of participants | Statistical method | Effect size |
| 1 Relapse to benzodiazepine use, end of intervention: 2 weeks Show forest plot | 1 | 40 | Risk Ratio (M‐H, Random, 95% CI) | 0.64 [0.31, 1.30] |
| Outcome or subgroup title | No. of studies | No. of participants | Statistical method | Effect size |
| 1 Benzodiazepine discontinuation, end of intervention Show forest plot | 1 | 35 | Risk Ratio (M‐H, Random, 95% CI) | 1.15 [0.52, 2.54] |
| 2 Non‐serious adverse events Show forest plot | 1 | 35 | Risk Ratio (M‐H, Random, 95% CI) | 3.13 [1.15, 8.54] |
| Outcome or subgroup title | No. of studies | No. of participants | Statistical method | Effect size |
| 1 Benzodiazepine discontinuation Show forest plot | 1 | 144 | Risk Ratio (M‐H, Random, 95% CI) | 0.80 [0.66, 0.96] |
| 2 Anxiety Show forest plot | 1 | 144 | Mean Difference (IV, Random, 95% CI) | ‐0.80 [‐2.73, 1.13] |
| 3 Relapse to benzodiazepine use Show forest plot | 1 | 144 | Risk Ratio (M‐H, Random, 95% CI) | 0.93 [0.46, 1.87] |
| 4 Non‐serious adverse events Show forest plot | 1 | 144 | Risk Ratio (M‐H, Random, 95% CI) | 0.49 [0.18, 1.35] |
| 5 Discontinuation due to adverse events Show forest plot | 1 | 144 | Risk Ratio (M‐H, Random, 95% CI) | 0.40 [0.13, 1.18] |
| Outcome or subgroup title | No. of studies | No. of participants | Statistical method | Effect size |
| 1 Benzodiazepine discontinuation Show forest plot | 1 | 51 | Risk Ratio (M‐H, Random, 95% CI) | 0.79 [0.36, 1.70] |
| Outcome or subgroup title | No. of studies | No. of participants | Statistical method | Effect size |
| 1 Benzodiazepine discontinuation, end of intervention Show forest plot | 1 | 48 | Risk Ratio (M‐H, Random, 95% CI) | 1.0 [0.78, 1.29] |
| 2 Relapse to benzodiazepine use Show forest plot | 1 | 48 | Risk Ratio (M‐H, Random, 95% CI) | 1.0 [0.28, 3.54] |
| 3 Serious adverse events Show forest plot | 1 | 48 | Risk Ratio (M‐H, Random, 95% CI) | 0.0 [0.0, 0.0] |
| Outcome or subgroup title | No. of studies | No. of participants | Statistical method | Effect size |
| 1 Relapse to benzodiazepine use, longest follow‐up Show forest plot | 1 | 124 | Risk Ratio (M‐H, Random, 95% CI) | 0.33 [0.14, 0.78] |
| 2 Anxiety: Maximum amplitude of rebound (HAM‐A), end of intervention Show forest plot | 1 | 160 | Mean Difference (IV, Random, 95% CI) | 0.50 [‐1.23, 2.23] |
| 3 Discontinuation due to adverse events Show forest plot | 1 | 160 | Risk Ratio (M‐H, Random, 95% CI) | 2.87 [0.79, 10.44] |
| 4 Non‐serious adverse events Show forest plot | 1 | 160 | Risk Ratio (M‐H, Random, 95% CI) | 1.68 [1.01, 2.78] |
| Outcome or subgroup title | No. of studies | No. of participants | Statistical method | Effect size |
| 1 Relapse to benzodiazepine use, longest follow‐up Show forest plot | 1 | 18 | Risk Ratio (M‐H, Random, 95% CI) | 1.05 [0.23, 4.78] |