Intervenciones farmacológicas para la interrupción de benzodiazepinas en usuarios crónicos de benzodiazepinas
Resumen
Antecedentes
El tratamiento prolongado con benzodiazepinas es una práctica frecuente a pesar de las recomendaciones clínicas de su uso a corto plazo. Aproximadamente el 4% de la población general utiliza benzodiazepinas, con mayor prevalencia en los pacientes psiquiátricos y las personas de edad avanzada. Después del uso a largo plazo, a menudo es difícil interrumpir las benzodiazepinas debido a la dependencia psicológica y fisiológica. Esta revisión investigó si las intervenciones farmacológicas pueden facilitar la reducción progresiva del uso de las benzodiazepinas.
Objetivos
Evaluar los efectos beneficiosos y perjudiciales de las intervenciones farmacológicas para facilitar la interrupción del uso crónico de las benzodiazepinas.
Métodos de búsqueda
Se hicieron búsquedas en las siguientes bases de datos electrónicas hasta octubre 2017: registro especializado del Grupo Cochrane de Drogas y Alcohol (Cochrane Drugs and Alcohol Group's Specialised Register of Trials), CENTRAL, PubMed, Embase, CINAHL, y en ISI Web of Science. También se realizaron búsquedas en ClinicalTrials.gov, en el WHO ICTRP, en el registro ISRCTN, y se verificaron las listas de referencias de los estudios incluidos para obtener referencias adicionales de ensayos controlados aleatorios relevantes.
Criterios de selección
Se incluyeron los ensayos controlados aleatorios que compararon tratamiento farmacológico versus placebo o ninguna intervención o versus otra intervención farmacológica en adultos que habían sido tratados con benzodiazepinas durante al menos dos meses o que cumplían los criterios de dependencia a las benzodiazepinas (cualquier criterio).
Obtención y análisis de los datos
Se utilizaron los procedimientos metodológicos estándar previstos por la Colaboración Cochrane.
Resultados principales
Se incluyeron 38 ensayos (que incluyeron 2543 participantes), pero solo se pudieron extraer datos de 35 ensayos con 2295 participantes. Se estudiaron muchas intervenciones diferentes y ninguna se evaluó en más de cuatro ensayos. Se extrajeron los datos en 18 comparaciones diferentes. El riesgo de sesgo fue elevado en todos los ensayos excepto uno. El análisis secuencial de los ensayos mostró imprecisión en todas las comparaciones.
Para la interrupción de las benzodiazepinas, se encontró un posible efecto beneficioso del valproato al final de la intervención (un estudio, 27 participantes; cociente de riesgos [CR] 2,55; intervalo de confianza [IC] del 95%: 1,08 a 6,03; evidencia de muy baja calidad) y de los antidepresivos tricíclicos al seguimiento más largo (un estudio, 47 participantes; CR 2,20; IC del 95%: 1,27 a 3,82; evidencia de baja calidad).
Se encontraron efectos potencialmente positivos de la pregabalina sobre los síntomas de abstinencia de las benzodiazepinas (un estudio, 106 participantes; diferencia de medias [DM] ‐3,10 puntos; IC del 95%: ‐3,51 a ‐2,69; evidencia de muy baja calidad), captodiamo (un estudio, 81 participantes; DM ‐1,00 puntos; IC del 95%: ‐1,13 a ‐0,87; evidencia de muy baja calidad), paroxetina (dos estudios, 99 participantes; DM ‐3,57 puntos; IC del 95%: ‐5,34 a ‐1,80; evidencia de muy baja calidad), antidepresivos tricíclicos (un estudio, 38 participantes; DM ‐19,78 puntos; IC del 95%: ‐20,25 a ‐19,31; evidencia de muy baja calidad), y flumazenil (tres estudios, 58 participantes; diferencia de medias estandarizada ‐0,95; IC del 95%: ‐1,71 a ‐0,19; evidencia de muy baja calidad) al final de la intervención. Sin embargo, el efecto positivo de la paroxetina sobre los síntomas de abstinencia de las benzodiazepinas no persistió hasta el seguimiento más largo (un estudio, 54 participantes; DM ‐0,13 puntos; IC del 95%: ‐4,03 a 3,77; evidencia de muy baja calidad).
Las siguientes intervenciones farmacológicas redujeron los síntomas de ansiedad al final de la intervención: carbamazepina (un estudio, 36 participantes; DM ‐6,00 puntos; IC del 95%: ‐9,58 a ‐2,42; evidencia de muy baja calidad), pregabalina (un estudio, 106 participantes; DM ‐4,80 puntos; IC del 95%: ‐5,28 a ‐4,32; evidencia de muy baja calidad), captodiamo (un estudio, 81 participantes; DM ‐5,70 puntos; IC del 95%: ‐6,05 a ‐5,35; evidencia de muy baja calidad), paroxetina (dos estudios, 99 participantes; DM ‐6,75 puntos; IC del 95%: ‐9,64 a ‐3,86; evidencia de muy baja calidad), y flumazenil (un estudio, 18 participantes; DM ‐1,30 puntos; IC del 95%: ‐2,28 a ‐0,32; evidencia de muy baja calidad).
Dos tratamientos farmacológicos parecieron reducir la proporción de participantes que reincidieron en el uso de benzodiazepinas: valproato (un estudio, 27 participantes; CR 0,31; IC del 95%: 0,11 a 0,90; evidencia de muy baja calidad) y ciamemazina (un estudio, 124 participantes; CR 0,33; IC del 95%: 0,14 a 0,78; evidencia de muy baja calidad). El alpidem redujo la proporción de participantes que interrumpieron las benzodiazepinas (un estudio, 25 participantes; CR 0,41; IC del 95%: 0,17 a 0,99; número necesario a tratar para un resultado perjudicial adicional [NNTD] 2,3 participantes; evidencia de baja calidad) y aumentó la aparición de síndrome de abstinencia (un estudio, 145 participantes; CR 4,86; IC del 95%: 1,12 a 21,14; NNTD 5,9 participantes; evidencia de baja calidad). Asimismo, el aspartato de magnesio redujo la proporción de participantes que interrumpieron las benzodiazepinas (un estudio, 144 participantes; CR 0,80; IC del 95%: 0,66 a 0,96; NNTD 5,8; evidencia de muy baja calidad).
Generalmente, los eventos adversos se informaron de manera deficiente. Específicamente, uno de los ensayos de flumazenil se interrumpió debido a las reacciones severas de pánico.
Conclusiones de los autores
Debido a la calidad baja o muy baja de la evidencia para los resultados informados, y al escaso número de ensayos identificados con un número limitado de participantes en cada comparación, no es posible establecer conclusiones firmes con respecto a las intervenciones farmacológicas para facilitar la interrupción de las benzodiazepinas en los usuarios crónicos de benzodiazepinas. Debido al informe deficiente, no fue posible evaluar los eventos adversos de manera confiable en los ensayos. Se necesitan más ensayos controlados aleatorios con menos riesgo de errores sistemáticos ("sesgo") y de errores aleatorios ("intervención del azar") y un informe mejor y más completo de los resultados clínicos y a largo plazo centrados en los pacientes. Dichos ensayos se deben realizar de manera independiente de la participación de la industria.
PICO
Resumen en términos sencillos
Fármacos para la interrupción del uso crónico de benzodiazepinas
Antecedentes
Las benzodiazepinas se prescriben ampliamente para su uso a largo plazo, a pesar de las recomendaciones de que solo se utilicen a corto plazo. A menudo es difícil interrumpir las benzodiazepinas después de unas pocas semanas de tratamiento debido al desarrollo de dependencia física y psicológica. Esta revisión intentó evaluar el efecto y la seguridad de los fármacos para facilitar la interrupción de las benzodiazepinas en los usuarios crónicos de benzodiazepinas.
Fecha de la búsqueda
La evidencia está actualizada hasta octubre de 2017.
Características de los estudios
Se identificaron 38 ensayos controlados aleatorios que incluyeron 2543 participantes que habían sido tratados durante más de dos meses con benzodiazepinas, o que tenían diagnóstico de dependencia a las benzodiazepinas. Los estudios se incluyeron independientemente de si las benzodiazepinas se prescribieron para la ansiedad, el insomnio u otra afección.
La edad promedio de los participantes fue de alrededor de 50 años, y la mayoría de los participantes fueron mujeres en la mayor parte de los estudios. Veinticuatro ensayos se realizaron en Europa; ocho ensayos en EE. UU. o Canadá; y seis ensayos en Asia. Los ensayos incluyeron una gran variedad de fármacos para facilitar la reducción o la interrupción del uso de las benzodiazepinas. Catorce de los 38 estudios incluidos fueron financiados en parte por el fabricante del fármaco; nueve estudios fueron financiados por agencias gubernamentales; y 15 ensayos no informaron la fuente de financiación. La duración de los ensayos varió entre una y 24 semanas; la duración promedio de los ensayos fue de nueve semanas.
Resultados clave
Se extrajeron los datos sobre 18 comparaciones diferentes en un total de 2295 participantes. No existe seguridad acerca de si el valproato y los antidepresivos tricíclicos aumentan las probabilidades de interrumpir las benzodiazepinas, ni de si los síntomas de abstinencia de las benzodiazepinas se reducen con la pregabalina, el captodiamo, la paroxetina, los antidepresivos tricíclicos y el flumazenil, ya que la calidad de la evidencia se consideró muy baja. No existe seguridad acerca de si los síntomas de la ansiedad después de la abstinencia de las benzodiazepinas se reducen con la carbamazepina, la pregabalina, el captodiamo, la paroxetina y el flumazenil, ya que la calidad de la evidencia se consideró muy baja. Los efectos de los fármacos evaluados fueron muy poco claros para informar la práctica clínica debido al riesgo de sesgo (errores sistemáticos con sobrestimación de los efectos beneficiosos y subestimación de los efectos perjudiciales) y riesgo de aparición por azar (errores aleatorios que proporcionan cualquier resultado). La tolerabilidad y la seguridad se informaron de manera deficiente en los estudios incluidos, lo que hizo imposible evaluar el equilibrio entre los posibles efectos beneficiosos y adversos. Por lo tanto, no es posible establecer conclusiones acerca de la efectividad de las intervenciones.
Calidad de la evidencia
La calidad de la evidencia fue generalmente baja o muy baja debido al escaso número de ensayos, incluido el número limitado de participantes en cada comparación, los resultados diferentes de los estudios, el diseño deficiente de los estudios, y la marcada participación económica de la industria farmacéutica. Por lo tanto, se necesitan ensayos controlados aleatorios sin riesgo de sesgo ni resultados aleatorios significativos que incluyan evaluaciones a largo plazo de los participantes, realizados sin la participación de la industria.
Conclusiones de los autores
Summary of findings
| Valproate compared with placebo or no intervention for benzodiazepine discontinuation in chronic benzodiazepine users | ||||||
| Patient or population: adults who withdraw from chronic benzodiazepine use | ||||||
| Outcomes | Illustrative comparative risks* (95% CI) | Relative effect | No. of participants | Quality of the evidence | Comments | |
| Assumed risk | Corresponding risk | |||||
| Placebo or no intervention | Valproate | |||||
| Benzodiazepine discontinuation, end of intervention | Study population | RR 2.55 | 27 | ⊕⊝⊝⊝ | The required information size of 1918 participants was not met. | |
| 679 per 1000 | 1000 per 1000 | |||||
| Benzodiazepine discontinuation, longest follow‐up | Study population | RR 1.57 | 24 | ⊕⊝⊝⊝ | ||
| 500 per 1000 | 785 per 1000 | |||||
| Benzodiazepine withdrawal symptoms, end of intervention | The mean benzodiazepine withdrawal symptoms in the intervention groups was | 56 | ⊕⊝⊝⊝ | SMD ‐0.15 (‐0.68 to 0.37). As a rule of thumb, 0.2 represents a small effect, 0.5 a moderate effect, and 0.8 a large effect. | ||
| Benzodiazepine withdrawal symptoms, longest follow‐up | Not estimable | ‐ | (0 study) | No included study measured this outcome. | ||
| *The basis for the assumed risk (e.g. the median control group risk across studies) is provided in footnotes. The corresponding risk (and its 95% confidence interval) is based on the assumed risk in the comparison group and the relative effect of the intervention (and its 95% CI). | ||||||
| GRADE Working Group grades of evidence | ||||||
| 1No details provided regarding random sequence generation, allocation concealment, and blinding, leading to unclear risk of selection bias, performance and detection bias (downgraded one level). | ||||||
| Carbamazepine compared with placebo for benzodiazepine discontinuation in chronic benzodiazepine users | ||||||
| Patient or population: adults who withdraw from chronic benzodiazepine use | ||||||
| Outcomes | Illustrative comparative risks* (95% CI) | Relative effect | No. of participants | Quality of the evidence | Comments | |
| Assumed risk | Corresponding risk | |||||
| Placebo | Carbamazepine | |||||
| Benzodiazepine discontinuation, end of intervention | Study population | RR 1.33 | 147 | ⊕⊕⊝⊝ | Trial Sequential Analysis showed that only 7.0% of the required information size (2109) was reached, indicating that insufficient information has been obtained. | |
| 480 per 1000 | 638 per 1000 | |||||
| Benzodiazepine discontinuation, longest follow‐up | Study population | RR 1.41 | 40 | ⊕⊝⊝⊝ | ||
| 524 per 1000 | 739 per 1000 | |||||
| Benzodiazepine withdrawal symptoms, end of intervention | The mean benzodiazepine withdrawal symptoms in the intervention groups was | 76 | ⊕⊝⊝⊝ | SMD ‐1.14 (‐2.43 to 0.16). As a rule of thumb, 0.2 represents a small effect, 0.5 a moderate effect, and 0.8 a large effect. | ||
| Benzodiazepine withdrawal symptoms, longest follow‐up | Not estimable | ‐ | (0 study) | No included study measured this outcome. | ||
| *The basis for the assumed risk (e.g. the median control group risk across studies) is provided in footnotes. The corresponding risk (and its 95% confidence interval) is based on the assumed risk in the comparison group and the relative effect of the intervention (and its 95% CI). | ||||||
| GRADE Working Group grades of evidence | ||||||
| 1Unclear risk of selection bias. One study with high risk of attrition, reporting, and other bias (downgraded one level). | ||||||
| Lithium compared with placebo for benzodiazepine discontinuation in chronic benzodiazepine users | ||||||
| Patient or population: adults who withdraw from chronic benzodiazepine use | ||||||
| Outcomes | Illustrative comparative risks* (95% CI) | Relative effect | No. of participants | Quality of the evidence | Comments | |
| Assumed risk | Corresponding risk | |||||
| Placebo | Lithium | |||||
| Benzodiazepine discontinuation, end of intervention | Study population | RR 1.05 | 230 | ⊕⊕⊝⊝ | The required information size of 1918 participants was not met. | |
| 617 per 1000 | 648 per 1000 | |||||
| Benzodiazepine discontinuation, longest follow‐up | Not estimable | ‐ | ‐ | (0 study) | ‐ | No included studies measured this outcome. |
| Benzodiazepine withdrawal symptoms, end of intervention | Not estimable | ‐ | ‐ | (0 study) | ‐ | No included studies measured this outcome. |
| Benzodiazepine withdrawal symptoms, longest follow‐up | Not estimable | ‐ | ‐ | (0 study) | ‐ | No included study measured this outcome. |
| *The basis for the assumed risk (e.g. the median control group risk across studies) is provided in footnotes. The corresponding risk (and its 95% confidence interval) is based on the assumed risk in the comparison group and the relative effect of the intervention (and its 95% CI). | ||||||
| GRADE Working Group grades of evidence | ||||||
| 1Unclear risk of selection, attrition, and reporting bias (downgraded one level). | ||||||
| Pregabalin compared with placebo for benzodiazepine discontinuation in chronic benzodiazepine users | ||||||
| Patient or population: adults who withdraw from chronic benzodiazepine use | ||||||
| Outcomes | Illustrative comparative risks* (95% CI) | Relative effect | No. of participants | Quality of the evidence | Comments | |
| Assumed risk | Corresponding risk | |||||
| Placebo | Pregabalin | |||||
| Benzodiazepine discontinuation, end of intervention | Study population | RR 1.44 | 106 | ⊕⊝⊝⊝ | The required information size of 1918 participants was not met. | |
| 360 per 1000 | 518 per 1000 | |||||
| Benzodiazepine discontinuation, longest follow‐up | Not estimable | ‐ | ‐ | (0 study) | ‐ | No included studies measured this outcome. |
| Benzodiazepine withdrawal symptoms, Physician Withdrawal Checklist (PWCL), end of intervention | ‐ | The mean benzodiazepine withdrawal symptoms, PWCL, end of intervention in the intervention group was | ‐ | 106 | ⊕⊝⊝⊝ | MD ‐3.10 (‐3.51 to ‐2.69) |
| Benzodiazepine withdrawal symptoms, longest follow‐up | Not estimable | ‐ | ‐ | (0 study) | ‐ | No included study measured this outcome. |
| *The basis for the assumed risk (e.g. the median control group risk across studies) is provided in footnotes. The corresponding risk (and its 95% confidence interval) is based on the assumed risk in the comparison group and the relative effect of the intervention (and its 95% CI). | ||||||
| GRADE Working Group grades of evidence | ||||||
| 1Unclear risk of selection bias and high risk of attrition and other bias (downgraded two levels). | ||||||
| Captodiame compared with placebo for benzodiazepine discontinuation in chronic benzodiazepine users | ||||||
| Patient or population: adults who withdraw from chronic benzodiazepine use | ||||||
| Outcomes | Illustrative comparative risks* (95% CI) | Relative effect | No. of participants | Quality of the evidence | Comments | |
| Assumed risk | Corresponding risk | |||||
| Placebo | Captodiame | |||||
| Benzodiazepine discontinuation, end of intervention | Not estimable | ‐ | ‐ | (0 study) | ‐ | No included studies measured this outcome. |
| Benzodiazepine discontinuation, longest follow‐up | Not estimable | ‐ | ‐ | (0 study) | ‐ | No included studies measured this outcome. |
| Benzodiazepine withdrawal symptoms, Benzodiazepine Withdrawal Symptom Questionnaire (BWSQ), end of intervention | ‐ | The mean benzodiazepine withdrawal symptoms, BWSQ, end of intervention in the intervention group was | ‐ | 81 | ⊕⊝⊝⊝ | MD ‐1.00 (‐1.13 to ‐0.87) The required information size of 229 participants was not met. |
| Benzodiazepine withdrawal symptoms, longest follow‐up | Not estimable | ‐ | ‐ | (0 study) | ‐ | No included study measured this outcome. |
| *The basis for the assumed risk (e.g. the median control group risk across studies) is provided in footnotes. The corresponding risk (and its 95% confidence interval) is based on the assumed risk in the comparison group and the relative effect of the intervention (and its 95% CI). | ||||||
| GRADE Working Group grades of evidence | ||||||
| 1Unclear risk of selection and reporting bias. High risk of other bias (downgraded one level). | ||||||
| Paroxetine compared with placebo or no intervention for benzodiazepine discontinuation in chronic benzodiazepine users | ||||||
| Patient or population: adults who withdraw from chronic benzodiazepine use | ||||||
| Outcomes | Illustrative comparative risks* (95% CI) | Relative effect | No. of participants | Quality of the evidence | Comments | |
| Assumed risk | Corresponding risk | |||||
| Placebo or Control | Paroxetine | |||||
| Benzodiazepine discontinuation, end of intervention | Study population | RR 1.45 | 221 | ⊕⊝⊝⊝ | Trial Sequential Analysis showed that only 2.34% of the required information size (9448) was reached, indicating that insufficient information has been obtained. | |
| 504 per 1000 | 731 per 1000 | |||||
| Benzodiazepine discontinuation, longest follow‐up | Not estimable | ‐ | (0 study) | ‐ | No included study measured this outcome. | |
| Benzodiazepine withdrawal symptoms, BWSQ, end of intervention | ‐ | The mean benzodiazepine withdrawal symptoms, BWSQ, end of intervention in the intervention groups was | ‐ | 99 | ⊕⊝⊝⊝ | MD ‐3.57 (‐5.34 to ‐1.8). Trial Sequential Analysis showed that the required information size of 229 participants was not reached. However, the alpha‐spending boundaries for benefit were crossed, indicating that sufficient information was obtained, and the result was not due to random error. |
| Benzodiazepine withdrawal symptoms, BWSQ, longest follow‐up: 6 months | ‐ | The mean benzodiazepine withdrawal symptoms, BWSQ, longest follow‐up: 6 months in the intervention group was | ‐ | 54 | ⊕⊝⊝⊝ | MD ‐0.13 (‐4.03 to 3.77) |
| *The basis for the assumed risk (e.g. the median control group risk across studies) is provided in footnotes. The corresponding risk (and its 95% confidence interval) is based on the assumed risk in the comparison group and the relative effect of the intervention (and its 95% CI). | ||||||
| GRADE Working Group grades of evidence | ||||||
| 1Unclear risk of selection and attrition bias. High risk of performance, detection, reporting, and other bias (downgraded two levels). | ||||||
| Tricyclic antidepressants compared with placebo for benzodiazepine discontinuation in chronic benzodiazepine users | ||||||
| Patient or population: adults who withdraw from chronic benzodiazepine use | ||||||
| Outcomes | Illustrative comparative risks* (95% CI) | Relative effect | No. of participants | Quality of the evidence | Comments | |
| Assumed risk | Corresponding risk | |||||
| Placebo | Tricyclic antidepressants | |||||
| Benzodiazepine discontinuation, end of intervention | Study population | RR 0.82 | 105 | ⊕⊝⊝⊝ | Trial Sequential Analysis showed that only 7.82% of the required information size (1343) was reached, indicating that insufficient information has been obtained. | |
| 451 per 1000 | 370 per 1000 | |||||
| Benzodiazepine discontinuation, longest follow‐up | Study population | RR 2.2 | 47 | ⊕⊕⊝⊝ | ||
| 375 per 1000 | 825 per 1000 | |||||
| Benzodiazepine withdrawal symptoms, Physician Withdrawal Checklist, end of intervention | ‐ | The mean benzodiazepine withdrawal symptoms in the intervention group was | ‐ | 38 (1 study) | ⊕⊝⊝⊝ | MD ‐19.78 (‐20.25 to ‐19.31) |
| Benzodiazepine withdrawal symptoms, longest follow‐up | Not estimable | ‐ | ‐ | (0 study) | ‐ | No included study measured this outcome. |
| *The basis for the assumed risk (e.g. the median control group risk across studies) is provided in footnotes. The corresponding risk (and its 95% confidence interval) is based on the assumed risk in the comparison group and the relative effect of the intervention (and its 95% CI). | ||||||
| GRADE Working Group grades of evidence | ||||||
| 1Unclear risk of selection bias and high risk of attrition and other bias (downgraded one level). | ||||||
| Alpidem compared with placebo for benzodiazepine discontinuation in chronic benzodiazepine users | ||||||
| Patient or population: adults who withdraw from chronic benzodiazepine use | ||||||
| Outcomes | Illustrative comparative risks* (95% CI) | Relative effect | No. of participants | Quality of the evidence | Comments | |
| Assumed risk | Corresponding risk | |||||
| Placebo | Alpidem | |||||
| Benzodiazepine discontinuation, end of intervention | Study population | RR 0.41 | 25 | ⊕⊕⊝⊝ | The required information size of 1918 participants was not met. | |
| 750 per 1000 | 308 per 1000 | |||||
| Benzodiazepine discontinuation, longest follow‐up | Not estimable | ‐ | ‐ | (0 study) | ‐ | No included study measured this outcome. |
| Withdrawal syndrome (clinical diagnosis), end of intervention | Study population | RR 4.86 | 145 | ⊕⊝⊝⊝ | ||
| 29 per 1000 | 143 per 1000 | |||||
| Benzodiazepine withdrawal symptoms, longest follow‐up | Not estimable | ‐ | ‐ | (0 study) | ‐ | No included study measured this outcome. |
| *The basis for the assumed risk (e.g. the median control group risk across studies) is provided in footnotes. The corresponding risk (and its 95% confidence interval) is based on the assumed risk in the comparison group and the relative effect of the intervention (and its 95% CI). | ||||||
| GRADE Working Group grades of evidence | ||||||
| 1Required information size not met (downgraded two levels due to imprecision). 3Unclear risk of selection and other bias, high risk of attrition bias (downgraded one level) | ||||||
| Buspirone compared with placebo for benzodiazepine discontinuation in chronic benzodiazepine users | ||||||
| Patient or population: adults who withdraw from chronic benzodiazepine use | ||||||
| Outcomes | Illustrative comparative risks* (95% CI) | Relative effect | No. of participants | Quality of the evidence | Comments | |
| Assumed risk | Corresponding risk | |||||
| Placebo | Buspirone | |||||
| Benzodiazepine discontinuation, end of intervention | Study population | RR 0.82 | 143 | ⊕⊕⊝⊝ | Trial Sequential Analysis showed that only 4.23% of the required information size (3381) was reached, indicating that insufficient information has been obtained. | |
| 563 per 1000 | 462 per 1000 | |||||
| Benzodiazepine discontinuation, longest follow‐up | Study population | RR 0.60 | 23 | ⊕⊕⊝⊝ | ||
| 917 per 1000 | 550 per 1000 | |||||
| Benzodiazepine withdrawal symptoms, end of intervention | ‐ | The mean benzodiazepine withdrawal symptoms, end of intervention in the intervention groups was | ‐ | 17 | ⊕⊝⊝⊝ | MD 4.69 (‐14.47 to 23.87) |
| Benzodiazepine withdrawal symptoms, longest follow‐up | ‐ | The mean benzodiazepine withdrawal symptoms, longest follow‐up in the intervention groups was | ‐ | 15 | ⊕⊝⊝⊝ | MD ‐1.34 (‐14.31 to 11.63) |
| *The basis for the assumed risk (e.g. the median control group risk across studies) is provided in footnotes. The corresponding risk (and its 95% confidence interval) is based on the assumed risk in the comparison group and the relative effect of the intervention (and its 95% CI). | ||||||
| GRADE Working Group grades of evidence | ||||||
| 1Unclear risk of selection, performance, and reporting bias. High risk of attrition and other bias (downgraded one level). | ||||||
| Melatonin compared with placebo for benzodiazepine discontinuation in chronic benzodiazepine users | ||||||
| Patient or population: adults who withdraw from chronic benzodiazepine use | ||||||
| Outcomes | Illustrative comparative risks* (95% CI) | Relative effect | No. of participants | Quality of the evidence | Comments | |
| Assumed risk | Corresponding risk | |||||
| Placebo | Melatonin | |||||
| Benzodiazepine discontinuation, end of intervention | Study population | RR 1.20 | 219 | ⊕⊝⊝⊝ | Trial Sequential Analysis showed that only 6.37% of the required information size (3438) was reached, indicating that insufficient information has been obtained. | |
| 417 per 1000 | 500 per 1000 | |||||
| Benzodiazepine discontinuation, longest follow‐up | Study population | RR 1.03 | 38 | ⊕⊝⊝⊝ | ||
| 389 per 1000 | 401 per 1000 | |||||
| Benzodiazpine withdrawal symptoms, end of intervention | Not estimable | ‐ | ‐ | (0 study) | ‐ | No included study measured this outcome. |
| Benzodiazepine withdrawal symptoms, longest follow‐up | Not estimable | ‐ | ‐ | (0 study) | ‐ | No included study measured this outcome. |
| *The basis for the assumed risk (e.g. the median control group risk across studies) is provided in footnotes. The corresponding risk (and its 95% confidence interval) is based on the assumed risk in the comparison group and the relative effect of the intervention (and its 95% CI). | ||||||
| GRADE Working Group grades of evidence | ||||||
| 1Unclear risk of selection, attrition, and reporting bias. High risk of other bias (downgraded one level). | ||||||
| Flumazenil compared with placebo for benzodiazepine discontinuation in chronic benzodiazepine users | ||||||
| Patient or population: adults who withdraw from chronic benzodiazepine use | ||||||
| Outcomes | Illustrative comparative risks* (95% CI) | Relative effect | No. of participants | Quality of the evidence | Comments | |
| Assumed risk | Corresponding risk | |||||
| Placebo | Flumazenil | |||||
| Benzodiazepine discontinuation, end of intervention | Not estimable | ‐ | ‐ | (0 study) | ‐ | No included study measured this outcome. |
| Benzodiazepine discontinuation, longest follow‐up | Not estimable | ‐ | ‐ | (0 study) | ‐ | No included study measured this outcome. |
| Benzodiazepine withdrawal symptoms, end of intervention | ‐ | The mean benzodiazepine withdrawal symptoms, end of intervention in the intervention groups was | ‐ | 58 | ⊕⊝⊝⊝ | SMD ‐0.95 (‐1.71 to ‐0.19) As a rule of thumb, 0.2 represents a small effect, 0.5 a moderate effect, and 0.8 a large effect. |
| Benzodiazepine withdrawal symptoms, longest follow‐up | Not estimable | ‐ | ‐ | (0 study) | ‐ | No included study measured this outcome. |
| *The basis for the assumed risk (e.g. the median control group risk across studies) is provided in footnotes. The corresponding risk (and its 95% confidence interval) is based on the assumed risk in the comparison group and the relative effect of the intervention (and its 95% CI). | ||||||
| GRADE Working Group grades of evidence | ||||||
| 1Unclear risk of selection bias and high risk of performance, detection, and other bias (downgraded one level). | ||||||
| Progesterone compared with placebo for benzodiazepine discontinuation in chronic benzodiazepine users | ||||||
| Patient or population: adults who withdraw from chronic benzodiazepine use | ||||||
| Outcomes | Illustrative comparative risks* (95% CI) | Relative effect | No. of participants | Quality of the evidence | Comments | |
| Assumed risk | Corresponding risk | |||||
| Placebo | Progesterone | |||||
| Benzodiazepine discontinuation, end of intervention | Study population | RR 1.15 | 35 | ⊕⊝⊝⊝ | The required information size of 1918 participants was not met. | |
| 417 per 1000 | 479 per 1000 | |||||
| Benzodiazepine discontinuation, longest follow‐up | Not estimable | ‐ | ‐ | (0 study) | ‐ | No included study measured this outcome. |
| Benzodiazepine withdrawal symptoms, end of intervention | Not estimable | ‐ | ‐ | (0 study) | ‐ | No included study measured this outcome. |
| Benzodiazepine withdrawal symptoms, longest follow‐up | Not estimable | ‐ | ‐ | (0 study) | ‐ | No included study measured this outcome. |
| *The basis for the assumed risk (e.g. the median control group risk across studies) is provided in footnotes. The corresponding risk (and its 95% confidence interval) is based on the assumed risk in the comparison group and the relative effect of the intervention (and its 95% CI). | ||||||
| GRADE Working Group grades of evidence | ||||||
| 1Unclear risk of selection and attrition bias (downgraded one level). | ||||||
| Magnesium aspartate compared with placebo for benzodiazepine discontinuation in chronic benzodiazepine users | ||||||
| Patient or population: adults who withdraw from chronic benzodiazepine use | ||||||
| Outcomes | Illustrative comparative risks* (95% CI) | Relative effect | No. of participants | Quality of the evidence | Comments | |
| Assumed risk | Corresponding risk | |||||
| Placebo | Magnesium aspartate | |||||
| Benzodiazepine discontinuation, end of intervention | Study population | RR 0.80 | 144 | ⊕⊝⊝⊝ | The required information size of 1918 participants was not met. | |
| 853 per 1000 | 683 per 1000 | |||||
| Benzodiazepine discontinuation, longest follow‐up | Not estimable | ‐ | ‐ | (0 study) | ‐ | No included study measured this outcome. |
| Benzodiazepine withdrawal symptoms, end of intervention | Not estimable | ‐ | ‐ | (0 study) | ‐ | No included study measured this outcome. |
| Benzodiazepine withdrawal symptoms, longest follow‐up | Not estimable | ‐ | ‐ | (0 study) | ‐ | No included study measured this outcome. |
| *The basis for the assumed risk (e.g. the median control group risk across studies) is provided in footnotes. The corresponding risk (and its 95% confidence interval) is based on the assumed risk in the comparison group and the relative effect of the intervention (and its 95% CI). | ||||||
| GRADE Working Group grades of evidence | ||||||
| 1Unclear risk of selection, detection, and attrition bias (downgraded one level). | ||||||
| Homéogène 46/Sedatif PC (homeopathic drugs) compared with placebo for benzodiazepine discontinuation in chronic benzodiazepine users | ||||||
| Patient or population: adults who withdraw from chronic benzodiazepine use | ||||||
| Outcomes | Illustrative comparative risks* (95% CI) | Relative effect | No. of participants | Quality of the evidence | Comments | |
| Assumed risk | Corresponding risk | |||||
| Placebo | Homéogène 46/Sedatif PC (homeopathic drugs) | |||||
| Benzodiazepine discontinuation, end of intervention | Study population | RR 0.79 | 51 | ⊕⊝⊝⊝ | The required information size was not met. | |
| 381 per 1000 | 301 per 1000 | |||||
| Benzodiazepine discontinuation, longest follow‐up | Not estimable | ‐ | ‐ | (0 study) | ‐ | No included study measured this outcome. |
| Benzodiazepine withdrawal symptoms, end of intervention | Not estimable | ‐ | ‐ | (0 study) | ‐ | No included study measured this outcome. |
| Benzodiazepine withdrawal symptoms, longest follow‐up | Not estimable | ‐ | ‐ | (0 study) | ‐ | No included study measured this outcome. |
| *The basis for the assumed risk (e.g. the median control group risk across studies) is provided in footnotes. The corresponding risk (and its 95% confidence interval) is based on the assumed risk in the comparison group and the relative effect of the intervention (and its 95% CI). | ||||||
| GRADE Working Group grades of evidence | ||||||
| 1Unclear risk of selection, attrition, and other bias (downgraded one level). | ||||||
| Carbamazepine compared with tricyclic antidepressant for benzodiazepine discontinuation in chronic benzodiazepine users | ||||||
| Patient or population: adults who withdraw from chronic benzodiazepine use | ||||||
| Outcomes | Illustrative comparative risks* (95% CI) | Relative effect | No. of participants | Quality of the evidence | Comments | |
| Assumed risk | Corresponding risk | |||||
| Tricyclic antidepressant | Carbamazepine | |||||
| Benzodiazepine discontinuation, end of intervention | Study population | RR 1.00 | 48 | ⊕⊕⊝⊝ | The required information size was not met. | |
| 833 per 1000 | 833 per 1000 | |||||
| Benzodiazepine discontinuation, longest follow‐up | Not estimable | ‐ | ‐ | (0 study) | ‐ | No included study measured this outcome. |
| Benzodiazepine withdrawal symptoms, end of intervention | Not estimable | ‐ | ‐ | (0 study) | ‐ | No included study measured this outcome. |
| Benzodiazepine withdrawal symptoms, longest follow‐up | Not estimable | ‐ | ‐ | (0 study) | ‐ | No included study measured this outcome. |
| *The basis for the assumed risk (e.g. the median control group risk across studies) is provided in footnotes. The corresponding risk (and its 95% confidence interval) is based on the assumed risk in the comparison group and the relative effect of the intervention (and its 95% CI). | ||||||
| GRADE Working Group grades of evidence | ||||||
| 1Unclear risk of selection, detection, and attrition bias (downgraded one level). | ||||||
Antecedentes
Descripción de la afección
Las benzodiazepinas se prescriben ampliamente y su consumo aún es alto, a pesar de una disminución general moderada durante las dos últimas décadas (Islam 2014; Tsimtsiou 2009). Una encuesta nacional de los EE.UU. indicó una prevalencia del consumo de benzodiazepinas del 3,8% entre los adultos no institucionalizados (Paulose‐Ram 2007), y la prevalencia se acercó al 8% en una encuesta holandesa en personas de edad avanzada (Sonnenberg 2012). Otra encuesta de los EE.UU. mostró un aumento del porcentaje de adultos que completaron una prescripción de benzodiazepina del 4,1% 1996 al 5,6% en 2013 (Bachhuber 2016). Una encuesta en un ámbito de pacientes psiquiátricos ambulatorios de Nueva Zelanda documentó que a un tercio de los pacientes se les prescribieron benzodiazepinas o fármacos similares a las benzodiazepinas, y la mayoría de las prescripciones fueron a largo plazo (Huthwaite 2013).
Las benzodiazepinas se indican para el tratamiento a corto plazo de la ansiedad y el insomnio, pero las prescripciones se suelen prolongar debido al desarrollo de dependencia y a la falta de conocimiento del tratamiento no farmacológico de la ansiedad, el insomnio y síntomas similares (Ashton 2005; Huthwaite 2013; O'Brien 2005). Se recomienda la reducción gradual de la dosis de benzodiazepinas, en lugar de la interrupción abrupta, para disminuir los síntomas de abstinencia, incluido el riesgo de crisis convulsivas por abstinencia (Dell'osso 2013). La importancia del ajuste individual de la tasa de abstinencia se recalca en las guías de práctica clínica. La tasa de abstinencia ajustada de manera individual debe incluir la consideración del tipo y la dosis de benzodiazepina, el motivo original de la prescripción, los estresantes ambientales y la cantidad de apoyo disponible (Ashton 2005). Por lo tanto, la duración de la reducción gradual en ocasiones se prolonga durante meses o años; sin embargo, las tasas de reducción gradual muy lentas no parecen ser superiores a los regímenes más rápidos de reducción gradual (Parr 2009). Los síntomas de abstinencia se pueden manifestar de manera física (p.ej. molestias pseudogripales, calambres musculares) y psicológica (p.ej. irritabilidad, insomnio, cambios en la percepción, ansiedad, despersonalización, sensación de irrealidad) (Baldwin 2013). Por lo tanto, los síntomas de abstinencia a menudo se asemejan a los síntomas que dieron lugar a la prescripción inicial de las benzodiazepina , lo que da lugar erróneamente a que los pacientes y los cuidadores supongan que se requiere continuar la prescripción. Por lo tanto, la interrupción se complica por una combinación de los síntomas de abstinencia y los síntomas originales, que podrían recurrir de una manera exagerada (síntomas de rebote). Las intervenciones psicológicas (p.ej. entrenamiento de relajación, psicoeducación) para el control de los síntomas de rebote son superiores a la reducción gradual de la dosis sola en los pacientes en ámbitos de atención primaria (Parr 2009). Las reacciones adversas asociadas con el tratamiento con benzodiazepinas incluyen el deterioro cognitivo (Barker 2004; Glass 2005), el deterioro psicomotor con aumento del riesgo de caídas, Woolcott 2009 y los accidentes (Smink 2010), la sedación diurna (Glass 2005) y un aumento del riesgo de demencia (Billioti 2012; Gallacher 2012; Wu 2009). Aunque las benzodiazepinas mejoran inicialmente los parámetros de continuidad del sueño (p.ej. latencia del sueño, tiempo total de sueño) (Buscemi 2007a), los fármacos reducen la cantidad de sueño profundo (Parrino 1996), por lo que tienen un efecto negativo sobre la arquitectura general del sueño. Además, el desarrollo de tolerancia a los efectos sedantes implica que la dosis original del fármaco tiene progresivamente menos efecto, y se necesitan dosis mayores para obtener el efecto deseado (Vinkers 2012). Otra inquietud asociada con el uso prolongado de las benzodiazepinas es el aumento de la mortalidad informado en varios estudios observacionales (Bachhuber 2016; Kripke 1998; Kripke 2012; Mallon 2009; Weich 2014). Sin embargo, este tema es polémico debido a los resultados contradictorios (Gisev 2011; Hausken 2007; Jaussent 2013) y a la falta de control apropiado de los factores de confusión en muchos de los estudios que muestran un aumento de la mortalidad (Kripke 1998; Kripke 2012; Mallon 2009).
La mayoría de las prescripciones de benzodiazepinas ocurre en la práctica general, en la que las siguientes características se asocian con un mayor riesgo de uso a largo plazo: comorbilidad psiquiátrica, edad avanzada, menor nivel cultural, pacientes solitarios y comportamientos más evasivos con respecto al afrontamiento (Zandstra 2004). En las edades avanzadas, las tasas de prescripción de benzodiazepinas son especialmente altas, y en esta población las prescripciones se asocian con sexo femenino, bajo nivel cultural, ingresos bajos, enfermedades físicas crónicas, limitaciones funcionales, deterioro cognitivo, depresión, ansiedad e insomnio (Sonnenberg 2012). En los usuarios de opiáceos, el uso adicional de benzodiazepinas se asocia con mayor riesgo de reacciones adversas y sobredosis debido a la depresión del sistema nervioso central producida por ambos tipos de fármacos, en particular en combinación con la ingesta de alcohol (Jones 2014). El uso de los opiáceos ha aumentado, especialmente en los EE.UU., como analgésicos para los pacientes con dolor crónico y como consumo de drogas ilícitas (Manchikanti 2008; Manchikanti 2012). Por lo tanto, el tratamiento de la dependencia a las benzodiazepinas en las subpoblaciones que consumen sustancias de manera concomitante, incluidos los opiáceos, merece atención.
Descripción de la intervención
Actualmente no se recomienda ni se ha aprobado fármaco alguno para el tratamiento de la dependencia a las benzodiazepinas, ni para facilitar la abstinencia después del uso a largo plazo. Teóricamente, un fármaco puede facilitar la interrupción de las benzodiazepinas de varias maneras: al aliviar los síntomas físicos de abstinencia (p.ej. el propranolol para reducir el temblor y la taquicardia); al reducir la necesidad psicológica imperiosa (es decir, administración de fármacos sedantes no benzodiazepínicos); o al tratar el insomnio o los síntomas de ansiedad subyacentes (p.ej. melatonina, buspirona, imipramina). Los antiepilépticos y los antidepresivos se encuentran entre los fármacos evaluados con mayor frecuencia, pero con resultados contradictorios (Parr 2009; Voshaar 2006). También se ha investigado la interrupción abrupta del tratamiento con benzodiazepinas seguida de la administración de flumazenil (un antagonista del receptor de las benzodiazepinas) (Gerra 2002), pero la factibilidad de este enfoque es limitada porque la preparación se administra por vía intravenosa y necesita de monitorización médica continua. Una intervención para facilitar la interrupción de las benzodiazepinas se puede administrar con la intención de 1) interrumpir la benzodiazepina y posteriormente interrumpir el fármaco experimental, o 2) sustituir el tratamiento en curso con benzodiazepinas, es decir, reemplazar el tratamiento con benzodiazepinas con otro fármaco temporal o crónico con un perfil de reacciones adversas más favorable.
De qué manera podría funcionar la intervención
Una revisión Cochrane incluyó bibliografía de las intervenciones farmacológica investigadas hasta octubre de 2004 para el tratamiento de la monodependencia a las benzodiazepinas en el ámbito ambulatorio (Denis 2006). La conclusión fue que la reducción gradual fue preferible a la interrupción abrupta y que la carbamazepina, pero no otros compuestos investigados, podría ser una intervención efectiva para la interrupción gradual de las benzodiazepinas. Sin embargo, la evidencia no fue suficientemente sólida para guiar la recomendación clínica. Un metanálisis que incluyó ámbitos hospitalarios y ambulatorios informó que el aumento de los programas de interrupción guiados con imipramina fue más efectivo que la interrupción guiada sola (Voshaar 2006). Otra revisión sistemática de enfoques para la interrupción de las benzodiazepinas en ámbitos de práctica general y ambulatoria publicada en 2009 no apoyó las farmacoterapias substitutas para ayudar a la interrupción de las benzodiazepinas (Parr 2009). Se ha encontrado que las intervenciones psicológicas son superiores a la reducción gradual de la dosis (Parr 2009; Voshaar 2006) y son el tema de otra revisión Cochrane publicada recientemente (Darker 2015).
Las intervenciones farmacológicas investigadas hasta el momento han tratado de abordar la farmacología de las benzodiazepinas, por lo que en teoría han tratado de contrarrestar los síntomas de abstinencia o tratar los nuevos episodios de insomnio y ansiedad. En este sentido, la carbamazepina ha sido uno de los fármacos más promisorios hasta el presente (Denis 2006), pero existen otros fármacos accesibles como la melatonina para contrarrestar el insomnio desarrollado como parte del síndrome de abstinencia (Garfinkel 1999), o la pregabalina para reducir los síntomas de ansiedad general que surgen o empeoran durante la abstinencia de las benzodiazepinas (Hadley 2012).
Por qué es importante realizar esta revisión
En general el uso de benzodiazepinas a largo plazo no es apropiado debido a las reacciones adversas (p.ej. deterioro del funcionamiento psicomotor y cognitivo) y los riesgos de desarrollar dependencia y adicción. A menudo las reacciones adversas molestas complican los intentos de abstinencia, por lo que es importante evaluar si cualquier intervención farmacológica puede facilitar la abstinencia o la interrupción de las benzodiazepinas. Lo anterior podría disminuir potencialmente los costos individuales y sociales asociados con los regímenes de abstinencia a menudo extensos y prolongados. Desde que se realizaron las revisiones anteriores (Denis 2006; Parr 2009; Voshaar 2006), se han publicado nuevos estudios que investigaron cómo facilitar la interrupción de las benzodiazepinas, por lo que se justifica una nueva revisión sistemática.
Objetivos
Evaluar los efectos beneficiosos y perjudiciales de las intervenciones farmacológicas para facilitar la interrupción del uso crónico de las benzodiazepinas.
Métodos
Criterios de inclusión de estudios para esta revisión
Tipos de estudios
Se incluyeron los ensayos controlados aleatorios relevantes independientemente del tipo, la fecha, el idioma y el estado de publicación. No se incluyeron los estudios clínicos cuasialeatorios ni los estudios observacionales. Al tomar esta decisión se tuvo muy en cuenta que la revisión se centraría más en los efectos beneficiosos potenciales y menos en los efectos perjudiciales potenciales, ya que en los ensayos controlados aleatorios se subestiman los eventos adversos poco frecuentes que se desarrollan solo después de la exposición a largo plazo.
Tipos de participantes
Usuarios crónicos de benzodiazepinas adultos (18 años de edad o más), definidos como uso diario de benzodiazepinas durante al menos dos meses; o pacientes con diagnóstico de dependencia a las benzodiazepinas mediante cualquier criterio diagnóstico (p.ej. International Classification of Diseases (ICD)‐10: F13.1 o F13.2). También se incluyeron los participantes con comorbilidades psiquiátricas o somáticas. Las benzodiazepinas en esta revisión incluyeron los compuestos similares a las benzodiazepinas (llamados en ocasiones fármacos Z, p.ej. zolpidem y zopiclona).
Tipos de intervenciones
Intervención experimental
La intervención experimental podría ser cualquier fármaco administrado para facilitar la abstinencia de las benzodiazepinas o para cambiar del tratamiento con benzodiazepinas a otro fármaco. Se incluyeron las intervenciones realizadas en la práctica general, los ámbitos ambulatorios y en pacientes hospitalizados.
Intervención de control
Las intervenciones de control incluyeron:
-
tratamiento habitual, según lo definieron los autores de los ensayos;
-
placebo;
-
cualquier comparador farmacológico activo.
Cointervenciones
Se permitieron las cointervenciones de cualquier clase, siempre que se administraran por igual en ambos grupos de intervención.
Tipos de medida de resultado
Estos resultados se evaluaron en dos momentos:
-
fin de la intervención, como lo definieron los autores de los ensayos. Este fue el punto temporal del resultado primario en la revisión;
-
seguimiento más largo, como lo definieron los autores de los ensayos.
Resultados primarios
-
Interrupción de las benzodiazepinas (definida como cese) medida al examinar la concentración en sangre u orina del participante, o mediante el uso informado por el paciente.
-
Síntomas de abstinencia de las benzodiazepinas, medidos con cualquier cuestionario relevante.
-
Eventos adversos graves, definidos como cualquier evento adverso que provoca la muerte, es potencialmente mortal, requiere hospitalización o prolongación de la hospitalización existente, que provoca discapacidad o incapacidad persistentes o significativas, o es una anomalía o defecto congénito (ICH GCP).
Resultados secundarios
-
Dosis media de benzodiazepina.
-
Insomnio medido con cualquier cuestionario relevante.
-
Ansiedad medida con cualquier cuestionario relevante.
-
Consumo concomitante de sustancias medido con el uso informado por el paciente de otras drogas o alcohol.
-
Eventos adversos no graves, definidos como cualquier evento médico indeseable no grave presentado por los participantes durante un ensayo clínico que no tiene necesariamente una relación causal con la intervención (ICH GCP).
-
Reincidencia en el uso de benzodiazepinas (definida según los autores de los ensayos), evaluada solamente al seguimiento más largo después del final de la intervención entre el subgrupo de participantes que interrumpieron el uso de las benzodiazepinas al final de la intervención.
-
Interrupción debido a eventos adversos evaluada solamente al final de la intervención.
Métodos de búsqueda para la identificación de los estudios
We aimed to identify all relevant randomised controlled trials regardless of language or publication status (published, unpublished, in press, or in progress).
Búsquedas electrónicas
We searched the following electronic databases:
-
Cochrane Drugs and Alcohol Group's Specialised Register of Trials (searched on 17 October 2017);
-
The Cochrane Central Register of Controlled Trials (CENTRAL; 2017, Issue 9);
-
PubMed (January 1966 to 17 October 2017);
-
Embase (Embase.com) (January 1974 to 17 October 2017);
-
CINAHL (Cumulative Index to Nursing and Allied Health Literature) (EbscoHOST) (1982 to 17 October 2017);
-
Web of Knowledge, Web of Science (1990 to 17 October 2017).
We searched the databases using MeSH and free‐text terms relating to substance use disorders. We combined the PubMed search with the Cochrane Highly Sensitive Search Strategy for identifying randomised trials in MEDLINE: sensitivity‐ and precision‐maximising version (2008 revision) (Lefebvre 2011). Detailed search strategies were developed for each database used, accounting for differences in controlled vocabulary and syntax rules. For details see Appendix 1; Appendix 2; Appendix 3; Appendix 4; Appendix 5; Appendix 6.
We searched the following trials registries on 17 October 2017:
-
ClinicalTrials.gov (clinicaltrials.gov);
-
World Health Organization (WHO) International Clinical Trials Registry Platform (ICTRP) (www.who.int/ictrp);
-
the ISRCTN registry (www.isrctn.com).
Búsqueda de otros recursos
We searched for further relevant trials by screening reference lists of previous review papers and those of all articles selected for inclusion.
Where possible, we contacted the first author of each included study to seek information about further relevant published and unpublished trials.
Obtención y análisis de los datos
Selección de los estudios
Two review authors (LB and BE, or LB and JR) independently screened titles of all studies obtained by the search strategy. After excluding all obviously irrelevant articles, we screened the abstracts of all remaining publications. We obtained all potentially relevant studies in full text, and two review authors independently assessed these studies for inclusion in the review (LB and BE, or LB and JR). During this process, we linked multiple reports of the same trial.
Extracción y manejo de los datos
Two review authors (LB and BE, or LB and JR) extracted data from the included studies using a standard extraction form. Any disagreements were resolved by consensus between raters (LB and BE, or LB and JR), and if not possible by judgement of authors JL and CG.
We extracted the following data.
-
General information: publication status, title, authors’ names, source, country, contact address, language of publication, year of publication, duplicate publication.
-
Trial characteristics: design and setting.
-
Interventions: type of pharmacological intervention, dose, duration, type of control intervention.
-
Participants: inclusion and exclusion criteria, number of participants in intervention and control groups, participant demographics such as sex and age, baseline characteristics, and number of participants lost to follow‐up.
-
Outcomes: please see Types of outcome measures above.
-
Risk of bias: please see Assessment of risk of bias in included studies below.
Evaluación del riesgo de sesgo de los estudios incluidos
We assessed the risk of bias for randomised controlled trials using the criteria recommended by the Cochrane Handbook for Systematic Reviews of Interventions (Higgins 2011). The recommended approach for assessing risk of bias in studies included in a Cochrane Review is a two‐part tool, addressing seven specific domains, namely sequence generation and allocation concealment (selection bias), blinding of participants and providers (performance bias), blinding of outcome assessor (detection bias), incomplete outcome data (attrition bias), selective outcome reporting (reporting bias), and other sources of bias including industry bias (Lundh 2017). The first part of the tool involves describing what was reported to have happened in the trial. The second part of the tool involves assigning a judgement relating to the risk of bias for that entry, in terms of low, high, or unclear risk. To make these judgements we used the criteria indicated by the CochraneHandbook adapted to the addiction field. See Appendix 7 for details.
We addressed the domains of sequence generation and allocation concealment (avoidance of selection bias) in the tool by a single entry for each study.
Regarding blinding of participants, personnel, and outcome assessor (avoidance of performance bias and detection bias), we planned to consider these items separately for objective outcomes (e.g. urine drug screening) and subjective outcomes (e.g. severity of signs and symptoms of withdrawal, adverse events). However, since all available outcomes were self reported, the dichotomisation into objective and subjective outcomes was not relevant.
We considered incomplete outcome data (avoidance of attrition bias) for all outcomes.
Overall assessment of risk of bias
We classified a trial as at low risk of bias only if all of the bias components described in the above paragraphs were classified as at low risk of bias. If one or more of the bias domains were classified as at unclear or high risk of bias, we classified the trial as at high risk of bias. If we found no trials at low risk of bias or only a very few trials at low risk of bias, we planned to identify a group of trials with lower risk of bias, defined as those having low risk of bias in the following domains: generation of allocation sequence, allocation concealment, and blinding of participants and treatment providers. However, since we classified only one trial as at low risk of bias, and thus the majority of the trials (k = 37; 97%) as at high risk of bias, it was not possible to apply this classification in the current review.
Medidas del efecto del tratamiento
For dichotomous outcomes, we calculated a risk ratio (RR) with 95% confidence interval (CI), and in case of a significant result based on trials at low risk of bias, we reported the number needed to treat for an additional beneficial outcome (NNTB) or the number needed to treat for an additional harmful outcome (NNTH) as the inverse of the absolute risk difference.
For continuous data, we calculated the mean difference (MD) between groups. We did not calculate effect size measures (standardised mean difference (SMD)) for all outcomes because of the inherent limitations associated with this measure (Higgins 2011). However, if scales of very considerable similarity were used, we could presume there was a small difference in the different measurements, and we calculated the effect size and planned to transform the effect back to the units of one or more of the specific instruments. However, due to marked differences in among‐participant variability, we did not find it relevant to re‐express the SMD using one of the specific measurement instruments.
Cuestiones relativas a la unidad de análisis
The trial participant was the unit of analysis.
1. Cluster trials
No cluster‐randomised trials were included. If one or more cluster‐randomised trials had been included, we would have calculated the ‘design effect’ as described in our protocol (Baandrup 2015).
2. Cross‐over trials
We used data only from the first phase of cross‐over trials.
3. Studies with multiple intervention groups
Where a trial involved more than two intervention groups, we included both when relevant, or included data from the most relevant comparison if it was not appropriate from a clinical point of view to combine the experimental intervention groups into a single group (Higgins 2011).
Manejo de los datos faltantes
We tried to contact the first authors of studies to supply any missing data with regard to the defined outcomes. However, many of the included studies were old and the reported author contact details were outdated. It was thus impossible to contact many of the authors, and even the authors of newer studies did not reply to our queries for missing data.
Dichotomous data
For dichotomous outcomes, we did not impute missing values and analysed data as a complete‐case analysis.
Continuous data
If standard deviations (SDs) were not reported, we calculated them, if possible, using other data from the trial. If calculation of the SD was impossible, we imputed SDs from trials with similar characteristics if we considered this to be a valid approach.
Evaluación de la heterogeneidad
We assessed statistical heterogeneity in the trials both by visual inspection of a forest plot and by using a standard Chi2 value with a significance level of P = 0.10. We assessed heterogeneity by use of the I2 statistic. We interpreted an I2 estimate greater than or equal to 50% and a significant Chi2 statistic as evidence of substantial heterogeneity (Higgins 2011). If this was the case, we explored the reasons for heterogeneity. If there was high inconsistency, and a clear reason was found, we planned to present data separately. We only performed a meta‐analysis if a sufficient number of studies were identified and if combining these studies was feasible as judged by clinical and statistical characteristics.
Evaluación de los sesgos de notificación
We planned to inspect funnel plot symmetry when at least 10 trials were included in the meta‐analysis (Egger 1997; Macaskill 2001), bearing in mind that publication bias does not necessarily cause asymmetry, and that asymmetry may have other causes than publication bias. The inspection by funnel plot was not possible because none of the meta‐analyses included at least 10 trials.
For each included study, we investigated whether a study protocol was available. We searched PubMed, other major reference databases, and the Internet for a study protocol if a web address was not specifically stated in the article. This search could reveal abstracts or presentations relating to the study, and a comparison of outcomes with published outcomes was then possible. For newer studies, we searched for information on predefined outcome measures in trial registries. We had planned to construct a matrix containing recorded outcomes in each study, which then could indicate which studies did not report outcomes reported by the majority of included studies. However, during the process of data extraction and quality assessment, it was very evident which trials were associated with reporting bias, since these trials did not report the most evident outcome, namely some measure of benzodiazepine consumption.
Síntesis de los datos
We divided the analyses according to type of experimental drug and pooling of drugs where a class effect could be expected (i.e. pooling of data from trials investigating drugs with a similar pharmacological profile, if clinical and statistical heterogeneity allowed). We performed meta‐analyses according to the recommendations in the Cochrane Handbook for Systematic Reviews of Interventions (Higgins 2011), using the software Review Manager 5 (RevMan 2014). We further conducted Trial Sequential Analysis using the software available from CTU 2011.
Meta‐analysis
We performed meta‐analyses using a random‐effects model based on expectations of substantial heterogeneity among included trials (Deeks 2011; DeMets 1987; DerSimonian 1986). However, in case we found that one or two trials dominated the reported evidence (i.e. constituted more than 75% of the evidence), and there was substantial heterogeneity, we planned to synthesise data when appropriate and to emphasise results from the fixed‐effect model. However, due to the nature of the extracted data this scenario was not relevant.
Trial Sequential Analysis
We applied Trial Sequential Analysis, CTU 2011; Thorlund 2011b, because cumulative meta‐analyses are at risk of producing random errors due to sparse data and repetitive testing of the accumulating data (Brok 2008; Brok 2009; Thorlund 2009; Thorlund 2010; Wetterslev 2008; Wetterslev 2009). To minimise random errors, we calculated the required information size (i.e. the number of participants needed in a meta‐analysis to detect or reject a certain intervention effect) (Thorlund 2011a; Wetterslev 2008; Wetterslev 2017). The required information size for a meta‐analysis corresponds to the sample size for a single trial (Wetterslev 2017). The required information size takes into account: the event proportion in the control group; the assumption of a plausible risk ratio (RR) reduction, or the RR reduction observed in the included trials with low risk of bias; and the assumed heterogeneity, Turner 2014, or diversity of the meta‐analysis (Wetterslev 2008; Wetterslev 2009; Wetterslev 2017).
Trial Sequential Analysis enables testing for significance each time a new trial is added to the meta‐analysis (Thorlund 2011b; Wetterslev 2008; Wetterslev 2017). We added the trials according to the year of publication, and if more than one trial had been published in a year, we added trials alphabetically according to the last name of the first author. On the basis of the required information size and risk of type I and type II errors, we further constructed trial sequential monitoring boundaries. These boundaries determine the statistical inference one may draw from a meta‐analysis that has not reached the required information size. If the trial sequential boundary is crossed before the required information size is reached, firm evidence may perhaps be established and further trials may turn out to be superfluous. On the other hand, it is probably necessary to continue doing trials in order to detect or reject a certain intervention effect, if the trial sequential boundaries are not crossed.
As default, we originally planned to use a type I error of 5%, and a type II error of 20%. However, to account for multiplicity, we decreased the risk of type I error for the three primary outcomes to 2.5%, and to 1.25% for the seven secondary outcomes (Jakobsen 2014). Furthermore, we decreased the risk of type II error to 10%. For dichotomous outcomes, we had planned to estimate the required information size based on the proportion of participants with an outcome in the control group, a risk ratio of 20% or as suggested by the trials with low risk of bias, a diversity of 30% and 60%, or as suggested by the trials in the meta‐analysis. Specifically, for the primary dichotomised outcome 'benzodiazepine discontinuation', we used a control event proportion of 48% for all analyses, as this was the observed mean for trials assessing this outcome. For continuous outcomes, we estimated the required information size based on the SD observed in the control group of trials with low risk of bias and a minimal relevant difference of 50% of this SD, a diversity of 30% and 60%, or as suggested by the trials in the meta‐analysis. Specifically, for the secondary continuous outcome 'anxiety', assessed with the Hamilton Anxiety Rating Scale (HAM‐A), we used a variance of 103 (corresponding to an SD of 10 points), and a minimal relevant difference of 5 points for all analyses, as this was the highest observed variance in the trials assessing this outcome. Likewise, we used a variance of 20 points (corresponding to an SD of 4.5 points), and a minimal relevant difference of 2.25 points for all analyses of benzodiazepine withdrawal symptoms assessed with the Benzodiazepine Withdrawal Symptom Questionnaire (BWSQ), as this was the highest observed variance in the trials assessing this outcome.
It was only possible to conduct Trial Sequential Analysis for eight outcomes, because fewer than two trials reported the same outcome, using the same instrument. In such situations the accrued information is such a small proportion of the required information size that Trial Sequential Analysis figures become uninterpretable.
Análisis de subgrupos e investigación de la heterogeneidad
We had planned to group the results from included studies according to the following methodological or clinical issues.
-
Trials at low risk of bias compared to trials at high risk of bias, or if we found no trials with low risk of bias, we would compare trials at lower risk of bias to trials at high risk of bias.
-
Type of benzodiazepine or benzodiazepine‐related drug.
-
Trials with different types of treatment setting (e.g. general practice compared to outpatient setting compared to inpatient setting).
-
Trials with different modes of benzodiazepine tapering (e.g. prescheduled or symptom‐guided).
-
Participants with concurrent psychiatric illness compared to participants without concurrent psychiatric illness.
-
Trials with different duration of the intervention: short (0 to 2 months), medium (3 to 6 months), and long (> 6 months).
-
Trials including inpatients compared to trials including outpatients.
-
Participants with other substance dependence versus participants with only benzodiazepine dependence/chronic use.
However, due to the high number of different pharmacological add‐on agents with few trials per agent, we chose not to perform any of our planned subgroup analyses.
Análisis de sensibilidad
We had planned to perform a sensitivity analysis to examine the impact of our assumptions regarding missing data. Furthermore, we had planned a sensitivity analysis to investigate the influence of trials with low compliance with study medication compared to trials with high compliance with study medication (compliance as defined by the trialists).
Assumption for lost dichotomous data
We had planned to perform two sensitivity analyses:
-
’Best‐worst‐case’ scenario: It will be assumed that all participants lost to follow‐up in the experimental group had no outcome, and that all participants lost to follow‐up in the control group had the outcome.
-
’Worst‐best‐case’ scenario: It will be assumed that all participants lost to follow‐up in the experimental group had the outcome, and that all participants lost to follow‐up in the control group had no outcome.
Assumptions for lost continuous data
Where assumptions had to be made regarding missing SDs (see: Dealing with missing data), we had planned sensitivity analysis to test how prone results were to change when 'completer' data only were compared to the imputed data using the above assumption. If there was a substantial difference, we had planned to report results and discuss them but continue to employ our assumption. Imputation of data turned out to be relevant for only one comparison: alpidem versus placebo (anxiety; Analysis 8.3).
However, due to the high number of different pharmacological add‐on agents with few trials per agent, we chose not to perform any of our planned sensitivity analyses.
'Summary of findings'
We used the GRADE system to assess the quality of the body of evidence and constructed 'Summary of findings' tables for the two primary outcomes on benzodiazepine consumption, employing GRADEpro software (GRADE). We assessed five factors of the study design and implementation of available trials that may downgrade the quality of the evidence, namely: risk of bias; indirectness of evidence (population, intervention, control, outcomes); unexplained heterogeneity or inconsistency of results (including problems with subgroup analyses); imprecision of results; and high probability of publication bias.
Based on this, we defined the levels of evidence as follows (Balshem 2011).
-
High‐quality evidence when "we are very confident that the true effect lies close to that of the estimate of the effect".
-
Moderate‐quality evidence when "we are moderately confident in the effect estimate: the true effect is likely to be close to the estimate of the effect, but there is a possibility that it is substantially different".
-
Low‐quality evidence when the following statement applies: "Our confidence in the effect estimate is limited: the true effect may be substantially different from the estimate of the effect".
-
Very low‐quality evidence when the following statement applies: "We have very little confidence in the effect estimate: the true effect is likely to be substantially different from the estimate of effect".
Results
Description of studies
See Characteristics of included studies section.
Results of the search
Our search strategy identified 3280 unique records. After removal of duplicates and irrelevant records, the number was reduced to 1239. Of these, we excluded 1174 after screening, and a further 22 after reviewing the full texts (Figure 1).
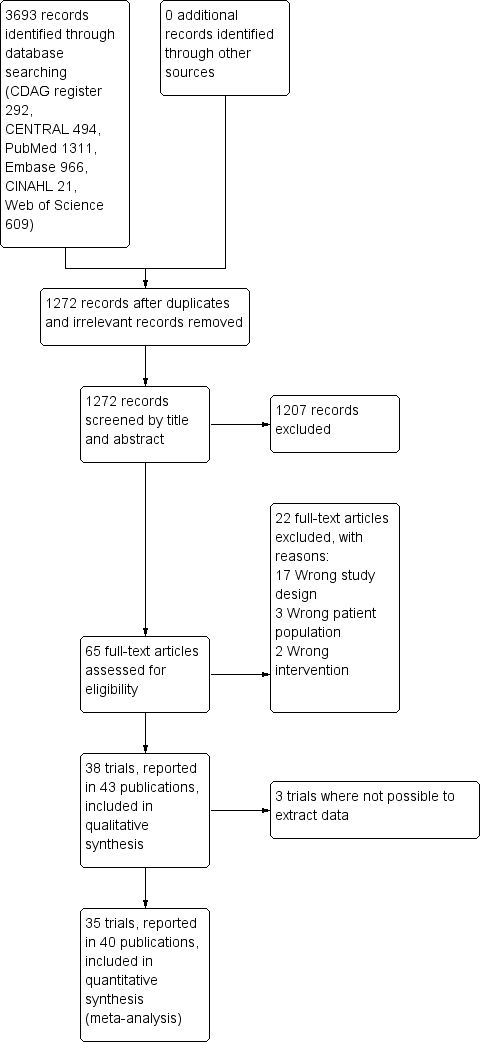
Study flow diagram.
Included studies
We included 43 publications reporting on 38 trials. Due to general poor reporting of the trials, we were not able to extract relevant data from all of the trials, even after attempting to contact the authors where possible. For this reason, we have not extracted data from Romach 1998 (experimental drug: ondansetron), Saul 1989 (experimental drug: atenolol), and Mariani 2016 (experimental drug: gabapentin). As a result, we included 35 trials involving 2295 participants with data in the quantitative meta‐analyses. See Characteristics of included studies.
Most of the trials (n = 35) involved a comparison between an active medication versus placebo or no intervention, while three trials investigated the experimental drug against another active comparator. The experimental drugs investigated were diverse, which limited the pooled analyses that were possible. If clinically relevant, we grouped investigational drugs with a similar mechanism, for example tricyclic antidepressants. To retain the clinical relevance of the meta‐analyses, we did not group medications with dissimilar pharmacological action even though they may belong to the same Anatomical Therapeutic Chemical‐group, for example valproate and carbamazepine trials were not pooled. The interventions investigated and included in the quantitative meta‐analyses were as follows.
-
Valproate versus placebo, Rickels 1999, or no intervention (Vorma 2011).
-
Carbamazepine versus placebo (Di Costanzo 1992; Klein 1994; Schweizer 1991).
-
Lithium versus placebo (Lecrubier 2005).
-
Pregabalin versus placebo (Hadley 2012).
-
Captodiame versus placebo (Mercier‐Guyon 2004).
-
Paroxetine versus placebo, GlaxoSmithKline 2002; Zitman 2001, or no intervention (Nakao 2006).
-
Tricyclic antidepressants (dosulepin (Tyrer 1996), imipramine (Rickels 2000; Rynn 2003), or trazodone (Zhang 2013)) versus placebo.
-
Alpidem versus placebo (Cassano 1996; Lader 1993).
-
Buspirone versus placebo (Ashton 1990; Lader 1987; Morton 1995; Udelman 1990).
-
Melatonin (short‐acting, Peles 2007; Vissers 2007, and prolonged‐release, Baandrup 2016; Garfinkel 1999) versus placebo.
-
Flumazenil versus placebo (Gerra 1993; Gerra 2002; Harrison‐Read 1996).
-
Propranolol versus placebo (Tyrer 1981).
-
Progesterone versus placebo (Schweizer 1995).
-
Magnesium aspartate versus placebo (Hantouche 1998).
-
Homeopathic drugs versus placebo (Cialdella 2001).
-
Carbamazepine versus tricyclic antidepressant (tianeptine) (Kornowski 2002).
-
Bromazepam versus cyamemazine (Lemoine 2006).
-
Zopiclone versus flunitrazepam (Pat‐Horenczyk 1998).
Out of the 38 trials, 24 were single‐centre (Ashton 1990; Baandrup 2016; Cialdella 2001; Di Costanzo 1992; Garfinkel 1999; Gerra 1993; Gerra 2002; Harrison‐Read 1996; Klein 1994; Kornowski 2002; Mariani 2016; Morton 1995; Nakao 2006; Pat‐Horenczyk 1998; Peles 2007; Rickels 1999; Rickels 2000; Romach 1998; Rynn 2003; Schweizer 1991; Schweizer 1995; Tyrer 1996; Vorma 2011; Zhang 2013), and 14 were multicentre (Cassano 1996; GlaxoSmithKline 2002; Hadley 2012; Hantouche 1998; Lader 1987; Lader 1993; Lecrubier 2005; Lemoine 2006; Mercier‐Guyon 2004; Saul 1989; Tyrer 1981; Udelman 1990; Vissers 2007; Zitman 2001).
The majority of the trials were performed in outpatient settings. The three trials investigating intravenous injection of flumazenil were conducted in inpatient settings (Gerra 1993; Gerra 2002; Harrison‐Read 1996), as was a trial with rapid benzodiazepine dose reduction in opioid maintenance patients (Vorma 2011). In Gerra 1993 and Gerra 2002, participants were hospitalised for the duration of the trial (seven and eight days, respectively) whereas participants in Harrison‐Read 1996 were hospitalised as they received a challenge with flumazenil and were thereafter treated as outpatients. Twenty‐four trials were conducted in Europe; eight trials in the US or Canada; and six trials in Asia.
Nine trials reported the source of funding as research grants (Baandrup 2016; Cialdella 2001; Mariani 2016; Peles 2007; Rickels 1999; Rickels 2000; Schweizer 1991; Schweizer 1995; Vorma 2011), and the funding was unclear for 15 trials (Cassano 1996; Di Costanzo 1992; Gerra 1993; Gerra 2002; Hantouche 1998; Kornowski 2002; Lader 1987; Lader 1993; Lecrubier 2005; Nakao 2006; Saul 1989; Tyrer 1981; Tyrer 1996; Vissers 2007; Zhang 2013). Fourteen trials used medications provided by the manufacturing company (Ashton 1990; Garfinkel 1999; GlaxoSmithKline 2002; Hantouche 1998; Harrison‐Read 1996; Klein 1994; Lemoine 2006; Mercier‐Guyon 2004; Morton 1995; Pat‐Horenczyk 1998; Romach 1998; Rynn 2003; Udelman 1990; Zitman 2001), and in all but one of these studies information regarding the degree of involvement of the pharmaceutical company was insufficient.
The trials investigated participants with a varying clinical picture dominated by anxiety. Three trials specifically investigated participants in opioid maintenance treatment (Mariani 2016; Peles 2007; Vorma 2011). In most trials, the majority of participants were women. The mean age was around 50 years (+/‐ 10 years) in most trials, and mean duration of benzodiazepine use was between 5 and 10 years in most trials. In eight trials there was no information at all on baseline characteristics. Eight trials applied abrupt discontinuation of benzodiazepine treatment with follow‐up periods between 1 and 8 weeks, whereas the remainder of the trials applied a gradual benzodiazepine dosage reduction regimen lasting between 2 and 24 weeks.
Trial duration ranged between 1 and 24 weeks, and mean trial duration was 9.4 weeks.
Excluded studies
We excluded 22 studies that were considered potentially relevant and assessed in detail (Figure 1). The reasons for exclusion were: 17 studies had a study design not fulfilling our inclusion criteria; 3 studies had a patient population not fulfilling our inclusion criteria; and 2 studies had interventions not fulfilling our inclusion criteria. For further details see Characteristics of excluded studies section.
Risk of bias in included studies
The overall risk of bias associated with the included studies is summarised in Figure 2 and Figure 3. Please also see Characteristics of included studies table.

Risk of bias summary: review authors' judgements about each risk of bias item for each included study.

Risk of bias graph: review authors' judgements about each risk of bias item presented as percentages across all included studies.
Allocation
Sequence generation
We judged only two trials as at low risk of bias because the random sequence was described as computer‐generated (Baandrup 2016; Zitman 2001). For all other trials (n = 36; 95%), information on random sequence generation was not provided and they were therefore judged as at unclear risk of selection bias.
Allocation concealment
We judged five trials as at low risk of bias because they sufficiently described how the randomisation was administered in a way that staff and trial participants could not anticipate to which group the next participant would be randomised. In two trials, randomisation was administered by a third party who paced and distributed the trial medication using numbered medication containers (Baandrup 2016; Zitman 2001); in one trial consecutive container numbers were used (Peles 2007); in one trial allocation was performed by an independent pharmacist (Harrison‐Read 1996); and one trial used sealed envelopes (Vorma 2011). We judged all other studies (n = 33; 87%) as at unclear risk of selection bias due to lack of information on allocation concealment.
Blinding
Performance bias
We evaluated 13 trials as at unclear risk of performance bias due to insufficient description of blinding procedures for participants and personnel (Cassano 1996; Cialdella 2001; Di Costanzo 1992; Hadley 2012; Hantouche 1998; Kornowski 2002; Mercier‐Guyon 2004; Peles 2007; Rickels 1999; Tyrer 1996; Vissers 2007; Zhang 2013; Zitman 2001). We considered more than half of the trials (n = 21; 55%) as at low risk of performance bias due to sufficient blinding procedures of participants and personnel. Four of the included trials were not blinded for participants and personnel and were therefore judged as at high risk of performance bias (Gerra 1993; Gerra 2002; Nakao 2006; Vorma 2011).
Detection bias
The majority of included trials (n = 25; 66%) were associated with unclear risk of detection bias due to insufficient descriptions of what was done to ensure blinding of outcome assessors. Three of the included trials were not blinded for outcome assessors and were therefore judged as at high risk of detection bias (Gerra 1993; Gerra 2002; Nakao 2006). We judged 10 trials as at low risk of detection bias because they provided sufficient information on blinding of outcome assessors (Baandrup 2016; Cassano 1996; Garfinkel 1999; Lader 1987; Lader 1993; Peles 2007; Schweizer 1991; Tyrer 1981; Vorma 2011; Zitman 2001).
Incomplete outcome data
We judged 14 studies (37%) as at high risk of attrition bias due to unacceptably high dropout rates, that is close to 50% (Ashton 1990; Cassano 1996; Hadley 2012; Klein 1994; Lader 1987; Mariani 2016; Pat‐Horenczyk 1998; Saul 1989; Schweizer 1991; Schweizer 1995; Tyrer 1981; Tyrer 1996; Udelman 1990; Zitman 2001). We judged six studies (16%) as at unclear risk of attrition bias due to missing information on flow of participants through the trials (Cialdella 2001; Hantouche 1998; Peles 2007; Rickels 2000; Romach 1998; Vorma 2011). We judged the remaining studies (n = 18; 47%) as at low risk of attrition bias.
Selective reporting
We judged four studies (11%) as at high risk of reporting bias because important outcome measures were not reported, that is benzodiazepine dosage at follow‐up (GlaxoSmithKline 2002; Klein 1994; Zhang 2013), or reporting of an unusual primary outcome (Lemoine 2006). We judged seven studies (18%) as at unclear risk of reporting bias due to insufficient information regarding whether selective reporting was present (Lader 1987; Lecrubier 2005; Mercier‐Guyon 2004; Peles 2007; Vissers 2007; Vorma 2011; Zitman 2001). We judged the remaining studies (n = 27; 71%) as at low risk of reporting bias.
Other potential sources of bias
We judged nine trials (24%) as at unclear risk of other bias mostly due to unclear or lacking description of funding. We rated 14 (37%) of the included trials as at high risk of other bias due to missing information on how the funding pharmaceutical company was involved in designing the trial as well as in analysing and interpreting the results.
Overall risk of bias
According to criteria described above, we could classify only one trial as at low risk of bias (Baandrup 2016), and no other trial qualified as at lower risk of bias. The large majority of the trials were thus at high risk of bias.
Effects of interventions
See: Summary of findings for the main comparison Valproate compared with placebo or no intervention for benzodiazepine discontinuation in chronic benzodiazepine users; Summary of findings 2 Carbamazepine compared with placebo for benzodiazepine discontinuation in chronic benzodiazepine users; Summary of findings 3 Lithium compared with placebo for benzodiazepine discontinuation in chronic benzodiazepine users; Summary of findings 4 Pregabalin compared with placebo for benzodiazepine discontinuation in chronic benzodiazepine users; Summary of findings 5 Captodiame compared with placebo for benzodiazepine discontinuation in chronic benzodiazepine users; Summary of findings 6 Paroxetine compared with placebo or no intervention for benzodiazepine discontinuation in chronic benzodiazepine users; Summary of findings 7 Tricyclic antidepressants compared with placebo for benzodiazepine discontinuation in chronic benzodiazepine users; Summary of findings 8 Alpidem compared with placebo for benzodiazepine discontinuation in chronic benzodiazepine users; Summary of findings 9 Buspirone compared with placebo for benzodiazepine discontinuation in chronic benzodiazepine users; Summary of findings 10 Melatonin compared with placebo for benzodiazepine discontinuation in chronic benzodiazepine users; Summary of findings 11 Flumazenil compared with placebo for benzodiazepine discontinuation in chronic benzodiazepine users; Summary of findings 12 Progesterone compared with placebo for benzodiazepine discontinuation in chronic benzodiazepine users; Summary of findings 13 Magnesium aspartate compared with placebo for benzodiazepine discontinuation in chronic benzodiazepine users; Summary of findings 14 Homéogène 46/Sedatif PC (homeopathic drugs) compared with placebo for benzodiazepine discontinuation in chronic benzodiazepine users; Summary of findings 15 Carbamazepine compared with tricyclic antidepressant for benzodiazepine discontinuation in chronic benzodiazepine users
Valproate versus placebo or no intervention
Results for this comparison were mainly from a small trial comparing valproate versus placebo (Rickels 1999). Results showed a beneficial effect of valproate on benzodiazepine discontinuation at end of intervention (Analysis 1.1: 1 study, 27 participants; RR 2.55, 95% CI 1.08 to 6.03; GRADE: very low‐quality evidence) and on benzodiazepine relapse at end of intervention (Analysis 1.2: 1 study, 27 participants; RR 0.31, 95% CI 0.11 to 0.90; GRADE: very low‐quality evidence). However, there was no effect on benzodiazepine discontinuation at longest follow‐up (Analysis 1.3: 1 study, 24 participants; RR 1.57, 95% CI 0.80 to 3.09; GRADE: very low‐quality evidence), benzodiazepine relapse at longest follow‐up (Analysis 1.4: 1 study, 24 participants; RR 0.43, 95% CI 0.13 to 1.39; GRADE: very low‐quality evidence), or symptoms of anxiety at end of intervention (Analysis 1.5: 1 study, 27 participants; MD ‐0.40 points, 95% CI ‐6.47 to 5.67; GRADE: very low‐quality evidence).
For benzodiazepine discontinuation, we calculated the required information size to be 1918 participants, using a control event proportion of 48%, a relative risk reduction of 20%, type I error of 2.5%, power of 90%, and a diversity of 30%. We could not perform Trial Sequential Analysis as there was only one trial.
For benzodiazepine withdrawal symptoms, it was possible to perform a meta‐analysis using data from Rickels 1999 and data from another small trial investigating benzodiazepine withdrawal in methadone maintenance users, Vorma 2011, comparing valproate versus no intervention. This meta‐analysis indicated no difference between intervention groups (Analysis 1.6: 2 studies, 56 participants; SMD ‐0.15, 95% CI ‐0.68 to 0.37; GRADE: very low‐quality evidence). Due to marked differences in among‐participant variability, we did not re‐express the SMD using one of the specific measurement instruments. Results were similar if analysing placebo or no intervention separately as control group.
Please see summary of findings Table for the main comparison.
Carbamazepine versus placebo
Results for this comparison stem from three smaller trials (Di Costanzo 1992; Klein 1994; Schweizer 1991), not all of which contribute data to all outcomes. It was possible to perform a meta‐analysis for benzodiazepine discontinuation at end of intervention, where no significant differences between groups were detected (Analysis 2.1: 3 studies, 147 participants; RR 1.33, 95% CI 0.99 to 1.80; GRADE: low quality‐evidence). Trial Sequential Analysis showed that the diversity‐adjusted required information size of 2109 participants was not reached, as the accrued number of participants was only 147 (7.0%), showing that insufficient information has been accrued (Figure 4).
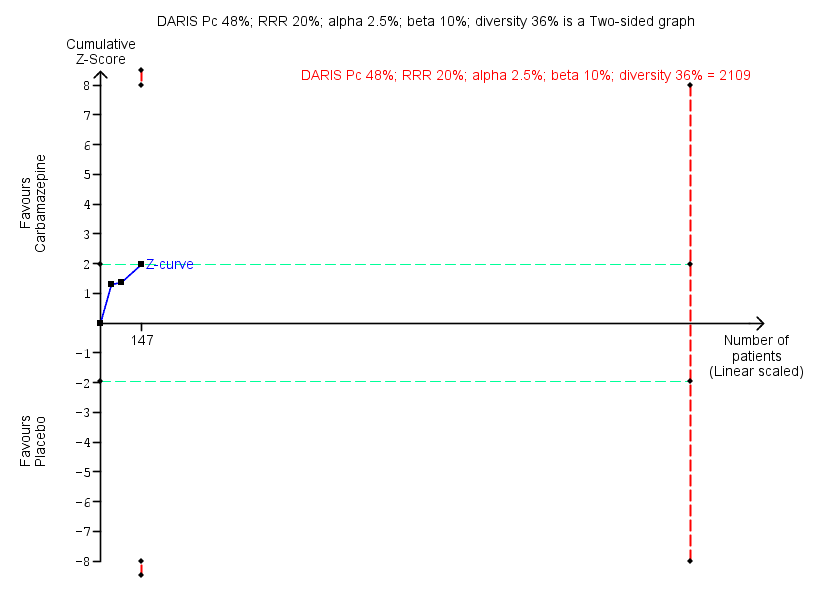
Trial Sequential Analysis of comparison: 2 Carbamazepine versus placebo, outcome: 2.1 Benzodiazepine discontinuation. Trial Sequential Analysis on benzodiazepine discontinuation in three trials was performed based on the proportion with benzodiazepine discontinuation in the control group set at 48%, a relative risk reduction (RRR) of 20%, a type I error of 2.5%, a type II error of 10% (90% power), and diversity of 36% as observed in the trials. The diversity‐adjusted required information size (DARIS) was 2109 participants, and the Trial Sequential Analysis‐adjusted confidence interval is 0.24 to 2.38. The blue line represents the cumulative Z‐score of the meta‐analysis. The green lines represent the conventional statistical boundaries of P = 5%. The cumulative Z‐curve (blue line) touches the conventional statistical boundaries, but does not cross the trial sequential monitoring boundaries, and the diversity‐adjusted required information size is not met, showing that insufficient information has been accrued.
For benzodiazepine withdrawal symptoms, results did not favour carbamazepine (Analysis 2.2: 2 studies, 76 participants; SMD ‐1.14, 95% CI ‐2.43 to 0.16; GRADE: very low quality‐evidence). Due to marked differences in among‐participant variability, we did not re‐express the SMD using one of the specific measurement instruments.
For the following outcomes, only data from single trials were available, finding no differences between groups regarding benzodiazepine discontinuation at longest follow‐up (Analysis 2.3: 1 study, 40 participants; RR 1.41, 95% CI 0.86 to 2.29; GRADE: very low‐quality evidence), relapse to benzodiazepine use (Analysis 2.4: 1 study, 36 participants; RR 0.33, 95% CI 0.08 to 1.44; GRADE: very low‐quality evidence), and non‐serious adverse events (Analysis 2.6: 1 study, 36 participants; RR 7.00, 95% CI 0.39 to 126.48; GRADE: very low‐quality evidence). Data from a single trial found carbamazepine superior to placebo regarding symptoms of anxiety (Analysis 2.7: 1 study, 36 participants; MD ‐6.00 points, 95% CI ‐9.58 to ‐2.42; GRADE: very low‐quality evidence).
When evaluating benzodiazepine withdrawal symptoms, the results were associated with significant heterogeneity. We could identify no obvious reason for this heterogeneity.
Please see summary of findings Table 2.
Lithium versus placebo
One trial of moderate size investigated lithium versus placebo for benzodiazepine discontinuation and found no difference between groups regarding benzodiazepine discontinuation (Analysis 3.1: 1 study, 230 participants; RR 1.05, 95% CI 0.86 to 1.28; GRADE: low‐quality evidence), non‐serious adverse events (Analysis 3.3: 1 study, 230 participants; RR 1.06, 95% CI 0.75 to 1.49; GRADE: very low‐quality evidence), and discontinuation due to adverse events (Analysis 3.4: 1 study, 230 participants; RR 1.38, 95% CI 0.13 to 15.03; GRADE: very low‐quality evidence) (Lecrubier 2005). Data on other outcomes specified in this review were not available.
For benzodiazepine discontinuation, we calculated the required information size to be 1918 participants, using a control event proportion of 48%, a relative risk reduction of 20%, type I error of 2.5%, power of 90%, and a diversity of 30%. We could not perform Trial Sequential Analysis as there was only one trial.
Please see summary of findings Table 3.
Pregabalin versus placebo
One smaller trial investigated this comparison (Hadley 2012), finding no significant difference between groups regarding benzodiazepine discontinuation (Analysis 4.1: 1 study, 106 participants; RR 1.44, 95% CI 0.92 to 2.25; GRADE: very low‐quality evidence), but finding superior effect of pregabalin regarding benzodiazepine withdrawal symptoms (Analysis 4.2; 1 study, 106 participants; MD ‐3.10 points, 95% CI ‐3.51 to ‐2.69; GRADE: very low‐quality evidence) and symptoms of anxiety (Analysis 4.3: 1 study, 106 participants; MD ‐4.80 points, 95% CI ‐5.28 to ‐4.32; GRADE: very low‐quality evidence). There were no differences between groups for serious and non‐serious adverse events as well as for discontinuation due to side effects (Analysis 4.4; Analysis 4.5; Analysis 4.6).
For benzodiazepine discontinuation, we calculated the required information size to be 1918 participants, using a control event proportion of 48%, a relative risk reduction of 20%, type I error of 2.5%, power of 90%, and a diversity of 30%. We could not perform Trial Sequential Analysis as there was only one trial.
Please see summary of findings Table 4.
Captodiame versus placebo
One smaller trial compared captodiame (an antihistamine used as a sedative and anxiolytic) with placebo and found that captodiame had a beneficial effect in terms of benzodiazepine withdrawal symptoms (Analysis 5.1: 1 study, 81 participants; MD ‐1.00 points, 95% CI ‐1.13 to ‐0.87; GRADE: very low‐quality evidence) and symptoms of anxiety (Analysis 5.2: 1 study, 81 participants; MD ‐5.70 points, 95% CI ‐6.05 to ‐5.35) (Mercier‐Guyon 2004). Data on other outcomes specified in this review were not available.
For benzodiazepine withdrawal symptoms assessed with the Benzodiazepine Withdrawal Symptom Questionnaire (BWSQ), we calculated the required information size to be 229 participants, using a variance of 20 points, a minimal relative difference of 2.25 points, type I error of 2.5%, power of 90%, and a diversity of 30%. We could not perform Trial Sequential Analysis as there was only one trial.
Please see summary of findings Table 5.
Paroxetine versus placebo or no intervention
Three smaller trials evaluated paroxetine to facilitate benzodiazepine discontinuation: two versus placebo, GlaxoSmithKline 2002; Zitman 2001, and one versus no intervention (Nakao 2006). It was possible to perform a meta‐analysis for the following outcomes, where placebo and no intervention were pooled as control group.
-
Benzodiazepine discontinuation at end of intervention, where no intervention effect could be found (Analysis 6.1: 3 studies, 221 participants; RR 1.45, 95% CI 0.88 to 2.39; GRADE: very low‐quality evidence). Trial Sequential Analysis showed that the diversity‐adjusted required information size of 9448 participants was not reached, as the accrued number of participants was only 210 (2.34%), showing that insufficient information has been obtained (Figure 5). Results for benzodiazepine discontinuation were associated with significant heterogeneity (Analysis 6.1), for which we could not identify any obvious reason.
-
Benzodiazepine withdrawal symptoms at end of intervention, assessed with BWSQ, indicated a difference in favour of paroxetine (Analysis 6.2: 2 studies, 99 participants; MD ‐3.57 points, 95% CI ‐5.34 to ‐1.80; GRADE: very low‐quality evidence). Trial Sequential Analysis based on a minimal relevant clinical difference of 2.25 points, variance of 20 (empirical data), a type I error of 1.25%, a type II error of 10% (90% power), and diversity of 0% showed that the diversity‐adjusted required information size of 229 participants was not met (Figure 6). However, the cumulative Z‐curve touched the trial sequential monitoring boundaries for benefit, indicating that sufficient information had been obtained, and that the result was not due to random error.
-
Symptoms of anxiety, assessed with Hamilton Anxiety Rating Scale (HAM‐A), indicated a difference in favour of paroxetine (Analysis 6.3: 2 studies, 99 participants; MD ‐6.75 points, 95% CI ‐9.64 to ‐3.86; GRADE: very low‐quality evidence). We performed Trial Sequential Analysis on anxiety, assessed with HAM‐A, with a minimal relevant clinical difference of 5 points, variance of 103 points, based on a type I error of 1.25%, a type II error of 10% (90% power), and diversity of 0% (Figure 7). The diversity‐adjusted required information size of 236 participants was not met. However, the cumulative Z‐curve crossed the trial sequential monitoring boundaries for benefit, indicating that sufficient information had been obtained, and that the result was not due to random error.

Trial Sequential Analysis of comparison: 6 Paroxetine versus placebo, outcome: 6.1 Benzodiazepine discontinuation. Trial Sequential Analysis on benzodiazepine discontinuation in three trials was performed based on the proportion with benzodiazepine discontinuation in the control group set at 48%, a relative risk reduction of 20%, a type I error of 2.5%, a type II error of 10% (90% power), and diversity of 86% as observed in the trials. The diversity‐adjusted required information size was 9448 participants, and the Trial Sequential Analysis‐adjusted confidence interval could not be estimated due to lack of information. The blue line represents the cumulative Z‐score of the meta‐analysis. The green lines represent the conventional statistical boundaries of P = 5%. The cumulative Z‐curve (blue line) does not cross the conventional statistical boundaries. The trial sequential monitoring boundaries and the diversity‐adjusted required information size are not shown as the accrued number of participants only amounted to 221/9448 (2.34%), showing that insufficient information has been accrued.

Trial Sequential Analysis of comparison: 6 Paroxetine versus placebo, outcome: 6.2 Benzodiazepine withdrawal symptoms Benzodiazepine Withdrawal Symptom Questionnaire (BWSQ). Trial Sequential Analysis on benzodiazepine withdrawal symptoms assessed with BWSQ assessing a minimal relevant clinical difference (MIREDIF) of 2.25 points, and a variance of 20 points (empirical data), was performed based on a type I error of 1.25%, a type II error of 10% (90% power), and diversity of 0%. The diversity‐adjusted required information size (DARIS) was 229 participants, and the Trial Sequential Analysis‐adjusted confidence interval is ‐7.18 to 0.05. The blue line represents the cumulative Z‐score of the meta‐analysis. The green lines represent the conventional statistical boundaries of P = 0.05. The red inward‐sloping lines represent the trial sequential monitoring boundaries. The cumulative Z‐curve touches the trial sequential monitoring boundaries, indicating that sufficient information was provided.
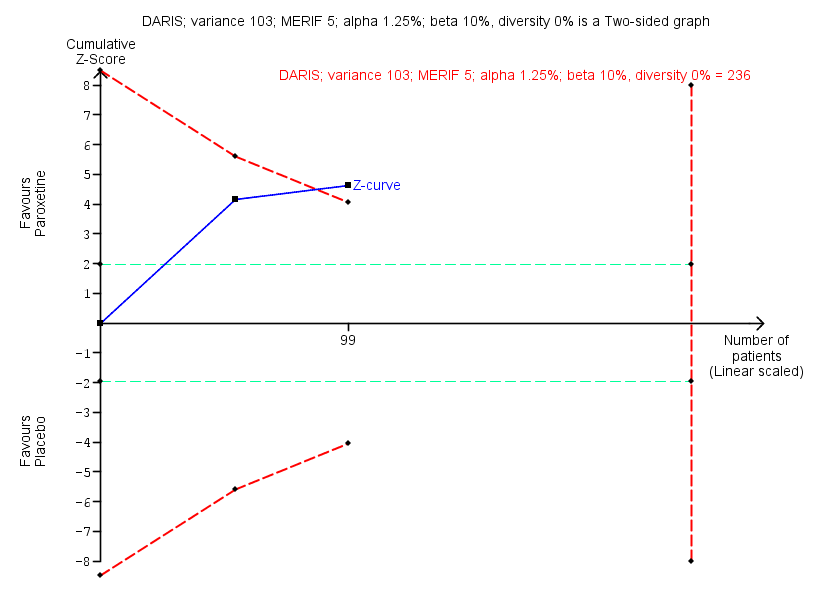
Trial Sequential Analysis of comparison: 6 Paroxetine versus placebo, outcome: 6.3 Anxiety, Hamilton Anxiety Rating Scale (HAM‐A). Trial Sequential Analysis on anxiety evaluated with HAM‐A assessing a minimal relevant clinical difference (MIREDIF) of 5 points, and a variance of 103 points, was performed based on a type I error of 1.25%, a type II error of 10% (90% power), and diversity of 0%. The diversity‐adjusted required information size (DARIS) was 236 participants, and the Trial Sequential Analysis‐adjusted confidence interval is ‐12.72 to ‐0.80. The blue line represents the cumulative Z‐score of the meta‐analysis. The green lines represent the conventional statistical boundaries of P = 0.05. The red inward‐sloping lines represent the trial sequential monitoring boundaries. The cumulative Z‐curve crosses the trial sequential monitoring boundaries, indicating that sufficient information was provided.
Results were similar if analysing placebo or no intervention separately as control group.
One trial evaluated benzodiazepine withdrawal symptoms at longest follow‐up, where no effect of paroxetine could be found (Analysis 6.4: 1 study, 54 participants; MD ‐0.13 points, 95% CI ‐4.03 to 3.77; GRADE: very low‐quality evidence). For non‐serious adverse events, no differences between intervention groups were found (Analysis 6.6).
Please see summary of findings Table 6.
Tricyclic antidepressants (dosulepin, imipramine, or trazodone) versus placebo
Four trials, each with a small sample size, investigated tricyclic antidepressants versus placebo (Rickels 2000; Rynn 2003; Tyrer 1996; Zhang 2013). It was possible to perform a meta‐analysis for benzodiazepine discontinuation at end of intervention, where results showed no difference between intervention groups (Analysis 7.1: 2 studies, 105 participants; RR 0.82, 95% CI 0.52 to 1.28; GRADE: very low‐quality evidence). Trial Sequential Analysis showed that the diversity‐adjusted required information size of 1343 participants was not reached, as the accrued number of participants was only 105 (7.81%), indicating that insufficient information has been obtained (Figure 8).

Trial Sequential Analysis of comparison: 7 Tricyclic antidepressants versus placebo, outcome: 7.1 Benzodiazepine discontinuation. Trial Sequential Analysis on benzodiazepine discontinuation in two trials was performed based on the proportion with benzodiazepine discontinuation in the control group set at 48%, a relative risk reduction (RRR) of 20%, a type I error of 2.5%, a type II error of 10% (90% power), and diversity of 0% as observed in the trials. The diversity‐adjusted required information size (DARIS) was 1343 participants, and the Trial Sequential Analysis‐adjusted confidence interval is 0.20 to 7.55. The blue line represents the cumulative Z‐score of the meta‐analysis. The green lines represent the conventional statistical boundaries of P = 5%. The cumulative Z‐curve (blue line) does not cross the conventional statistical boundaries or the trial sequential monitoring boundaries (red dotted lines), and the diversity‐adjusted required information size is not met, showing that insufficient information has been accrued.
Two trials reported symptoms of anxiety (Rynn 2003; Zhang 2013), with no difference between intervention groups (Analysis 7.2: 2 studies, 66 participants; MD ‐10.38 points, 95% CI ‐25.96 to 5.20; GRADE: very low‐quality evidence). These data were associated with significant heterogeneity, the reason for which was that the Chinese study, Zhang 2013, reported results that were far more positive in favour of the experimental drug than the remainder of the included trials.
The following outcomes were reported in one trial each: benzodiazepine discontinuation at longest follow‐up, showing a beneficial effect of tricyclic antidepressants (Analysis 7.3: 1 study, 47 participants; RR 2.20, 95% CI 1.27 to 3.82; GRADE: low‐quality evidence); benzodiazepine withdrawal symptoms (Analysis 7.4: 1 study, 38 participants; MD ‐19.78 points, 95% CI ‐20.25 to ‐19.31; GRADE: very low‐quality evidence) with a significant difference between groups in favour of tricyclic antidepressants; relapse to benzodiazepine use, showing no intervention effect (Analysis 7.5: 1 study, 36 participants; RR 2.00, 95% CI 0.73 to 5.47); and discontinuation due to adverse events, also showing no intervention effect (Analysis 7.6: 2 studies, 134 participants; RR 1.16, 95% CI 0.42 to 3.21; GRADE: very low‐quality evidence).
Please see summary of findings Table 7.
Alpidem versus placebo
Two smaller trials compared alpidem (an anxiolytic drug from the imidazopyridine family) with placebo for benzodiazepine discontinuation (Cassano 1996; Lader 1993), showing a disadvantage of alpidem for this outcome at end of intervention (Analysis 8.1: 1 study, 25 participants; RR 0.41, 95% CI 0.17 to 0.99; NNTH 2.3 participants; GRADE: low‐quality evidence). We calculated the required information size to be 1918 participants, using a control event proportion of 48%, a relative risk reduction of 20%, type I error of 2.5%, power of 90%, and a diversity of 30%. Withdrawal syndrome was also analysed, suggesting a disadvantage of alpidem (Analysis 8.2: 1 study, 145 participants; RR 4.86, 95% CI 1.12 to 21.14; NNTH 5.9 participants; GRADE: low‐quality evidence). We calculated the required information size to be 9202 participants, using a control event proportion of 15%, a relative risk reduction of 20%, type I error of 2.5%, power of 90%, and a diversity of 30%. We could not perform Trial Sequential Analysis for either of these outcomes because they were only reported in one trial.
It was possible to perform a meta‐analysis for symptoms of anxiety, as assessed by HAM‐A, where no intervention effect was found (Analysis 8.3: 2 studies, 170 participants; MD ‐1.60 points, 95% CI ‐4.64 to 1.45; GRADE: low‐quality evidence). In Trial Sequential Analysis using a minimal relevant clinical difference of 5 points, variance of 103 points, type I error of 1.25%, type II error of 10% (90% power), and diversity of 0% (Figure 9), we found that the diversity‐adjusted required information size of 235 participants was not met. However, the cumulative Z‐curve crossed the beta‐spending (futility) boundaries, indicating that an intervention effect, if any, was less than 5 points.

Trial Sequential Analysis of comparison: 8 Alpidem versus placebo, outcome: 8.3 Anxiety, Hamilton Anxiety Rating Scale (HAM‐A). Trial Sequential Analysis on anxiety evaluated with HAM‐A assessing a minimal relevant clinical difference (MIREDIF) of 5 points, and a variance of 103 points (empirical data), was performed based on a type I error of 1.25%, a type II error of 10% (90% power), and diversity of 0%. The diversity‐adjusted required information size (DARIS) was 235 participants, and the Trial Sequential Analysis‐adjusted confidence interval is ‐6.28 to 3.08. The blue line represents the cumulative Z‐score of the meta‐analysis. The green lines represent the conventional statistical boundaries of P = 0.05. The red inward‐sloping lines represent the trial sequential alpha‐spending monitoring boundaries, while the red outward‐sloping lines represent the beta‐spending (futility) boundaries. The cumulative Z‐curve crosses the beta‐spending (futility) boundaries, showing that an intervention effect, if any, is less than 5 points.
One trial reported relapse to benzodiazepine use, suggesting no intervention effect (Analysis 8.4: 1 study, 145 participants; RR 0.33, 95% CI 0.09 to 1.20; GRADE: very low‐quality evidence).
Please see summary of findings Table 8.
Buspirone versus placebo
Four trials examined use of buspirone compared with placebo (Ashton 1990; Lader 1987; Morton 1995; Udelman 1990), each with a small sample size. It was possible to perform a meta‐analysis with regard to benzodiazepine discontinuation at end of intervention, finding no difference between intervention groups (Analysis 9.1: 4 studies, 143 participants; RR 0.82, 95% CI 0.49 to 1.37; GRADE: low‐quality evidence). Trial Sequential Analysis showed that the diversity‐adjusted required information size of 3381 participants was not reached, as the accrued number of participants was only 143 (4.23%), showing that insufficient information has been accrued (Figure 10).
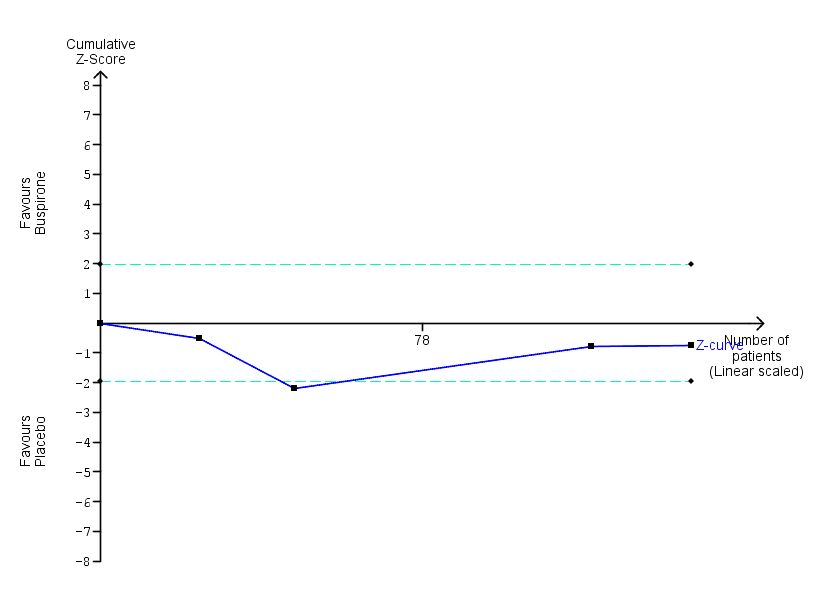
Trial Sequential Analysis of comparison: 9 Buspirone versus placebo, outcome: 9.1 Benzodiazepine discontinuation. Trial Sequential Analysis on benzodiazepine discontinuation in four trials was performed based on the proportion with benzodiazepine discontinuation in the control group set at 48%, a relative risk reduction of 20%, a type I error of 2.5%, a type II error of 10% (90% power), and diversity of 60% as observed in the trials. The diversity‐adjusted required information size was 3381 participants, and the Trial Sequential Analysis‐adjusted confidence interval could not be estimated due to lack of information. The blue line represents the cumulative Z‐score of the meta‐analysis. The green lines represent the conventional statistical boundaries of P = 5%. The cumulative Z‐curve (blue line) does not cross the conventional statistical boundaries. The trial sequential monitoring boundaries and the diversity‐adjusted required information size are not shown, as the accrued number of participants only amounted to 143/3381 (4.23%), showing that insufficient information has been accrued.
There was also no intervention effect for anxiety symptoms at end of intervention (Analysis 9.2: 2 studies, 41 participants; SMD 0.18, 95% CI ‐0.50 to 0.86; GRADE: very low‐quality evidence).
The following outcomes were reported in only one trial each and with no sign of intervention effect: benzodiazepine withdrawal symptoms at end of intervention (Analysis 9.3: 1 study, 17 participants; MD 4.69 points, 95% CI ‐14.47 to 23.85; GRADE: very low‐quality evidence), benzodiazepine discontinuation at longest follow‐up (Analysis 9.4: 1 study, 23 participants; RR 0.60, 95% CI 0.34 to 1.05; GRADE: low‐quality evidence), benzodiazepine withdrawal symptoms at longest follow‐up (Analysis 9.5: 1 study, 15 participants; MD ‐1.34 points, 95% CI ‐14.31 to 11.63; GRADE: very low‐quality evidence), and symptoms of anxiety at longest follow‐up (Analysis 9.6: 1 study, 12 participants; MD 2.75 points, 95% CI ‐2.83 to 8.33; GRADE: very low‐quality evidence). Due to marked differences in among‐participant variability, we did not re‐express the SMD using one of the specific measurement instruments.
Results for benzodiazepine discontinuation (Analysis 9.1) were associated with significant heterogeneity, with the most marked differences between Ashton 1990 (more in favour of placebo or no difference between groups) and Udelman 1990 (more in favour of buspirone). We could not identify any obvious reasons for the observed heterogeneity.
Please see summary of findings Table 9.
Melatonin versus placebo
Four trials of small to moderate sample size investigated melatonin (both short‐acting and prolonged release formulation) versus placebo for benzodiazepine discontinuation at end of intervention (Baandrup 2016; Garfinkel 1999; Peles 2007; Vissers 2007). It was possible to perform a meta‐analysis for benzodiazepine discontinuation at end of intervention, which showed no difference between intervention groups (Analysis 10.1: 4 studies, 219 participants; RR 1.20, 95% CI 0.73 to 1.96; GRADE: very low‐quality evidence). Trial Sequential Analysis showed that the diversity‐adjusted required information size of 3438 participants was not reached, as the accrued number of participants was only 219 (6.37%), showing that insufficient information has been accrued (Figure 11).
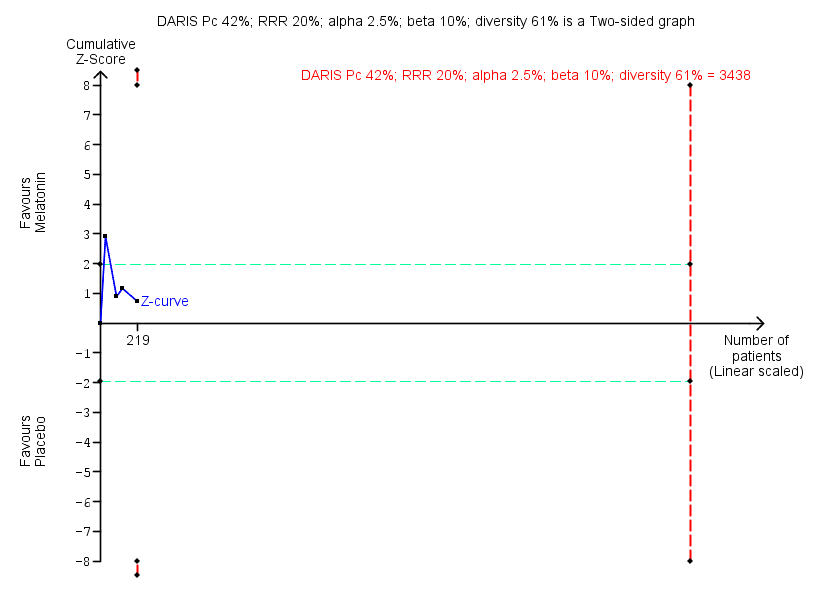
Trial Sequential Analysis of comparison: 10 Melatonin versus placebo, outcome: 10.1 Benzodiazepine discontinuation. Trial Sequential Analysis on benzodiazepine discontinuation in four trials was performed based on the proportion with benzodiazepine discontinuation in the control group set at 48%, a relative risk reduction (RRR) of 20%, a type I error of 2.5%, a type II error of 10% (90% power), and diversity of 61% as observed in the trials. The diversity‐adjusted required information size (DARIS) was 3438 participants, and the Trial Sequential Analysis‐adjusted confidence interval is 0.11 to 6.25. The blue line represents the cumulative Z‐score of the meta‐analysis. The green lines represent the conventional statistical boundaries of P = 5%. The cumulative Z‐curve (blue line) does not cross the conventional statistical boundaries or the trial sequential monitoring boundaries (red dotted lines), and the diversity‐adjusted required information size is not met, showing that insufficient information has been accrued.
We found no intervention effect likewise for insomnia (Analysis 10.2: 3 studies, 150 participants; SMD ‐1.23, 95% CI ‐2.70 to 0.23; GRADE: very low‐quality evidence) or discontinuation due to adverse events (Analysis 10.3: 2 studies, 120 participants; RR 2.10, 95% CI 0.20 to 22.26; GRADE: very low‐quality of evidence). The following outcomes were reported in one trial each: benzodiazepine discontinuation at longest follow‐up, showing no intervention effect (Analysis 10.4: 1 study, 38 participants; RR 1.03, 95% CI 0.47 to 2.27; GRADE: very low‐quality evidence), adverse events, with no intervention effect (Analysis 10.5: 1 study, 86 participants; RR 0.97, 95% CI 0.52 to 1.82; GRADE: very low‐quality evidence), and relapse to benzodiazepine use, also with no indication of intervention effect (Analysis 10.6: 1 study, 38 participants; RR 1.80, 95% CI 0.37 to 8.68; GRADE: very low‐quality evidence).
When evaluating insomnia, the results were associated with significant heterogeneity; this was explained by Garfinkel 1999, which showed a markedly significant result in favour of melatonin, whereas the two other the trials included in this meta‐analysis showed no or a much smaller difference between intervention groups (Baandrup 2016; Peles 2007). We could not identify any obvious reason for this observed heterogeneity, other than Garfinkel 1999 being the only one of these studies involved with a pharmaceutical company.
Please see summary of findings Table 10.
Flumazenil versus placebo
Three small trials examined whether flumazenil can aid in benzodiazepine discontinuation (Gerra 1993; Gerra 2002; Harrison‐Read 1996). It was possible to perform a meta‐analysis for benzodiazepine withdrawal symptoms at end of intervention, which showed a beneficial effect of flumazenil (Analysis 11.1: 3 studies, 58 participants; SMD ‐0.95, 95% CI ‐1.71 to ‐0.19; GRADE: very low‐quality evidence). Due to marked differences in among‐participant variability, we did not re‐express the SMD using one of the specific measurement instruments. We could not calculate the required information size because the trials did not use the same instrument, and results were reported using SMD.
The following outcomes were reported in one trial each: symptoms of anxiety, with results in favour of flumazenil (Analysis 11.2: 1 study, 18 participants; MD ‐1.30 points, 95% CI ‐2.28 to ‐0.32; GRADE: very low‐quality evidence) and benzodiazepine mean dose at end of intervention, with no difference between groups (Analysis 11.3: 1 study, 10 participants; MD ‐3.70 points, 95% CI ‐22.06 to 14.66; GRADE: very low‐quality evidence). As previously noted, one of the flumazenil studies was ended prematurely due to severe withdrawal symptoms elicited during the trial procedure (Harrison‐Read 1996).
When evaluating benzodiazepine withdrawal symptoms, the results were associated with significant heterogeneity for which no obvious reason could be identified.
Please see summary of findings Table 11.
Propranolol versus placebo
One small trial evaluated propranolol versus placebo (Tyrer 1981). Only data on relapse to benzodiazepine use at end of intervention were available, showing no effect of the study intervention (Analysis 12.1: 1 study, 40 participants; RR 0.64, 95% CI 0.31 to 1.30; GRADE: very low‐quality evidence).
Progesterone versus placebo
One small trial evaluated this comparison (Schweizer 1995), reporting no intervention effect on benzodiazepine discontinuation at end of intervention (Analysis 13.1: 1 study, 35 participants; RR 1.15, 95% CI 0.52 to 2.54; GRADE: very low‐quality evidence), and a difference between groups in favour of placebo for non‐serious adverse events (Analysis 13.2: 1 study, 35 participants; RR 3.13, 95% CI 1.15 to 8.54; GRADE: very low‐quality evidence).
For benzodiazepine discontinuation, we calculated the required information size to be 1918 participants, using a control event proportion of 48%, a relative risk reduction of 20%, type I error of 2.5%, power of 90%, and a diversity of 30%. We could not perform Trial Sequential Analysis as there was only one trial.
Please see summary of findings Table 12.
Magnesium aspartate versus placebo
One moderately sized trial compared magnesium aspartate (a mineral supplement) with placebo (Hantouche 1998), and found a beneficial effect of placebo for benzodiazepine discontinuation (Analysis 14.1: 1 study, 144 participants; RR 0.80, 95% CI 0.66 to 0.96; NNTH 5.8; GRADE: very low‐quality evidence), but no difference between groups for symptoms of anxiety (Analysis 14.2: 1 study, 144 participants; MD ‐0.80 points, 95% CI ‐2.73 to 1.13; GRADE: very low‐quality evidence), benzodiazepine relapse (Analysis 14.3: 1 study, 144 participants; RR 0.93, 95% CI 0.46 to 1.87; GRADE: very low‐quality evidence), non‐serious adverse events (Analysis 14.4: 1 study, 144 participants; RR 0.49, 95% CI 0.18 to 1.35; GRADE: very low‐quality evidence), and discontinuation due to adverse events (Analysis 14.5: 1 study, 144 participants; RR 0.40, 95% CI 0.13 to 1.18; GRADE: very low‐quality evidence).
For benzodiazepine discontinuation, we calculated the required information size to be 1918 participants, using a control event proportion of 48%, a relative risk reduction of 20%, type I error of 2.5%, power of 90%, and a diversity of 30%. We could not perform Trial Sequential Analysis because there was only one trial.
Please see summary of findings Table 13.
Homeopathic drugs versus placebo
One small trial compared two homeopathic drugs ("Homéogène 46" and "Sédatif PC") versus placebo (Cialdella 2001), from which it was only possible to extract data on benzodiazepine discontinuation. When combining the homeopathic drugs as one experimental group versus placebo, the results showed no intervention effect (Analysis 15.1: 1 study, 51 participants; RR 0.79, 95% CI 0.36 to 1.70; GRADE: very low‐quality evidence).
For benzodiazepine discontinuation, we calculated the required information size to be 1918 participants, using a control event proportion of 48%, a relative risk reduction of 20%, type I error of 2.5%, power of 90%, and a diversity of 30%. We could not perform Trial Sequential Analysis as there was only one trial.
Please see summary of findings Table 14.
Carbamazepine versus tricyclic antidepressant (tianeptine)
Only one trial examined this comparison (Kornowski 2002), finding no additional effect of carbamazepine compared with tricyclic antidepressant for benzodiazepine discontinuation at end of intervention (Analysis 16.1: 1 study, 48 participants; RR 1.00, 95% CI 0.78 to 1.29; GRADE: low‐quality evidence) and relapse to benzodiazepine use (Analysis 16.2: 1 study, 48 participants; RR 1.00, 95% CI 0.28 to 3.54; GRADE: low‐quality evidence). Data on other outcomes specified in this review were not available.
Please see summary of findings Table 15.
Bromazepam versus cyamemazine
One moderately sized trial examined bromazepam versus cyamemazine (a first‐generation antipsychotic drug of the phenothiazine class with anxiolytic efficacy) (Lemoine 2006), reporting a difference in favour of cyamemazine for relapse to benzodiazepine use (Analysis 17.1: 1 study, 124 participants; RR 0.33, 95% CI 0.14 to 0.78; GRADE: very low‐quality evidence), but no difference between groups for symptoms of anxiety (Analysis 17.2: 1 study, 160 participants; MD 0.50 points, 95% CI ‐1.23 to 2.23) or discontinuation due to adverse events (Analysis 17.3: 1 study, 160 participants; RR 2.87, 95% CI 0.79 to 10.44; GRADE: very low‐quality evidence). We identified a difference in favour of bromazepam for non‐serious adverse events (Analysis 17.4: 1 study, 160 participants; RR 1.68, 95% CI 1.01 to 2.78; GRADE: very low‐quality evidence).
Zopiclone versus flunitrazepam
One small trial examined zopiclone (a short‐acting benzodiazepine‐like drug) versus flunitrazepam (a potent intermediate‐acting benzodiazepine, which in many countries is no longer in use due to severe side effects) (Pat‐Horenczyk 1998), finding no indication of intervention effect for relapse to benzodiazepine use (Analysis 18.1: 1 study, 18 participants; RR 1.05, 95% CI 0.23 to 4.78; GRADE: very low‐quality evidence). Data on other outcomes specified in this review were not available.
Ondansetron, atenolol, and gabapentin
As described above, we were not able to extract data from three trials: Romach 1998 (ondansetron versus placebo), Saul 1989 (atenolol versus placebo), and Mariani 2016 (gabapentin versus placebo). None of these trials reported any effect on applied outcome measures of the respective experimental drug.
Adverse events
In general, adverse events were insufficiently reported, making it difficult to reliably assess the tolerability and safety of the investigated compounds.
Discusión
Resumen de los resultados principales
Se incluyeron 38 ensayos en esta revisión, pero sólo fue posible obtener los datos de 35 ensayos que investigaron 18 diferentes comparaciones para el resultado primario de interrupción de las benzodiazepinas. El valproato y los antidepresivos tricíclicos parecieron tener un posible efecto positivo sobre la interrupción de las benzodiazepinas, mientras que los síntomas de abstinencia parecieron mejorar potencialmente con la pregabalina, el captodiamo, la paroxetina, los antidepresivos tricíclicos y el flumazenil. Los siguientes agentes farmacológicos parecieron reducir potencialmente los síntomas de ansiedad: carbamazepina, pregabalina, captodiamo, paroxetina y flumazenil. Sin embargo, flumazenil pareció asociarse con un alto riesgo de precipitar un síndrome de abstinencia grave, ya que uno de los ensayos concluyó prematuramente debido a la observación de eventos adversos no aceptables (reacciones graves de pánico). El alpidem pareció empeorar la probabilidad de interrumpir las benzodiazepinas y la intensidad de los síntomas de abstinencia, y no se debe investigar de manera adicional para este uso. Asimismo, el aspartato de magnesio pareció reducir la proporción de participantes que interrumpieron las benzodiazepinas.
Compleción y aplicabilidad general de las pruebas
Una gran variedad de fármacos diferentes se han investigado en varios ensayos pequeños, muchos de los cuales son de calidad dudosa, con un informe deficiente y, por lo tanto, con dificultades para extraer los datos. Por lo tanto, el grupo de datos no está completo, pero los autores de la revisión consideraron que brindan una representación completa del grupo actual de evidencia en esta área. Una proporción significativa de los ensayos incluidos fueron iniciados y patrocinados por la industria farmacéutica.
Calidad de la evidencia
En general la calidad de la evidencia se consideró muy baja o baja, que representa estudios pequeños de metodología generalmente deficiente y con un informe deficiente. Debido especialmente a que la fecha de los ensayos fue más antigua, no cumplieron las normas modernas de diseño e informe. Como resultado, las conclusiones de esta revisión se deben considerar provisionales en el mejor de los casos. No obstante, la revisión proporciona un resumen del estado actual de la evidencia y señala las instrucciones futuras para los estudios de investigación sobre el desarrollo de farmacoterapias para la dependencia a las benzodiazepinas.
Sesgos potenciales en el proceso de revisión
Algunos de los autores de esta revisión también fueron autores de uno de los ensayos incluidos (Baandrup 2016). La extracción de los datos y la evaluación del riesgo de sesgo de este ensayo particular las realizaron LB y JR; este último no estuvo involucrado en el ensayo. El ensayo examinó la melatonina para la interrupción de las benzodiazepinas. El metanálisis no mostró efectos beneficios de la melatonina en ninguno de los resultados informados, por lo que no se considera que la participación de autores de la revisión en uno los ensayos incluidos haya sesgado los resultados de manera alguna.
En el protocolo de la presente revisión se planificó centrar las evaluaciones solamente en los ensayos controlados aleatorios (Baandrup 2015). Al hacerlo, es bien conocido que se hace un énfasis exagerado en los posibles efectos beneficiosos de las intervenciones evaluadas y se corre el riesgo de pasar por alto los efectos perjudiciales. Los motivos para estas consideraciones son que en general los efectos perjudiciales no se informan de manera adecuada en los ensayos controlados aleatorios, y que habitualmente se necesitan estudios observacionales para detectar los eventos adversos poco frecuentes que aparecen de manera tardía (Ioannidis 2004; Ioannidis 2009).
No se realizaron búsquedas en bases de datos relevantes de autoridades reguladoras porque no se planificó en el protocolo. Por lo tanto, se podrían haber pasado por alto ensayos relevantes que no se han publicado en la bibliografía habitual. Es muy probable que dichos ensayos presenten alto riesgo de mostrar efectos de la intervención neutros o negativos, pero para la completitud de las búsquedas bibliográficas en las actualizaciones futuras de esta revisión se deben realizar búsquedas en las bases de datos de las autoridades reguladoras (Schroll 2015).
Acuerdos y desacuerdos con otros estudios o revisiones
Se han publicado varias revisiones sobre temas similares. Una revisión Cochrane que investigó intervenciones farmacológicas para el tratamiento de la monodependencia a las benzodiazepinas en ámbitos ambulatorios en 35 estudios señaló un posible valor de la carbamazepina, pero concluyó que se necesitan estudios controlados más grandes (Denis 2006). La revisión actual confirma el posible valor de la carbamazepina, pero el grupo de evidencia es demasiado débil para traducir lo anterior en una recomendación clínica.
Voshaar 2006 encontró que el aumento de la interrupción sistemática de las benzodiazepinas con imipramina fue superior a la interrupción sistemática sola. Esta conclusión coincide con la revisión actual, aunque solo fue posible identificar un posible efecto beneficioso posible del antidepresivo tricíclico en la interrupción de las benzodiazepinas al seguimiento más largo, según los datos de un único ensayo. Además, se informó un posible efecto favorable de los antidepresivos tricíclicos con respecto a los síntomas de abstinencia de las benzodiazepinas, pero también se basó en un solo ensayo con resultados que en general parecieron sesgados.
En Parr 2009, la reducción gradual de la dosis más las farmacoterapias substitutas se compararon con la reducción gradual de la dosis sola, limitada a ámbitos de práctica general y ambulatoria. Una evaluación de la tasa de interrupción de las benzodiazepinas en 18 estudios encontró que fue promisoria para unas pocas farmacoterapias substitutas (melatonina, paroxetina, trazodona y valproato), pero concluyó que la evidencia actual no fue suficiente para apoyar su uso. La presente revisión, que incluyó varios estudios más, agrega un valor adicional a la indicación de investigación adicional sobre este tema, e incluye potencialmente la paroxetina (u otros inhibidores selectivos de la recaptación de serotonina [ISRS]) y el valproato.
Darker 2015 examinó intervenciones psicosociales para la abstinencia de las benzodiazepinas y encontró un efecto beneficioso a corto plazo del tratamiento cognitivo‐conductual que no persistió por más de tres meses. Las entrevistas motivacionales no tuvieron efecto sobre la interrupción de las benzodiazepinas. Otras intervenciones promisorias investigadas en ensayos individuales incluyeron una carta adaptada del médico general, una entrevista estandarizada y técnicas de relajación. Por lo tanto, y desafortunadamente, la base de evidencia para el uso de intervenciones no farmacológicas para facilitar el uso de las benzodiazepinas no es mucho más convincente que la evidencia obtenida en la revisión actual sobre las intervenciones farmacológicas.

Study flow diagram.

Risk of bias summary: review authors' judgements about each risk of bias item for each included study.
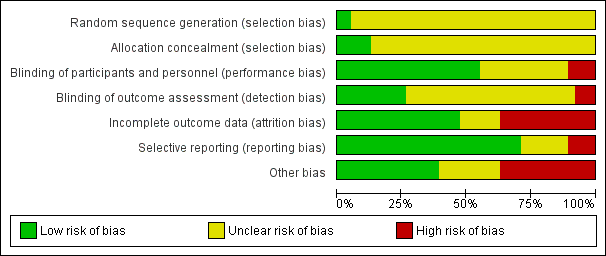
Risk of bias graph: review authors' judgements about each risk of bias item presented as percentages across all included studies.

Trial Sequential Analysis of comparison: 2 Carbamazepine versus placebo, outcome: 2.1 Benzodiazepine discontinuation. Trial Sequential Analysis on benzodiazepine discontinuation in three trials was performed based on the proportion with benzodiazepine discontinuation in the control group set at 48%, a relative risk reduction (RRR) of 20%, a type I error of 2.5%, a type II error of 10% (90% power), and diversity of 36% as observed in the trials. The diversity‐adjusted required information size (DARIS) was 2109 participants, and the Trial Sequential Analysis‐adjusted confidence interval is 0.24 to 2.38. The blue line represents the cumulative Z‐score of the meta‐analysis. The green lines represent the conventional statistical boundaries of P = 5%. The cumulative Z‐curve (blue line) touches the conventional statistical boundaries, but does not cross the trial sequential monitoring boundaries, and the diversity‐adjusted required information size is not met, showing that insufficient information has been accrued.

Trial Sequential Analysis of comparison: 6 Paroxetine versus placebo, outcome: 6.1 Benzodiazepine discontinuation. Trial Sequential Analysis on benzodiazepine discontinuation in three trials was performed based on the proportion with benzodiazepine discontinuation in the control group set at 48%, a relative risk reduction of 20%, a type I error of 2.5%, a type II error of 10% (90% power), and diversity of 86% as observed in the trials. The diversity‐adjusted required information size was 9448 participants, and the Trial Sequential Analysis‐adjusted confidence interval could not be estimated due to lack of information. The blue line represents the cumulative Z‐score of the meta‐analysis. The green lines represent the conventional statistical boundaries of P = 5%. The cumulative Z‐curve (blue line) does not cross the conventional statistical boundaries. The trial sequential monitoring boundaries and the diversity‐adjusted required information size are not shown as the accrued number of participants only amounted to 221/9448 (2.34%), showing that insufficient information has been accrued.

Trial Sequential Analysis of comparison: 6 Paroxetine versus placebo, outcome: 6.2 Benzodiazepine withdrawal symptoms Benzodiazepine Withdrawal Symptom Questionnaire (BWSQ). Trial Sequential Analysis on benzodiazepine withdrawal symptoms assessed with BWSQ assessing a minimal relevant clinical difference (MIREDIF) of 2.25 points, and a variance of 20 points (empirical data), was performed based on a type I error of 1.25%, a type II error of 10% (90% power), and diversity of 0%. The diversity‐adjusted required information size (DARIS) was 229 participants, and the Trial Sequential Analysis‐adjusted confidence interval is ‐7.18 to 0.05. The blue line represents the cumulative Z‐score of the meta‐analysis. The green lines represent the conventional statistical boundaries of P = 0.05. The red inward‐sloping lines represent the trial sequential monitoring boundaries. The cumulative Z‐curve touches the trial sequential monitoring boundaries, indicating that sufficient information was provided.

Trial Sequential Analysis of comparison: 6 Paroxetine versus placebo, outcome: 6.3 Anxiety, Hamilton Anxiety Rating Scale (HAM‐A). Trial Sequential Analysis on anxiety evaluated with HAM‐A assessing a minimal relevant clinical difference (MIREDIF) of 5 points, and a variance of 103 points, was performed based on a type I error of 1.25%, a type II error of 10% (90% power), and diversity of 0%. The diversity‐adjusted required information size (DARIS) was 236 participants, and the Trial Sequential Analysis‐adjusted confidence interval is ‐12.72 to ‐0.80. The blue line represents the cumulative Z‐score of the meta‐analysis. The green lines represent the conventional statistical boundaries of P = 0.05. The red inward‐sloping lines represent the trial sequential monitoring boundaries. The cumulative Z‐curve crosses the trial sequential monitoring boundaries, indicating that sufficient information was provided.

Trial Sequential Analysis of comparison: 7 Tricyclic antidepressants versus placebo, outcome: 7.1 Benzodiazepine discontinuation. Trial Sequential Analysis on benzodiazepine discontinuation in two trials was performed based on the proportion with benzodiazepine discontinuation in the control group set at 48%, a relative risk reduction (RRR) of 20%, a type I error of 2.5%, a type II error of 10% (90% power), and diversity of 0% as observed in the trials. The diversity‐adjusted required information size (DARIS) was 1343 participants, and the Trial Sequential Analysis‐adjusted confidence interval is 0.20 to 7.55. The blue line represents the cumulative Z‐score of the meta‐analysis. The green lines represent the conventional statistical boundaries of P = 5%. The cumulative Z‐curve (blue line) does not cross the conventional statistical boundaries or the trial sequential monitoring boundaries (red dotted lines), and the diversity‐adjusted required information size is not met, showing that insufficient information has been accrued.

Trial Sequential Analysis of comparison: 8 Alpidem versus placebo, outcome: 8.3 Anxiety, Hamilton Anxiety Rating Scale (HAM‐A). Trial Sequential Analysis on anxiety evaluated with HAM‐A assessing a minimal relevant clinical difference (MIREDIF) of 5 points, and a variance of 103 points (empirical data), was performed based on a type I error of 1.25%, a type II error of 10% (90% power), and diversity of 0%. The diversity‐adjusted required information size (DARIS) was 235 participants, and the Trial Sequential Analysis‐adjusted confidence interval is ‐6.28 to 3.08. The blue line represents the cumulative Z‐score of the meta‐analysis. The green lines represent the conventional statistical boundaries of P = 0.05. The red inward‐sloping lines represent the trial sequential alpha‐spending monitoring boundaries, while the red outward‐sloping lines represent the beta‐spending (futility) boundaries. The cumulative Z‐curve crosses the beta‐spending (futility) boundaries, showing that an intervention effect, if any, is less than 5 points.

Trial Sequential Analysis of comparison: 9 Buspirone versus placebo, outcome: 9.1 Benzodiazepine discontinuation. Trial Sequential Analysis on benzodiazepine discontinuation in four trials was performed based on the proportion with benzodiazepine discontinuation in the control group set at 48%, a relative risk reduction of 20%, a type I error of 2.5%, a type II error of 10% (90% power), and diversity of 60% as observed in the trials. The diversity‐adjusted required information size was 3381 participants, and the Trial Sequential Analysis‐adjusted confidence interval could not be estimated due to lack of information. The blue line represents the cumulative Z‐score of the meta‐analysis. The green lines represent the conventional statistical boundaries of P = 5%. The cumulative Z‐curve (blue line) does not cross the conventional statistical boundaries. The trial sequential monitoring boundaries and the diversity‐adjusted required information size are not shown, as the accrued number of participants only amounted to 143/3381 (4.23%), showing that insufficient information has been accrued.

Trial Sequential Analysis of comparison: 10 Melatonin versus placebo, outcome: 10.1 Benzodiazepine discontinuation. Trial Sequential Analysis on benzodiazepine discontinuation in four trials was performed based on the proportion with benzodiazepine discontinuation in the control group set at 48%, a relative risk reduction (RRR) of 20%, a type I error of 2.5%, a type II error of 10% (90% power), and diversity of 61% as observed in the trials. The diversity‐adjusted required information size (DARIS) was 3438 participants, and the Trial Sequential Analysis‐adjusted confidence interval is 0.11 to 6.25. The blue line represents the cumulative Z‐score of the meta‐analysis. The green lines represent the conventional statistical boundaries of P = 5%. The cumulative Z‐curve (blue line) does not cross the conventional statistical boundaries or the trial sequential monitoring boundaries (red dotted lines), and the diversity‐adjusted required information size is not met, showing that insufficient information has been accrued.

Comparison 1 Valproate versus placebo or no intervention, Outcome 1 Benzodiazepine discontinuation, end of intervention.

Comparison 1 Valproate versus placebo or no intervention, Outcome 2 Relapse to benzodiazepine use, end of intervention.
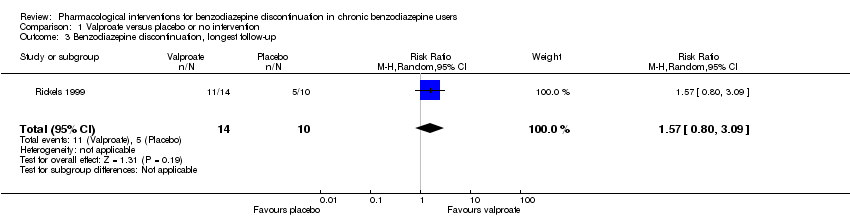
Comparison 1 Valproate versus placebo or no intervention, Outcome 3 Benzodiazepine discontinuation, longest follow‐up.

Comparison 1 Valproate versus placebo or no intervention, Outcome 4 Relapse to benzodiazepine use, longest follow‐up.
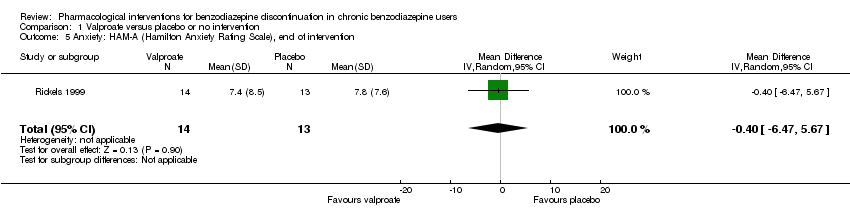
Comparison 1 Valproate versus placebo or no intervention, Outcome 5 Anxiety: HAM‐A (Hamilton Anxiety Rating Scale), end of intervention.

Comparison 1 Valproate versus placebo or no intervention, Outcome 6 Benzodiazepine withdrawal symptoms, end of intervention.
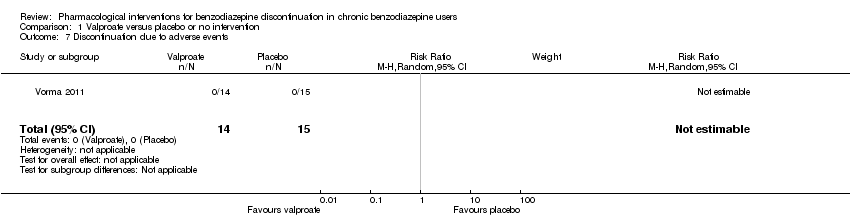
Comparison 1 Valproate versus placebo or no intervention, Outcome 7 Discontinuation due to adverse events.
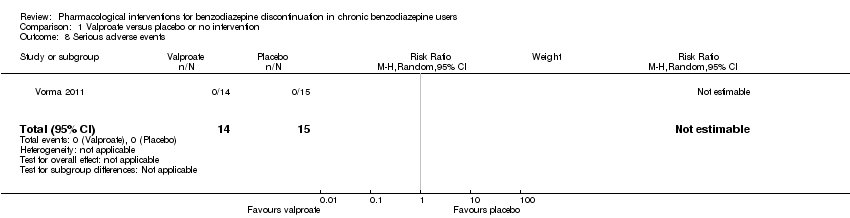
Comparison 1 Valproate versus placebo or no intervention, Outcome 8 Serious adverse events.

Comparison 2 Carbamazepine versus placebo, Outcome 1 Benzodiazepine discontinuation, end of intervention.

Comparison 2 Carbamazepine versus placebo, Outcome 2 Benzodiazepine withdrawal symptoms.

Comparison 2 Carbamazepine versus placebo, Outcome 3 Benzodiazepine discontinuation, longest follow‐up.

Comparison 2 Carbamazepine versus placebo, Outcome 4 Relapse to benzodiazepine use.

Comparison 2 Carbamazepine versus placebo, Outcome 5 Serious adverse events.
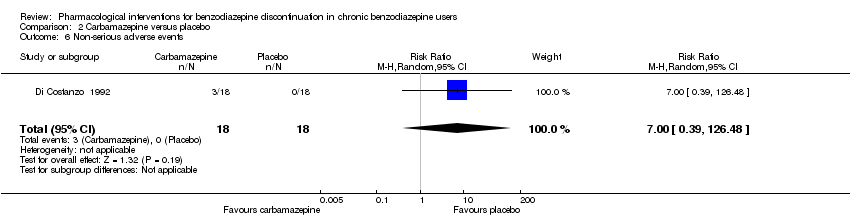
Comparison 2 Carbamazepine versus placebo, Outcome 6 Non‐serious adverse events.

Comparison 2 Carbamazepine versus placebo, Outcome 7 Anxiety, HAM‐A.
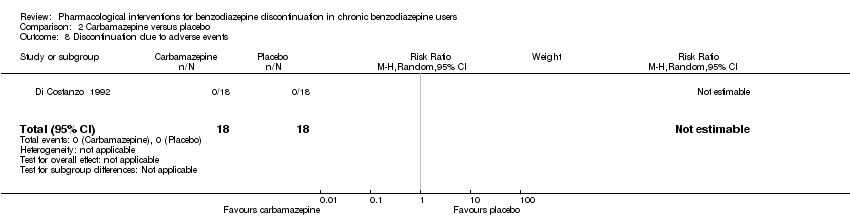
Comparison 2 Carbamazepine versus placebo, Outcome 8 Discontinuation due to adverse events.

Comparison 3 Lithium versus placebo, Outcome 1 Benzodiazepine discontinuation.
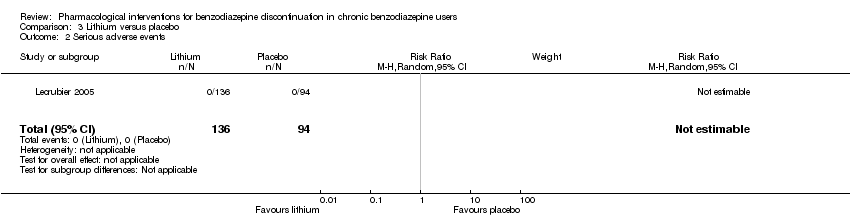
Comparison 3 Lithium versus placebo, Outcome 2 Serious adverse events.
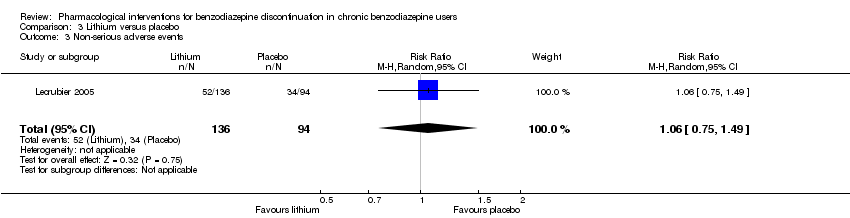
Comparison 3 Lithium versus placebo, Outcome 3 Non‐serious adverse events.
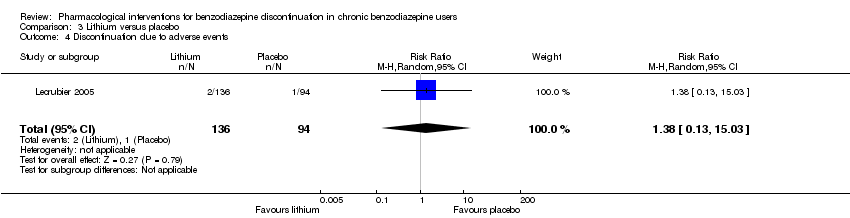
Comparison 3 Lithium versus placebo, Outcome 4 Discontinuation due to adverse events.

Comparison 4 Pregabalin versus placebo, Outcome 1 Benzodiazepine discontinuation, end of intervention.
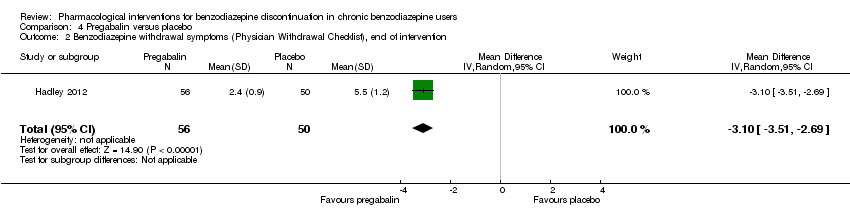
Comparison 4 Pregabalin versus placebo, Outcome 2 Benzodiazepine withdrawal symptoms (Physician Withdrawal Checklist), end of intervention.
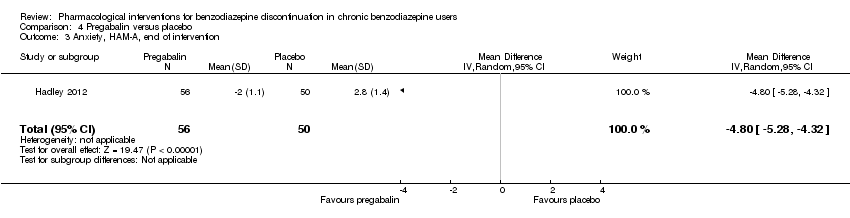
Comparison 4 Pregabalin versus placebo, Outcome 3 Anxiety, HAM‐A, end of intervention.

Comparison 4 Pregabalin versus placebo, Outcome 4 Serious adverse events.

Comparison 4 Pregabalin versus placebo, Outcome 5 Non‐serious adverse events.
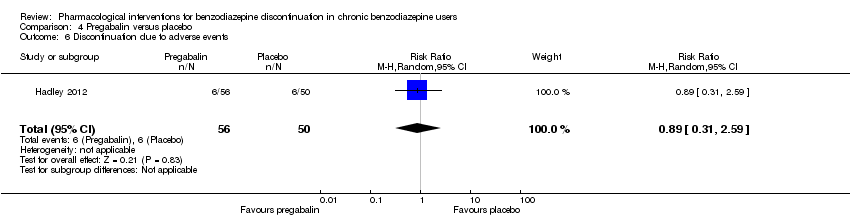
Comparison 4 Pregabalin versus placebo, Outcome 6 Discontinuation due to adverse events.
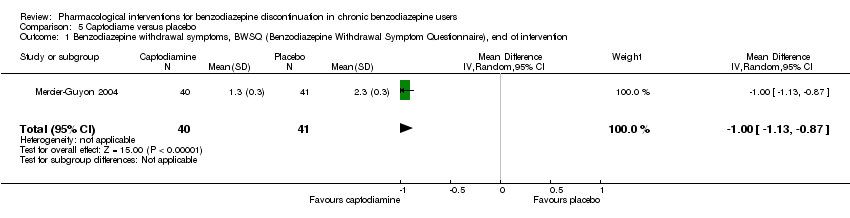
Comparison 5 Captodiame versus placebo, Outcome 1 Benzodiazepine withdrawal symptoms, BWSQ (Benzodiazepine Withdrawal Symptom Questionnaire), end of intervention.

Comparison 5 Captodiame versus placebo, Outcome 2 Anxiety, HAM‐A, end of intervention.

Comparison 5 Captodiame versus placebo, Outcome 3 Serious adverse events.
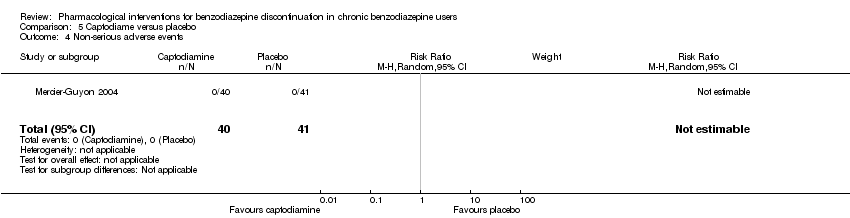
Comparison 5 Captodiame versus placebo, Outcome 4 Non‐serious adverse events.

Comparison 6 Paroxetine versus placebo or no intervention, Outcome 1 Benzodiazepine discontinuation, end of intervention.

Comparison 6 Paroxetine versus placebo or no intervention, Outcome 2 Benzodiazepine withdrawal symptoms: BWSQ, end of intervention.

Comparison 6 Paroxetine versus placebo or no intervention, Outcome 3 Anxiety: HAM‐A, end of intervention.
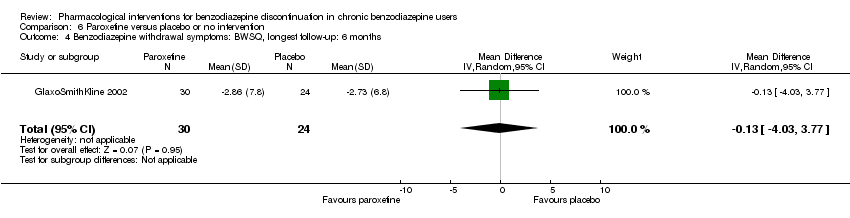
Comparison 6 Paroxetine versus placebo or no intervention, Outcome 4 Benzodiazepine withdrawal symptoms: BWSQ, longest follow‐up: 6 months.

Comparison 6 Paroxetine versus placebo or no intervention, Outcome 5 Serious adverse events.
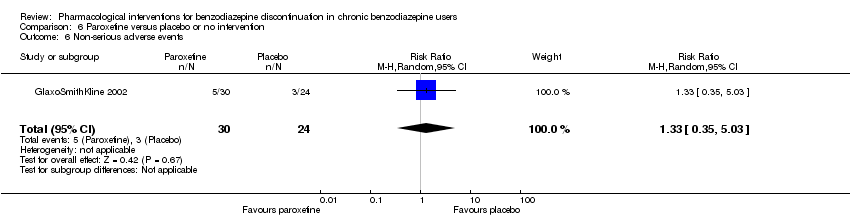
Comparison 6 Paroxetine versus placebo or no intervention, Outcome 6 Non‐serious adverse events.

Comparison 7 Tricyclic antidepressants versus placebo, Outcome 1 Benzodiazepine discontinuation, end of intervention.
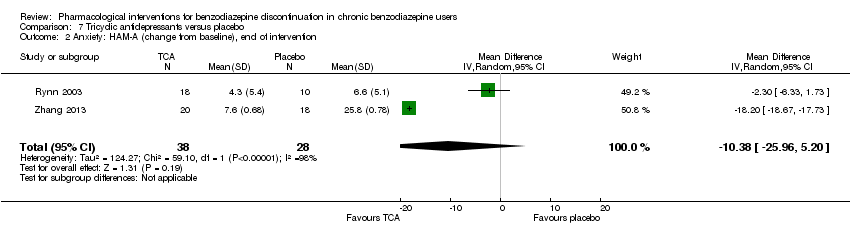
Comparison 7 Tricyclic antidepressants versus placebo, Outcome 2 Anxiety: HAM‐A (change from baseline), end of intervention.

Comparison 7 Tricyclic antidepressants versus placebo, Outcome 3 Benzodiazepine discontinuation, longest follow‐up.
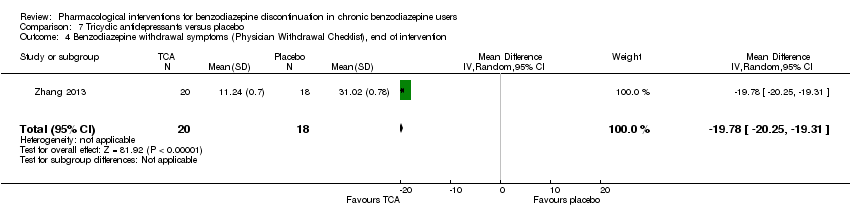
Comparison 7 Tricyclic antidepressants versus placebo, Outcome 4 Benzodiazepine withdrawal symptoms (Physician Withdrawal Checklist), end of intervention.
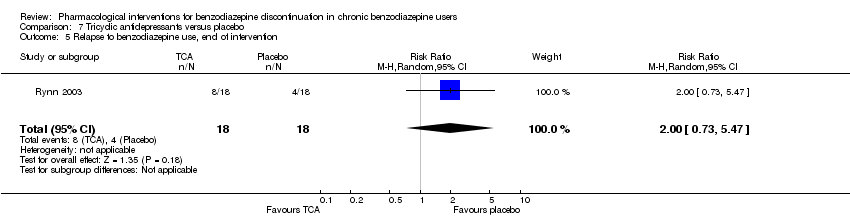
Comparison 7 Tricyclic antidepressants versus placebo, Outcome 5 Relapse to benzodiazepine use, end of intervention.

Comparison 7 Tricyclic antidepressants versus placebo, Outcome 6 Discontinuation due to adverse events.
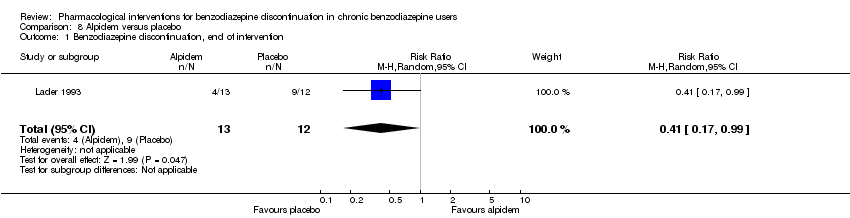
Comparison 8 Alpidem versus placebo, Outcome 1 Benzodiazepine discontinuation, end of intervention.

Comparison 8 Alpidem versus placebo, Outcome 2 Withdrawal syndrome (clinical diagnosis), end of intervention.

Comparison 8 Alpidem versus placebo, Outcome 3 Anxiety, HAM‐A, end of intervention.

Comparison 8 Alpidem versus placebo, Outcome 4 Relapse to benzodiazepine use, end of intervention.

Comparison 8 Alpidem versus placebo, Outcome 5 Serious adverse events.

Comparison 8 Alpidem versus placebo, Outcome 6 Discontinuation due to adverse events.

Comparison 9 Buspirone versus placebo, Outcome 1 Benzodiazepine discontinuation, end of intervention.
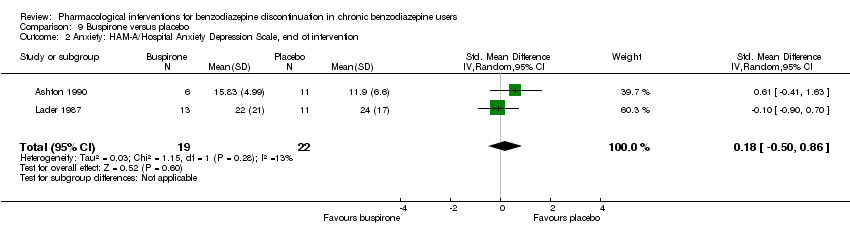
Comparison 9 Buspirone versus placebo, Outcome 2 Anxiety: HAM‐A/Hospital Anxiety Depression Scale, end of intervention.
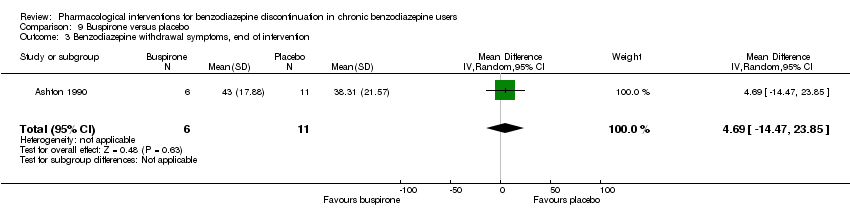
Comparison 9 Buspirone versus placebo, Outcome 3 Benzodiazepine withdrawal symptoms, end of intervention.

Comparison 9 Buspirone versus placebo, Outcome 4 Benzodiazepine discontinuation, longest follow‐up.
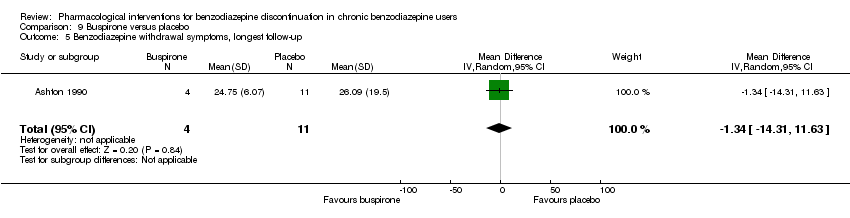
Comparison 9 Buspirone versus placebo, Outcome 5 Benzodiazepine withdrawal symptoms, longest follow‐up.
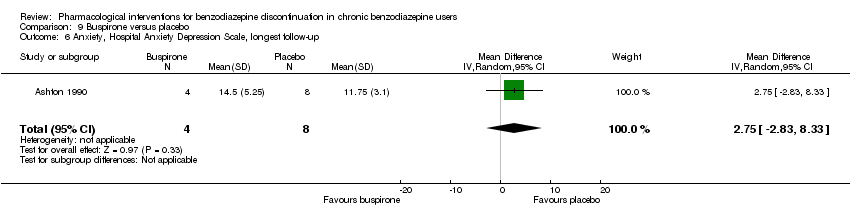
Comparison 9 Buspirone versus placebo, Outcome 6 Anxiety, Hospital Anxiety Depression Scale, longest follow‐up.

Comparison 9 Buspirone versus placebo, Outcome 7 Discontinuation due to adverse events.

Comparison 10 Melatonin versus placebo, Outcome 1 Benzodiazepine discontinuation, end of intervention.

Comparison 10 Melatonin versus placebo, Outcome 2 Insomnia.
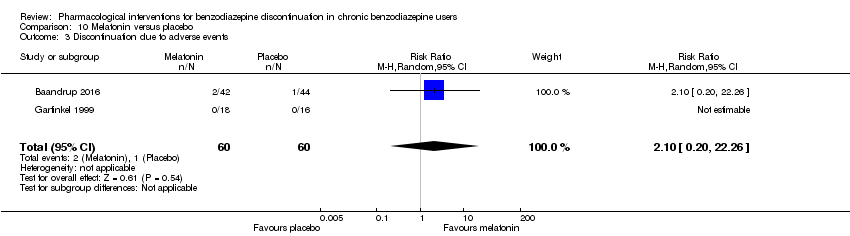
Comparison 10 Melatonin versus placebo, Outcome 3 Discontinuation due to adverse events.

Comparison 10 Melatonin versus placebo, Outcome 4 Benzodiazepine discontinuation, longest follow‐up.
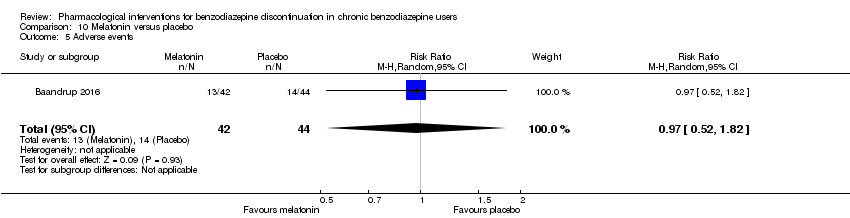
Comparison 10 Melatonin versus placebo, Outcome 5 Adverse events.
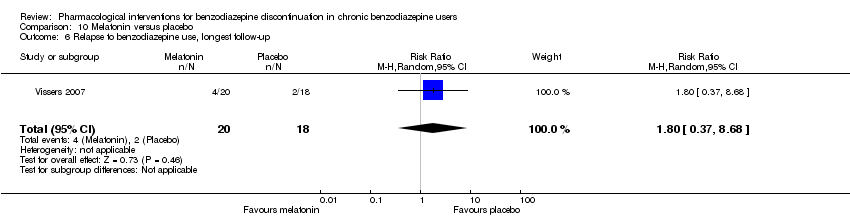
Comparison 10 Melatonin versus placebo, Outcome 6 Relapse to benzodiazepine use, longest follow‐up.
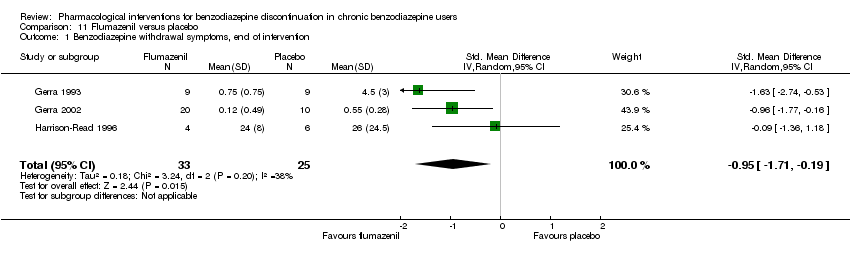
Comparison 11 Flumazenil versus placebo, Outcome 1 Benzodiazepine withdrawal symptoms, end of intervention.

Comparison 11 Flumazenil versus placebo, Outcome 2 Anxiety, HAM‐D (Hamilton Depression Rating Scale), end of intervention.

Comparison 11 Flumazenil versus placebo, Outcome 3 Benzodiazepine mean dose, end of intervention.

Comparison 12 Propranolol versus placebo, Outcome 1 Relapse to benzodiazepine use, end of intervention: 2 weeks.

Comparison 13 Progesterone versus placebo, Outcome 1 Benzodiazepine discontinuation, end of intervention.

Comparison 13 Progesterone versus placebo, Outcome 2 Non‐serious adverse events.
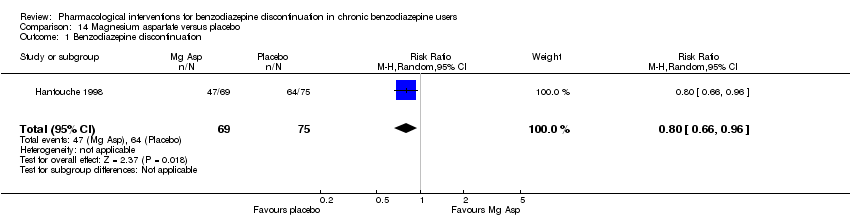
Comparison 14 Magnesium aspartate versus placebo, Outcome 1 Benzodiazepine discontinuation.

Comparison 14 Magnesium aspartate versus placebo, Outcome 2 Anxiety.

Comparison 14 Magnesium aspartate versus placebo, Outcome 3 Relapse to benzodiazepine use.
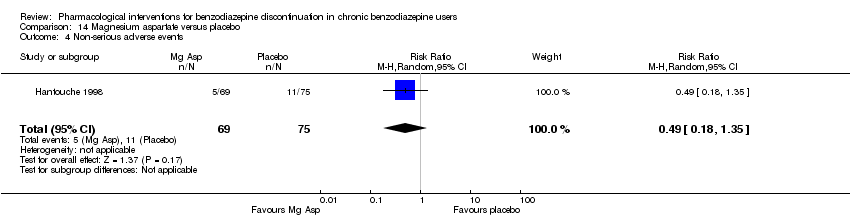
Comparison 14 Magnesium aspartate versus placebo, Outcome 4 Non‐serious adverse events.

Comparison 14 Magnesium aspartate versus placebo, Outcome 5 Discontinuation due to adverse events.
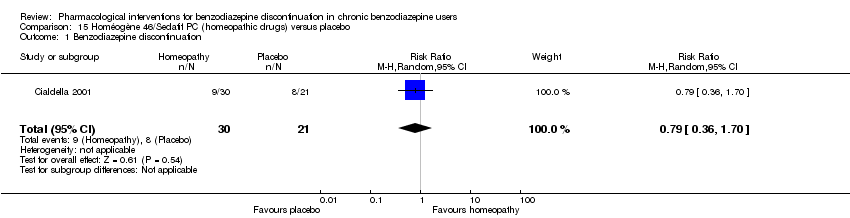
Comparison 15 Homéogène 46/Sedatif PC (homeopathic drugs) versus placebo, Outcome 1 Benzodiazepine discontinuation.
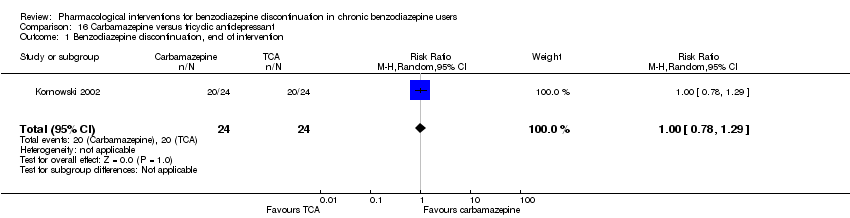
Comparison 16 Carbamazepine versus tricyclic antidepressant, Outcome 1 Benzodiazepine discontinuation, end of intervention.
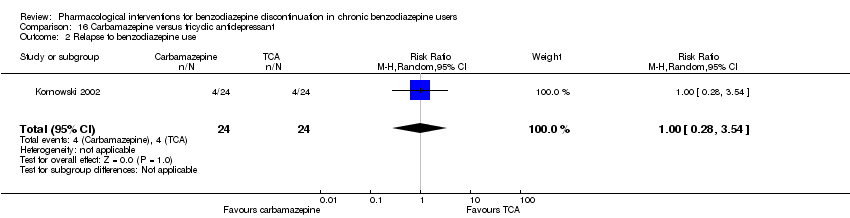
Comparison 16 Carbamazepine versus tricyclic antidepressant, Outcome 2 Relapse to benzodiazepine use.
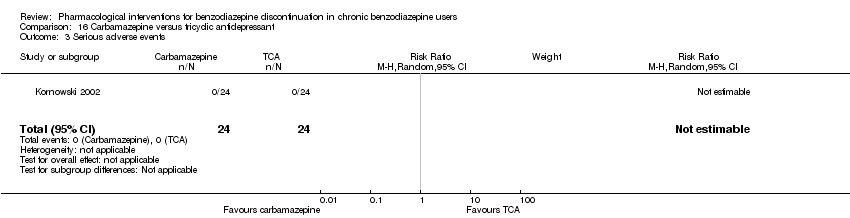
Comparison 16 Carbamazepine versus tricyclic antidepressant, Outcome 3 Serious adverse events.
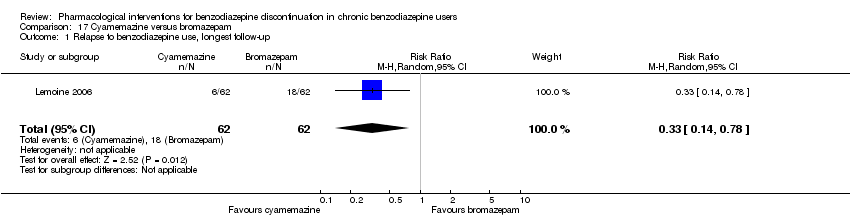
Comparison 17 Cyamemazine versus bromazepam, Outcome 1 Relapse to benzodiazepine use, longest follow‐up.

Comparison 17 Cyamemazine versus bromazepam, Outcome 2 Anxiety: Maximum amplitude of rebound (HAM‐A), end of intervention.

Comparison 17 Cyamemazine versus bromazepam, Outcome 3 Discontinuation due to adverse events.
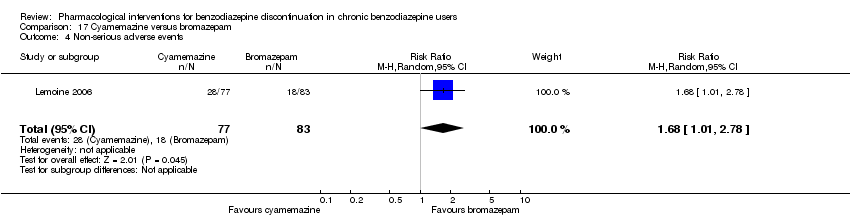
Comparison 17 Cyamemazine versus bromazepam, Outcome 4 Non‐serious adverse events.

Comparison 18 Zopiclone versus flunitrazepam, Outcome 1 Relapse to benzodiazepine use, longest follow‐up.
| Valproate compared with placebo or no intervention for benzodiazepine discontinuation in chronic benzodiazepine users | ||||||
| Patient or population: adults who withdraw from chronic benzodiazepine use | ||||||
| Outcomes | Illustrative comparative risks* (95% CI) | Relative effect | No. of participants | Quality of the evidence | Comments | |
| Assumed risk | Corresponding risk | |||||
| Placebo or no intervention | Valproate | |||||
| Benzodiazepine discontinuation, end of intervention | Study population | RR 2.55 | 27 | ⊕⊝⊝⊝ | The required information size of 1918 participants was not met. | |
| 679 per 1000 | 1000 per 1000 | |||||
| Benzodiazepine discontinuation, longest follow‐up | Study population | RR 1.57 | 24 | ⊕⊝⊝⊝ | ||
| 500 per 1000 | 785 per 1000 | |||||
| Benzodiazepine withdrawal symptoms, end of intervention | The mean benzodiazepine withdrawal symptoms in the intervention groups was | 56 | ⊕⊝⊝⊝ | SMD ‐0.15 (‐0.68 to 0.37). As a rule of thumb, 0.2 represents a small effect, 0.5 a moderate effect, and 0.8 a large effect. | ||
| Benzodiazepine withdrawal symptoms, longest follow‐up | Not estimable | ‐ | (0 study) | No included study measured this outcome. | ||
| *The basis for the assumed risk (e.g. the median control group risk across studies) is provided in footnotes. The corresponding risk (and its 95% confidence interval) is based on the assumed risk in the comparison group and the relative effect of the intervention (and its 95% CI). | ||||||
| GRADE Working Group grades of evidence | ||||||
| 1No details provided regarding random sequence generation, allocation concealment, and blinding, leading to unclear risk of selection bias, performance and detection bias (downgraded one level). | ||||||
| Carbamazepine compared with placebo for benzodiazepine discontinuation in chronic benzodiazepine users | ||||||
| Patient or population: adults who withdraw from chronic benzodiazepine use | ||||||
| Outcomes | Illustrative comparative risks* (95% CI) | Relative effect | No. of participants | Quality of the evidence | Comments | |
| Assumed risk | Corresponding risk | |||||
| Placebo | Carbamazepine | |||||
| Benzodiazepine discontinuation, end of intervention | Study population | RR 1.33 | 147 | ⊕⊕⊝⊝ | Trial Sequential Analysis showed that only 7.0% of the required information size (2109) was reached, indicating that insufficient information has been obtained. | |
| 480 per 1000 | 638 per 1000 | |||||
| Benzodiazepine discontinuation, longest follow‐up | Study population | RR 1.41 | 40 | ⊕⊝⊝⊝ | ||
| 524 per 1000 | 739 per 1000 | |||||
| Benzodiazepine withdrawal symptoms, end of intervention | The mean benzodiazepine withdrawal symptoms in the intervention groups was | 76 | ⊕⊝⊝⊝ | SMD ‐1.14 (‐2.43 to 0.16). As a rule of thumb, 0.2 represents a small effect, 0.5 a moderate effect, and 0.8 a large effect. | ||
| Benzodiazepine withdrawal symptoms, longest follow‐up | Not estimable | ‐ | (0 study) | No included study measured this outcome. | ||
| *The basis for the assumed risk (e.g. the median control group risk across studies) is provided in footnotes. The corresponding risk (and its 95% confidence interval) is based on the assumed risk in the comparison group and the relative effect of the intervention (and its 95% CI). | ||||||
| GRADE Working Group grades of evidence | ||||||
| 1Unclear risk of selection bias. One study with high risk of attrition, reporting, and other bias (downgraded one level). | ||||||
| Lithium compared with placebo for benzodiazepine discontinuation in chronic benzodiazepine users | ||||||
| Patient or population: adults who withdraw from chronic benzodiazepine use | ||||||
| Outcomes | Illustrative comparative risks* (95% CI) | Relative effect | No. of participants | Quality of the evidence | Comments | |
| Assumed risk | Corresponding risk | |||||
| Placebo | Lithium | |||||
| Benzodiazepine discontinuation, end of intervention | Study population | RR 1.05 | 230 | ⊕⊕⊝⊝ | The required information size of 1918 participants was not met. | |
| 617 per 1000 | 648 per 1000 | |||||
| Benzodiazepine discontinuation, longest follow‐up | Not estimable | ‐ | ‐ | (0 study) | ‐ | No included studies measured this outcome. |
| Benzodiazepine withdrawal symptoms, end of intervention | Not estimable | ‐ | ‐ | (0 study) | ‐ | No included studies measured this outcome. |
| Benzodiazepine withdrawal symptoms, longest follow‐up | Not estimable | ‐ | ‐ | (0 study) | ‐ | No included study measured this outcome. |
| *The basis for the assumed risk (e.g. the median control group risk across studies) is provided in footnotes. The corresponding risk (and its 95% confidence interval) is based on the assumed risk in the comparison group and the relative effect of the intervention (and its 95% CI). | ||||||
| GRADE Working Group grades of evidence | ||||||
| 1Unclear risk of selection, attrition, and reporting bias (downgraded one level). | ||||||
| Pregabalin compared with placebo for benzodiazepine discontinuation in chronic benzodiazepine users | ||||||
| Patient or population: adults who withdraw from chronic benzodiazepine use | ||||||
| Outcomes | Illustrative comparative risks* (95% CI) | Relative effect | No. of participants | Quality of the evidence | Comments | |
| Assumed risk | Corresponding risk | |||||
| Placebo | Pregabalin | |||||
| Benzodiazepine discontinuation, end of intervention | Study population | RR 1.44 | 106 | ⊕⊝⊝⊝ | The required information size of 1918 participants was not met. | |
| 360 per 1000 | 518 per 1000 | |||||
| Benzodiazepine discontinuation, longest follow‐up | Not estimable | ‐ | ‐ | (0 study) | ‐ | No included studies measured this outcome. |
| Benzodiazepine withdrawal symptoms, Physician Withdrawal Checklist (PWCL), end of intervention | ‐ | The mean benzodiazepine withdrawal symptoms, PWCL, end of intervention in the intervention group was | ‐ | 106 | ⊕⊝⊝⊝ | MD ‐3.10 (‐3.51 to ‐2.69) |
| Benzodiazepine withdrawal symptoms, longest follow‐up | Not estimable | ‐ | ‐ | (0 study) | ‐ | No included study measured this outcome. |
| *The basis for the assumed risk (e.g. the median control group risk across studies) is provided in footnotes. The corresponding risk (and its 95% confidence interval) is based on the assumed risk in the comparison group and the relative effect of the intervention (and its 95% CI). | ||||||
| GRADE Working Group grades of evidence | ||||||
| 1Unclear risk of selection bias and high risk of attrition and other bias (downgraded two levels). | ||||||
| Captodiame compared with placebo for benzodiazepine discontinuation in chronic benzodiazepine users | ||||||
| Patient or population: adults who withdraw from chronic benzodiazepine use | ||||||
| Outcomes | Illustrative comparative risks* (95% CI) | Relative effect | No. of participants | Quality of the evidence | Comments | |
| Assumed risk | Corresponding risk | |||||
| Placebo | Captodiame | |||||
| Benzodiazepine discontinuation, end of intervention | Not estimable | ‐ | ‐ | (0 study) | ‐ | No included studies measured this outcome. |
| Benzodiazepine discontinuation, longest follow‐up | Not estimable | ‐ | ‐ | (0 study) | ‐ | No included studies measured this outcome. |
| Benzodiazepine withdrawal symptoms, Benzodiazepine Withdrawal Symptom Questionnaire (BWSQ), end of intervention | ‐ | The mean benzodiazepine withdrawal symptoms, BWSQ, end of intervention in the intervention group was | ‐ | 81 | ⊕⊝⊝⊝ | MD ‐1.00 (‐1.13 to ‐0.87) The required information size of 229 participants was not met. |
| Benzodiazepine withdrawal symptoms, longest follow‐up | Not estimable | ‐ | ‐ | (0 study) | ‐ | No included study measured this outcome. |
| *The basis for the assumed risk (e.g. the median control group risk across studies) is provided in footnotes. The corresponding risk (and its 95% confidence interval) is based on the assumed risk in the comparison group and the relative effect of the intervention (and its 95% CI). | ||||||
| GRADE Working Group grades of evidence | ||||||
| 1Unclear risk of selection and reporting bias. High risk of other bias (downgraded one level). | ||||||
| Paroxetine compared with placebo or no intervention for benzodiazepine discontinuation in chronic benzodiazepine users | ||||||
| Patient or population: adults who withdraw from chronic benzodiazepine use | ||||||
| Outcomes | Illustrative comparative risks* (95% CI) | Relative effect | No. of participants | Quality of the evidence | Comments | |
| Assumed risk | Corresponding risk | |||||
| Placebo or Control | Paroxetine | |||||
| Benzodiazepine discontinuation, end of intervention | Study population | RR 1.45 | 221 | ⊕⊝⊝⊝ | Trial Sequential Analysis showed that only 2.34% of the required information size (9448) was reached, indicating that insufficient information has been obtained. | |
| 504 per 1000 | 731 per 1000 | |||||
| Benzodiazepine discontinuation, longest follow‐up | Not estimable | ‐ | (0 study) | ‐ | No included study measured this outcome. | |
| Benzodiazepine withdrawal symptoms, BWSQ, end of intervention | ‐ | The mean benzodiazepine withdrawal symptoms, BWSQ, end of intervention in the intervention groups was | ‐ | 99 | ⊕⊝⊝⊝ | MD ‐3.57 (‐5.34 to ‐1.8). Trial Sequential Analysis showed that the required information size of 229 participants was not reached. However, the alpha‐spending boundaries for benefit were crossed, indicating that sufficient information was obtained, and the result was not due to random error. |
| Benzodiazepine withdrawal symptoms, BWSQ, longest follow‐up: 6 months | ‐ | The mean benzodiazepine withdrawal symptoms, BWSQ, longest follow‐up: 6 months in the intervention group was | ‐ | 54 | ⊕⊝⊝⊝ | MD ‐0.13 (‐4.03 to 3.77) |
| *The basis for the assumed risk (e.g. the median control group risk across studies) is provided in footnotes. The corresponding risk (and its 95% confidence interval) is based on the assumed risk in the comparison group and the relative effect of the intervention (and its 95% CI). | ||||||
| GRADE Working Group grades of evidence | ||||||
| 1Unclear risk of selection and attrition bias. High risk of performance, detection, reporting, and other bias (downgraded two levels). | ||||||
| Tricyclic antidepressants compared with placebo for benzodiazepine discontinuation in chronic benzodiazepine users | ||||||
| Patient or population: adults who withdraw from chronic benzodiazepine use | ||||||
| Outcomes | Illustrative comparative risks* (95% CI) | Relative effect | No. of participants | Quality of the evidence | Comments | |
| Assumed risk | Corresponding risk | |||||
| Placebo | Tricyclic antidepressants | |||||
| Benzodiazepine discontinuation, end of intervention | Study population | RR 0.82 | 105 | ⊕⊝⊝⊝ | Trial Sequential Analysis showed that only 7.82% of the required information size (1343) was reached, indicating that insufficient information has been obtained. | |
| 451 per 1000 | 370 per 1000 | |||||
| Benzodiazepine discontinuation, longest follow‐up | Study population | RR 2.2 | 47 | ⊕⊕⊝⊝ | ||
| 375 per 1000 | 825 per 1000 | |||||
| Benzodiazepine withdrawal symptoms, Physician Withdrawal Checklist, end of intervention | ‐ | The mean benzodiazepine withdrawal symptoms in the intervention group was | ‐ | 38 (1 study) | ⊕⊝⊝⊝ | MD ‐19.78 (‐20.25 to ‐19.31) |
| Benzodiazepine withdrawal symptoms, longest follow‐up | Not estimable | ‐ | ‐ | (0 study) | ‐ | No included study measured this outcome. |
| *The basis for the assumed risk (e.g. the median control group risk across studies) is provided in footnotes. The corresponding risk (and its 95% confidence interval) is based on the assumed risk in the comparison group and the relative effect of the intervention (and its 95% CI). | ||||||
| GRADE Working Group grades of evidence | ||||||
| 1Unclear risk of selection bias and high risk of attrition and other bias (downgraded one level). | ||||||
| Alpidem compared with placebo for benzodiazepine discontinuation in chronic benzodiazepine users | ||||||
| Patient or population: adults who withdraw from chronic benzodiazepine use | ||||||
| Outcomes | Illustrative comparative risks* (95% CI) | Relative effect | No. of participants | Quality of the evidence | Comments | |
| Assumed risk | Corresponding risk | |||||
| Placebo | Alpidem | |||||
| Benzodiazepine discontinuation, end of intervention | Study population | RR 0.41 | 25 | ⊕⊕⊝⊝ | The required information size of 1918 participants was not met. | |
| 750 per 1000 | 308 per 1000 | |||||
| Benzodiazepine discontinuation, longest follow‐up | Not estimable | ‐ | ‐ | (0 study) | ‐ | No included study measured this outcome. |
| Withdrawal syndrome (clinical diagnosis), end of intervention | Study population | RR 4.86 | 145 | ⊕⊝⊝⊝ | ||
| 29 per 1000 | 143 per 1000 | |||||
| Benzodiazepine withdrawal symptoms, longest follow‐up | Not estimable | ‐ | ‐ | (0 study) | ‐ | No included study measured this outcome. |
| *The basis for the assumed risk (e.g. the median control group risk across studies) is provided in footnotes. The corresponding risk (and its 95% confidence interval) is based on the assumed risk in the comparison group and the relative effect of the intervention (and its 95% CI). | ||||||
| GRADE Working Group grades of evidence | ||||||
| 1Required information size not met (downgraded two levels due to imprecision). 3Unclear risk of selection and other bias, high risk of attrition bias (downgraded one level) | ||||||
| Buspirone compared with placebo for benzodiazepine discontinuation in chronic benzodiazepine users | ||||||
| Patient or population: adults who withdraw from chronic benzodiazepine use | ||||||
| Outcomes | Illustrative comparative risks* (95% CI) | Relative effect | No. of participants | Quality of the evidence | Comments | |
| Assumed risk | Corresponding risk | |||||
| Placebo | Buspirone | |||||
| Benzodiazepine discontinuation, end of intervention | Study population | RR 0.82 | 143 | ⊕⊕⊝⊝ | Trial Sequential Analysis showed that only 4.23% of the required information size (3381) was reached, indicating that insufficient information has been obtained. | |
| 563 per 1000 | 462 per 1000 | |||||
| Benzodiazepine discontinuation, longest follow‐up | Study population | RR 0.60 | 23 | ⊕⊕⊝⊝ | ||
| 917 per 1000 | 550 per 1000 | |||||
| Benzodiazepine withdrawal symptoms, end of intervention | ‐ | The mean benzodiazepine withdrawal symptoms, end of intervention in the intervention groups was | ‐ | 17 | ⊕⊝⊝⊝ | MD 4.69 (‐14.47 to 23.87) |
| Benzodiazepine withdrawal symptoms, longest follow‐up | ‐ | The mean benzodiazepine withdrawal symptoms, longest follow‐up in the intervention groups was | ‐ | 15 | ⊕⊝⊝⊝ | MD ‐1.34 (‐14.31 to 11.63) |
| *The basis for the assumed risk (e.g. the median control group risk across studies) is provided in footnotes. The corresponding risk (and its 95% confidence interval) is based on the assumed risk in the comparison group and the relative effect of the intervention (and its 95% CI). | ||||||
| GRADE Working Group grades of evidence | ||||||
| 1Unclear risk of selection, performance, and reporting bias. High risk of attrition and other bias (downgraded one level). | ||||||
| Melatonin compared with placebo for benzodiazepine discontinuation in chronic benzodiazepine users | ||||||
| Patient or population: adults who withdraw from chronic benzodiazepine use | ||||||
| Outcomes | Illustrative comparative risks* (95% CI) | Relative effect | No. of participants | Quality of the evidence | Comments | |
| Assumed risk | Corresponding risk | |||||
| Placebo | Melatonin | |||||
| Benzodiazepine discontinuation, end of intervention | Study population | RR 1.20 | 219 | ⊕⊝⊝⊝ | Trial Sequential Analysis showed that only 6.37% of the required information size (3438) was reached, indicating that insufficient information has been obtained. | |
| 417 per 1000 | 500 per 1000 | |||||
| Benzodiazepine discontinuation, longest follow‐up | Study population | RR 1.03 | 38 | ⊕⊝⊝⊝ | ||
| 389 per 1000 | 401 per 1000 | |||||
| Benzodiazpine withdrawal symptoms, end of intervention | Not estimable | ‐ | ‐ | (0 study) | ‐ | No included study measured this outcome. |
| Benzodiazepine withdrawal symptoms, longest follow‐up | Not estimable | ‐ | ‐ | (0 study) | ‐ | No included study measured this outcome. |
| *The basis for the assumed risk (e.g. the median control group risk across studies) is provided in footnotes. The corresponding risk (and its 95% confidence interval) is based on the assumed risk in the comparison group and the relative effect of the intervention (and its 95% CI). | ||||||
| GRADE Working Group grades of evidence | ||||||
| 1Unclear risk of selection, attrition, and reporting bias. High risk of other bias (downgraded one level). | ||||||
| Flumazenil compared with placebo for benzodiazepine discontinuation in chronic benzodiazepine users | ||||||
| Patient or population: adults who withdraw from chronic benzodiazepine use | ||||||
| Outcomes | Illustrative comparative risks* (95% CI) | Relative effect | No. of participants | Quality of the evidence | Comments | |
| Assumed risk | Corresponding risk | |||||
| Placebo | Flumazenil | |||||
| Benzodiazepine discontinuation, end of intervention | Not estimable | ‐ | ‐ | (0 study) | ‐ | No included study measured this outcome. |
| Benzodiazepine discontinuation, longest follow‐up | Not estimable | ‐ | ‐ | (0 study) | ‐ | No included study measured this outcome. |
| Benzodiazepine withdrawal symptoms, end of intervention | ‐ | The mean benzodiazepine withdrawal symptoms, end of intervention in the intervention groups was | ‐ | 58 | ⊕⊝⊝⊝ | SMD ‐0.95 (‐1.71 to ‐0.19) As a rule of thumb, 0.2 represents a small effect, 0.5 a moderate effect, and 0.8 a large effect. |
| Benzodiazepine withdrawal symptoms, longest follow‐up | Not estimable | ‐ | ‐ | (0 study) | ‐ | No included study measured this outcome. |
| *The basis for the assumed risk (e.g. the median control group risk across studies) is provided in footnotes. The corresponding risk (and its 95% confidence interval) is based on the assumed risk in the comparison group and the relative effect of the intervention (and its 95% CI). | ||||||
| GRADE Working Group grades of evidence | ||||||
| 1Unclear risk of selection bias and high risk of performance, detection, and other bias (downgraded one level). | ||||||
| Progesterone compared with placebo for benzodiazepine discontinuation in chronic benzodiazepine users | ||||||
| Patient or population: adults who withdraw from chronic benzodiazepine use | ||||||
| Outcomes | Illustrative comparative risks* (95% CI) | Relative effect | No. of participants | Quality of the evidence | Comments | |
| Assumed risk | Corresponding risk | |||||
| Placebo | Progesterone | |||||
| Benzodiazepine discontinuation, end of intervention | Study population | RR 1.15 | 35 | ⊕⊝⊝⊝ | The required information size of 1918 participants was not met. | |
| 417 per 1000 | 479 per 1000 | |||||
| Benzodiazepine discontinuation, longest follow‐up | Not estimable | ‐ | ‐ | (0 study) | ‐ | No included study measured this outcome. |
| Benzodiazepine withdrawal symptoms, end of intervention | Not estimable | ‐ | ‐ | (0 study) | ‐ | No included study measured this outcome. |
| Benzodiazepine withdrawal symptoms, longest follow‐up | Not estimable | ‐ | ‐ | (0 study) | ‐ | No included study measured this outcome. |
| *The basis for the assumed risk (e.g. the median control group risk across studies) is provided in footnotes. The corresponding risk (and its 95% confidence interval) is based on the assumed risk in the comparison group and the relative effect of the intervention (and its 95% CI). | ||||||
| GRADE Working Group grades of evidence | ||||||
| 1Unclear risk of selection and attrition bias (downgraded one level). | ||||||
| Magnesium aspartate compared with placebo for benzodiazepine discontinuation in chronic benzodiazepine users | ||||||
| Patient or population: adults who withdraw from chronic benzodiazepine use | ||||||
| Outcomes | Illustrative comparative risks* (95% CI) | Relative effect | No. of participants | Quality of the evidence | Comments | |
| Assumed risk | Corresponding risk | |||||
| Placebo | Magnesium aspartate | |||||
| Benzodiazepine discontinuation, end of intervention | Study population | RR 0.80 | 144 | ⊕⊝⊝⊝ | The required information size of 1918 participants was not met. | |
| 853 per 1000 | 683 per 1000 | |||||
| Benzodiazepine discontinuation, longest follow‐up | Not estimable | ‐ | ‐ | (0 study) | ‐ | No included study measured this outcome. |
| Benzodiazepine withdrawal symptoms, end of intervention | Not estimable | ‐ | ‐ | (0 study) | ‐ | No included study measured this outcome. |
| Benzodiazepine withdrawal symptoms, longest follow‐up | Not estimable | ‐ | ‐ | (0 study) | ‐ | No included study measured this outcome. |
| *The basis for the assumed risk (e.g. the median control group risk across studies) is provided in footnotes. The corresponding risk (and its 95% confidence interval) is based on the assumed risk in the comparison group and the relative effect of the intervention (and its 95% CI). | ||||||
| GRADE Working Group grades of evidence | ||||||
| 1Unclear risk of selection, detection, and attrition bias (downgraded one level). | ||||||
| Homéogène 46/Sedatif PC (homeopathic drugs) compared with placebo for benzodiazepine discontinuation in chronic benzodiazepine users | ||||||
| Patient or population: adults who withdraw from chronic benzodiazepine use | ||||||
| Outcomes | Illustrative comparative risks* (95% CI) | Relative effect | No. of participants | Quality of the evidence | Comments | |
| Assumed risk | Corresponding risk | |||||
| Placebo | Homéogène 46/Sedatif PC (homeopathic drugs) | |||||
| Benzodiazepine discontinuation, end of intervention | Study population | RR 0.79 | 51 | ⊕⊝⊝⊝ | The required information size was not met. | |
| 381 per 1000 | 301 per 1000 | |||||
| Benzodiazepine discontinuation, longest follow‐up | Not estimable | ‐ | ‐ | (0 study) | ‐ | No included study measured this outcome. |
| Benzodiazepine withdrawal symptoms, end of intervention | Not estimable | ‐ | ‐ | (0 study) | ‐ | No included study measured this outcome. |
| Benzodiazepine withdrawal symptoms, longest follow‐up | Not estimable | ‐ | ‐ | (0 study) | ‐ | No included study measured this outcome. |
| *The basis for the assumed risk (e.g. the median control group risk across studies) is provided in footnotes. The corresponding risk (and its 95% confidence interval) is based on the assumed risk in the comparison group and the relative effect of the intervention (and its 95% CI). | ||||||
| GRADE Working Group grades of evidence | ||||||
| 1Unclear risk of selection, attrition, and other bias (downgraded one level). | ||||||
| Carbamazepine compared with tricyclic antidepressant for benzodiazepine discontinuation in chronic benzodiazepine users | ||||||
| Patient or population: adults who withdraw from chronic benzodiazepine use | ||||||
| Outcomes | Illustrative comparative risks* (95% CI) | Relative effect | No. of participants | Quality of the evidence | Comments | |
| Assumed risk | Corresponding risk | |||||
| Tricyclic antidepressant | Carbamazepine | |||||
| Benzodiazepine discontinuation, end of intervention | Study population | RR 1.00 | 48 | ⊕⊕⊝⊝ | The required information size was not met. | |
| 833 per 1000 | 833 per 1000 | |||||
| Benzodiazepine discontinuation, longest follow‐up | Not estimable | ‐ | ‐ | (0 study) | ‐ | No included study measured this outcome. |
| Benzodiazepine withdrawal symptoms, end of intervention | Not estimable | ‐ | ‐ | (0 study) | ‐ | No included study measured this outcome. |
| Benzodiazepine withdrawal symptoms, longest follow‐up | Not estimable | ‐ | ‐ | (0 study) | ‐ | No included study measured this outcome. |
| *The basis for the assumed risk (e.g. the median control group risk across studies) is provided in footnotes. The corresponding risk (and its 95% confidence interval) is based on the assumed risk in the comparison group and the relative effect of the intervention (and its 95% CI). | ||||||
| GRADE Working Group grades of evidence | ||||||
| 1Unclear risk of selection, detection, and attrition bias (downgraded one level). | ||||||
| Outcome or subgroup title | No. of studies | No. of participants | Statistical method | Effect size |
| 1 Benzodiazepine discontinuation, end of intervention Show forest plot | 1 | 27 | Risk Ratio (M‐H, Random, 95% CI) | 2.55 [1.08, 6.03] |
| 2 Relapse to benzodiazepine use, end of intervention Show forest plot | 1 | 27 | Risk Ratio (M‐H, Random, 95% CI) | 0.31 [0.11, 0.90] |
| 3 Benzodiazepine discontinuation, longest follow‐up Show forest plot | 1 | 24 | Risk Ratio (M‐H, Random, 95% CI) | 1.57 [0.80, 3.09] |
| 4 Relapse to benzodiazepine use, longest follow‐up Show forest plot | 1 | 24 | Risk Ratio (M‐H, Random, 95% CI) | 0.43 [0.13, 1.39] |
| 5 Anxiety: HAM‐A (Hamilton Anxiety Rating Scale), end of intervention Show forest plot | 1 | 27 | Mean Difference (IV, Random, 95% CI) | ‐0.40 [‐6.47, 5.67] |
| 6 Benzodiazepine withdrawal symptoms, end of intervention Show forest plot | 2 | 56 | Std. Mean Difference (IV, Random, 95% CI) | ‐0.15 [‐0.68, 0.37] |
| 6.1 Physician Withdrawal Checklist | 1 | 27 | Std. Mean Difference (IV, Random, 95% CI) | ‐0.01 [‐0.77, 0.74] |
| 6.2 CIWA‐B (Clinical Institute Withdrawal Assessment Scale ‐ Benzodiazepines) | 1 | 29 | Std. Mean Difference (IV, Random, 95% CI) | ‐0.28 [‐1.01, 0.45] |
| 7 Discontinuation due to adverse events Show forest plot | 1 | 29 | Risk Ratio (M‐H, Random, 95% CI) | 0.0 [0.0, 0.0] |
| 8 Serious adverse events Show forest plot | 1 | 29 | Risk Ratio (M‐H, Random, 95% CI) | 0.0 [0.0, 0.0] |
| Outcome or subgroup title | No. of studies | No. of participants | Statistical method | Effect size |
| 1 Benzodiazepine discontinuation, end of intervention Show forest plot | 3 | 147 | Risk Ratio (M‐H, Random, 95% CI) | 1.33 [0.99, 1.80] |
| 2 Benzodiazepine withdrawal symptoms Show forest plot | 2 | 76 | Std. Mean Difference (IV, Random, 95% CI) | ‐1.14 [‐2.43, 0.16] |
| 2.1 Physician Withdrawal Checklist | 1 | 36 | Std. Mean Difference (IV, Random, 95% CI) | ‐1.82 [‐2.61, ‐1.03] |
| 2.2 Patient Withdrawal Checklist | 1 | 40 | Std. Mean Difference (IV, Random, 95% CI) | ‐0.50 [‐1.13, 0.13] |
| 3 Benzodiazepine discontinuation, longest follow‐up Show forest plot | 1 | 40 | Risk Ratio (M‐H, Random, 95% CI) | 1.41 [0.86, 2.29] |
| 4 Relapse to benzodiazepine use Show forest plot | 1 | 36 | Risk Ratio (M‐H, Random, 95% CI) | 0.33 [0.08, 1.44] |
| 5 Serious adverse events Show forest plot | 1 | 36 | Risk Ratio (M‐H, Random, 95% CI) | 0.0 [0.0, 0.0] |
| 6 Non‐serious adverse events Show forest plot | 1 | 36 | Risk Ratio (M‐H, Random, 95% CI) | 7.0 [0.39, 126.48] |
| 7 Anxiety, HAM‐A Show forest plot | 1 | 36 | Mean Difference (IV, Random, 95% CI) | ‐6.0 [‐9.58, ‐2.42] |
| 8 Discontinuation due to adverse events Show forest plot | 1 | 36 | Risk Ratio (M‐H, Random, 95% CI) | 0.0 [0.0, 0.0] |
| Outcome or subgroup title | No. of studies | No. of participants | Statistical method | Effect size |
| 1 Benzodiazepine discontinuation Show forest plot | 1 | 230 | Risk Ratio (M‐H, Random, 95% CI) | 1.05 [0.86, 1.28] |
| 2 Serious adverse events Show forest plot | 1 | 230 | Risk Ratio (M‐H, Random, 95% CI) | 0.0 [0.0, 0.0] |
| 3 Non‐serious adverse events Show forest plot | 1 | 230 | Risk Ratio (M‐H, Random, 95% CI) | 1.06 [0.75, 1.49] |
| 4 Discontinuation due to adverse events Show forest plot | 1 | 230 | Risk Ratio (M‐H, Random, 95% CI) | 1.38 [0.13, 15.03] |
| Outcome or subgroup title | No. of studies | No. of participants | Statistical method | Effect size |
| 1 Benzodiazepine discontinuation, end of intervention Show forest plot | 1 | 106 | Risk Ratio (M‐H, Random, 95% CI) | 1.44 [0.92, 2.25] |
| 2 Benzodiazepine withdrawal symptoms (Physician Withdrawal Checklist), end of intervention Show forest plot | 1 | 106 | Mean Difference (IV, Random, 95% CI) | ‐3.1 [‐3.51, ‐2.69] |
| 3 Anxiety, HAM‐A, end of intervention Show forest plot | 1 | 106 | Mean Difference (IV, Random, 95% CI) | ‐4.8 [‐5.28, ‐4.32] |
| 4 Serious adverse events Show forest plot | 1 | 106 | Risk Ratio (M‐H, Random, 95% CI) | 0.67 [0.16, 2.85] |
| 5 Non‐serious adverse events Show forest plot | 1 | 106 | Risk Ratio (M‐H, Random, 95% CI) | 1.08 [0.84, 1.40] |
| 6 Discontinuation due to adverse events Show forest plot | 1 | 106 | Risk Ratio (M‐H, Random, 95% CI) | 0.89 [0.31, 2.59] |
| Outcome or subgroup title | No. of studies | No. of participants | Statistical method | Effect size |
| 1 Benzodiazepine withdrawal symptoms, BWSQ (Benzodiazepine Withdrawal Symptom Questionnaire), end of intervention Show forest plot | 1 | 81 | Mean Difference (IV, Random, 95% CI) | 1.00 [‐1.13, ‐0.87] |
| 2 Anxiety, HAM‐A, end of intervention Show forest plot | 1 | 81 | Mean Difference (IV, Random, 95% CI) | ‐5.7 [‐6.05, ‐5.35] |
| 3 Serious adverse events Show forest plot | 1 | 81 | Risk Ratio (M‐H, Random, 95% CI) | 0.0 [0.0, 0.0] |
| 4 Non‐serious adverse events Show forest plot | 1 | 81 | Risk Ratio (M‐H, Random, 95% CI) | 0.0 [0.0, 0.0] |
| Outcome or subgroup title | No. of studies | No. of participants | Statistical method | Effect size |
| 1 Benzodiazepine discontinuation, end of intervention Show forest plot | 3 | 221 | Risk Ratio (M‐H, Random, 95% CI) | 1.45 [0.88, 2.39] |
| 2 Benzodiazepine withdrawal symptoms: BWSQ, end of intervention Show forest plot | 2 | 99 | Mean Difference (IV, Random, 95% CI) | ‐3.57 [‐5.34, ‐1.80] |
| 3 Anxiety: HAM‐A, end of intervention Show forest plot | 2 | 99 | Mean Difference (IV, Random, 95% CI) | ‐6.75 [‐9.64, ‐3.86] |
| 4 Benzodiazepine withdrawal symptoms: BWSQ, longest follow‐up: 6 months Show forest plot | 1 | 54 | Mean Difference (IV, Random, 95% CI) | ‐0.13 [‐4.03, 3.77] |
| 5 Serious adverse events Show forest plot | 2 | 176 | Risk Ratio (M‐H, Random, 95% CI) | 0.0 [0.0, 0.0] |
| 6 Non‐serious adverse events Show forest plot | 1 | 54 | Risk Ratio (M‐H, Random, 95% CI) | 1.33 [0.35, 5.03] |
| Outcome or subgroup title | No. of studies | No. of participants | Statistical method | Effect size |
| 1 Benzodiazepine discontinuation, end of intervention Show forest plot | 2 | 105 | Risk Ratio (M‐H, Random, 95% CI) | 0.82 [0.52, 1.28] |
| 2 Anxiety: HAM‐A (change from baseline), end of intervention Show forest plot | 2 | 66 | Mean Difference (IV, Random, 95% CI) | ‐10.38 [‐25.96, 5.20] |
| 3 Benzodiazepine discontinuation, longest follow‐up Show forest plot | 1 | 47 | Risk Ratio (M‐H, Random, 95% CI) | 2.20 [1.27, 3.82] |
| 4 Benzodiazepine withdrawal symptoms (Physician Withdrawal Checklist), end of intervention Show forest plot | 1 | 38 | Mean Difference (IV, Random, 95% CI) | ‐19.78 [‐20.25, ‐19.31] |
| 5 Relapse to benzodiazepine use, end of intervention Show forest plot | 1 | 36 | Risk Ratio (M‐H, Random, 95% CI) | 2.0 [0.73, 5.47] |
| 6 Discontinuation due to adverse events Show forest plot | 2 | 134 | Risk Ratio (M‐H, Random, 95% CI) | 1.16 [0.42, 3.21] |
| Outcome or subgroup title | No. of studies | No. of participants | Statistical method | Effect size |
| 1 Benzodiazepine discontinuation, end of intervention Show forest plot | 1 | 25 | Risk Ratio (M‐H, Random, 95% CI) | 0.41 [0.17, 0.99] |
| 2 Withdrawal syndrome (clinical diagnosis), end of intervention Show forest plot | 1 | 145 | Risk Ratio (M‐H, Random, 95% CI) | 4.86 [1.12, 21.14] |
| 3 Anxiety, HAM‐A, end of intervention Show forest plot | 2 | 170 | Mean Difference (IV, Random, 95% CI) | ‐1.60 [‐4.64, 1.45] |
| 4 Relapse to benzodiazepine use, end of intervention Show forest plot | 1 | 145 | Risk Ratio (M‐H, Random, 95% CI) | 0.33 [0.09, 1.20] |
| 5 Serious adverse events Show forest plot | 1 | 25 | Risk Ratio (M‐H, Random, 95% CI) | 0.0 [0.0, 0.0] |
| 6 Discontinuation due to adverse events Show forest plot | 1 | 25 | Risk Ratio (M‐H, Random, 95% CI) | 0.46 [0.05, 4.46] |
| Outcome or subgroup title | No. of studies | No. of participants | Statistical method | Effect size |
| 1 Benzodiazepine discontinuation, end of intervention Show forest plot | 4 | 143 | Risk Ratio (M‐H, Random, 95% CI) | 0.82 [0.49, 1.37] |
| 2 Anxiety: HAM‐A/Hospital Anxiety Depression Scale, end of intervention Show forest plot | 2 | 41 | Std. Mean Difference (IV, Random, 95% CI) | 0.18 [‐0.50, 0.86] |
| 3 Benzodiazepine withdrawal symptoms, end of intervention Show forest plot | 1 | 17 | Mean Difference (IV, Random, 95% CI) | 4.69 [‐14.47, 23.85] |
| 4 Benzodiazepine discontinuation, longest follow‐up Show forest plot | 1 | 23 | Risk Ratio (M‐H, Random, 95% CI) | 0.60 [0.34, 1.05] |
| 5 Benzodiazepine withdrawal symptoms, longest follow‐up Show forest plot | 1 | 15 | Mean Difference (IV, Random, 95% CI) | ‐1.34 [‐14.31, 11.63] |
| 6 Anxiety, Hospital Anxiety Depression Scale, longest follow‐up Show forest plot | 1 | 12 | Mean Difference (IV, Random, 95% CI) | 2.75 [‐2.83, 8.33] |
| 7 Discontinuation due to adverse events Show forest plot | 1 | 72 | Risk Ratio (M‐H, Random, 95% CI) | 0.33 [0.01, 7.92] |
| Outcome or subgroup title | No. of studies | No. of participants | Statistical method | Effect size |
| 1 Benzodiazepine discontinuation, end of intervention Show forest plot | 4 | 219 | Risk Ratio (M‐H, Random, 95% CI) | 1.20 [0.73, 1.96] |
| 2 Insomnia Show forest plot | 3 | 150 | Std. Mean Difference (IV, Random, 95% CI) | ‐1.23 [‐2.70, 0.23] |
| 2.1 PSQI (Pittsburgh Sleep Quality Index) global score (higher = worse), end of intervention | 2 | 116 | Std. Mean Difference (IV, Random, 95% CI) | ‐0.31 [‐0.92, 0.31] |
| 2.2 Sleep quality (1 poorest, 10 excellent), end of intervention | 1 | 34 | Std. Mean Difference (IV, Random, 95% CI) | ‐3.34 [‐4.42, ‐2.26] |
| 3 Discontinuation due to adverse events Show forest plot | 2 | 120 | Risk Ratio (M‐H, Random, 95% CI) | 2.10 [0.20, 22.26] |
| 4 Benzodiazepine discontinuation, longest follow‐up Show forest plot | 1 | 38 | Risk Ratio (M‐H, Random, 95% CI) | 1.03 [0.47, 2.27] |
| 5 Adverse events Show forest plot | 1 | 86 | Risk Ratio (M‐H, Random, 95% CI) | 0.97 [0.52, 1.82] |
| 6 Relapse to benzodiazepine use, longest follow‐up Show forest plot | 1 | 38 | Risk Ratio (M‐H, Random, 95% CI) | 1.8 [0.37, 8.68] |
| Outcome or subgroup title | No. of studies | No. of participants | Statistical method | Effect size |
| 1 Benzodiazepine withdrawal symptoms, end of intervention Show forest plot | 3 | 58 | Std. Mean Difference (IV, Random, 95% CI) | ‐0.95 [‐1.71, ‐0.19] |
| 2 Anxiety, HAM‐D (Hamilton Depression Rating Scale), end of intervention Show forest plot | 1 | 18 | Mean Difference (IV, Random, 95% CI) | ‐1.3 [‐2.28, ‐0.32] |
| 3 Benzodiazepine mean dose, end of intervention Show forest plot | 1 | 10 | Mean Difference (IV, Random, 95% CI) | ‐3.70 [‐22.06, 14.66] |
| Outcome or subgroup title | No. of studies | No. of participants | Statistical method | Effect size |
| 1 Relapse to benzodiazepine use, end of intervention: 2 weeks Show forest plot | 1 | 40 | Risk Ratio (M‐H, Random, 95% CI) | 0.64 [0.31, 1.30] |
| Outcome or subgroup title | No. of studies | No. of participants | Statistical method | Effect size |
| 1 Benzodiazepine discontinuation, end of intervention Show forest plot | 1 | 35 | Risk Ratio (M‐H, Random, 95% CI) | 1.15 [0.52, 2.54] |
| 2 Non‐serious adverse events Show forest plot | 1 | 35 | Risk Ratio (M‐H, Random, 95% CI) | 3.13 [1.15, 8.54] |
| Outcome or subgroup title | No. of studies | No. of participants | Statistical method | Effect size |
| 1 Benzodiazepine discontinuation Show forest plot | 1 | 144 | Risk Ratio (M‐H, Random, 95% CI) | 0.80 [0.66, 0.96] |
| 2 Anxiety Show forest plot | 1 | 144 | Mean Difference (IV, Random, 95% CI) | ‐0.80 [‐2.73, 1.13] |
| 3 Relapse to benzodiazepine use Show forest plot | 1 | 144 | Risk Ratio (M‐H, Random, 95% CI) | 0.93 [0.46, 1.87] |
| 4 Non‐serious adverse events Show forest plot | 1 | 144 | Risk Ratio (M‐H, Random, 95% CI) | 0.49 [0.18, 1.35] |
| 5 Discontinuation due to adverse events Show forest plot | 1 | 144 | Risk Ratio (M‐H, Random, 95% CI) | 0.40 [0.13, 1.18] |
| Outcome or subgroup title | No. of studies | No. of participants | Statistical method | Effect size |
| 1 Benzodiazepine discontinuation Show forest plot | 1 | 51 | Risk Ratio (M‐H, Random, 95% CI) | 0.79 [0.36, 1.70] |
| Outcome or subgroup title | No. of studies | No. of participants | Statistical method | Effect size |
| 1 Benzodiazepine discontinuation, end of intervention Show forest plot | 1 | 48 | Risk Ratio (M‐H, Random, 95% CI) | 1.0 [0.78, 1.29] |
| 2 Relapse to benzodiazepine use Show forest plot | 1 | 48 | Risk Ratio (M‐H, Random, 95% CI) | 1.0 [0.28, 3.54] |
| 3 Serious adverse events Show forest plot | 1 | 48 | Risk Ratio (M‐H, Random, 95% CI) | 0.0 [0.0, 0.0] |
| Outcome or subgroup title | No. of studies | No. of participants | Statistical method | Effect size |
| 1 Relapse to benzodiazepine use, longest follow‐up Show forest plot | 1 | 124 | Risk Ratio (M‐H, Random, 95% CI) | 0.33 [0.14, 0.78] |
| 2 Anxiety: Maximum amplitude of rebound (HAM‐A), end of intervention Show forest plot | 1 | 160 | Mean Difference (IV, Random, 95% CI) | 0.50 [‐1.23, 2.23] |
| 3 Discontinuation due to adverse events Show forest plot | 1 | 160 | Risk Ratio (M‐H, Random, 95% CI) | 2.87 [0.79, 10.44] |
| 4 Non‐serious adverse events Show forest plot | 1 | 160 | Risk Ratio (M‐H, Random, 95% CI) | 1.68 [1.01, 2.78] |
| Outcome or subgroup title | No. of studies | No. of participants | Statistical method | Effect size |
| 1 Relapse to benzodiazepine use, longest follow‐up Show forest plot | 1 | 18 | Risk Ratio (M‐H, Random, 95% CI) | 1.05 [0.23, 4.78] |