Intervenciones farmacológicas para la interrupción de benzodiazepinas en usuarios crónicos de benzodiazepinas
Información
- DOI:
- https://doi.org/10.1002/14651858.CD011481.pub2Copiar DOI

- Base de datos:
-
- Cochrane Database of Systematic Reviews
- Versión publicada:
-
- 15 marzo 2018see what's new
- Tipo:
-
- Intervention
- Etapa:
-
- Review
- Grupo Editorial Cochrane:
-
Grupo Cochrane de Alcohol y drogas
- Copyright:
-
- Copyright © 2018 The Cochrane Collaboration. Published by John Wiley & Sons, Ltd.
Cifras del artículo
Altmetric:
Citado por:
Autores
Contributions of authors
All authors contributed to the review concept and design. LB and BE or LB and JR assessed studies for inclusion, risk of bias, and data extraction. LB drafted the manuscript, which was reviewed, corrected, and then accepted by all authors.
JL and CG were responsible for the planning of statistical procedures. JL performed the Trial Sequential Analyses. BG provided advice during study design, data collection and data interpretation.
Sources of support
Internal sources
-
Mental health services ‐ Capital Region of Denmark, Denmark.
Postdoctoral grant to LB
External sources
-
No sources of support supplied
Declarations of interest
LB is the sponsor‐investigator of one of the studies included in this review (Baandrup 2016). A review author independent of this trial acted as the second review author, thus ensuring unbiased data extraction and 'Risk of bias' assessment.
BE has received lecture fees from Bristol‐Myers Squibb, Otsuka Pharma Scandinavia AB, and Eli Lilly and Company and is part of the Advisory Board of Eli Lilly Danmark A/S, Janssen‐Cilag A/S, and Takeda Pharmaceutical Company Ltd.
BG is leader of a Lundbeck Foundation Centre of Excellence for Clinical Intervention and Neuropsychiatric Schizophrenia Research, CINS. CINS is independent of H. Lundbeck A/S. The grant was awarded based on international scientific review. BG is part of the study group behind the clinical trial stated by LB in her declaration of interest.
JL, CG, and JR have no known conflicts of interest.
Acknowledgements
The authors thank Zuzana Mitrova for conducting the literature searches. The authors thank the following people for their help in data extraction and 'Risk of bias' assessment of the non‐English language reports: Kasia Kalinowska (Kornowski 2002), Xue Jie Song (Zhang 2013), and Ileana Codruta Nielsen (Di Costanzo 1992).
Version history
| Published | Title | Stage | Authors | Version |
| 2018 Mar 15 | Pharmacological interventions for benzodiazepine discontinuation in chronic benzodiazepine users | Review | Lone Baandrup, Bjørn H Ebdrup, Jesper Ø Rasmussen, Jane Lindschou, Christian Gluud, Birte Y Glenthøj | |
| 2015 Jan 20 | Pharmacological interventions for benzodiazepine discontinuation in chronic benzodiazepine users | Protocol | Lone Baandrup, Bjørn H Ebdrup, Jane Lindschou, Christian Gluud, Birte Y Glenthøj | |
Differences between protocol and review
JR was added as a review author because of considerable contribution to data extraction and quality assessment.
Many of the included studies were of older date, and it was therefore not possible to track and contact every first author as stated in the protocol. We contacted those authors with available and updated contact information, by email. However, many of the reported email addresses were outdated as well, and requests were returned due to unknown recipient.
Due to the poor quality of the data, we did not perform any subgroup or sensitivity analyses. However, in the single case where imputation of standard deviations was applied (Analysis 8.3) (Lader 1993), we checked that results remained substantially unchanged when excluding this trial from the analysis.
Benzodiazepine withdrawal in opioid maintenance users was mentioned as a point of focus in the protocol. However, we could only include data from two smaller studies in this review where opioid maintenance users were tapered from usual benzodiazepine use: Peles 2007 investigating melatonin and Vorma 2011 investigating valproate. Mariani 2016 also included this group of patients in a trial investigating gabapentin, but it was not possible to extract data from this trial. Due to the paucity of data, we could not draw any conclusions regarding opioid maintenance patients discontinuing benzodiazepines. However, this is an important focus for future research since there are indications that benzodiazepine use is particularly problematic in opioid maintenance users, with an increased risk of toxic overdose and death when the substances are used together (Webster 2011). Active use of benzodiazepines have been found to be present in 17% of deaths involving opioid analgesics in the US (Warner 2009). The US in particular has witnessed a rapidly increasing number of patients chronically treated with opioids (Manchikanti 2012; Skolnick 2018).
Keywords
MeSH
Medical Subject Headings (MeSH) Keywords
- *Withholding Treatment;
- Antidepressive Agents [therapeutic use];
- Aspartic Acid [therapeutic use];
- Benzodiazepines [administration & dosage, *adverse effects];
- Buspirone [therapeutic use];
- Carbamazepine [therapeutic use];
- Ethylamines [therapeutic use];
- Flumazenil [therapeutic use];
- Homeopathy;
- Imidazoles [therapeutic use];
- Lithium Compounds [therapeutic use];
- Melatonin [therapeutic use];
- Paroxetine [therapeutic use];
- Pregabalin [therapeutic use];
- Progesterone [therapeutic use];
- Pyridines [therapeutic use];
- Randomized Controlled Trials as Topic;
- Substance Withdrawal Syndrome [*drug therapy];
- Sulfides [therapeutic use];
Medical Subject Headings Check Words
Adult; Humans;
PICO
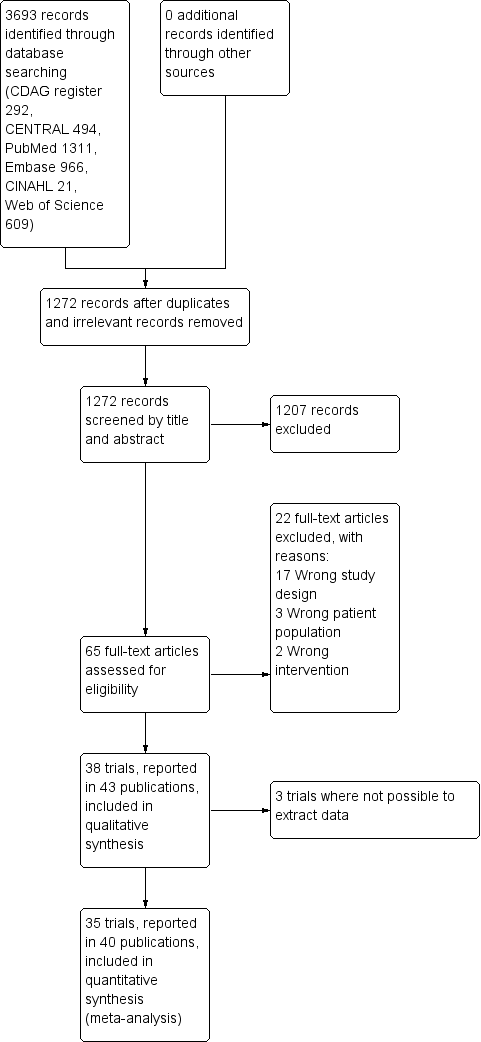
Study flow diagram.

Risk of bias summary: review authors' judgements about each risk of bias item for each included study.
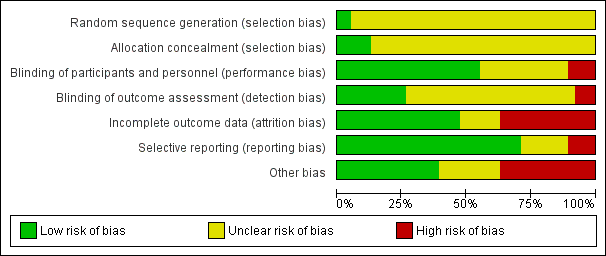
Risk of bias graph: review authors' judgements about each risk of bias item presented as percentages across all included studies.

Trial Sequential Analysis of comparison: 2 Carbamazepine versus placebo, outcome: 2.1 Benzodiazepine discontinuation. Trial Sequential Analysis on benzodiazepine discontinuation in three trials was performed based on the proportion with benzodiazepine discontinuation in the control group set at 48%, a relative risk reduction (RRR) of 20%, a type I error of 2.5%, a type II error of 10% (90% power), and diversity of 36% as observed in the trials. The diversity‐adjusted required information size (DARIS) was 2109 participants, and the Trial Sequential Analysis‐adjusted confidence interval is 0.24 to 2.38. The blue line represents the cumulative Z‐score of the meta‐analysis. The green lines represent the conventional statistical boundaries of P = 5%. The cumulative Z‐curve (blue line) touches the conventional statistical boundaries, but does not cross the trial sequential monitoring boundaries, and the diversity‐adjusted required information size is not met, showing that insufficient information has been accrued.

Trial Sequential Analysis of comparison: 6 Paroxetine versus placebo, outcome: 6.1 Benzodiazepine discontinuation. Trial Sequential Analysis on benzodiazepine discontinuation in three trials was performed based on the proportion with benzodiazepine discontinuation in the control group set at 48%, a relative risk reduction of 20%, a type I error of 2.5%, a type II error of 10% (90% power), and diversity of 86% as observed in the trials. The diversity‐adjusted required information size was 9448 participants, and the Trial Sequential Analysis‐adjusted confidence interval could not be estimated due to lack of information. The blue line represents the cumulative Z‐score of the meta‐analysis. The green lines represent the conventional statistical boundaries of P = 5%. The cumulative Z‐curve (blue line) does not cross the conventional statistical boundaries. The trial sequential monitoring boundaries and the diversity‐adjusted required information size are not shown as the accrued number of participants only amounted to 221/9448 (2.34%), showing that insufficient information has been accrued.

Trial Sequential Analysis of comparison: 6 Paroxetine versus placebo, outcome: 6.2 Benzodiazepine withdrawal symptoms Benzodiazepine Withdrawal Symptom Questionnaire (BWSQ). Trial Sequential Analysis on benzodiazepine withdrawal symptoms assessed with BWSQ assessing a minimal relevant clinical difference (MIREDIF) of 2.25 points, and a variance of 20 points (empirical data), was performed based on a type I error of 1.25%, a type II error of 10% (90% power), and diversity of 0%. The diversity‐adjusted required information size (DARIS) was 229 participants, and the Trial Sequential Analysis‐adjusted confidence interval is ‐7.18 to 0.05. The blue line represents the cumulative Z‐score of the meta‐analysis. The green lines represent the conventional statistical boundaries of P = 0.05. The red inward‐sloping lines represent the trial sequential monitoring boundaries. The cumulative Z‐curve touches the trial sequential monitoring boundaries, indicating that sufficient information was provided.

Trial Sequential Analysis of comparison: 6 Paroxetine versus placebo, outcome: 6.3 Anxiety, Hamilton Anxiety Rating Scale (HAM‐A). Trial Sequential Analysis on anxiety evaluated with HAM‐A assessing a minimal relevant clinical difference (MIREDIF) of 5 points, and a variance of 103 points, was performed based on a type I error of 1.25%, a type II error of 10% (90% power), and diversity of 0%. The diversity‐adjusted required information size (DARIS) was 236 participants, and the Trial Sequential Analysis‐adjusted confidence interval is ‐12.72 to ‐0.80. The blue line represents the cumulative Z‐score of the meta‐analysis. The green lines represent the conventional statistical boundaries of P = 0.05. The red inward‐sloping lines represent the trial sequential monitoring boundaries. The cumulative Z‐curve crosses the trial sequential monitoring boundaries, indicating that sufficient information was provided.

Trial Sequential Analysis of comparison: 7 Tricyclic antidepressants versus placebo, outcome: 7.1 Benzodiazepine discontinuation. Trial Sequential Analysis on benzodiazepine discontinuation in two trials was performed based on the proportion with benzodiazepine discontinuation in the control group set at 48%, a relative risk reduction (RRR) of 20%, a type I error of 2.5%, a type II error of 10% (90% power), and diversity of 0% as observed in the trials. The diversity‐adjusted required information size (DARIS) was 1343 participants, and the Trial Sequential Analysis‐adjusted confidence interval is 0.20 to 7.55. The blue line represents the cumulative Z‐score of the meta‐analysis. The green lines represent the conventional statistical boundaries of P = 5%. The cumulative Z‐curve (blue line) does not cross the conventional statistical boundaries or the trial sequential monitoring boundaries (red dotted lines), and the diversity‐adjusted required information size is not met, showing that insufficient information has been accrued.

Trial Sequential Analysis of comparison: 8 Alpidem versus placebo, outcome: 8.3 Anxiety, Hamilton Anxiety Rating Scale (HAM‐A). Trial Sequential Analysis on anxiety evaluated with HAM‐A assessing a minimal relevant clinical difference (MIREDIF) of 5 points, and a variance of 103 points (empirical data), was performed based on a type I error of 1.25%, a type II error of 10% (90% power), and diversity of 0%. The diversity‐adjusted required information size (DARIS) was 235 participants, and the Trial Sequential Analysis‐adjusted confidence interval is ‐6.28 to 3.08. The blue line represents the cumulative Z‐score of the meta‐analysis. The green lines represent the conventional statistical boundaries of P = 0.05. The red inward‐sloping lines represent the trial sequential alpha‐spending monitoring boundaries, while the red outward‐sloping lines represent the beta‐spending (futility) boundaries. The cumulative Z‐curve crosses the beta‐spending (futility) boundaries, showing that an intervention effect, if any, is less than 5 points.

Trial Sequential Analysis of comparison: 9 Buspirone versus placebo, outcome: 9.1 Benzodiazepine discontinuation. Trial Sequential Analysis on benzodiazepine discontinuation in four trials was performed based on the proportion with benzodiazepine discontinuation in the control group set at 48%, a relative risk reduction of 20%, a type I error of 2.5%, a type II error of 10% (90% power), and diversity of 60% as observed in the trials. The diversity‐adjusted required information size was 3381 participants, and the Trial Sequential Analysis‐adjusted confidence interval could not be estimated due to lack of information. The blue line represents the cumulative Z‐score of the meta‐analysis. The green lines represent the conventional statistical boundaries of P = 5%. The cumulative Z‐curve (blue line) does not cross the conventional statistical boundaries. The trial sequential monitoring boundaries and the diversity‐adjusted required information size are not shown, as the accrued number of participants only amounted to 143/3381 (4.23%), showing that insufficient information has been accrued.
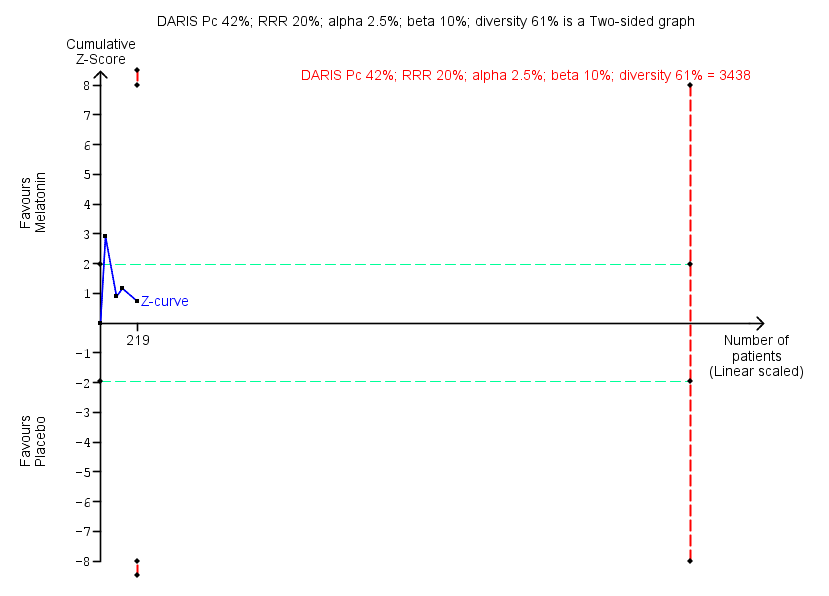
Trial Sequential Analysis of comparison: 10 Melatonin versus placebo, outcome: 10.1 Benzodiazepine discontinuation. Trial Sequential Analysis on benzodiazepine discontinuation in four trials was performed based on the proportion with benzodiazepine discontinuation in the control group set at 48%, a relative risk reduction (RRR) of 20%, a type I error of 2.5%, a type II error of 10% (90% power), and diversity of 61% as observed in the trials. The diversity‐adjusted required information size (DARIS) was 3438 participants, and the Trial Sequential Analysis‐adjusted confidence interval is 0.11 to 6.25. The blue line represents the cumulative Z‐score of the meta‐analysis. The green lines represent the conventional statistical boundaries of P = 5%. The cumulative Z‐curve (blue line) does not cross the conventional statistical boundaries or the trial sequential monitoring boundaries (red dotted lines), and the diversity‐adjusted required information size is not met, showing that insufficient information has been accrued.

Comparison 1 Valproate versus placebo or no intervention, Outcome 1 Benzodiazepine discontinuation, end of intervention.

Comparison 1 Valproate versus placebo or no intervention, Outcome 2 Relapse to benzodiazepine use, end of intervention.
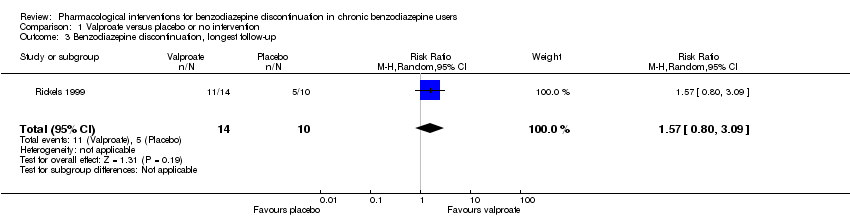
Comparison 1 Valproate versus placebo or no intervention, Outcome 3 Benzodiazepine discontinuation, longest follow‐up.

Comparison 1 Valproate versus placebo or no intervention, Outcome 4 Relapse to benzodiazepine use, longest follow‐up.
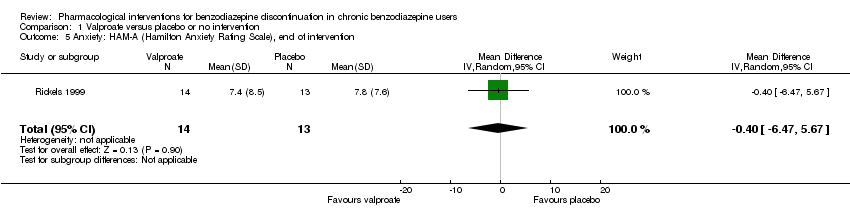
Comparison 1 Valproate versus placebo or no intervention, Outcome 5 Anxiety: HAM‐A (Hamilton Anxiety Rating Scale), end of intervention.

Comparison 1 Valproate versus placebo or no intervention, Outcome 6 Benzodiazepine withdrawal symptoms, end of intervention.
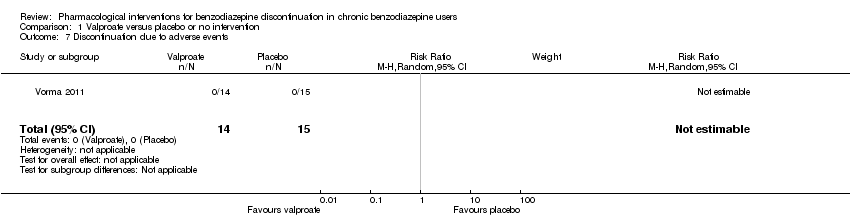
Comparison 1 Valproate versus placebo or no intervention, Outcome 7 Discontinuation due to adverse events.
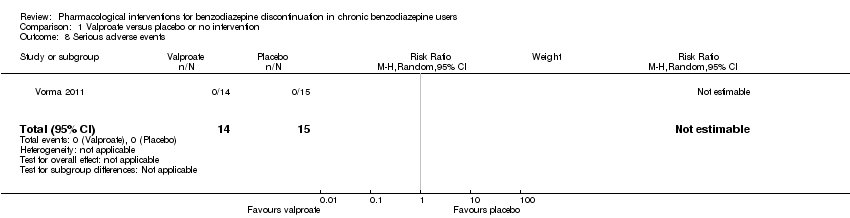
Comparison 1 Valproate versus placebo or no intervention, Outcome 8 Serious adverse events.

Comparison 2 Carbamazepine versus placebo, Outcome 1 Benzodiazepine discontinuation, end of intervention.

Comparison 2 Carbamazepine versus placebo, Outcome 2 Benzodiazepine withdrawal symptoms.

Comparison 2 Carbamazepine versus placebo, Outcome 3 Benzodiazepine discontinuation, longest follow‐up.

Comparison 2 Carbamazepine versus placebo, Outcome 4 Relapse to benzodiazepine use.

Comparison 2 Carbamazepine versus placebo, Outcome 5 Serious adverse events.
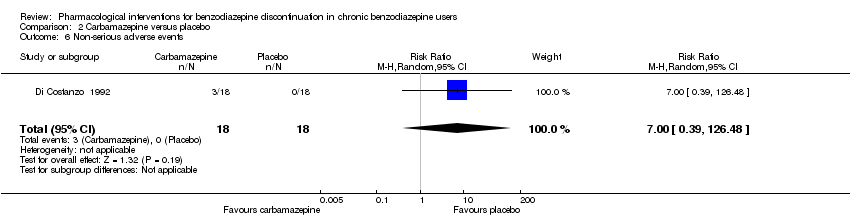
Comparison 2 Carbamazepine versus placebo, Outcome 6 Non‐serious adverse events.

Comparison 2 Carbamazepine versus placebo, Outcome 7 Anxiety, HAM‐A.
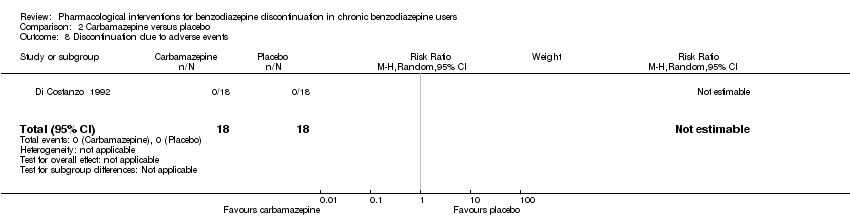
Comparison 2 Carbamazepine versus placebo, Outcome 8 Discontinuation due to adverse events.

Comparison 3 Lithium versus placebo, Outcome 1 Benzodiazepine discontinuation.
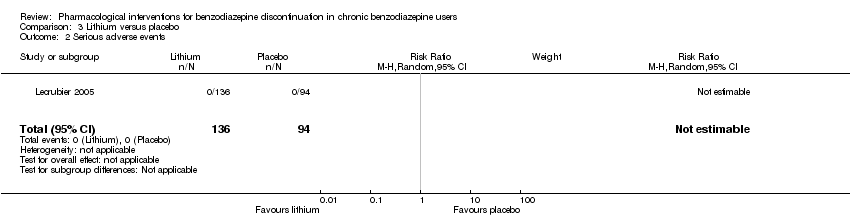
Comparison 3 Lithium versus placebo, Outcome 2 Serious adverse events.
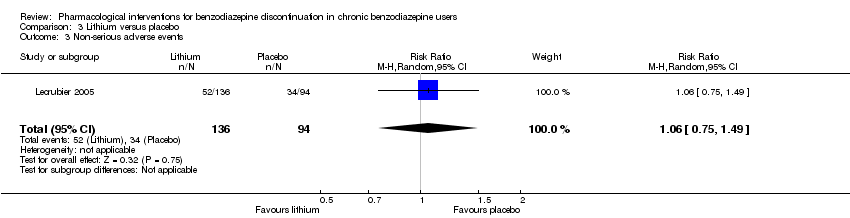
Comparison 3 Lithium versus placebo, Outcome 3 Non‐serious adverse events.
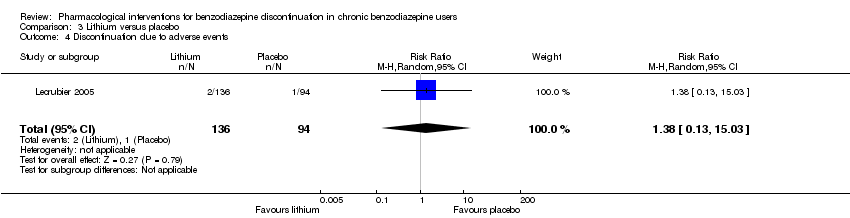
Comparison 3 Lithium versus placebo, Outcome 4 Discontinuation due to adverse events.

Comparison 4 Pregabalin versus placebo, Outcome 1 Benzodiazepine discontinuation, end of intervention.
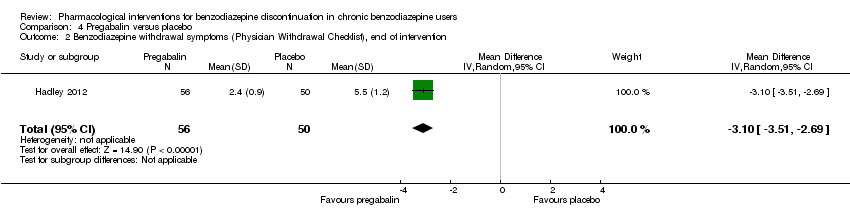
Comparison 4 Pregabalin versus placebo, Outcome 2 Benzodiazepine withdrawal symptoms (Physician Withdrawal Checklist), end of intervention.
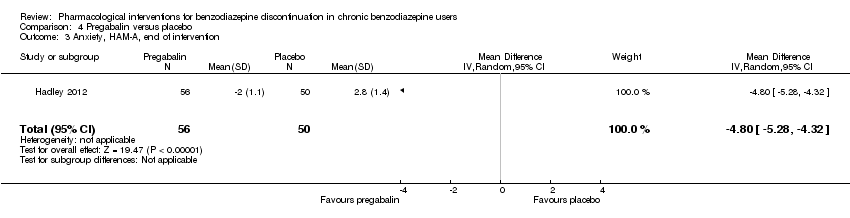
Comparison 4 Pregabalin versus placebo, Outcome 3 Anxiety, HAM‐A, end of intervention.

Comparison 4 Pregabalin versus placebo, Outcome 4 Serious adverse events.

Comparison 4 Pregabalin versus placebo, Outcome 5 Non‐serious adverse events.
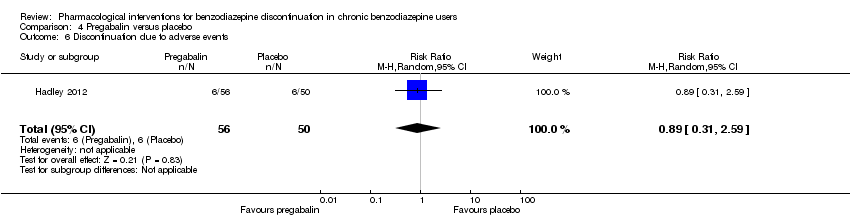
Comparison 4 Pregabalin versus placebo, Outcome 6 Discontinuation due to adverse events.
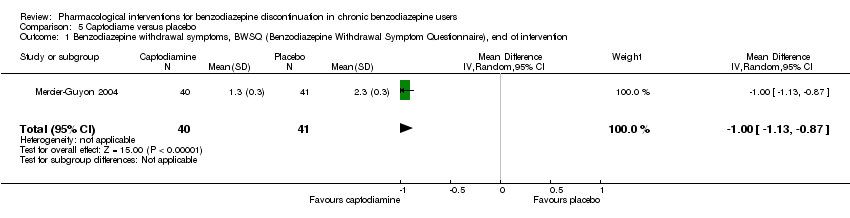
Comparison 5 Captodiame versus placebo, Outcome 1 Benzodiazepine withdrawal symptoms, BWSQ (Benzodiazepine Withdrawal Symptom Questionnaire), end of intervention.

Comparison 5 Captodiame versus placebo, Outcome 2 Anxiety, HAM‐A, end of intervention.

Comparison 5 Captodiame versus placebo, Outcome 3 Serious adverse events.
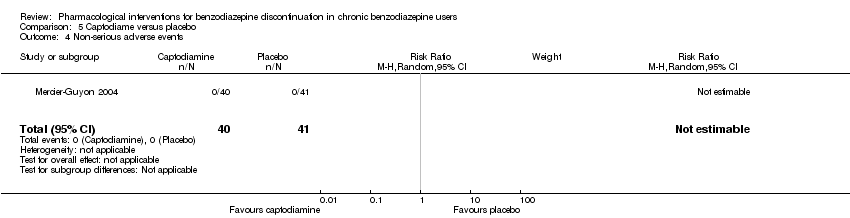
Comparison 5 Captodiame versus placebo, Outcome 4 Non‐serious adverse events.

Comparison 6 Paroxetine versus placebo or no intervention, Outcome 1 Benzodiazepine discontinuation, end of intervention.

Comparison 6 Paroxetine versus placebo or no intervention, Outcome 2 Benzodiazepine withdrawal symptoms: BWSQ, end of intervention.

Comparison 6 Paroxetine versus placebo or no intervention, Outcome 3 Anxiety: HAM‐A, end of intervention.
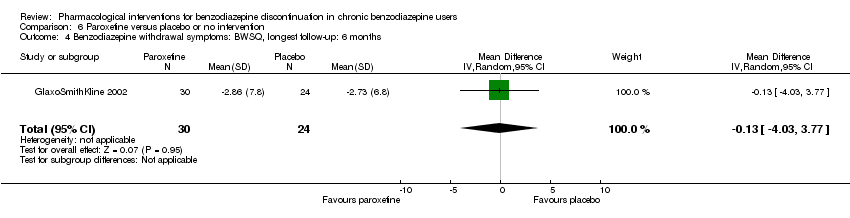
Comparison 6 Paroxetine versus placebo or no intervention, Outcome 4 Benzodiazepine withdrawal symptoms: BWSQ, longest follow‐up: 6 months.

Comparison 6 Paroxetine versus placebo or no intervention, Outcome 5 Serious adverse events.
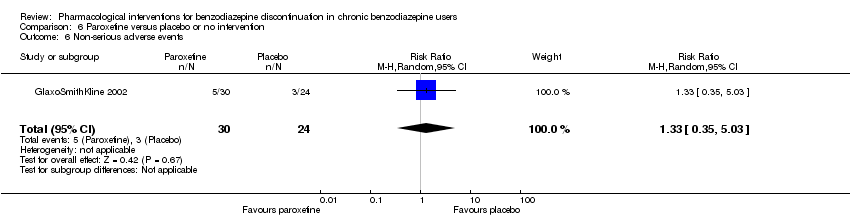
Comparison 6 Paroxetine versus placebo or no intervention, Outcome 6 Non‐serious adverse events.

Comparison 7 Tricyclic antidepressants versus placebo, Outcome 1 Benzodiazepine discontinuation, end of intervention.
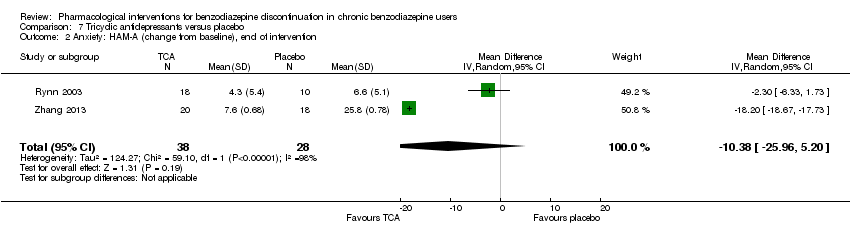
Comparison 7 Tricyclic antidepressants versus placebo, Outcome 2 Anxiety: HAM‐A (change from baseline), end of intervention.

Comparison 7 Tricyclic antidepressants versus placebo, Outcome 3 Benzodiazepine discontinuation, longest follow‐up.
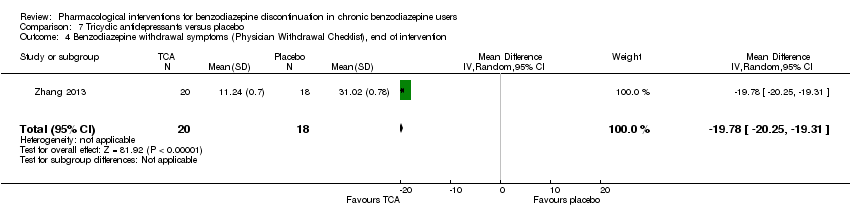
Comparison 7 Tricyclic antidepressants versus placebo, Outcome 4 Benzodiazepine withdrawal symptoms (Physician Withdrawal Checklist), end of intervention.
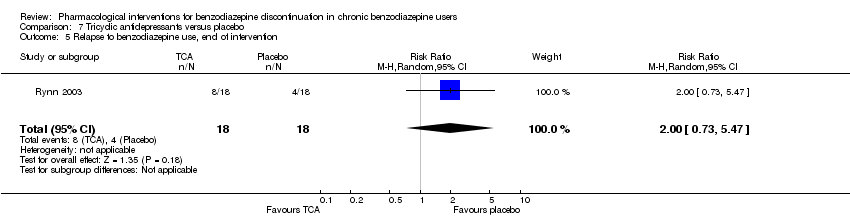
Comparison 7 Tricyclic antidepressants versus placebo, Outcome 5 Relapse to benzodiazepine use, end of intervention.

Comparison 7 Tricyclic antidepressants versus placebo, Outcome 6 Discontinuation due to adverse events.
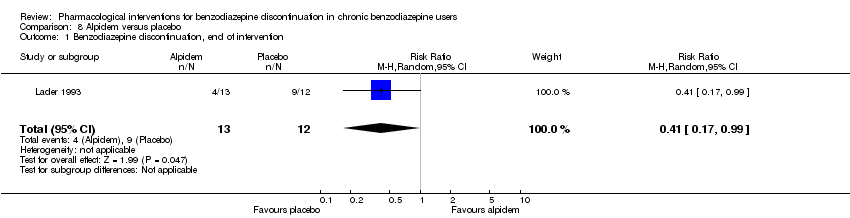
Comparison 8 Alpidem versus placebo, Outcome 1 Benzodiazepine discontinuation, end of intervention.

Comparison 8 Alpidem versus placebo, Outcome 2 Withdrawal syndrome (clinical diagnosis), end of intervention.

Comparison 8 Alpidem versus placebo, Outcome 3 Anxiety, HAM‐A, end of intervention.

Comparison 8 Alpidem versus placebo, Outcome 4 Relapse to benzodiazepine use, end of intervention.

Comparison 8 Alpidem versus placebo, Outcome 5 Serious adverse events.

Comparison 8 Alpidem versus placebo, Outcome 6 Discontinuation due to adverse events.

Comparison 9 Buspirone versus placebo, Outcome 1 Benzodiazepine discontinuation, end of intervention.
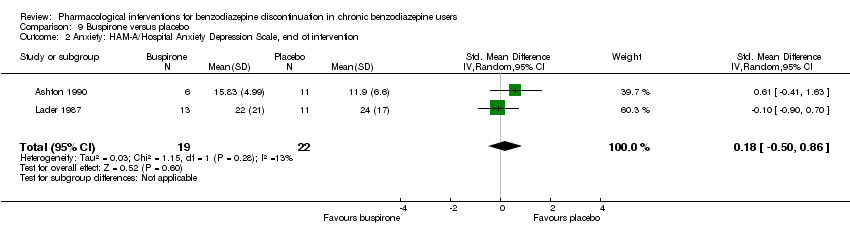
Comparison 9 Buspirone versus placebo, Outcome 2 Anxiety: HAM‐A/Hospital Anxiety Depression Scale, end of intervention.
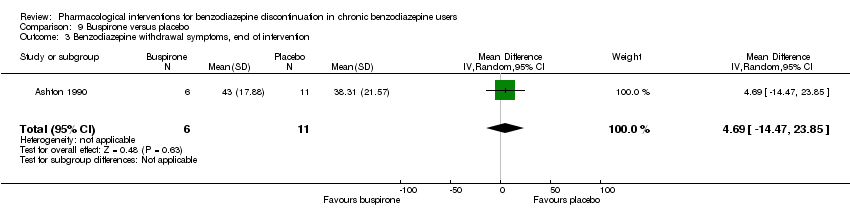
Comparison 9 Buspirone versus placebo, Outcome 3 Benzodiazepine withdrawal symptoms, end of intervention.

Comparison 9 Buspirone versus placebo, Outcome 4 Benzodiazepine discontinuation, longest follow‐up.
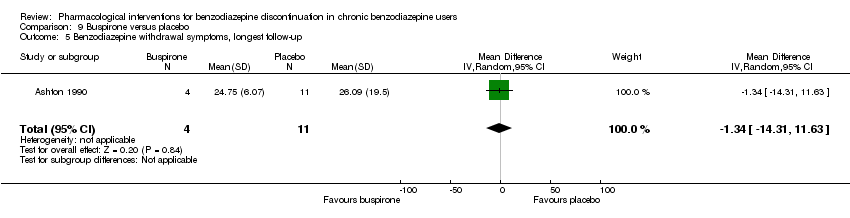
Comparison 9 Buspirone versus placebo, Outcome 5 Benzodiazepine withdrawal symptoms, longest follow‐up.
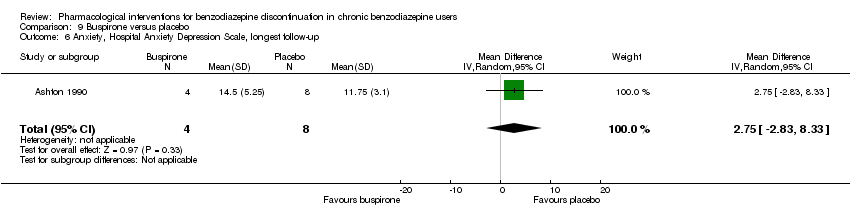
Comparison 9 Buspirone versus placebo, Outcome 6 Anxiety, Hospital Anxiety Depression Scale, longest follow‐up.

Comparison 9 Buspirone versus placebo, Outcome 7 Discontinuation due to adverse events.

Comparison 10 Melatonin versus placebo, Outcome 1 Benzodiazepine discontinuation, end of intervention.

Comparison 10 Melatonin versus placebo, Outcome 2 Insomnia.
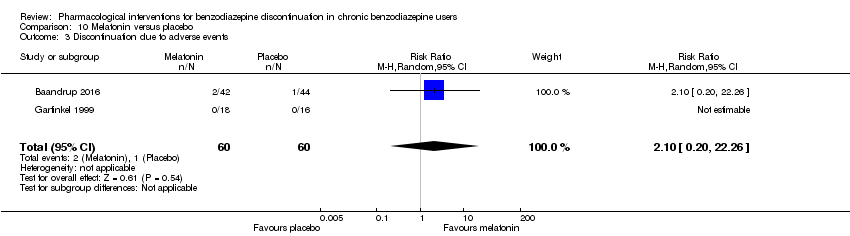
Comparison 10 Melatonin versus placebo, Outcome 3 Discontinuation due to adverse events.

Comparison 10 Melatonin versus placebo, Outcome 4 Benzodiazepine discontinuation, longest follow‐up.
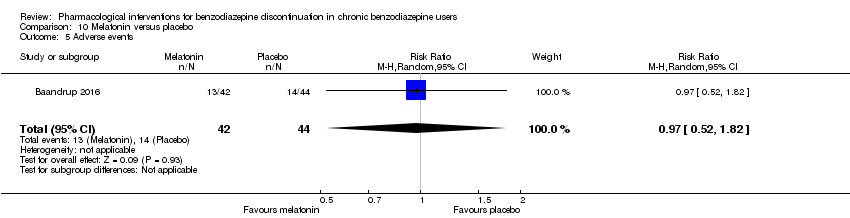
Comparison 10 Melatonin versus placebo, Outcome 5 Adverse events.
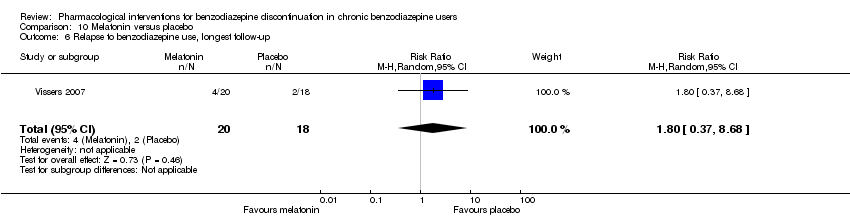
Comparison 10 Melatonin versus placebo, Outcome 6 Relapse to benzodiazepine use, longest follow‐up.
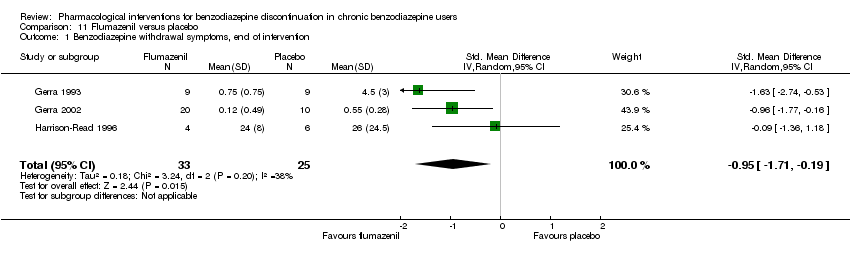
Comparison 11 Flumazenil versus placebo, Outcome 1 Benzodiazepine withdrawal symptoms, end of intervention.

Comparison 11 Flumazenil versus placebo, Outcome 2 Anxiety, HAM‐D (Hamilton Depression Rating Scale), end of intervention.

Comparison 11 Flumazenil versus placebo, Outcome 3 Benzodiazepine mean dose, end of intervention.

Comparison 12 Propranolol versus placebo, Outcome 1 Relapse to benzodiazepine use, end of intervention: 2 weeks.

Comparison 13 Progesterone versus placebo, Outcome 1 Benzodiazepine discontinuation, end of intervention.

Comparison 13 Progesterone versus placebo, Outcome 2 Non‐serious adverse events.
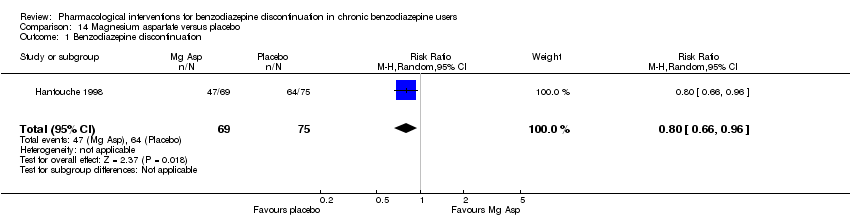
Comparison 14 Magnesium aspartate versus placebo, Outcome 1 Benzodiazepine discontinuation.

Comparison 14 Magnesium aspartate versus placebo, Outcome 2 Anxiety.

Comparison 14 Magnesium aspartate versus placebo, Outcome 3 Relapse to benzodiazepine use.
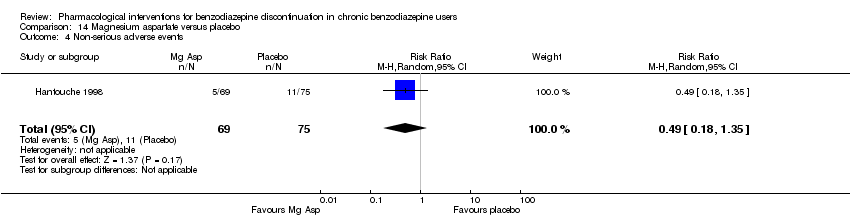
Comparison 14 Magnesium aspartate versus placebo, Outcome 4 Non‐serious adverse events.

Comparison 14 Magnesium aspartate versus placebo, Outcome 5 Discontinuation due to adverse events.
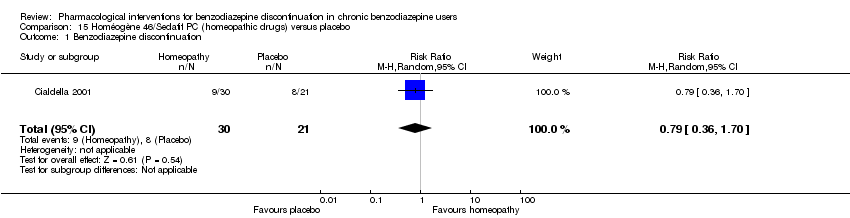
Comparison 15 Homéogène 46/Sedatif PC (homeopathic drugs) versus placebo, Outcome 1 Benzodiazepine discontinuation.
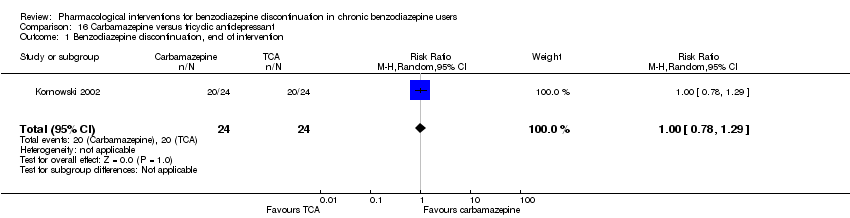
Comparison 16 Carbamazepine versus tricyclic antidepressant, Outcome 1 Benzodiazepine discontinuation, end of intervention.
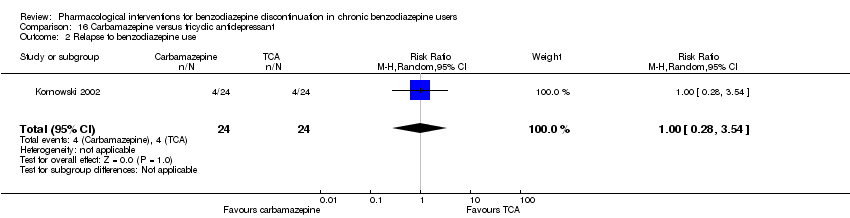
Comparison 16 Carbamazepine versus tricyclic antidepressant, Outcome 2 Relapse to benzodiazepine use.
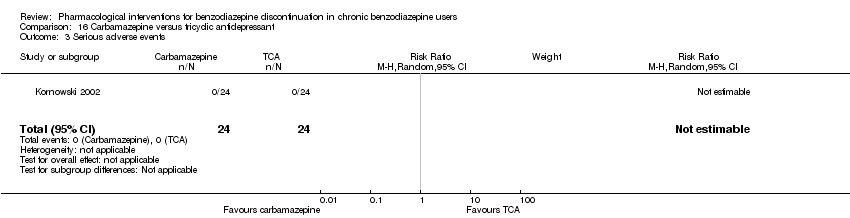
Comparison 16 Carbamazepine versus tricyclic antidepressant, Outcome 3 Serious adverse events.
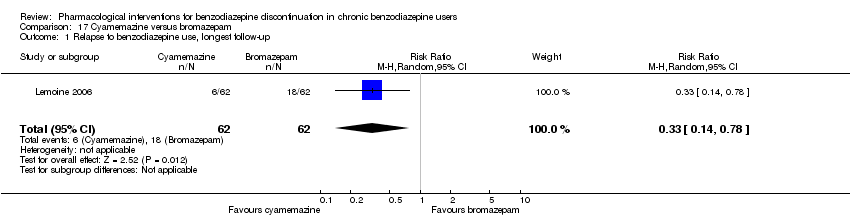
Comparison 17 Cyamemazine versus bromazepam, Outcome 1 Relapse to benzodiazepine use, longest follow‐up.

Comparison 17 Cyamemazine versus bromazepam, Outcome 2 Anxiety: Maximum amplitude of rebound (HAM‐A), end of intervention.

Comparison 17 Cyamemazine versus bromazepam, Outcome 3 Discontinuation due to adverse events.
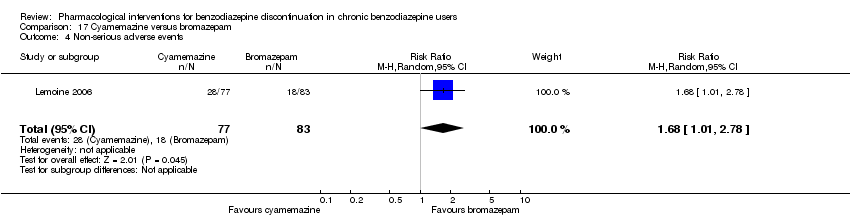
Comparison 17 Cyamemazine versus bromazepam, Outcome 4 Non‐serious adverse events.

Comparison 18 Zopiclone versus flunitrazepam, Outcome 1 Relapse to benzodiazepine use, longest follow‐up.
| Valproate compared with placebo or no intervention for benzodiazepine discontinuation in chronic benzodiazepine users | ||||||
| Patient or population: adults who withdraw from chronic benzodiazepine use | ||||||
| Outcomes | Illustrative comparative risks* (95% CI) | Relative effect | No. of participants | Quality of the evidence | Comments | |
| Assumed risk | Corresponding risk | |||||
| Placebo or no intervention | Valproate | |||||
| Benzodiazepine discontinuation, end of intervention | Study population | RR 2.55 | 27 | ⊕⊝⊝⊝ | The required information size of 1918 participants was not met. | |
| 679 per 1000 | 1000 per 1000 | |||||
| Benzodiazepine discontinuation, longest follow‐up | Study population | RR 1.57 | 24 | ⊕⊝⊝⊝ | ||
| 500 per 1000 | 785 per 1000 | |||||
| Benzodiazepine withdrawal symptoms, end of intervention | The mean benzodiazepine withdrawal symptoms in the intervention groups was | 56 | ⊕⊝⊝⊝ | SMD ‐0.15 (‐0.68 to 0.37). As a rule of thumb, 0.2 represents a small effect, 0.5 a moderate effect, and 0.8 a large effect. | ||
| Benzodiazepine withdrawal symptoms, longest follow‐up | Not estimable | ‐ | (0 study) | No included study measured this outcome. | ||
| *The basis for the assumed risk (e.g. the median control group risk across studies) is provided in footnotes. The corresponding risk (and its 95% confidence interval) is based on the assumed risk in the comparison group and the relative effect of the intervention (and its 95% CI). | ||||||
| GRADE Working Group grades of evidence | ||||||
| 1No details provided regarding random sequence generation, allocation concealment, and blinding, leading to unclear risk of selection bias, performance and detection bias (downgraded one level). | ||||||
| Carbamazepine compared with placebo for benzodiazepine discontinuation in chronic benzodiazepine users | ||||||
| Patient or population: adults who withdraw from chronic benzodiazepine use | ||||||
| Outcomes | Illustrative comparative risks* (95% CI) | Relative effect | No. of participants | Quality of the evidence | Comments | |
| Assumed risk | Corresponding risk | |||||
| Placebo | Carbamazepine | |||||
| Benzodiazepine discontinuation, end of intervention | Study population | RR 1.33 | 147 | ⊕⊕⊝⊝ | Trial Sequential Analysis showed that only 7.0% of the required information size (2109) was reached, indicating that insufficient information has been obtained. | |
| 480 per 1000 | 638 per 1000 | |||||
| Benzodiazepine discontinuation, longest follow‐up | Study population | RR 1.41 | 40 | ⊕⊝⊝⊝ | ||
| 524 per 1000 | 739 per 1000 | |||||
| Benzodiazepine withdrawal symptoms, end of intervention | The mean benzodiazepine withdrawal symptoms in the intervention groups was | 76 | ⊕⊝⊝⊝ | SMD ‐1.14 (‐2.43 to 0.16). As a rule of thumb, 0.2 represents a small effect, 0.5 a moderate effect, and 0.8 a large effect. | ||
| Benzodiazepine withdrawal symptoms, longest follow‐up | Not estimable | ‐ | (0 study) | No included study measured this outcome. | ||
| *The basis for the assumed risk (e.g. the median control group risk across studies) is provided in footnotes. The corresponding risk (and its 95% confidence interval) is based on the assumed risk in the comparison group and the relative effect of the intervention (and its 95% CI). | ||||||
| GRADE Working Group grades of evidence | ||||||
| 1Unclear risk of selection bias. One study with high risk of attrition, reporting, and other bias (downgraded one level). | ||||||
| Lithium compared with placebo for benzodiazepine discontinuation in chronic benzodiazepine users | ||||||
| Patient or population: adults who withdraw from chronic benzodiazepine use | ||||||
| Outcomes | Illustrative comparative risks* (95% CI) | Relative effect | No. of participants | Quality of the evidence | Comments | |
| Assumed risk | Corresponding risk | |||||
| Placebo | Lithium | |||||
| Benzodiazepine discontinuation, end of intervention | Study population | RR 1.05 | 230 | ⊕⊕⊝⊝ | The required information size of 1918 participants was not met. | |
| 617 per 1000 | 648 per 1000 | |||||
| Benzodiazepine discontinuation, longest follow‐up | Not estimable | ‐ | ‐ | (0 study) | ‐ | No included studies measured this outcome. |
| Benzodiazepine withdrawal symptoms, end of intervention | Not estimable | ‐ | ‐ | (0 study) | ‐ | No included studies measured this outcome. |
| Benzodiazepine withdrawal symptoms, longest follow‐up | Not estimable | ‐ | ‐ | (0 study) | ‐ | No included study measured this outcome. |
| *The basis for the assumed risk (e.g. the median control group risk across studies) is provided in footnotes. The corresponding risk (and its 95% confidence interval) is based on the assumed risk in the comparison group and the relative effect of the intervention (and its 95% CI). | ||||||
| GRADE Working Group grades of evidence | ||||||
| 1Unclear risk of selection, attrition, and reporting bias (downgraded one level). | ||||||
| Pregabalin compared with placebo for benzodiazepine discontinuation in chronic benzodiazepine users | ||||||
| Patient or population: adults who withdraw from chronic benzodiazepine use | ||||||
| Outcomes | Illustrative comparative risks* (95% CI) | Relative effect | No. of participants | Quality of the evidence | Comments | |
| Assumed risk | Corresponding risk | |||||
| Placebo | Pregabalin | |||||
| Benzodiazepine discontinuation, end of intervention | Study population | RR 1.44 | 106 | ⊕⊝⊝⊝ | The required information size of 1918 participants was not met. | |
| 360 per 1000 | 518 per 1000 | |||||
| Benzodiazepine discontinuation, longest follow‐up | Not estimable | ‐ | ‐ | (0 study) | ‐ | No included studies measured this outcome. |
| Benzodiazepine withdrawal symptoms, Physician Withdrawal Checklist (PWCL), end of intervention | ‐ | The mean benzodiazepine withdrawal symptoms, PWCL, end of intervention in the intervention group was | ‐ | 106 | ⊕⊝⊝⊝ | MD ‐3.10 (‐3.51 to ‐2.69) |
| Benzodiazepine withdrawal symptoms, longest follow‐up | Not estimable | ‐ | ‐ | (0 study) | ‐ | No included study measured this outcome. |
| *The basis for the assumed risk (e.g. the median control group risk across studies) is provided in footnotes. The corresponding risk (and its 95% confidence interval) is based on the assumed risk in the comparison group and the relative effect of the intervention (and its 95% CI). | ||||||
| GRADE Working Group grades of evidence | ||||||
| 1Unclear risk of selection bias and high risk of attrition and other bias (downgraded two levels). | ||||||
| Captodiame compared with placebo for benzodiazepine discontinuation in chronic benzodiazepine users | ||||||
| Patient or population: adults who withdraw from chronic benzodiazepine use | ||||||
| Outcomes | Illustrative comparative risks* (95% CI) | Relative effect | No. of participants | Quality of the evidence | Comments | |
| Assumed risk | Corresponding risk | |||||
| Placebo | Captodiame | |||||
| Benzodiazepine discontinuation, end of intervention | Not estimable | ‐ | ‐ | (0 study) | ‐ | No included studies measured this outcome. |
| Benzodiazepine discontinuation, longest follow‐up | Not estimable | ‐ | ‐ | (0 study) | ‐ | No included studies measured this outcome. |
| Benzodiazepine withdrawal symptoms, Benzodiazepine Withdrawal Symptom Questionnaire (BWSQ), end of intervention | ‐ | The mean benzodiazepine withdrawal symptoms, BWSQ, end of intervention in the intervention group was | ‐ | 81 | ⊕⊝⊝⊝ | MD ‐1.00 (‐1.13 to ‐0.87) The required information size of 229 participants was not met. |
| Benzodiazepine withdrawal symptoms, longest follow‐up | Not estimable | ‐ | ‐ | (0 study) | ‐ | No included study measured this outcome. |
| *The basis for the assumed risk (e.g. the median control group risk across studies) is provided in footnotes. The corresponding risk (and its 95% confidence interval) is based on the assumed risk in the comparison group and the relative effect of the intervention (and its 95% CI). | ||||||
| GRADE Working Group grades of evidence | ||||||
| 1Unclear risk of selection and reporting bias. High risk of other bias (downgraded one level). | ||||||
| Paroxetine compared with placebo or no intervention for benzodiazepine discontinuation in chronic benzodiazepine users | ||||||
| Patient or population: adults who withdraw from chronic benzodiazepine use | ||||||
| Outcomes | Illustrative comparative risks* (95% CI) | Relative effect | No. of participants | Quality of the evidence | Comments | |
| Assumed risk | Corresponding risk | |||||
| Placebo or Control | Paroxetine | |||||
| Benzodiazepine discontinuation, end of intervention | Study population | RR 1.45 | 221 | ⊕⊝⊝⊝ | Trial Sequential Analysis showed that only 2.34% of the required information size (9448) was reached, indicating that insufficient information has been obtained. | |
| 504 per 1000 | 731 per 1000 | |||||
| Benzodiazepine discontinuation, longest follow‐up | Not estimable | ‐ | (0 study) | ‐ | No included study measured this outcome. | |
| Benzodiazepine withdrawal symptoms, BWSQ, end of intervention | ‐ | The mean benzodiazepine withdrawal symptoms, BWSQ, end of intervention in the intervention groups was | ‐ | 99 | ⊕⊝⊝⊝ | MD ‐3.57 (‐5.34 to ‐1.8). Trial Sequential Analysis showed that the required information size of 229 participants was not reached. However, the alpha‐spending boundaries for benefit were crossed, indicating that sufficient information was obtained, and the result was not due to random error. |
| Benzodiazepine withdrawal symptoms, BWSQ, longest follow‐up: 6 months | ‐ | The mean benzodiazepine withdrawal symptoms, BWSQ, longest follow‐up: 6 months in the intervention group was | ‐ | 54 | ⊕⊝⊝⊝ | MD ‐0.13 (‐4.03 to 3.77) |
| *The basis for the assumed risk (e.g. the median control group risk across studies) is provided in footnotes. The corresponding risk (and its 95% confidence interval) is based on the assumed risk in the comparison group and the relative effect of the intervention (and its 95% CI). | ||||||
| GRADE Working Group grades of evidence | ||||||
| 1Unclear risk of selection and attrition bias. High risk of performance, detection, reporting, and other bias (downgraded two levels). | ||||||
| Tricyclic antidepressants compared with placebo for benzodiazepine discontinuation in chronic benzodiazepine users | ||||||
| Patient or population: adults who withdraw from chronic benzodiazepine use | ||||||
| Outcomes | Illustrative comparative risks* (95% CI) | Relative effect | No. of participants | Quality of the evidence | Comments | |
| Assumed risk | Corresponding risk | |||||
| Placebo | Tricyclic antidepressants | |||||
| Benzodiazepine discontinuation, end of intervention | Study population | RR 0.82 | 105 | ⊕⊝⊝⊝ | Trial Sequential Analysis showed that only 7.82% of the required information size (1343) was reached, indicating that insufficient information has been obtained. | |
| 451 per 1000 | 370 per 1000 | |||||
| Benzodiazepine discontinuation, longest follow‐up | Study population | RR 2.2 | 47 | ⊕⊕⊝⊝ | ||
| 375 per 1000 | 825 per 1000 | |||||
| Benzodiazepine withdrawal symptoms, Physician Withdrawal Checklist, end of intervention | ‐ | The mean benzodiazepine withdrawal symptoms in the intervention group was | ‐ | 38 (1 study) | ⊕⊝⊝⊝ | MD ‐19.78 (‐20.25 to ‐19.31) |
| Benzodiazepine withdrawal symptoms, longest follow‐up | Not estimable | ‐ | ‐ | (0 study) | ‐ | No included study measured this outcome. |
| *The basis for the assumed risk (e.g. the median control group risk across studies) is provided in footnotes. The corresponding risk (and its 95% confidence interval) is based on the assumed risk in the comparison group and the relative effect of the intervention (and its 95% CI). | ||||||
| GRADE Working Group grades of evidence | ||||||
| 1Unclear risk of selection bias and high risk of attrition and other bias (downgraded one level). | ||||||
| Alpidem compared with placebo for benzodiazepine discontinuation in chronic benzodiazepine users | ||||||
| Patient or population: adults who withdraw from chronic benzodiazepine use | ||||||
| Outcomes | Illustrative comparative risks* (95% CI) | Relative effect | No. of participants | Quality of the evidence | Comments | |
| Assumed risk | Corresponding risk | |||||
| Placebo | Alpidem | |||||
| Benzodiazepine discontinuation, end of intervention | Study population | RR 0.41 | 25 | ⊕⊕⊝⊝ | The required information size of 1918 participants was not met. | |
| 750 per 1000 | 308 per 1000 | |||||
| Benzodiazepine discontinuation, longest follow‐up | Not estimable | ‐ | ‐ | (0 study) | ‐ | No included study measured this outcome. |
| Withdrawal syndrome (clinical diagnosis), end of intervention | Study population | RR 4.86 | 145 | ⊕⊝⊝⊝ | ||
| 29 per 1000 | 143 per 1000 | |||||
| Benzodiazepine withdrawal symptoms, longest follow‐up | Not estimable | ‐ | ‐ | (0 study) | ‐ | No included study measured this outcome. |
| *The basis for the assumed risk (e.g. the median control group risk across studies) is provided in footnotes. The corresponding risk (and its 95% confidence interval) is based on the assumed risk in the comparison group and the relative effect of the intervention (and its 95% CI). | ||||||
| GRADE Working Group grades of evidence | ||||||
| 1Required information size not met (downgraded two levels due to imprecision). 3Unclear risk of selection and other bias, high risk of attrition bias (downgraded one level) | ||||||
| Buspirone compared with placebo for benzodiazepine discontinuation in chronic benzodiazepine users | ||||||
| Patient or population: adults who withdraw from chronic benzodiazepine use | ||||||
| Outcomes | Illustrative comparative risks* (95% CI) | Relative effect | No. of participants | Quality of the evidence | Comments | |
| Assumed risk | Corresponding risk | |||||
| Placebo | Buspirone | |||||
| Benzodiazepine discontinuation, end of intervention | Study population | RR 0.82 | 143 | ⊕⊕⊝⊝ | Trial Sequential Analysis showed that only 4.23% of the required information size (3381) was reached, indicating that insufficient information has been obtained. | |
| 563 per 1000 | 462 per 1000 | |||||
| Benzodiazepine discontinuation, longest follow‐up | Study population | RR 0.60 | 23 | ⊕⊕⊝⊝ | ||
| 917 per 1000 | 550 per 1000 | |||||
| Benzodiazepine withdrawal symptoms, end of intervention | ‐ | The mean benzodiazepine withdrawal symptoms, end of intervention in the intervention groups was | ‐ | 17 | ⊕⊝⊝⊝ | MD 4.69 (‐14.47 to 23.87) |
| Benzodiazepine withdrawal symptoms, longest follow‐up | ‐ | The mean benzodiazepine withdrawal symptoms, longest follow‐up in the intervention groups was | ‐ | 15 | ⊕⊝⊝⊝ | MD ‐1.34 (‐14.31 to 11.63) |
| *The basis for the assumed risk (e.g. the median control group risk across studies) is provided in footnotes. The corresponding risk (and its 95% confidence interval) is based on the assumed risk in the comparison group and the relative effect of the intervention (and its 95% CI). | ||||||
| GRADE Working Group grades of evidence | ||||||
| 1Unclear risk of selection, performance, and reporting bias. High risk of attrition and other bias (downgraded one level). | ||||||
| Melatonin compared with placebo for benzodiazepine discontinuation in chronic benzodiazepine users | ||||||
| Patient or population: adults who withdraw from chronic benzodiazepine use | ||||||
| Outcomes | Illustrative comparative risks* (95% CI) | Relative effect | No. of participants | Quality of the evidence | Comments | |
| Assumed risk | Corresponding risk | |||||
| Placebo | Melatonin | |||||
| Benzodiazepine discontinuation, end of intervention | Study population | RR 1.20 | 219 | ⊕⊝⊝⊝ | Trial Sequential Analysis showed that only 6.37% of the required information size (3438) was reached, indicating that insufficient information has been obtained. | |
| 417 per 1000 | 500 per 1000 | |||||
| Benzodiazepine discontinuation, longest follow‐up | Study population | RR 1.03 | 38 | ⊕⊝⊝⊝ | ||
| 389 per 1000 | 401 per 1000 | |||||
| Benzodiazpine withdrawal symptoms, end of intervention | Not estimable | ‐ | ‐ | (0 study) | ‐ | No included study measured this outcome. |
| Benzodiazepine withdrawal symptoms, longest follow‐up | Not estimable | ‐ | ‐ | (0 study) | ‐ | No included study measured this outcome. |
| *The basis for the assumed risk (e.g. the median control group risk across studies) is provided in footnotes. The corresponding risk (and its 95% confidence interval) is based on the assumed risk in the comparison group and the relative effect of the intervention (and its 95% CI). | ||||||
| GRADE Working Group grades of evidence | ||||||
| 1Unclear risk of selection, attrition, and reporting bias. High risk of other bias (downgraded one level). | ||||||
| Flumazenil compared with placebo for benzodiazepine discontinuation in chronic benzodiazepine users | ||||||
| Patient or population: adults who withdraw from chronic benzodiazepine use | ||||||
| Outcomes | Illustrative comparative risks* (95% CI) | Relative effect | No. of participants | Quality of the evidence | Comments | |
| Assumed risk | Corresponding risk | |||||
| Placebo | Flumazenil | |||||
| Benzodiazepine discontinuation, end of intervention | Not estimable | ‐ | ‐ | (0 study) | ‐ | No included study measured this outcome. |
| Benzodiazepine discontinuation, longest follow‐up | Not estimable | ‐ | ‐ | (0 study) | ‐ | No included study measured this outcome. |
| Benzodiazepine withdrawal symptoms, end of intervention | ‐ | The mean benzodiazepine withdrawal symptoms, end of intervention in the intervention groups was | ‐ | 58 | ⊕⊝⊝⊝ | SMD ‐0.95 (‐1.71 to ‐0.19) As a rule of thumb, 0.2 represents a small effect, 0.5 a moderate effect, and 0.8 a large effect. |
| Benzodiazepine withdrawal symptoms, longest follow‐up | Not estimable | ‐ | ‐ | (0 study) | ‐ | No included study measured this outcome. |
| *The basis for the assumed risk (e.g. the median control group risk across studies) is provided in footnotes. The corresponding risk (and its 95% confidence interval) is based on the assumed risk in the comparison group and the relative effect of the intervention (and its 95% CI). | ||||||
| GRADE Working Group grades of evidence | ||||||
| 1Unclear risk of selection bias and high risk of performance, detection, and other bias (downgraded one level). | ||||||
| Progesterone compared with placebo for benzodiazepine discontinuation in chronic benzodiazepine users | ||||||
| Patient or population: adults who withdraw from chronic benzodiazepine use | ||||||
| Outcomes | Illustrative comparative risks* (95% CI) | Relative effect | No. of participants | Quality of the evidence | Comments | |
| Assumed risk | Corresponding risk | |||||
| Placebo | Progesterone | |||||
| Benzodiazepine discontinuation, end of intervention | Study population | RR 1.15 | 35 | ⊕⊝⊝⊝ | The required information size of 1918 participants was not met. | |
| 417 per 1000 | 479 per 1000 | |||||
| Benzodiazepine discontinuation, longest follow‐up | Not estimable | ‐ | ‐ | (0 study) | ‐ | No included study measured this outcome. |
| Benzodiazepine withdrawal symptoms, end of intervention | Not estimable | ‐ | ‐ | (0 study) | ‐ | No included study measured this outcome. |
| Benzodiazepine withdrawal symptoms, longest follow‐up | Not estimable | ‐ | ‐ | (0 study) | ‐ | No included study measured this outcome. |
| *The basis for the assumed risk (e.g. the median control group risk across studies) is provided in footnotes. The corresponding risk (and its 95% confidence interval) is based on the assumed risk in the comparison group and the relative effect of the intervention (and its 95% CI). | ||||||
| GRADE Working Group grades of evidence | ||||||
| 1Unclear risk of selection and attrition bias (downgraded one level). | ||||||
| Magnesium aspartate compared with placebo for benzodiazepine discontinuation in chronic benzodiazepine users | ||||||
| Patient or population: adults who withdraw from chronic benzodiazepine use | ||||||
| Outcomes | Illustrative comparative risks* (95% CI) | Relative effect | No. of participants | Quality of the evidence | Comments | |
| Assumed risk | Corresponding risk | |||||
| Placebo | Magnesium aspartate | |||||
| Benzodiazepine discontinuation, end of intervention | Study population | RR 0.80 | 144 | ⊕⊝⊝⊝ | The required information size of 1918 participants was not met. | |
| 853 per 1000 | 683 per 1000 | |||||
| Benzodiazepine discontinuation, longest follow‐up | Not estimable | ‐ | ‐ | (0 study) | ‐ | No included study measured this outcome. |
| Benzodiazepine withdrawal symptoms, end of intervention | Not estimable | ‐ | ‐ | (0 study) | ‐ | No included study measured this outcome. |
| Benzodiazepine withdrawal symptoms, longest follow‐up | Not estimable | ‐ | ‐ | (0 study) | ‐ | No included study measured this outcome. |
| *The basis for the assumed risk (e.g. the median control group risk across studies) is provided in footnotes. The corresponding risk (and its 95% confidence interval) is based on the assumed risk in the comparison group and the relative effect of the intervention (and its 95% CI). | ||||||
| GRADE Working Group grades of evidence | ||||||
| 1Unclear risk of selection, detection, and attrition bias (downgraded one level). | ||||||
| Homéogène 46/Sedatif PC (homeopathic drugs) compared with placebo for benzodiazepine discontinuation in chronic benzodiazepine users | ||||||
| Patient or population: adults who withdraw from chronic benzodiazepine use | ||||||
| Outcomes | Illustrative comparative risks* (95% CI) | Relative effect | No. of participants | Quality of the evidence | Comments | |
| Assumed risk | Corresponding risk | |||||
| Placebo | Homéogène 46/Sedatif PC (homeopathic drugs) | |||||
| Benzodiazepine discontinuation, end of intervention | Study population | RR 0.79 | 51 | ⊕⊝⊝⊝ | The required information size was not met. | |
| 381 per 1000 | 301 per 1000 | |||||
| Benzodiazepine discontinuation, longest follow‐up | Not estimable | ‐ | ‐ | (0 study) | ‐ | No included study measured this outcome. |
| Benzodiazepine withdrawal symptoms, end of intervention | Not estimable | ‐ | ‐ | (0 study) | ‐ | No included study measured this outcome. |
| Benzodiazepine withdrawal symptoms, longest follow‐up | Not estimable | ‐ | ‐ | (0 study) | ‐ | No included study measured this outcome. |
| *The basis for the assumed risk (e.g. the median control group risk across studies) is provided in footnotes. The corresponding risk (and its 95% confidence interval) is based on the assumed risk in the comparison group and the relative effect of the intervention (and its 95% CI). | ||||||
| GRADE Working Group grades of evidence | ||||||
| 1Unclear risk of selection, attrition, and other bias (downgraded one level). | ||||||
| Carbamazepine compared with tricyclic antidepressant for benzodiazepine discontinuation in chronic benzodiazepine users | ||||||
| Patient or population: adults who withdraw from chronic benzodiazepine use | ||||||
| Outcomes | Illustrative comparative risks* (95% CI) | Relative effect | No. of participants | Quality of the evidence | Comments | |
| Assumed risk | Corresponding risk | |||||
| Tricyclic antidepressant | Carbamazepine | |||||
| Benzodiazepine discontinuation, end of intervention | Study population | RR 1.00 | 48 | ⊕⊕⊝⊝ | The required information size was not met. | |
| 833 per 1000 | 833 per 1000 | |||||
| Benzodiazepine discontinuation, longest follow‐up | Not estimable | ‐ | ‐ | (0 study) | ‐ | No included study measured this outcome. |
| Benzodiazepine withdrawal symptoms, end of intervention | Not estimable | ‐ | ‐ | (0 study) | ‐ | No included study measured this outcome. |
| Benzodiazepine withdrawal symptoms, longest follow‐up | Not estimable | ‐ | ‐ | (0 study) | ‐ | No included study measured this outcome. |
| *The basis for the assumed risk (e.g. the median control group risk across studies) is provided in footnotes. The corresponding risk (and its 95% confidence interval) is based on the assumed risk in the comparison group and the relative effect of the intervention (and its 95% CI). | ||||||
| GRADE Working Group grades of evidence | ||||||
| 1Unclear risk of selection, detection, and attrition bias (downgraded one level). | ||||||
| Outcome or subgroup title | No. of studies | No. of participants | Statistical method | Effect size |
| 1 Benzodiazepine discontinuation, end of intervention Show forest plot | 1 | 27 | Risk Ratio (M‐H, Random, 95% CI) | 2.55 [1.08, 6.03] |
| 2 Relapse to benzodiazepine use, end of intervention Show forest plot | 1 | 27 | Risk Ratio (M‐H, Random, 95% CI) | 0.31 [0.11, 0.90] |
| 3 Benzodiazepine discontinuation, longest follow‐up Show forest plot | 1 | 24 | Risk Ratio (M‐H, Random, 95% CI) | 1.57 [0.80, 3.09] |
| 4 Relapse to benzodiazepine use, longest follow‐up Show forest plot | 1 | 24 | Risk Ratio (M‐H, Random, 95% CI) | 0.43 [0.13, 1.39] |
| 5 Anxiety: HAM‐A (Hamilton Anxiety Rating Scale), end of intervention Show forest plot | 1 | 27 | Mean Difference (IV, Random, 95% CI) | ‐0.40 [‐6.47, 5.67] |
| 6 Benzodiazepine withdrawal symptoms, end of intervention Show forest plot | 2 | 56 | Std. Mean Difference (IV, Random, 95% CI) | ‐0.15 [‐0.68, 0.37] |
| 6.1 Physician Withdrawal Checklist | 1 | 27 | Std. Mean Difference (IV, Random, 95% CI) | ‐0.01 [‐0.77, 0.74] |
| 6.2 CIWA‐B (Clinical Institute Withdrawal Assessment Scale ‐ Benzodiazepines) | 1 | 29 | Std. Mean Difference (IV, Random, 95% CI) | ‐0.28 [‐1.01, 0.45] |
| 7 Discontinuation due to adverse events Show forest plot | 1 | 29 | Risk Ratio (M‐H, Random, 95% CI) | 0.0 [0.0, 0.0] |
| 8 Serious adverse events Show forest plot | 1 | 29 | Risk Ratio (M‐H, Random, 95% CI) | 0.0 [0.0, 0.0] |
| Outcome or subgroup title | No. of studies | No. of participants | Statistical method | Effect size |
| 1 Benzodiazepine discontinuation, end of intervention Show forest plot | 3 | 147 | Risk Ratio (M‐H, Random, 95% CI) | 1.33 [0.99, 1.80] |
| 2 Benzodiazepine withdrawal symptoms Show forest plot | 2 | 76 | Std. Mean Difference (IV, Random, 95% CI) | ‐1.14 [‐2.43, 0.16] |
| 2.1 Physician Withdrawal Checklist | 1 | 36 | Std. Mean Difference (IV, Random, 95% CI) | ‐1.82 [‐2.61, ‐1.03] |
| 2.2 Patient Withdrawal Checklist | 1 | 40 | Std. Mean Difference (IV, Random, 95% CI) | ‐0.50 [‐1.13, 0.13] |
| 3 Benzodiazepine discontinuation, longest follow‐up Show forest plot | 1 | 40 | Risk Ratio (M‐H, Random, 95% CI) | 1.41 [0.86, 2.29] |
| 4 Relapse to benzodiazepine use Show forest plot | 1 | 36 | Risk Ratio (M‐H, Random, 95% CI) | 0.33 [0.08, 1.44] |
| 5 Serious adverse events Show forest plot | 1 | 36 | Risk Ratio (M‐H, Random, 95% CI) | 0.0 [0.0, 0.0] |
| 6 Non‐serious adverse events Show forest plot | 1 | 36 | Risk Ratio (M‐H, Random, 95% CI) | 7.0 [0.39, 126.48] |
| 7 Anxiety, HAM‐A Show forest plot | 1 | 36 | Mean Difference (IV, Random, 95% CI) | ‐6.0 [‐9.58, ‐2.42] |
| 8 Discontinuation due to adverse events Show forest plot | 1 | 36 | Risk Ratio (M‐H, Random, 95% CI) | 0.0 [0.0, 0.0] |
| Outcome or subgroup title | No. of studies | No. of participants | Statistical method | Effect size |
| 1 Benzodiazepine discontinuation Show forest plot | 1 | 230 | Risk Ratio (M‐H, Random, 95% CI) | 1.05 [0.86, 1.28] |
| 2 Serious adverse events Show forest plot | 1 | 230 | Risk Ratio (M‐H, Random, 95% CI) | 0.0 [0.0, 0.0] |
| 3 Non‐serious adverse events Show forest plot | 1 | 230 | Risk Ratio (M‐H, Random, 95% CI) | 1.06 [0.75, 1.49] |
| 4 Discontinuation due to adverse events Show forest plot | 1 | 230 | Risk Ratio (M‐H, Random, 95% CI) | 1.38 [0.13, 15.03] |
| Outcome or subgroup title | No. of studies | No. of participants | Statistical method | Effect size |
| 1 Benzodiazepine discontinuation, end of intervention Show forest plot | 1 | 106 | Risk Ratio (M‐H, Random, 95% CI) | 1.44 [0.92, 2.25] |
| 2 Benzodiazepine withdrawal symptoms (Physician Withdrawal Checklist), end of intervention Show forest plot | 1 | 106 | Mean Difference (IV, Random, 95% CI) | ‐3.1 [‐3.51, ‐2.69] |
| 3 Anxiety, HAM‐A, end of intervention Show forest plot | 1 | 106 | Mean Difference (IV, Random, 95% CI) | ‐4.8 [‐5.28, ‐4.32] |
| 4 Serious adverse events Show forest plot | 1 | 106 | Risk Ratio (M‐H, Random, 95% CI) | 0.67 [0.16, 2.85] |
| 5 Non‐serious adverse events Show forest plot | 1 | 106 | Risk Ratio (M‐H, Random, 95% CI) | 1.08 [0.84, 1.40] |
| 6 Discontinuation due to adverse events Show forest plot | 1 | 106 | Risk Ratio (M‐H, Random, 95% CI) | 0.89 [0.31, 2.59] |
| Outcome or subgroup title | No. of studies | No. of participants | Statistical method | Effect size |
| 1 Benzodiazepine withdrawal symptoms, BWSQ (Benzodiazepine Withdrawal Symptom Questionnaire), end of intervention Show forest plot | 1 | 81 | Mean Difference (IV, Random, 95% CI) | 1.00 [‐1.13, ‐0.87] |
| 2 Anxiety, HAM‐A, end of intervention Show forest plot | 1 | 81 | Mean Difference (IV, Random, 95% CI) | ‐5.7 [‐6.05, ‐5.35] |
| 3 Serious adverse events Show forest plot | 1 | 81 | Risk Ratio (M‐H, Random, 95% CI) | 0.0 [0.0, 0.0] |
| 4 Non‐serious adverse events Show forest plot | 1 | 81 | Risk Ratio (M‐H, Random, 95% CI) | 0.0 [0.0, 0.0] |
| Outcome or subgroup title | No. of studies | No. of participants | Statistical method | Effect size |
| 1 Benzodiazepine discontinuation, end of intervention Show forest plot | 3 | 221 | Risk Ratio (M‐H, Random, 95% CI) | 1.45 [0.88, 2.39] |
| 2 Benzodiazepine withdrawal symptoms: BWSQ, end of intervention Show forest plot | 2 | 99 | Mean Difference (IV, Random, 95% CI) | ‐3.57 [‐5.34, ‐1.80] |
| 3 Anxiety: HAM‐A, end of intervention Show forest plot | 2 | 99 | Mean Difference (IV, Random, 95% CI) | ‐6.75 [‐9.64, ‐3.86] |
| 4 Benzodiazepine withdrawal symptoms: BWSQ, longest follow‐up: 6 months Show forest plot | 1 | 54 | Mean Difference (IV, Random, 95% CI) | ‐0.13 [‐4.03, 3.77] |
| 5 Serious adverse events Show forest plot | 2 | 176 | Risk Ratio (M‐H, Random, 95% CI) | 0.0 [0.0, 0.0] |
| 6 Non‐serious adverse events Show forest plot | 1 | 54 | Risk Ratio (M‐H, Random, 95% CI) | 1.33 [0.35, 5.03] |
| Outcome or subgroup title | No. of studies | No. of participants | Statistical method | Effect size |
| 1 Benzodiazepine discontinuation, end of intervention Show forest plot | 2 | 105 | Risk Ratio (M‐H, Random, 95% CI) | 0.82 [0.52, 1.28] |
| 2 Anxiety: HAM‐A (change from baseline), end of intervention Show forest plot | 2 | 66 | Mean Difference (IV, Random, 95% CI) | ‐10.38 [‐25.96, 5.20] |
| 3 Benzodiazepine discontinuation, longest follow‐up Show forest plot | 1 | 47 | Risk Ratio (M‐H, Random, 95% CI) | 2.20 [1.27, 3.82] |
| 4 Benzodiazepine withdrawal symptoms (Physician Withdrawal Checklist), end of intervention Show forest plot | 1 | 38 | Mean Difference (IV, Random, 95% CI) | ‐19.78 [‐20.25, ‐19.31] |
| 5 Relapse to benzodiazepine use, end of intervention Show forest plot | 1 | 36 | Risk Ratio (M‐H, Random, 95% CI) | 2.0 [0.73, 5.47] |
| 6 Discontinuation due to adverse events Show forest plot | 2 | 134 | Risk Ratio (M‐H, Random, 95% CI) | 1.16 [0.42, 3.21] |
| Outcome or subgroup title | No. of studies | No. of participants | Statistical method | Effect size |
| 1 Benzodiazepine discontinuation, end of intervention Show forest plot | 1 | 25 | Risk Ratio (M‐H, Random, 95% CI) | 0.41 [0.17, 0.99] |
| 2 Withdrawal syndrome (clinical diagnosis), end of intervention Show forest plot | 1 | 145 | Risk Ratio (M‐H, Random, 95% CI) | 4.86 [1.12, 21.14] |
| 3 Anxiety, HAM‐A, end of intervention Show forest plot | 2 | 170 | Mean Difference (IV, Random, 95% CI) | ‐1.60 [‐4.64, 1.45] |
| 4 Relapse to benzodiazepine use, end of intervention Show forest plot | 1 | 145 | Risk Ratio (M‐H, Random, 95% CI) | 0.33 [0.09, 1.20] |
| 5 Serious adverse events Show forest plot | 1 | 25 | Risk Ratio (M‐H, Random, 95% CI) | 0.0 [0.0, 0.0] |
| 6 Discontinuation due to adverse events Show forest plot | 1 | 25 | Risk Ratio (M‐H, Random, 95% CI) | 0.46 [0.05, 4.46] |
| Outcome or subgroup title | No. of studies | No. of participants | Statistical method | Effect size |
| 1 Benzodiazepine discontinuation, end of intervention Show forest plot | 4 | 143 | Risk Ratio (M‐H, Random, 95% CI) | 0.82 [0.49, 1.37] |
| 2 Anxiety: HAM‐A/Hospital Anxiety Depression Scale, end of intervention Show forest plot | 2 | 41 | Std. Mean Difference (IV, Random, 95% CI) | 0.18 [‐0.50, 0.86] |
| 3 Benzodiazepine withdrawal symptoms, end of intervention Show forest plot | 1 | 17 | Mean Difference (IV, Random, 95% CI) | 4.69 [‐14.47, 23.85] |
| 4 Benzodiazepine discontinuation, longest follow‐up Show forest plot | 1 | 23 | Risk Ratio (M‐H, Random, 95% CI) | 0.60 [0.34, 1.05] |
| 5 Benzodiazepine withdrawal symptoms, longest follow‐up Show forest plot | 1 | 15 | Mean Difference (IV, Random, 95% CI) | ‐1.34 [‐14.31, 11.63] |
| 6 Anxiety, Hospital Anxiety Depression Scale, longest follow‐up Show forest plot | 1 | 12 | Mean Difference (IV, Random, 95% CI) | 2.75 [‐2.83, 8.33] |
| 7 Discontinuation due to adverse events Show forest plot | 1 | 72 | Risk Ratio (M‐H, Random, 95% CI) | 0.33 [0.01, 7.92] |
| Outcome or subgroup title | No. of studies | No. of participants | Statistical method | Effect size |
| 1 Benzodiazepine discontinuation, end of intervention Show forest plot | 4 | 219 | Risk Ratio (M‐H, Random, 95% CI) | 1.20 [0.73, 1.96] |
| 2 Insomnia Show forest plot | 3 | 150 | Std. Mean Difference (IV, Random, 95% CI) | ‐1.23 [‐2.70, 0.23] |
| 2.1 PSQI (Pittsburgh Sleep Quality Index) global score (higher = worse), end of intervention | 2 | 116 | Std. Mean Difference (IV, Random, 95% CI) | ‐0.31 [‐0.92, 0.31] |
| 2.2 Sleep quality (1 poorest, 10 excellent), end of intervention | 1 | 34 | Std. Mean Difference (IV, Random, 95% CI) | ‐3.34 [‐4.42, ‐2.26] |
| 3 Discontinuation due to adverse events Show forest plot | 2 | 120 | Risk Ratio (M‐H, Random, 95% CI) | 2.10 [0.20, 22.26] |
| 4 Benzodiazepine discontinuation, longest follow‐up Show forest plot | 1 | 38 | Risk Ratio (M‐H, Random, 95% CI) | 1.03 [0.47, 2.27] |
| 5 Adverse events Show forest plot | 1 | 86 | Risk Ratio (M‐H, Random, 95% CI) | 0.97 [0.52, 1.82] |
| 6 Relapse to benzodiazepine use, longest follow‐up Show forest plot | 1 | 38 | Risk Ratio (M‐H, Random, 95% CI) | 1.8 [0.37, 8.68] |
| Outcome or subgroup title | No. of studies | No. of participants | Statistical method | Effect size |
| 1 Benzodiazepine withdrawal symptoms, end of intervention Show forest plot | 3 | 58 | Std. Mean Difference (IV, Random, 95% CI) | ‐0.95 [‐1.71, ‐0.19] |
| 2 Anxiety, HAM‐D (Hamilton Depression Rating Scale), end of intervention Show forest plot | 1 | 18 | Mean Difference (IV, Random, 95% CI) | ‐1.3 [‐2.28, ‐0.32] |
| 3 Benzodiazepine mean dose, end of intervention Show forest plot | 1 | 10 | Mean Difference (IV, Random, 95% CI) | ‐3.70 [‐22.06, 14.66] |
| Outcome or subgroup title | No. of studies | No. of participants | Statistical method | Effect size |
| 1 Relapse to benzodiazepine use, end of intervention: 2 weeks Show forest plot | 1 | 40 | Risk Ratio (M‐H, Random, 95% CI) | 0.64 [0.31, 1.30] |
| Outcome or subgroup title | No. of studies | No. of participants | Statistical method | Effect size |
| 1 Benzodiazepine discontinuation, end of intervention Show forest plot | 1 | 35 | Risk Ratio (M‐H, Random, 95% CI) | 1.15 [0.52, 2.54] |
| 2 Non‐serious adverse events Show forest plot | 1 | 35 | Risk Ratio (M‐H, Random, 95% CI) | 3.13 [1.15, 8.54] |
| Outcome or subgroup title | No. of studies | No. of participants | Statistical method | Effect size |
| 1 Benzodiazepine discontinuation Show forest plot | 1 | 144 | Risk Ratio (M‐H, Random, 95% CI) | 0.80 [0.66, 0.96] |
| 2 Anxiety Show forest plot | 1 | 144 | Mean Difference (IV, Random, 95% CI) | ‐0.80 [‐2.73, 1.13] |
| 3 Relapse to benzodiazepine use Show forest plot | 1 | 144 | Risk Ratio (M‐H, Random, 95% CI) | 0.93 [0.46, 1.87] |
| 4 Non‐serious adverse events Show forest plot | 1 | 144 | Risk Ratio (M‐H, Random, 95% CI) | 0.49 [0.18, 1.35] |
| 5 Discontinuation due to adverse events Show forest plot | 1 | 144 | Risk Ratio (M‐H, Random, 95% CI) | 0.40 [0.13, 1.18] |
| Outcome or subgroup title | No. of studies | No. of participants | Statistical method | Effect size |
| 1 Benzodiazepine discontinuation Show forest plot | 1 | 51 | Risk Ratio (M‐H, Random, 95% CI) | 0.79 [0.36, 1.70] |
| Outcome or subgroup title | No. of studies | No. of participants | Statistical method | Effect size |
| 1 Benzodiazepine discontinuation, end of intervention Show forest plot | 1 | 48 | Risk Ratio (M‐H, Random, 95% CI) | 1.0 [0.78, 1.29] |
| 2 Relapse to benzodiazepine use Show forest plot | 1 | 48 | Risk Ratio (M‐H, Random, 95% CI) | 1.0 [0.28, 3.54] |
| 3 Serious adverse events Show forest plot | 1 | 48 | Risk Ratio (M‐H, Random, 95% CI) | 0.0 [0.0, 0.0] |
| Outcome or subgroup title | No. of studies | No. of participants | Statistical method | Effect size |
| 1 Relapse to benzodiazepine use, longest follow‐up Show forest plot | 1 | 124 | Risk Ratio (M‐H, Random, 95% CI) | 0.33 [0.14, 0.78] |
| 2 Anxiety: Maximum amplitude of rebound (HAM‐A), end of intervention Show forest plot | 1 | 160 | Mean Difference (IV, Random, 95% CI) | 0.50 [‐1.23, 2.23] |
| 3 Discontinuation due to adverse events Show forest plot | 1 | 160 | Risk Ratio (M‐H, Random, 95% CI) | 2.87 [0.79, 10.44] |
| 4 Non‐serious adverse events Show forest plot | 1 | 160 | Risk Ratio (M‐H, Random, 95% CI) | 1.68 [1.01, 2.78] |
| Outcome or subgroup title | No. of studies | No. of participants | Statistical method | Effect size |
| 1 Relapse to benzodiazepine use, longest follow‐up Show forest plot | 1 | 18 | Risk Ratio (M‐H, Random, 95% CI) | 1.05 [0.23, 4.78] |