Anticoagulantes orales directos versus warfarina para la prevención del accidente cerebrovascular y los eventos embólicos sistémicos en los pacientes con fibrilación auricular y nefropatía crónica
Información
- DOI:
- https://doi.org/10.1002/14651858.CD011373.pub2Copiar DOI

- Base de datos:
-
- Cochrane Database of Systematic Reviews
- Versión publicada:
-
- 06 noviembre 2017see what's new
- Tipo:
-
- Intervention
- Etapa:
-
- Review
- Grupo Editorial Cochrane:
-
Grupo Cochrane de Riñón y trasplante
- Copyright:
-
- Copyright © 2017 The Cochrane Collaboration. Published by John Wiley & Sons, Ltd.
Cifras del artículo
Altmetric:
Citado por:
Autores
Contributions of authors
-
Drafted the protocol: MK, TAF, KK, YG, S Fukuhara
-
Study selection: MK, KK, YG
-
Extracted data from studies: MK, KK, YG
-
Entered data into RevMan: MK, KK
-
Carried out the analysis: MK, KK, YG
-
Interpreted the analysis: MK TAF, KK, YG, S Fukuma, S Fukuhara
-
Drafted the final review: MK, TAF, KK, YG,
-
Disagreement resolution: MK, TAF
-
Updated the review: MK
Declarations of interest
-
Miho Kimachi: none known
-
Toshiaki Furukawa has received lecture fees from Eli Lilly, Janssen, Meiji, Mitsubishi‐Tanabe, MSD and Pfizer. He has received royalties from Igaku‐Shoin and Nihon Bunka Kagaku‐sha publishers. He has received research support from Mitsubishi‐Tanabe and Mochida. These funds are not related to the production of this review.
-
Kimihiko Kimachi: none known
-
Yoshihito Goto: none known
-
Shingo Fukuma: none known
-
Shunichi Fukuhara: none known
Acknowledgements
We would like to thank the referees for their advice and feedback during the preparation of this manuscript.
Version history
| Published | Title | Stage | Authors | Version |
| 2017 Nov 06 | Direct oral anticoagulants versus warfarin for preventing stroke and systemic embolic events among atrial fibrillation patients with chronic kidney disease | Review | Miho Kimachi, Toshi A Furukawa, Kimihiko Kimachi, Yoshihito Goto, Shingo Fukuma, Shunichi Fukuhara | |
| 2014 Nov 10 | New oral anticoagulants versus warfarin for preventing stroke and systemic embolic events among atrial fibrillation patients with chronic kidney disease | Protocol | Miho Kimachi, Toshi A Furukawa, Kimihiko Kimachi, Yoshihito Goto, Shunichi Fukuhara | |
Differences between protocol and review
We changed the terms "NOACs (New oral anticoagulants)" to "DOAC (direct oral anticoagulants)" in accordance with the recommendation of the International Society on Thrombosis and Haemostasis (ISTH). In the original protocol, we intended to distinguish the effect of DOAC on two efficacy primary outcomes: all strokes and systemic embolic events. However, all included studies reported composite outcomes for all strokes, including ischaemic and haemorrhagic stroke and systemic embolic events; we therefore assessed these as one composite outcome.
Keywords
MeSH
Medical Subject Headings (MeSH) Keywords
- Administration, Oral;
- Anticoagulants [adverse effects, *therapeutic use];
- Antithrombins [adverse effects, therapeutic use];
- Atrial Fibrillation [*complications];
- Dabigatran [adverse effects, therapeutic use];
- Embolism [*prevention & control];
- Hemorrhage [chemically induced, epidemiology];
- Pyrazoles [adverse effects, therapeutic use];
- Pyridines [adverse effects, therapeutic use];
- Pyridones [adverse effects, therapeutic use];
- Randomized Controlled Trials as Topic;
- Renal Insufficiency, Chronic [*complications];
- Rivaroxaban [adverse effects, therapeutic use];
- Stroke [*prevention & control];
- Thiazoles [adverse effects, therapeutic use];
- Warfarin [adverse effects, therapeutic use];
Medical Subject Headings Check Words
Humans;
PICO

Study flow diagram.

Risk of bias graph: review authors' judgements about each risk of bias item presented as percentages across all included studies.
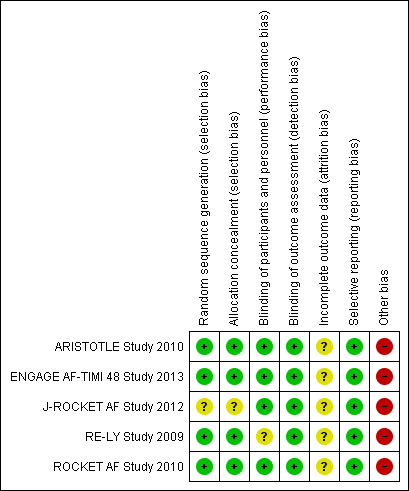
Risk of bias summary: review authors' judgements about each risk of bias item for each included study.

Comparison 1 Direct oral anticoagulants versus warfarin, Outcome 1 All strokes and systemic embolic events.
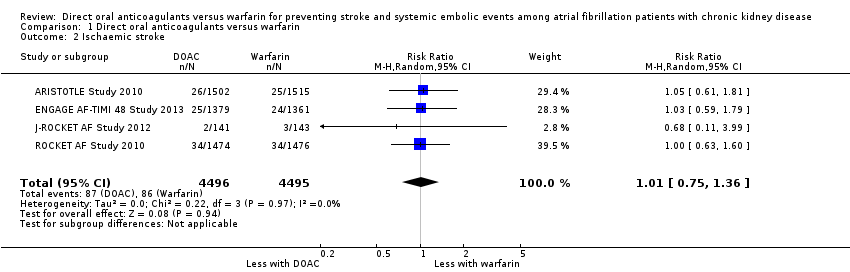
Comparison 1 Direct oral anticoagulants versus warfarin, Outcome 2 Ischaemic stroke.

Comparison 1 Direct oral anticoagulants versus warfarin, Outcome 3 Haemorrhagic stroke.

Comparison 1 Direct oral anticoagulants versus warfarin, Outcome 4 Major bleeding.
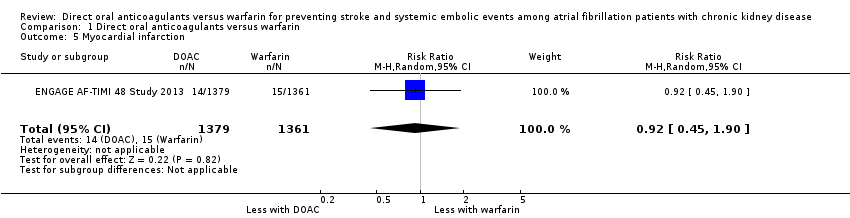
Comparison 1 Direct oral anticoagulants versus warfarin, Outcome 5 Myocardial infarction.

Comparison 1 Direct oral anticoagulants versus warfarin, Outcome 6 Minor bleeding.
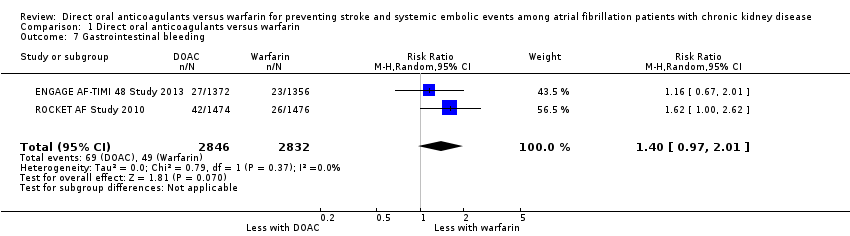
Comparison 1 Direct oral anticoagulants versus warfarin, Outcome 7 Gastrointestinal bleeding.

Comparison 1 Direct oral anticoagulants versus warfarin, Outcome 8 Intracranial haemorrhage.

Comparison 1 Direct oral anticoagulants versus warfarin, Outcome 9 All‐cause mortality.

Comparison 2 Direct oral anticoagulants versus warfarin: subgroup analysis for participants with CrCl 30 to 50 mL/min, Outcome 1 All strokes and systemic embolic events.
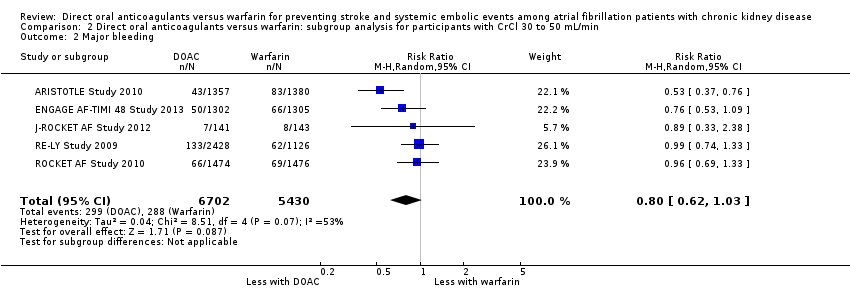
Comparison 2 Direct oral anticoagulants versus warfarin: subgroup analysis for participants with CrCl 30 to 50 mL/min, Outcome 2 Major bleeding.
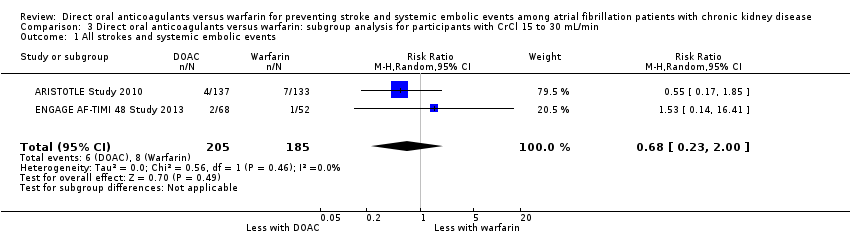
Comparison 3 Direct oral anticoagulants versus warfarin: subgroup analysis for participants with CrCl 15 to 30 mL/min, Outcome 1 All strokes and systemic embolic events.
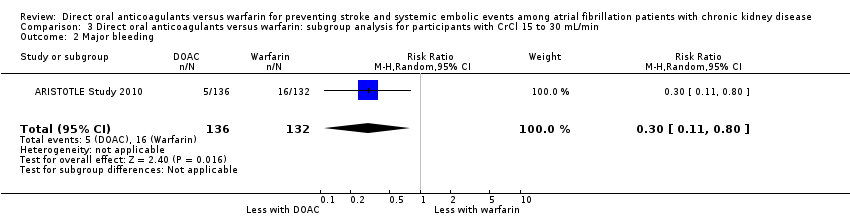
Comparison 3 Direct oral anticoagulants versus warfarin: subgroup analysis for participants with CrCl 15 to 30 mL/min, Outcome 2 Major bleeding.
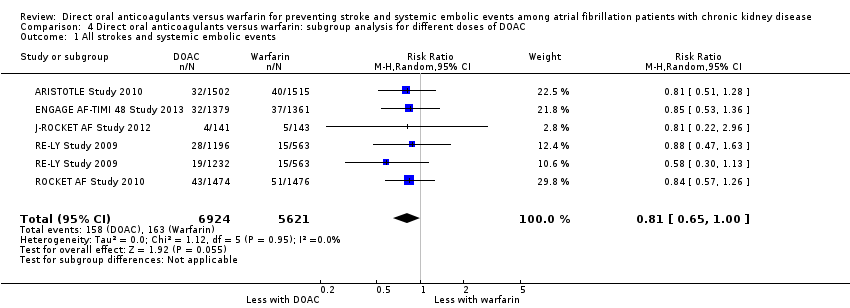
Comparison 4 Direct oral anticoagulants versus warfarin: subgroup analysis for different doses of DOAC, Outcome 1 All strokes and systemic embolic events.

Comparison 4 Direct oral anticoagulants versus warfarin: subgroup analysis for different doses of DOAC, Outcome 2 Major bleeding.

Comparison 4 Direct oral anticoagulants versus warfarin: subgroup analysis for different doses of DOAC, Outcome 3 All‐cause mortality.
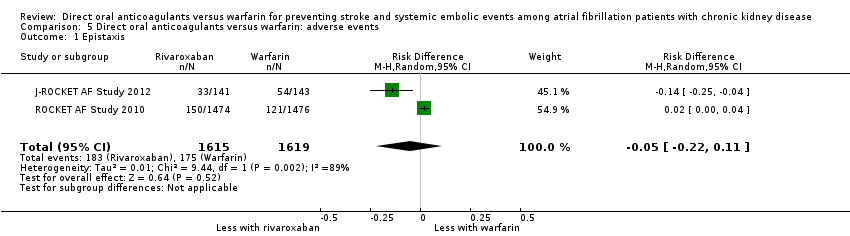
Comparison 5 Direct oral anticoagulants versus warfarin: adverse events, Outcome 1 Epistaxis.
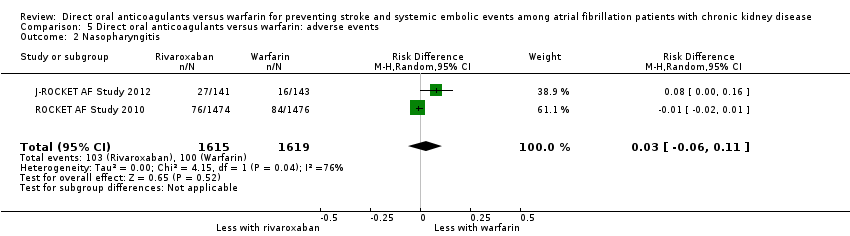
Comparison 5 Direct oral anticoagulants versus warfarin: adverse events, Outcome 2 Nasopharyngitis.
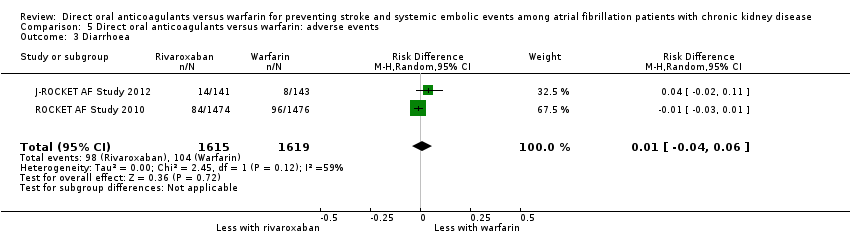
Comparison 5 Direct oral anticoagulants versus warfarin: adverse events, Outcome 3 Diarrhoea.

Comparison 5 Direct oral anticoagulants versus warfarin: adverse events, Outcome 4 Upper respiratory tract inflammation.

Comparison 5 Direct oral anticoagulants versus warfarin: adverse events, Outcome 5 Back pain.

Comparison 5 Direct oral anticoagulants versus warfarin: adverse events, Outcome 6 Cardiac failure.

Comparison 6 Direct oral anticoagulants versus warfarin: fixed‐effect model, Outcome 1 All strokes and systemic embolic events.
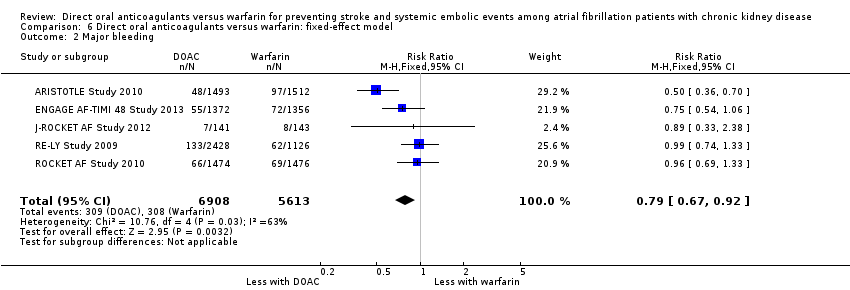
Comparison 6 Direct oral anticoagulants versus warfarin: fixed‐effect model, Outcome 2 Major bleeding.
| DOAC versus warfarin for preventing stroke and systemic embolic events among atrial fibrillation patients with CKD | |||||
| Patient or population: atrial fibrillation patients with CKD Setting: Hospital‐based setting Intervention: DOAC Comparison: Dose‐adjusted warfarin | |||||
| Outcomes | Illustrative comparative risks* (95% CI) | Relative effect | No. of participants | Quality of the evidence | |
| Assumed risk | Corresponding risk | ||||
| Warfarin | DOAC | ||||
| All strokes and systemic embolic events Follow up: 1.8 years to 2.8 years | 29 per 1,000 | 23 per 1,000 | RR 0.81 (0.65 to 1.00) | 12,545 (5) | ⊕⊕⊕⊝¹ |
| Major bleeding Follow up: 1.8 years to 2.8 years | 55 per 1,000 | 43 per 1,000 | RR 0.79 (0.59 to 1.04) | 12,521 (5) | ⊕⊕⊝⊝¹ ² |
| Myocardial infarction Follow up: 2.8 years | 11 per 1,000 | 10 per 1,000 (5 to 21) | RR 0.92 (0.45 to 1.90) | 2,740 (1) | ‐ |
| Minor bleeding Follow up: 2.5 years to 2.8 years | 74 per 1,000 | 72 per 1,000 (43 to 119) | RR 0.97 (0.58 to 1.61) | 3,012 (2) | ⊕⊕⊝⊝¹ ² |
| Gastrointestinal bleeding Follow up: 1.9 years to 2.8 years | 17 per 1,000 | 24 per 1,000 (17 to 35) | RR 1.40 (0.97 to 2.01) | 5,678 (2) | ⊕⊕⊕⊝¹ |
| Intracranial haemorrhage Follow up: 1.8 years to 2.8 years | 14 per 1,000 | 6 per 1,000 | RR 0.43 (0.27 to 0.69) | 12,521 (5) | ⊕⊕⊕⊝¹ |
| All‐cause mortality Follow up: 1.8 years to 2.8 years | 78 per 1,000 | 71 per 1,000 | RR 0.91 (0.78 to 1.05) | 9,595 (4) | ⊕⊕⊕⊝¹ |
| *The risk in the intervention group (and its 95% CI) is based on the assumed risk in the comparison group and the relative effect of the intervention (and its 95% CI). AF: atrial fibrillation; CI: confidence interval; DOAC: direct oral anticoagulants; RR: risk ratio | |||||
| GRADE Working Group grades of evidence | |||||
| 1 Some concerns with imprecision because of the uncertain effect estimate 2 Some concerns with inconsistency because of medium heterogeneity | |||||
| Dabigatran | Apixaban | Rivaroxaban | Edoxaban | |
| 150 mg twice daily for CKD stage G3 (CrCl 30 to 50 mL/min) No recommendation for CKD stage G4 | 2.5 mg twice daily in patients with at least two of the following characteristics: ‐ age ≥ 80 years ‐ body weight ≤ 60 kg ‐ SCr > 1.5 mg/dL | 15 mg daily for CKD stage G3 and G4 (CrCl 15 to 50 mL/min) | 30 mg once daily for CKD stage G3 and G4 (CrCl 15 to 50 mL/min) | |
| 150 mg twice daily for CKD stage G3 (CrCl > 30 mL/min) 75 mg twice daily for CKD stage G4 (CrCl 15 to 30 mL/min) | 2.5 mg twice daily in patients with at least two of the following characteristics: ‐ age ≥ 80 years ‐ body weight ≤ 60 kg ‐ SCr > 1.5 mg/dL | 15 mg daily for CKD stage G3 and G4 (CrCl 15 to 50 mL/min) | 30 mg once daily for CKD stage G3 and G4 (CrCl 15 to 50 mL/min) | |
| 110 or 150 mg twice daily for CKD stage G3 (CrCl 30 to 50 mL/min) No recommendation for CKD stage G4 | 2.5 mg twice daily in patients with at least two of the following characteristics: ‐ age ≥ 80 years ‐ body weight ≤ 60 kg ‐ SCr > 1.5 mg/dL | 15 mg daily for CKD stage G3 (CrCl 30 to 50 mL/min) No recommendation for CKD stage G4 | 30 mg once daily for CKD stage G3 (CrCl 30 to 50 mL/min) | |
| CKD ‐ chronic kidney disease; CrCl ‐ creatinine clearance; SCr ‐ serum creatinine | ||||
| Outcome or subgroup title | No. of studies | No. of participants | Statistical method | Effect size |
| 1 All strokes and systemic embolic events Show forest plot | 5 | 12545 | Risk Ratio (M‐H, Random, 95% CI) | 0.81 [0.65, 1.00] |
| 2 Ischaemic stroke Show forest plot | 4 | 8991 | Risk Ratio (M‐H, Random, 95% CI) | 1.01 [0.75, 1.36] |
| 3 Haemorrhagic stroke Show forest plot | 4 | 8991 | Risk Ratio (M‐H, Random, 95% CI) | 0.52 [0.28, 0.97] |
| 4 Major bleeding Show forest plot | 5 | 12521 | Risk Ratio (M‐H, Random, 95% CI) | 0.79 [0.59, 1.04] |
| 5 Myocardial infarction Show forest plot | 1 | 2740 | Risk Ratio (M‐H, Random, 95% CI) | 0.92 [0.45, 1.90] |
| 6 Minor bleeding Show forest plot | 2 | 3012 | Risk Ratio (M‐H, Random, 95% CI) | 0.97 [0.58, 1.61] |
| 7 Gastrointestinal bleeding Show forest plot | 2 | 5678 | Risk Ratio (M‐H, Random, 95% CI) | 1.40 [0.97, 2.01] |
| 8 Intracranial haemorrhage Show forest plot | 5 | 12521 | Risk Ratio (M‐H, Random, 95% CI) | 0.43 [0.27, 0.69] |
| 9 All‐cause mortality Show forest plot | 4 | 9595 | Risk Ratio (M‐H, Random, 95% CI) | 0.91 [0.78, 1.05] |
| Outcome or subgroup title | No. of studies | No. of participants | Statistical method | Effect size |
| 1 All strokes and systemic embolic events Show forest plot | 5 | 12155 | Risk Ratio (M‐H, Random, 95% CI) | 0.82 [0.66, 1.02] |
| 2 Major bleeding Show forest plot | 5 | 12132 | Risk Ratio (M‐H, Random, 95% CI) | 0.80 [0.62, 1.03] |
| Outcome or subgroup title | No. of studies | No. of participants | Statistical method | Effect size |
| 1 All strokes and systemic embolic events Show forest plot | 2 | 390 | Risk Ratio (M‐H, Random, 95% CI) | 0.68 [0.23, 2.00] |
| 2 Major bleeding Show forest plot | 1 | 268 | Risk Ratio (M‐H, Random, 95% CI) | 0.30 [0.11, 0.80] |
| Outcome or subgroup title | No. of studies | No. of participants | Statistical method | Effect size |
| 1 All strokes and systemic embolic events Show forest plot | 5 | 12545 | Risk Ratio (M‐H, Random, 95% CI) | 0.81 [0.65, 1.00] |
| 2 Major bleeding Show forest plot | 5 | 12521 | Risk Ratio (M‐H, Random, 95% CI) | 0.81 [0.63, 1.03] |
| 3 All‐cause mortality Show forest plot | 4 | 9595 | Risk Ratio (M‐H, Random, 95% CI) | 0.91 [0.78, 1.05] |
| Outcome or subgroup title | No. of studies | No. of participants | Statistical method | Effect size |
| 1 Epistaxis Show forest plot | 2 | 3234 | Risk Difference (M‐H, Random, 95% CI) | ‐0.05 [‐0.22, 0.11] |
| 2 Nasopharyngitis Show forest plot | 2 | 3234 | Risk Difference (M‐H, Random, 95% CI) | 0.03 [‐0.06, 0.11] |
| 3 Diarrhoea Show forest plot | 2 | 3234 | Risk Difference (M‐H, Random, 95% CI) | 0.01 [‐0.04, 0.06] |
| 4 Upper respiratory tract inflammation Show forest plot | 2 | 3234 | Risk Difference (M‐H, Random, 95% CI) | ‐0.01 [‐0.02, 0.01] |
| 5 Back pain Show forest plot | 2 | 3234 | Risk Difference (M‐H, Random, 95% CI) | ‐0.02 [‐0.05, 0.01] |
| 6 Cardiac failure Show forest plot | 2 | 3234 | Risk Difference (M‐H, Random, 95% CI) | ‐0.01 [‐0.03, 0.01] |
| Outcome or subgroup title | No. of studies | No. of participants | Statistical method | Effect size |
| 1 All strokes and systemic embolic events Show forest plot | 5 | 12545 | Risk Ratio (M‐H, Fixed, 95% CI) | 0.81 [0.65, 1.01] |
| 2 Major bleeding Show forest plot | 5 | 12521 | Risk Ratio (M‐H, Fixed, 95% CI) | 0.79 [0.67, 0.92] |