Scolaris Content Display Scolaris Content Display

Study flow diagram.
Figuras y tablas -
Figure 1

Study flow diagram.

Risk of bias graph: review authors' judgements about each risk of bias item presented as percentages across all included studies.
Figuras y tablas -
Figure 2

Risk of bias graph: review authors' judgements about each risk of bias item presented as percentages across all included studies.

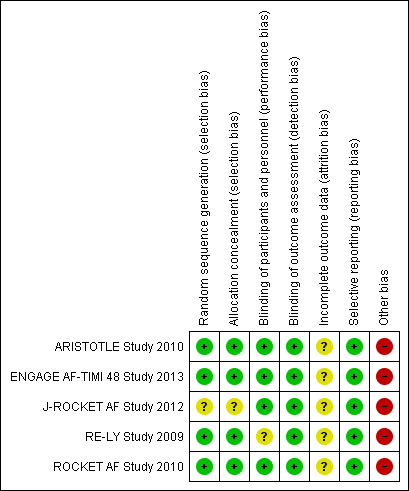
Risk of bias summary: review authors' judgements about each risk of bias item for each included study.
Figuras y tablas -
Figure 3

Risk of bias summary: review authors' judgements about each risk of bias item for each included study.

Comparison 1 Direct oral anticoagulants versus warfarin, Outcome 1 All strokes and systemic embolic events.
Figuras y tablas -
Analysis 1.1

Comparison 1 Direct oral anticoagulants versus warfarin, Outcome 1 All strokes and systemic embolic events.

Comparison 1 Direct oral anticoagulants versus warfarin, Outcome 2 Ischaemic stroke.
Figuras y tablas -
Analysis 1.2

Comparison 1 Direct oral anticoagulants versus warfarin, Outcome 2 Ischaemic stroke.

Comparison 1 Direct oral anticoagulants versus warfarin, Outcome 3 Haemorrhagic stroke.
Figuras y tablas -
Analysis 1.3

Comparison 1 Direct oral anticoagulants versus warfarin, Outcome 3 Haemorrhagic stroke.

Comparison 1 Direct oral anticoagulants versus warfarin, Outcome 4 Major bleeding.
Figuras y tablas -
Analysis 1.4

Comparison 1 Direct oral anticoagulants versus warfarin, Outcome 4 Major bleeding.

Comparison 1 Direct oral anticoagulants versus warfarin, Outcome 5 Myocardial infarction.
Figuras y tablas -
Analysis 1.5

Comparison 1 Direct oral anticoagulants versus warfarin, Outcome 5 Myocardial infarction.

Comparison 1 Direct oral anticoagulants versus warfarin, Outcome 6 Minor bleeding.
Figuras y tablas -
Analysis 1.6

Comparison 1 Direct oral anticoagulants versus warfarin, Outcome 6 Minor bleeding.

Comparison 1 Direct oral anticoagulants versus warfarin, Outcome 7 Gastrointestinal bleeding.
Figuras y tablas -
Analysis 1.7

Comparison 1 Direct oral anticoagulants versus warfarin, Outcome 7 Gastrointestinal bleeding.

Comparison 1 Direct oral anticoagulants versus warfarin, Outcome 8 Intracranial haemorrhage.
Figuras y tablas -
Analysis 1.8

Comparison 1 Direct oral anticoagulants versus warfarin, Outcome 8 Intracranial haemorrhage.

Comparison 1 Direct oral anticoagulants versus warfarin, Outcome 9 All‐cause mortality.
Figuras y tablas -
Analysis 1.9

Comparison 1 Direct oral anticoagulants versus warfarin, Outcome 9 All‐cause mortality.

Comparison 2 Direct oral anticoagulants versus warfarin: subgroup analysis for participants with CrCl 30 to 50 mL/min, Outcome 1 All strokes and systemic embolic events.
Figuras y tablas -
Analysis 2.1

Comparison 2 Direct oral anticoagulants versus warfarin: subgroup analysis for participants with CrCl 30 to 50 mL/min, Outcome 1 All strokes and systemic embolic events.

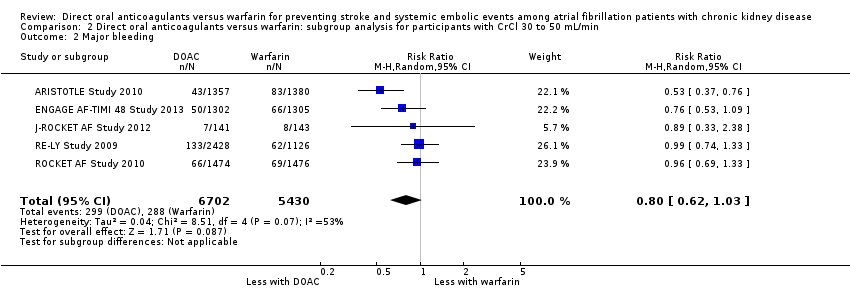
Comparison 2 Direct oral anticoagulants versus warfarin: subgroup analysis for participants with CrCl 30 to 50 mL/min, Outcome 2 Major bleeding.
Figuras y tablas -
Analysis 2.2

Comparison 2 Direct oral anticoagulants versus warfarin: subgroup analysis for participants with CrCl 30 to 50 mL/min, Outcome 2 Major bleeding.

Comparison 3 Direct oral anticoagulants versus warfarin: subgroup analysis for participants with CrCl 15 to 30 mL/min, Outcome 1 All strokes and systemic embolic events.
Figuras y tablas -
Analysis 3.1

Comparison 3 Direct oral anticoagulants versus warfarin: subgroup analysis for participants with CrCl 15 to 30 mL/min, Outcome 1 All strokes and systemic embolic events.

Comparison 3 Direct oral anticoagulants versus warfarin: subgroup analysis for participants with CrCl 15 to 30 mL/min, Outcome 2 Major bleeding.
Figuras y tablas -
Analysis 3.2

Comparison 3 Direct oral anticoagulants versus warfarin: subgroup analysis for participants with CrCl 15 to 30 mL/min, Outcome 2 Major bleeding.

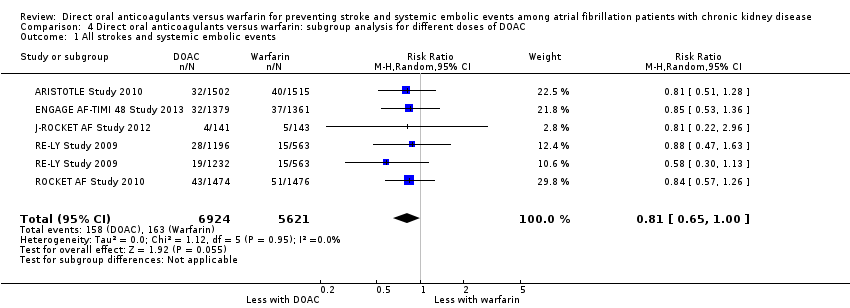
Comparison 4 Direct oral anticoagulants versus warfarin: subgroup analysis for different doses of DOAC, Outcome 1 All strokes and systemic embolic events.
Figuras y tablas -
Analysis 4.1

Comparison 4 Direct oral anticoagulants versus warfarin: subgroup analysis for different doses of DOAC, Outcome 1 All strokes and systemic embolic events.

Comparison 4 Direct oral anticoagulants versus warfarin: subgroup analysis for different doses of DOAC, Outcome 2 Major bleeding.
Figuras y tablas -
Analysis 4.2

Comparison 4 Direct oral anticoagulants versus warfarin: subgroup analysis for different doses of DOAC, Outcome 2 Major bleeding.

Comparison 4 Direct oral anticoagulants versus warfarin: subgroup analysis for different doses of DOAC, Outcome 3 All‐cause mortality.
Figuras y tablas -
Analysis 4.3

Comparison 4 Direct oral anticoagulants versus warfarin: subgroup analysis for different doses of DOAC, Outcome 3 All‐cause mortality.

Comparison 5 Direct oral anticoagulants versus warfarin: adverse events, Outcome 1 Epistaxis.
Figuras y tablas -
Analysis 5.1

Comparison 5 Direct oral anticoagulants versus warfarin: adverse events, Outcome 1 Epistaxis.

Comparison 5 Direct oral anticoagulants versus warfarin: adverse events, Outcome 2 Nasopharyngitis.
Figuras y tablas -
Analysis 5.2

Comparison 5 Direct oral anticoagulants versus warfarin: adverse events, Outcome 2 Nasopharyngitis.

Comparison 5 Direct oral anticoagulants versus warfarin: adverse events, Outcome 3 Diarrhoea.
Figuras y tablas -
Analysis 5.3

Comparison 5 Direct oral anticoagulants versus warfarin: adverse events, Outcome 3 Diarrhoea.

Comparison 5 Direct oral anticoagulants versus warfarin: adverse events, Outcome 4 Upper respiratory tract inflammation.
Figuras y tablas -
Analysis 5.4

Comparison 5 Direct oral anticoagulants versus warfarin: adverse events, Outcome 4 Upper respiratory tract inflammation.

Comparison 5 Direct oral anticoagulants versus warfarin: adverse events, Outcome 5 Back pain.
Figuras y tablas -
Analysis 5.5

Comparison 5 Direct oral anticoagulants versus warfarin: adverse events, Outcome 5 Back pain.

Comparison 5 Direct oral anticoagulants versus warfarin: adverse events, Outcome 6 Cardiac failure.
Figuras y tablas -
Analysis 5.6

Comparison 5 Direct oral anticoagulants versus warfarin: adverse events, Outcome 6 Cardiac failure.

Comparison 6 Direct oral anticoagulants versus warfarin: fixed‐effect model, Outcome 1 All strokes and systemic embolic events.
Figuras y tablas -
Analysis 6.1

Comparison 6 Direct oral anticoagulants versus warfarin: fixed‐effect model, Outcome 1 All strokes and systemic embolic events.

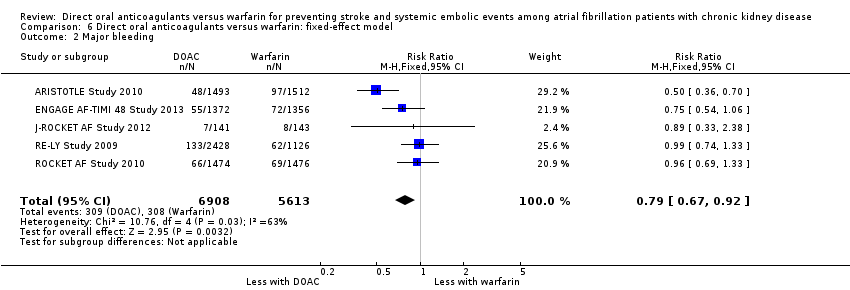
Comparison 6 Direct oral anticoagulants versus warfarin: fixed‐effect model, Outcome 2 Major bleeding.
Figuras y tablas -
Analysis 6.2

Comparison 6 Direct oral anticoagulants versus warfarin: fixed‐effect model, Outcome 2 Major bleeding.

Summary of findings for the main comparison. Direct oral anticoagulants (DOAC) versus warfarin for preventing stroke and systemic embolic events among atrial fibrillation patients with chronic kidney disease (CKD)

DOAC versus warfarin for preventing stroke and systemic embolic events among atrial fibrillation patients with CKD

Patient or population: atrial fibrillation patients with CKD

Setting: Hospital‐based setting

Intervention: DOAC

Comparison: Dose‐adjusted warfarin

Outcomes

Illustrative comparative risks* (95% CI)

Relative effect
(95% CI)

No. of participants
(studies)

Quality of the evidence
(GRADE)

Assumed risk

Corresponding risk

Warfarin

DOAC

All strokes and

systemic embolic events

Follow up: 1.8 years to 2.8 years

29 per 1,000

23 per 1,000
(19 to 29)

RR 0.81 (0.65 to 1.00)

12,545 (5)

⊕⊕⊕⊝¹
MODERATE

Major bleeding

Follow up: 1.8 years to 2.8 years

55 per 1,000

43 per 1,000
(32 to 57)

RR 0.79 (0.59 to 1.04)

12,521 (5)

⊕⊕⊝⊝¹ ²
LOW

Myocardial infarction

Follow up: 2.8 years

11 per 1,000

10 per 1,000

(5 to 21)

RR 0.92 (0.45 to 1.90)

2,740 (1)

Minor bleeding

Follow up: 2.5 years to 2.8 years

74 per 1,000

72 per 1,000

(43 to 119)

RR 0.97

(0.58 to 1.61)

3,012 (2)

⊕⊕⊝⊝¹ ²
LOW

Gastrointestinal bleeding

Follow up: 1.9 years to 2.8 years

17 per 1,000

24 per 1,000

(17 to 35)

RR 1.40

(0.97 to 2.01)

5,678 (2)

⊕⊕⊕⊝¹
MODERATE

Intracranial haemorrhage

Follow up: 1.8 years to 2.8 years

14 per 1,000

6 per 1,000
(4 to 9)

RR 0.43 (0.27 to 0.69)

12,521 (5)

⊕⊕⊕⊝¹
MODERATE

All‐cause mortality

Follow up: 1.8 years to 2.8 years

78 per 1,000

71 per 1,000
(61 to 82)

RR 0.91 (0.78 to 1.05)

9,595 (4)

⊕⊕⊕⊝¹
MODERATE

*The risk in the intervention group (and its 95% CI) is based on the assumed risk in the comparison group and the relative effect of the intervention (and its 95% CI).

AF: atrial fibrillation; CI: confidence interval; DOAC: direct oral anticoagulants; RR: risk ratio

GRADE Working Group grades of evidence
High quality: We are very confident that the true effect lies close to that of the estimate of the effect
Moderate quality: We are moderately confident in the effect estimate: The true effect is likely to be close to the estimate of the effect, but there is a possibility that it is substantially different
Low quality: Our confidence in the effect estimate is limited: The true effect may be substantially different from the estimate of the effect
Very low quality: We have very little confidence in the effect estimate: The true effect is likely to be substantially different from the estimate of effect

1 Some concerns with imprecision because of the uncertain effect estimate

2 Some concerns with inconsistency because of medium heterogeneity

Figuras y tablas -
Summary of findings for the main comparison. Direct oral anticoagulants (DOAC) versus warfarin for preventing stroke and systemic embolic events among atrial fibrillation patients with chronic kidney disease (CKD)
Table 1. Recommendation of major regulatory agencies

Dabigatran

Apixaban

Rivaroxaban

Edoxaban

EMA 2014

150 mg twice daily for CKD stage G3 (CrCl 30 to 50 mL/min)

No recommendation for CKD stage G4

2.5 mg twice daily in patients with at least two of the following characteristics:

‐ age ≥ 80 years

‐ body weight ≤ 60 kg

‐ SCr > 1.5 mg/dL

15 mg daily for CKD stage G3 and G4 (CrCl 15 to 50 mL/min)

30 mg once daily for CKD stage G3 and G4 (CrCl 15 to 50 mL/min)

FDA 2014

150 mg twice daily for CKD stage G3 (CrCl > 30 mL/min)

75 mg twice daily for CKD stage G4 (CrCl 15 to 30 mL/min)

2.5 mg twice daily in patients with at least two of the following characteristics:

‐ age ≥ 80 years

‐ body weight ≤ 60 kg

‐ SCr > 1.5 mg/dL

15 mg daily for CKD stage G3 and G4 (CrCl 15 to 50 mL/min)

30 mg once daily for CKD stage G3 and G4 (CrCl 15 to 50 mL/min)

Health Canada 2017

110 or 150 mg twice daily for CKD stage G3 (CrCl 30 to 50 mL/min)

No recommendation for CKD stage G4

2.5 mg twice daily in patients with at least two of the following characteristics:

‐ age ≥ 80 years

‐ body weight ≤ 60 kg

‐ SCr > 1.5 mg/dL

15 mg daily for CKD stage G3 (CrCl 30 to 50 mL/min)

No recommendation for CKD stage G4

30 mg once daily for CKD stage G3 (CrCl 30 to 50 mL/min)

CKD ‐ chronic kidney disease; CrCl ‐ creatinine clearance; SCr ‐ serum creatinine

Figuras y tablas -
Table 1. Recommendation of major regulatory agencies
Comparison 1. Direct oral anticoagulants versus warfarin

Outcome or subgroup title

No. of studies

No. of participants

Statistical method

Effect size

1 All strokes and systemic embolic events Show forest plot

5

12545

Risk Ratio (M‐H, Random, 95% CI)

0.81 [0.65, 1.00]

2 Ischaemic stroke Show forest plot

4

8991

Risk Ratio (M‐H, Random, 95% CI)

1.01 [0.75, 1.36]

3 Haemorrhagic stroke Show forest plot

4

8991

Risk Ratio (M‐H, Random, 95% CI)

0.52 [0.28, 0.97]

4 Major bleeding Show forest plot

5

12521

Risk Ratio (M‐H, Random, 95% CI)

0.79 [0.59, 1.04]

5 Myocardial infarction Show forest plot

1

2740

Risk Ratio (M‐H, Random, 95% CI)

0.92 [0.45, 1.90]

6 Minor bleeding Show forest plot

2

3012

Risk Ratio (M‐H, Random, 95% CI)

0.97 [0.58, 1.61]

7 Gastrointestinal bleeding Show forest plot

2

5678

Risk Ratio (M‐H, Random, 95% CI)

1.40 [0.97, 2.01]

8 Intracranial haemorrhage Show forest plot

5

12521

Risk Ratio (M‐H, Random, 95% CI)

0.43 [0.27, 0.69]

9 All‐cause mortality Show forest plot

4

9595

Risk Ratio (M‐H, Random, 95% CI)

0.91 [0.78, 1.05]

Figuras y tablas -
Comparison 1. Direct oral anticoagulants versus warfarin
Comparison 2. Direct oral anticoagulants versus warfarin: subgroup analysis for participants with CrCl 30 to 50 mL/min

Outcome or subgroup title

No. of studies

No. of participants

Statistical method

Effect size

1 All strokes and systemic embolic events Show forest plot

5

12155

Risk Ratio (M‐H, Random, 95% CI)

0.82 [0.66, 1.02]

2 Major bleeding Show forest plot

5

12132

Risk Ratio (M‐H, Random, 95% CI)

0.80 [0.62, 1.03]

Figuras y tablas -
Comparison 2. Direct oral anticoagulants versus warfarin: subgroup analysis for participants with CrCl 30 to 50 mL/min
Comparison 3. Direct oral anticoagulants versus warfarin: subgroup analysis for participants with CrCl 15 to 30 mL/min

Outcome or subgroup title

No. of studies

No. of participants

Statistical method

Effect size

1 All strokes and systemic embolic events Show forest plot

2

390

Risk Ratio (M‐H, Random, 95% CI)

0.68 [0.23, 2.00]

2 Major bleeding Show forest plot

1

268

Risk Ratio (M‐H, Random, 95% CI)

0.30 [0.11, 0.80]

Figuras y tablas -
Comparison 3. Direct oral anticoagulants versus warfarin: subgroup analysis for participants with CrCl 15 to 30 mL/min
Comparison 4. Direct oral anticoagulants versus warfarin: subgroup analysis for different doses of DOAC

Outcome or subgroup title

No. of studies

No. of participants

Statistical method

Effect size

1 All strokes and systemic embolic events Show forest plot

5

12545

Risk Ratio (M‐H, Random, 95% CI)

0.81 [0.65, 1.00]

2 Major bleeding Show forest plot

5

12521

Risk Ratio (M‐H, Random, 95% CI)

0.81 [0.63, 1.03]

3 All‐cause mortality Show forest plot

4

9595

Risk Ratio (M‐H, Random, 95% CI)

0.91 [0.78, 1.05]

Figuras y tablas -
Comparison 4. Direct oral anticoagulants versus warfarin: subgroup analysis for different doses of DOAC
Comparison 5. Direct oral anticoagulants versus warfarin: adverse events

Outcome or subgroup title

No. of studies

No. of participants

Statistical method

Effect size

1 Epistaxis Show forest plot

2

3234

Risk Difference (M‐H, Random, 95% CI)

‐0.05 [‐0.22, 0.11]

2 Nasopharyngitis Show forest plot

2

3234

Risk Difference (M‐H, Random, 95% CI)

0.03 [‐0.06, 0.11]

3 Diarrhoea Show forest plot

2

3234

Risk Difference (M‐H, Random, 95% CI)

0.01 [‐0.04, 0.06]

4 Upper respiratory tract inflammation Show forest plot

2

3234

Risk Difference (M‐H, Random, 95% CI)

‐0.01 [‐0.02, 0.01]

5 Back pain Show forest plot

2

3234

Risk Difference (M‐H, Random, 95% CI)

‐0.02 [‐0.05, 0.01]

6 Cardiac failure Show forest plot

2

3234

Risk Difference (M‐H, Random, 95% CI)

‐0.01 [‐0.03, 0.01]

Figuras y tablas -
Comparison 5. Direct oral anticoagulants versus warfarin: adverse events
Comparison 6. Direct oral anticoagulants versus warfarin: fixed‐effect model

Outcome or subgroup title

No. of studies

No. of participants

Statistical method

Effect size

1 All strokes and systemic embolic events Show forest plot

5

12545

Risk Ratio (M‐H, Fixed, 95% CI)

0.81 [0.65, 1.01]

2 Major bleeding Show forest plot

5

12521

Risk Ratio (M‐H, Fixed, 95% CI)

0.79 [0.67, 0.92]

Figuras y tablas -
Comparison 6. Direct oral anticoagulants versus warfarin: fixed‐effect model