Scolaris Content Display Scolaris Content Display

Study flow diagram.
Figuras y tablas -
Figure 1

Study flow diagram.

Risk of bias graph: review authors' judgements about each risk of bias item presented as percentages across all included studies.
Figuras y tablas -
Figure 2

Risk of bias graph: review authors' judgements about each risk of bias item presented as percentages across all included studies.

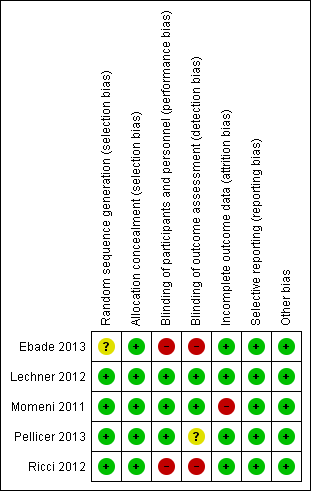
Risk of bias summary: review authors' judgements about each risk of bias item for each included study.
Figuras y tablas -
Figure 3

Risk of bias summary: review authors' judgements about each risk of bias item for each included study.

Forest plot of comparison: 1 Mortality, outcome: 1.1 Mortality.
Figuras y tablas -
Figure 4

Forest plot of comparison: 1 Mortality, outcome: 1.1 Mortality.

Forest plot of comparison: 2 Low cardiac output syndrome (LCOS), outcome: 2.1 LCOS.
Figuras y tablas -
Figure 5

Forest plot of comparison: 2 Low cardiac output syndrome (LCOS), outcome: 2.1 LCOS.

Comparison 1 Mortality, Outcome 1 Mortality.
Figuras y tablas -
Analysis 1.1

Comparison 1 Mortality, Outcome 1 Mortality.

Comparison 2 Low cardiac output syndrome (LCOS), Outcome 1 LCOS.
Figuras y tablas -
Analysis 2.1

Comparison 2 Low cardiac output syndrome (LCOS), Outcome 1 LCOS.

Comparison 3 Length of ICU stay, Outcome 1 Length of ICU stay (days).
Figuras y tablas -
Analysis 3.1

Comparison 3 Length of ICU stay, Outcome 1 Length of ICU stay (days).

Comparison 3 Length of ICU stay, Outcome 2 Length of ICU stay (days).
Figuras y tablas -
Analysis 3.2

Comparison 3 Length of ICU stay, Outcome 2 Length of ICU stay (days).

Comparison 4 Length of hospital stay, Outcome 1 Length of hospital stay (days).
Figuras y tablas -
Analysis 4.1

Comparison 4 Length of hospital stay, Outcome 1 Length of hospital stay (days).

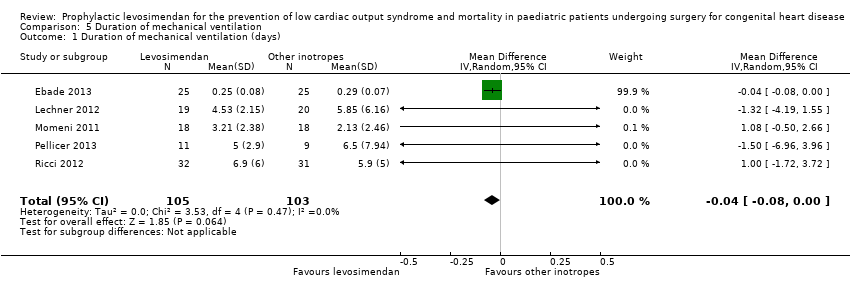
Comparison 5 Duration of mechanical ventilation, Outcome 1 Duration of mechanical ventilation (days).
Figuras y tablas -
Analysis 5.1

Comparison 5 Duration of mechanical ventilation, Outcome 1 Duration of mechanical ventilation (days).

Comparison 5 Duration of mechanical ventilation, Outcome 2 Duration of mechanical ventilation (days).
Figuras y tablas -
Analysis 5.2

Comparison 5 Duration of mechanical ventilation, Outcome 2 Duration of mechanical ventilation (days).

Comparison 6 Mechanical circulatory support or cardiac transplantation, Outcome 1 Mechanical circulatory support or cardiac transplantation.
Figuras y tablas -
Analysis 6.1

Comparison 6 Mechanical circulatory support or cardiac transplantation, Outcome 1 Mechanical circulatory support or cardiac transplantation.

Summary of findings for the main comparison. Prophylactic levosimendan compared to standard treatment in children having undergone heart surgery

Prophylactic levosimendan compared to standard treatment in children following heart surgery

Patient or population: paediatric patients following heart surgery
Setting: institutions providing postoperative care after heart surgery for congenital heart disease
Intervention: levosimendan
Comparison: standard inotropes

Outcomes

Anticipated absolute effects* (95% CI)

Relative effect
(95% CI)

№ of participants
(studies)

Quality of the evidence
(GRADE)

Comments

Risk with standard inotropes

Risk with levosimendan

Mortality
follow‐up: range 1 day to 6 days

Study population

RR 0.47
(0.12 to 1.82)

123
(3 RCTs)

⊕⊕⊝⊝
LOW 1, 2

57 per 1000

27 per 1000
(7 to 104)

Low cardiac output syndrome (LCOS)
follow‐up: range 1 day to 6 days

Study population

RR 0.64
(0.39 to 1.04)

83
(2 RCTs)

⊕⊕⊝⊝
LOW 1, 3

367 per 1000

235 per 1000
(143 to 381)

Length of intensive care unit stay (Length of ICU stay)
follow‐up: range 1 day to 6 days

The mean length of stay in the ICU in the control groups ranged from 2.05 to 11 days

The mean length of stay in ICU in the intervention groups was 0.33 days higher (1.16 lower to 1.82 higher)

188
(4 RCTs)

⊕⊕⊝⊝
LOW 1, 4

Length of hospital stay
follow‐up: range 1 day to 6 days

The mean length of hospital stay in the control groups ranged from 15 to 15.8 days

The mean length of hospital stay in the intervention groups was 0.26 days higher
(3.50 lower to 4.03 higher)

75
(2 RCTs)

⊕⊕⊝⊝
LOW 1, 2

Duration of mechanical ventilation
follow‐up: range 1 day to 6 days

The mean duration of mechanical ventilation in the control groups ranged from 0.29 to 6.5 days

The mean duration of mechanical ventilation in the intervention groups was 0.04 days lower
(0.08 lower to 0.00 higher)

208
(5 RCTs)

⊕⊕⊝⊝
LOW 1, 4

Mechanical circulatory support or cardiac transplantation
follow‐up: range 1 day to 6 days

Study population

RR 1.49
(0.19 to 11.37)

60
(2 RCTs)

⊕⊕⊝⊝
LOW 1, 2

10 per 1000

14 per 1000
(2 to 108)

*The risk in the intervention group (and its 95% confidence interval) is based on the assumed risk in the comparison group and the relative effect of the intervention (and its 95% CI).

CI: Confidence interval; RR: Risk ratio; OR: Odds ratio; MD: mean difference.

GRADE Working Group grades of evidence
High quality: We are very confident that the true effect lies close to that of the estimate of the effect
Moderate quality: We are moderately confident in the effect estimate: The true effect is likely to be close to the estimate of the effect, but there is a possibility that it is substantially different
Low quality: Our confidence in the effect estimate is limited: The true effect may be substantially different from the estimate of the effect
Very low quality: We have very little confidence in the effect estimate: The true effect is likely to be substantially different from the estimate of effect

1 Downgraded for imprecision due to small sample size.

2 Downgraded for imprecision due to few number of events (less than 300).

3 Detection of outcome potentially dependent on study personnel: risk of detection bias in two studies due to unblinded setting.

4 Considerable inconsistency between study results.

Figuras y tablas -
Summary of findings for the main comparison. Prophylactic levosimendan compared to standard treatment in children having undergone heart surgery
Comparison 1. Mortality

Outcome or subgroup title

No. of studies

No. of participants

Statistical method

Effect size

1 Mortality Show forest plot

3

123

Risk Ratio (M‐H, Random, 95% CI)

0.47 [0.12, 1.82]

Figuras y tablas -
Comparison 1. Mortality
Comparison 2. Low cardiac output syndrome (LCOS)

Outcome or subgroup title

No. of studies

No. of participants

Statistical method

Effect size

1 LCOS Show forest plot

2

83

Risk Ratio (M‐H, Random, 95% CI)

0.64 [0.39, 1.04]

Figuras y tablas -
Comparison 2. Low cardiac output syndrome (LCOS)
Comparison 3. Length of ICU stay

Outcome or subgroup title

No. of studies

No. of participants

Statistical method

Effect size

1 Length of ICU stay (days) Show forest plot

4

188

Mean Difference (IV, Random, 95% CI)

0.33 [‐1.16, 1.82]

2 Length of ICU stay (days) Show forest plot

4

188

Std. Mean Difference (IV, Random, 95% CI)

‐0.05 [‐0.54, 0.44]

Figuras y tablas -
Comparison 3. Length of ICU stay
Comparison 4. Length of hospital stay

Outcome or subgroup title

No. of studies

No. of participants

Statistical method

Effect size

1 Length of hospital stay (days) Show forest plot

2

75

Mean Difference (IV, Random, 95% CI)

0.26 [‐3.50, 4.03]

Figuras y tablas -
Comparison 4. Length of hospital stay
Comparison 5. Duration of mechanical ventilation

Outcome or subgroup title

No. of studies

No. of participants

Statistical method

Effect size

1 Duration of mechanical ventilation (days) Show forest plot

5

208

Mean Difference (IV, Random, 95% CI)

‐0.04 [‐0.08, 0.00]

2 Duration of mechanical ventilation (days) Show forest plot

5

208

Std. Mean Difference (IV, Random, 95% CI)

‐0.08 [‐0.43, 0.27]

Figuras y tablas -
Comparison 5. Duration of mechanical ventilation
Comparison 6. Mechanical circulatory support or cardiac transplantation

Outcome or subgroup title

No. of studies

No. of participants

Statistical method

Effect size

1 Mechanical circulatory support or cardiac transplantation Show forest plot

2

60

Risk Ratio (M‐H, Random, 95% CI)

1.49 [0.19, 11.37]

Figuras y tablas -
Comparison 6. Mechanical circulatory support or cardiac transplantation