Cirugía de mama por cáncer de mama metastásico
Información
- DOI:
- https://doi.org/10.1002/14651858.CD011276.pub2Copiar DOI

- Base de datos:
-
- Cochrane Database of Systematic Reviews
- Versión publicada:
-
- 15 marzo 2018see what's new
- Tipo:
-
- Intervention
- Etapa:
-
- Review
- Grupo Editorial Cochrane:
-
Grupo Cochrane de Cáncer de mama
- Copyright:
-
- Copyright © 2018 The Cochrane Collaboration. Published by John Wiley & Sons, Ltd.
Cifras del artículo
Altmetric:
Citado por:
Autores
Contributions of authors
Draft the protocol: GT, RR, MRT, BSM.
Study selection: GT, BSM, RR (judge).
Extract data from studies: GT, BSM, RR.
Enter data into Review Manager 5: GT, BSM.
Carry out the analyses: GT, RR, MRT, TN.
Interpret the analyses: GT, BSM, MRT, TN.
Draft the final review: GT, RR, MRT, BSM.
Disagreement resolution: RR, MRT.
Update the review: GT, BSM, RR, MRT.
Sources of support
Internal sources
-
Nil, Other.
External sources
-
Nil, Other.
Declarations of interest
The review authors have no conflict of interest related to this protocol and review.
Acknowledgements
The review authors wish to thank all the members of the Cochrane Breast Cancer Group for their work in editing and reviewing. We are also grateful to the Cochrane Brazil and Handbook Study Group for methodological support.
We are very grateful to the expert Marcelo Rocha de Souza Cruz for the clinical orientation and support.
We are especially grateful to Melina Willson for her dedication, guidance, and commitment to the realisation of this review.
We have not received any type of funding to conduct this review.
Version history
| Published | Title | Stage | Authors | Version |
| 2018 Mar 15 | Breast surgery for metastatic breast cancer | Review | Giuliano Tosello, Maria Regina Torloni, Bruna S Mota, Teresa Neeman, Rachel Riera | |
| 2014 Sep 03 | Breast surgery for metastatic breast cancer | Protocol | Giuliano Tosello, Maria R Torloni, Bruna Salani, Teresa Neeman, Rachel Riera | |
Differences between protocol and review
At the protocol phase, we had planned to use the fixed‐effect model by default. However, as we detected clinical or methodological heterogeneity, or both, between included studies, we decided that it would be more appropriate to use the random‐effects model.
We revised subgroup analyses based on current rationale. We therefore maintained the following proposed analyses in the review: age of participants, oestrogen receptor status, HER2 status, only bone metastases, and radiotherapy at primary site or not. Notably, Soran 2016 reported a subgroup analysis for women who were older and younger than 55 years of age. Badwe 2015 grouped women as being pre‐ and postmenopausal. Because of these differences, we did not conduct the planned subgroup analysis for age (> 55 years or < 55 years).
We added that the risk ratio (RR) would be used to measure the effect of treatment for dichotomous outcomes.
Keywords
MeSH
Medical Subject Headings (MeSH) Keywords
Medical Subject Headings Check Words
Female; Humans;
PICO

Study flow diagram.

Risk of bias summary: review authors' judgements about each risk of bias item for each included study.

Forest plot of comparison: 1 Systemic treatment plus surgery versus systemic treatment, outcome: 1.1 Overall survival.
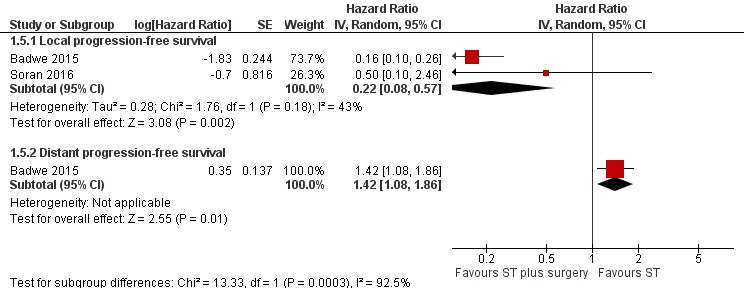
Forest plot of comparison: 1 Systemic treatment plus surgery versus systemic treatment, outcome: 1.5 Progression‐free survival.

Comparison 1 Systemic treatment plus surgery versus systemic treatment, Outcome 1 Overall survival.
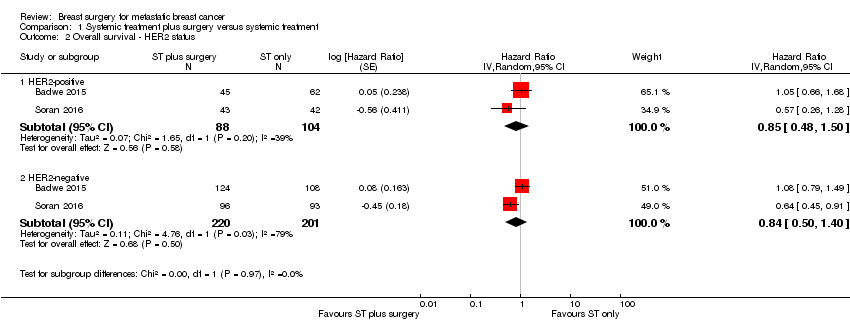
Comparison 1 Systemic treatment plus surgery versus systemic treatment, Outcome 2 Overall survival ‐ HER2 status.

Comparison 1 Systemic treatment plus surgery versus systemic treatment, Outcome 3 Overall survival ‐ ER status.

Comparison 1 Systemic treatment plus surgery versus systemic treatment, Outcome 4 Overall survival ‐ only bone metastasis.

Comparison 1 Systemic treatment plus surgery versus systemic treatment, Outcome 5 Progression‐free survival.
| Breast surgery plus systemic treatment compared to systemic treatment for metastatic breast cancer | ||||||
| Patient or population: metastatic breast cancer | ||||||
| Outcomes | Anticipated absolute effects* (95% CI) | Relative effect | № of participants | Quality of the evidence | Comments | |
| Risk with systemic treatment | Risk with breast surgery plus systemic treatment | |||||
| Overall survival at 2 years Follow‐up: range 23 months to 40 months | Study population | HR 0.83 | 624 | ⊕⊝⊝⊝ | The estimates for the control group are based upon an average of the estimates from Badwe 2015 and Soran 2016. | |
| 511 per 1000 | 448 per 1000 | |||||
| Quality of life | Not reported | Not reported | ‐ | ‐ | ‐ | |
| Local PFS at 2 years Follow‐up: range 23 months to 40 months | Study population | HR 0.22 | 607 | ⊕⊕⊝⊝ | The estimates for the control group are based upon an average of the estimates from Badwe 2015 and Soran 2016. | |
| 500 per 1000 | 141 per 1000 | |||||
| Distant PFS at 2 years Follow‐up: 23 months | Study population | HR 1.42 | 350 | ⊕⊕⊕⊝ | The estimates for the control group are based upon the estimates from Badwe 2015. | |
| 548 per 1000 | 676 per 1000 | |||||
| Breast cancer‐specific survival | Not reported | Not reported | ‐ | ‐ | ‐ | |
| Toxicity from local therapy Follow‐up: 40 months | Study population | RR 0.99 | 274 | ⊕⊕⊝⊝ | The estimates for the control group are based upon the estimates from Soran 2016. | |
| 15 per 1000 | 15 per 1000 | |||||
| *The risk in the intervention group (and its 95% confidence interval) is based on the assumed risk in the comparison group and the relative effect of the intervention (and its 95% CI). | ||||||
| GRADE Working Group grades of evidence | ||||||
| 1In Soran 2016, trial random sequence generation and allocation concealment were unclear. Downgraded one level. | ||||||
| Overall survival subgroup analysis | Number of studies | N | HR | Lower CI | Upper CI | P value |
| HER2‐positive | 2 | 192 | 0.90 | 0.60 | 1.35 | NS |
| HER2‐negative | 2 | 421 | 0.85 | 0.67 | 1.08 | NS |
| ER positive | 2 | 426 | 0.79 | 0.61 | 1.03 | NS |
| ER negative | 2 | 200 | 1.01 | 0.73 | 1.40 | NS |
| Bone‐only metastasis | 2 | 226 | 0.91 | 0.49 | 1.69 | NS |
| CI: confidence interval | ||||||
| Outcome or subgroup title | No. of studies | No. of participants | Statistical method | Effect size |
| 1 Overall survival Show forest plot | 2 | 624 | Hazard Ratio (Random, 95% CI) | 0.83 [0.53, 1.31] |
| 2 Overall survival ‐ HER2 status Show forest plot | 2 | Hazard Ratio (Random, 95% CI) | Subtotals only | |
| 2.1 HER2‐positive | 2 | 192 | Hazard Ratio (Random, 95% CI) | 0.85 [0.48, 1.50] |
| 2.2 HER2‐negative | 2 | 421 | Hazard Ratio (Random, 95% CI) | 0.84 [0.50, 1.40] |
| 3 Overall survival ‐ ER status Show forest plot | 2 | Hazard Ratio (Random, 95% CI) | Subtotals only | |
| 3.1 ER‐positive | 2 | 426 | Hazard Ratio (Random, 95% CI) | 0.83 [0.48, 1.42] |
| 3.2 ER‐negative | 2 | 200 | Hazard Ratio (Random, 95% CI) | 1.04 [0.70, 1.55] |
| 4 Overall survival ‐ only bone metastasis Show forest plot | 2 | 226 | Hazard Ratio (Random, 95% CI) | 0.91 [0.49, 1.69] |
| 5 Progression‐free survival Show forest plot | 2 | Hazard Ratio (Random, 95% CI) | Subtotals only | |
| 5.1 Local progression‐free survival | 2 | Hazard Ratio (Random, 95% CI) | 0.22 [0.08, 0.57] | |
| 5.2 Distant progression‐free survival | 1 | Hazard Ratio (Random, 95% CI) | 1.42 [1.08, 1.86] | |