Scolaris Content Display Scolaris Content Display

Study flow diagram.
Figuras y tablas -
Figure 1

Study flow diagram.

Risk of bias summary: review authors' judgements about each risk of bias item for each included study.
Figuras y tablas -
Figure 2

Risk of bias summary: review authors' judgements about each risk of bias item for each included study.

Forest plot of comparison: 1 Systemic treatment plus surgery versus systemic treatment, outcome: 1.1 Overall survival.
Figuras y tablas -
Figure 3

Forest plot of comparison: 1 Systemic treatment plus surgery versus systemic treatment, outcome: 1.1 Overall survival.

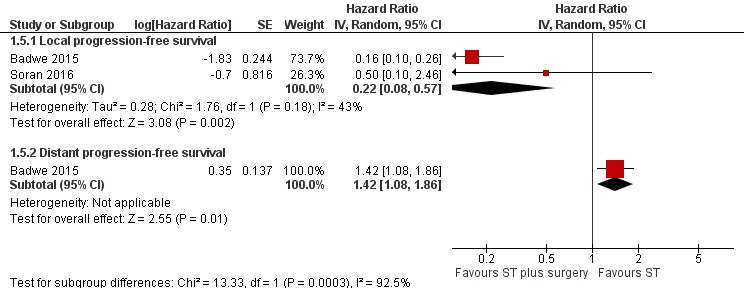
Forest plot of comparison: 1 Systemic treatment plus surgery versus systemic treatment, outcome: 1.5 Progression‐free survival.
Figuras y tablas -
Figure 4

Forest plot of comparison: 1 Systemic treatment plus surgery versus systemic treatment, outcome: 1.5 Progression‐free survival.

Comparison 1 Systemic treatment plus surgery versus systemic treatment, Outcome 1 Overall survival.
Figuras y tablas -
Analysis 1.1

Comparison 1 Systemic treatment plus surgery versus systemic treatment, Outcome 1 Overall survival.

Comparison 1 Systemic treatment plus surgery versus systemic treatment, Outcome 2 Overall survival ‐ HER2 status.
Figuras y tablas -
Analysis 1.2

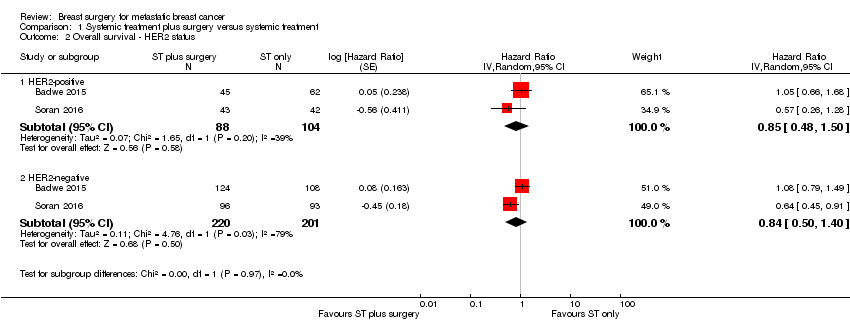
Comparison 1 Systemic treatment plus surgery versus systemic treatment, Outcome 2 Overall survival ‐ HER2 status.

Comparison 1 Systemic treatment plus surgery versus systemic treatment, Outcome 3 Overall survival ‐ ER status.
Figuras y tablas -
Analysis 1.3

Comparison 1 Systemic treatment plus surgery versus systemic treatment, Outcome 3 Overall survival ‐ ER status.

Comparison 1 Systemic treatment plus surgery versus systemic treatment, Outcome 4 Overall survival ‐ only bone metastasis.
Figuras y tablas -
Analysis 1.4

Comparison 1 Systemic treatment plus surgery versus systemic treatment, Outcome 4 Overall survival ‐ only bone metastasis.

Comparison 1 Systemic treatment plus surgery versus systemic treatment, Outcome 5 Progression‐free survival.
Figuras y tablas -
Analysis 1.5

Comparison 1 Systemic treatment plus surgery versus systemic treatment, Outcome 5 Progression‐free survival.

Summary of findings for the main comparison. Breast surgery plus systemic treatment compared to systemic treatment for metastatic breast cancer

Breast surgery plus systemic treatment compared to systemic treatment for metastatic breast cancer

Patient or population: metastatic breast cancer
Setting: inpatients and outpatients
Intervention: breast surgery plus systemic treatment
Comparison: systemic treatment

Outcomes

Anticipated absolute effects* (95% CI)

Relative effect
(95% CI)

№ of participants
(studies)

Quality of the evidence
(GRADE)

Comments

Risk with systemic treatment

Risk with breast surgery plus systemic treatment

Overall survival at 2 years

Follow‐up: range 23 months to 40 months

Study population

HR 0.83
(0.53 to 1.31)

624
(2 RCTs)

⊕⊝⊝⊝
VERY LOW 1 2 3

The estimates for the control group are based upon an average of the estimates from Badwe 2015 and Soran 2016.

511 per 1000

448 per 1000
(318 to 608)

Quality of life

Not reported

Not reported

Local PFS at 2 years

Follow‐up: range 23 months to 40 months

Study population

HR 0.22
(0.08 to 0.57)

607
(2 RCTs)

⊕⊕⊝⊝
LOW 2 4

The estimates for the control group are based upon an average of the estimates from Badwe 2015 and Soran 2016.

500 per 1000

141 per 1000
(54 to 326)

Distant PFS at 2 years

Follow‐up: 23 months

Study population

HR 1.42
(1.08 to 1.86)

350
(1 RCT)

⊕⊕⊕⊝
MODERATE 5

The estimates for the control group are based upon the estimates from Badwe 2015.

548 per 1000

676 per 1000
(576 to 772)

Breast cancer‐specific survival

Not reported

Not reported

Toxicity from local therapy

Follow‐up: 40 months

Study population

RR 0.99
(0.14 to 6.90)

274
(1 RCT)

⊕⊕⊝⊝
LOW 1 6

The estimates for the control group are based upon the estimates from Soran 2016.

15 per 1000

15 per 1000
(2 to 101)

*The risk in the intervention group (and its 95% confidence interval) is based on the assumed risk in the comparison group and the relative effect of the intervention (and its 95% CI).

CI: confidence interval; HR: hazard ratio; RCT: randomised controlled trial; RR: risk ratio

GRADE Working Group grades of evidence
High quality: We are very confident that the true effect lies close to that of the estimate of the effect.
Moderate quality: We are moderately confident in the effect estimate: the true effect is likely to be close to the estimate of the effect, but there is a possibility that it is substantially different.
Low quality: Our confidence in the effect estimate is limited: the true effect may be substantially different from the estimate of the effect.
Very low quality: We have very little confidence in the effect estimate: the true effect is likely to be substantially different from the estimate of effect.

1In Soran 2016, trial random sequence generation and allocation concealment were unclear. Downgraded one level.
2Statistical or clinical heterogeneity, or both. Downgraded one level.
3Wide 95% CI (0.53 to 1.31) including the null effect. Downgraded one level.
4In Soran 2016, trial random sequence generation and allocation concealment were unclear. Outcome assessors were not blinded, and this is a subjective outcome. Downgraded one level.
5Outcome assessors were not blinded, and this is a subjective outcome. Downgraded one level.
6Very wide 95% CI (0.14 to 6.9). Downgraded one level.

Figuras y tablas -
Summary of findings for the main comparison. Breast surgery plus systemic treatment compared to systemic treatment for metastatic breast cancer
Table 1. Overall survival ‐ subgroup analyses

Overall survival subgroup analysis

Number of studies

N

HR

Lower CI

Upper CI

P value

HER2‐positive

2

192

0.90

0.60

1.35

NS

HER2‐negative

2

421

0.85

0.67

1.08

NS

ER positive

2

426

0.79

0.61

1.03

NS

ER negative

2

200

1.01

0.73

1.40

NS

Bone‐only metastasis

2

226

0.91

0.49

1.69

NS

CI: confidence interval
ER: oestrogen receptor
HR: hazard ratio
NS: not significant

Figuras y tablas -
Table 1. Overall survival ‐ subgroup analyses
Comparison 1. Systemic treatment plus surgery versus systemic treatment

Outcome or subgroup title

No. of studies

No. of participants

Statistical method

Effect size

1 Overall survival Show forest plot

2

624

Hazard Ratio (Random, 95% CI)

0.83 [0.53, 1.31]

2 Overall survival ‐ HER2 status Show forest plot

2

Hazard Ratio (Random, 95% CI)

Subtotals only

2.1 HER2‐positive

2

192

Hazard Ratio (Random, 95% CI)

0.85 [0.48, 1.50]

2.2 HER2‐negative

2

421

Hazard Ratio (Random, 95% CI)

0.84 [0.50, 1.40]

3 Overall survival ‐ ER status Show forest plot

2

Hazard Ratio (Random, 95% CI)

Subtotals only

3.1 ER‐positive

2

426

Hazard Ratio (Random, 95% CI)

0.83 [0.48, 1.42]

3.2 ER‐negative

2

200

Hazard Ratio (Random, 95% CI)

1.04 [0.70, 1.55]

4 Overall survival ‐ only bone metastasis Show forest plot

2

226

Hazard Ratio (Random, 95% CI)

0.91 [0.49, 1.69]

5 Progression‐free survival Show forest plot

2

Hazard Ratio (Random, 95% CI)

Subtotals only

5.1 Local progression‐free survival

2

Hazard Ratio (Random, 95% CI)

0.22 [0.08, 0.57]

5.2 Distant progression‐free survival

1

Hazard Ratio (Random, 95% CI)

1.42 [1.08, 1.86]

Figuras y tablas -
Comparison 1. Systemic treatment plus surgery versus systemic treatment