Intervenciones no farmacológicas para los trastornos somatoformes y los síntomas físicos sin explicación médica (SFSEM) en adultos
Información
- DOI:
- https://doi.org/10.1002/14651858.CD011142.pub2Copiar DOI

- Base de datos:
-
- Cochrane Database of Systematic Reviews
- Versión publicada:
-
- 01 noviembre 2014see what's new
- Tipo:
-
- Intervention
- Etapa:
-
- Review
- Grupo Editorial Cochrane:
-
Grupo Cochrane de Trastornos mentales comunes
- Copyright:
-
- Copyright © 2014 The Cochrane Collaboration. Published by John Wiley & Sons, Ltd.
Cifras del artículo
Altmetric:
Citado por:
Autores
Contributions of authors
Nikki van Dessel: developed and drafted the article, performed database searches and study selection, performed analyses under supervision of Johannes C. van der Wouden.
Madelon den Boeft: assisted in drafting the article, performed database searches and study selection, and gave feedback on the draft version of the review.
Johannes C. van der Wouden: supervised database searches, performed analyses, supervised the development of the article, gave feedback on the draft version of the review, and had a leading role in processing the editorial feedback.
Harm van Marwijk: launched the original idea, supervised development of the article, and gave feedback on draft versions of the protocol and review.
Stephanie S Leone, Berend Terluin, Maria Kleinstauber, Mattijs Numans, and Henriëtte E van der Horst: supported preparation of the review and gave feedback on draft versions of the review.
Sources of support
Internal sources
-
VU University Medical Centre Amsterdam, Netherlands.
External sources
-
National Institute for Health Research, UK.
Funding for this review was provided by the NIHR Cochrane Incentive Award Scheme 2014
Declarations of interest
Nikki van Dessel: none known.
Madelon den Boeft: none known.
Johannes C van der Wouden: none known.
Stephanie S Leone: none known.
Berend Terluin: none known.
Maria Kleinstauber: none known.
Mattijs Numans: none known.
Henriëtte E van der Horst: none known.
Harm WJ van Marwijk: none known
Acknowledgements
We thank the following authors for providing additional information about their studies: Nettie Blankenstein, Chris Burton, Javier Escobar, Lone Fjorback, Kurt Fritsche, Margalida Gili, Gonzalo Grandes, Jan Lidbeck, Alexandra Martin, Winfried Rief, Bert Schilte, Andreas Schröder, Anette Schröder, Anne Speckens, and Lyonne Zonneveld. We thank the referees for their thorough and constructive comments on the draft review. Special thanks to the Cochrane Depression, Anxiety and Neurosis Review Group's editorial base team for assistance in the development of the review, for their support in the development of the search strategies, and their excellent feedback on draft versions of the review.
Funding for this review was provided by the National Institute for Health Research (NIHR) Cochrane Incentive Award Scheme 2014.
The Department of General Practice and Elderly Care Medicine, EMGO Institute of Health and Care Research, VU University Medical Center, Amsterdam provided in‐kind funding for most of the authors of the review.
CRG Funding Acknowledgement:
The National Institute for Health Research (NIHR) is the largest single funder of the Cochrane Depression, Anxiety and Neurosis Group.
Disclaimer:
The views and opinions expressed therein are those of the authors and do not necessarily reflect those of the NIHR, the National Health Service (NHS) or the Department of Health.
Version history
| Published | Title | Stage | Authors | Version |
| 2014 Nov 01 | Non‐pharmacological interventions for somatoform disorders and medically unexplained physical symptoms (MUPS) in adults | Review | Nikki van Dessel, Madelon den Boeft, Johannes C van der Wouden, Maria Kleinstäuber, Stephanie S Leone, Berend Terluin, Mattijs E Numans, Henriëtte E van der Horst, Harm van Marwijk | |
| 2014 Jun 16 | Non‐pharmacological interventions for somatoform disorders and medically‐unexplained physical symptoms (MUPS) in adults | Protocol | Nikki Van Dessel, Madelon Den Boeft, Johannes C van der Wouden, Maria Kleinstäuber, Stephanie S Leone, Berend Terluin, Mattijs E Numans, Henriëtte E van der Horst, Harm van Marwijk | |
Differences between protocol and review
Although the protocol was thought through very thoroughly, we had to make a few post‐hoc changes to procedures, to improve the quality of the review. First, in the included studies, we found almost no information regarding previous treatments for MUPS. Therefore, we did not include this item in the 'Characteristics of included studies' table.
A second post‐hoc change also regarded the 'Characteristics of included studies' table. In all included studies, therapists had received a certain form of training before they performed the interventions. There was a great variation in background, experience, and intensity and duration of extra training. We found it problematic to define criteria to assess the amount of training. Therefore, we decided not to categorise the therapists based on experience, but to describe their extent of experience narratively in the 'Characteristics of included studies' table.
Although not specifically addressed in the protocol, for brevity's sake we chose to combine anxiety and depression outcomes for three of five comparisons: Fjorback 2013; Schröder 2012; Sumathipala 2008. We decided to do this, as different outcome instruments were used in these studies, some measuring anxiety and depression separately, some measuring them altogether reporting one combination score. By combining all scores, we made it possible to make study results more comparable. For the same reason, we chose to combine SF‐36 subscales (mainly physical component scores and mental component scores), in order to be able to pool these with other scales measuring function or quality of life.
We had not anticipated that several studies used consultation letters, in both study arms, in addition to an intervention or usual care. We categorised these studies under the main comparison (CBT versus usual care or waiting list conditions), as the consultation letter only concerned a co‐intervention. We did not conduct a sensitivity analysis.
Finally, several studies compared a psychological therapy with some form of enhanced or structured care, a comparison we had not foreseen at the protocol stage. Therefore, we added this comparison.
Keywords
MeSH
Medical Subject Headings (MeSH) Keywords
Medical Subject Headings Check Words
Adult; Humans;
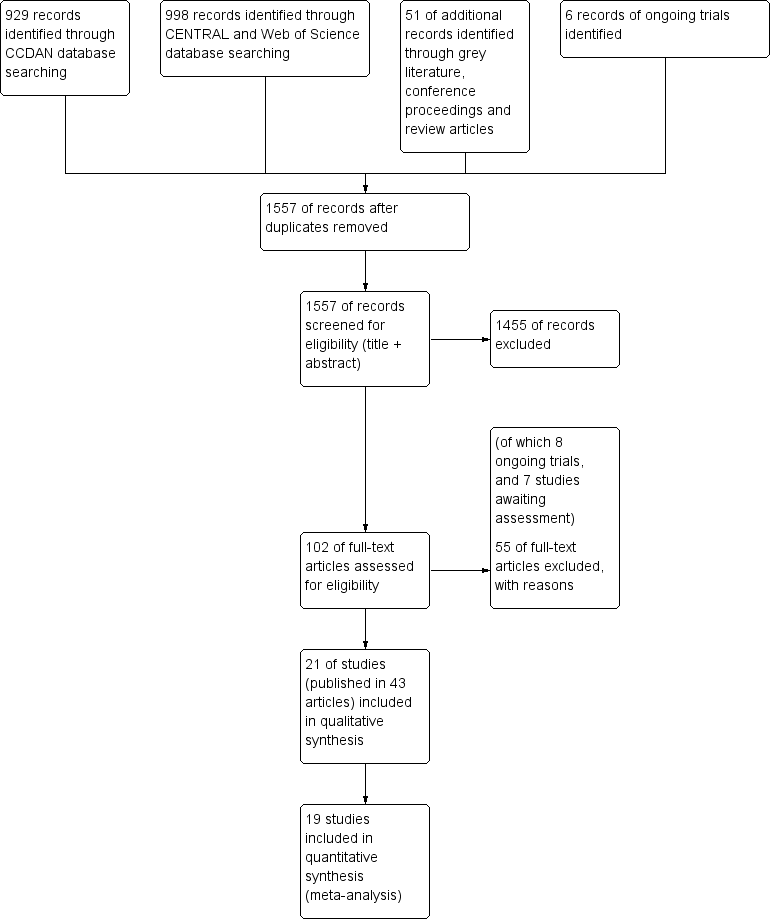
6 Study flow diagram.

Risk of bias graph: review authors' judgements about each risk of bias item presented as percentages across all included studies.

Risk of bias summary: review authors' judgements about each risk of bias item for each included study.

Funnel plot of comparison: 1 Psychological therapies versus usual care or waiting list, outcome: 1.4 Acceptability.
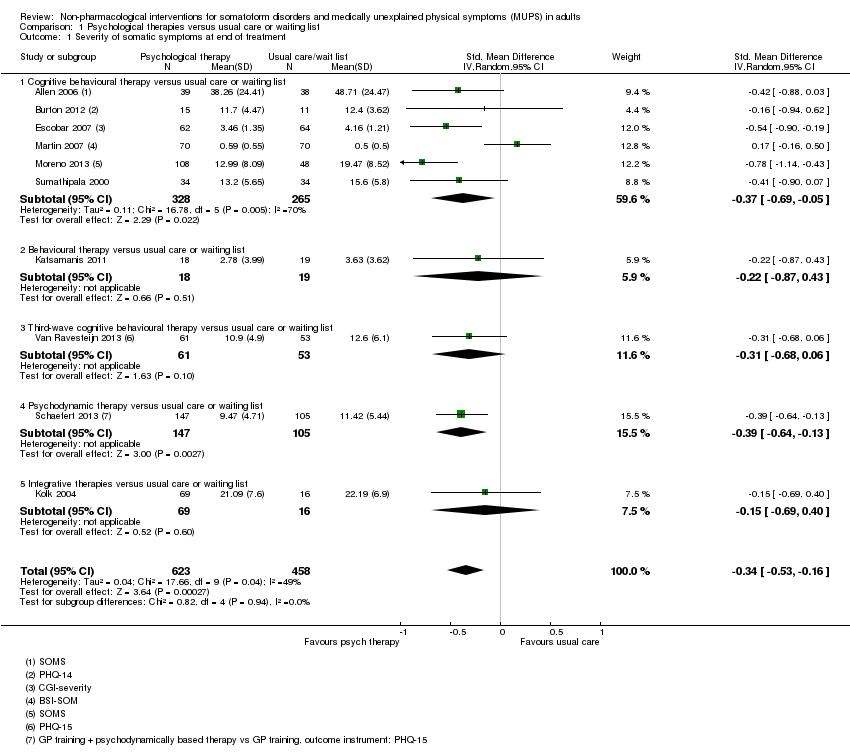
Comparison 1 Psychological therapies versus usual care or waiting list, Outcome 1 Severity of somatic symptoms at end of treatment.
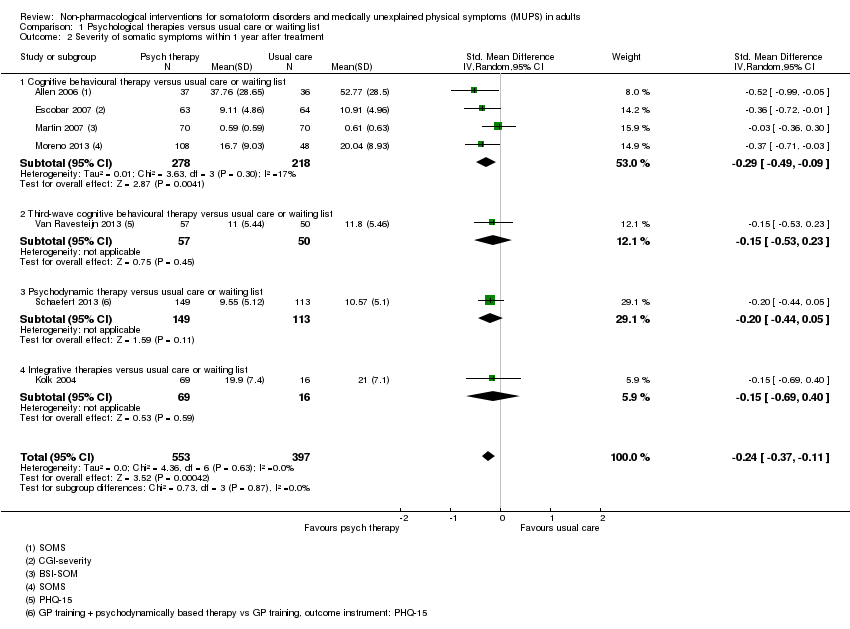
Comparison 1 Psychological therapies versus usual care or waiting list, Outcome 2 Severity of somatic symptoms within 1 year after treatment.
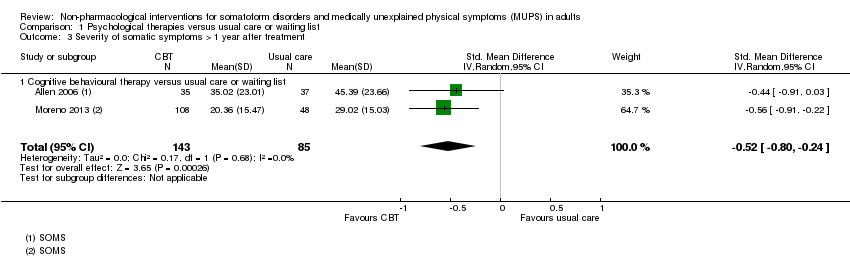
Comparison 1 Psychological therapies versus usual care or waiting list, Outcome 3 Severity of somatic symptoms > 1 year after treatment.

Comparison 1 Psychological therapies versus usual care or waiting list, Outcome 4 Acceptability.

Comparison 1 Psychological therapies versus usual care or waiting list, Outcome 5 Severity of anxiety symptoms at end of treatment ‐ participant rated.
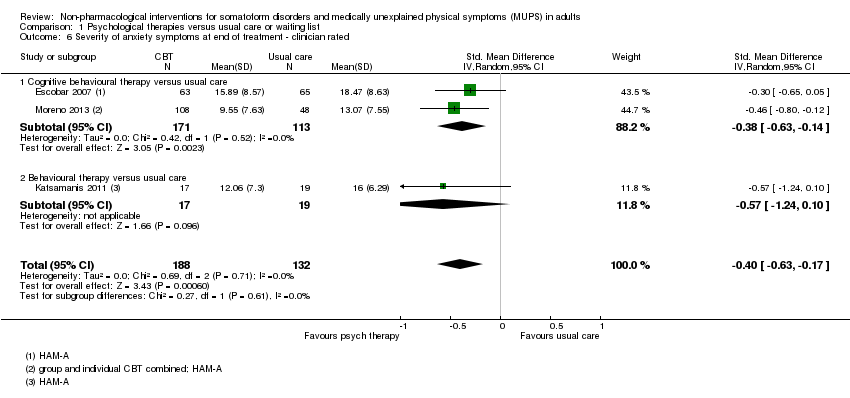
Comparison 1 Psychological therapies versus usual care or waiting list, Outcome 6 Severity of anxiety symptoms at end of treatment ‐ clinician rated.

Comparison 1 Psychological therapies versus usual care or waiting list, Outcome 7 Severity of anxiety symptoms within 1 year after treatment ‐ participant rated.

Comparison 1 Psychological therapies versus usual care or waiting list, Outcome 8 Severity of anxiety symptoms within 1 year after treatment ‐ clinician rated.

Comparison 1 Psychological therapies versus usual care or waiting list, Outcome 9 Severity of anxiety symptoms > 1 year after treatment ‐ clinician rated.
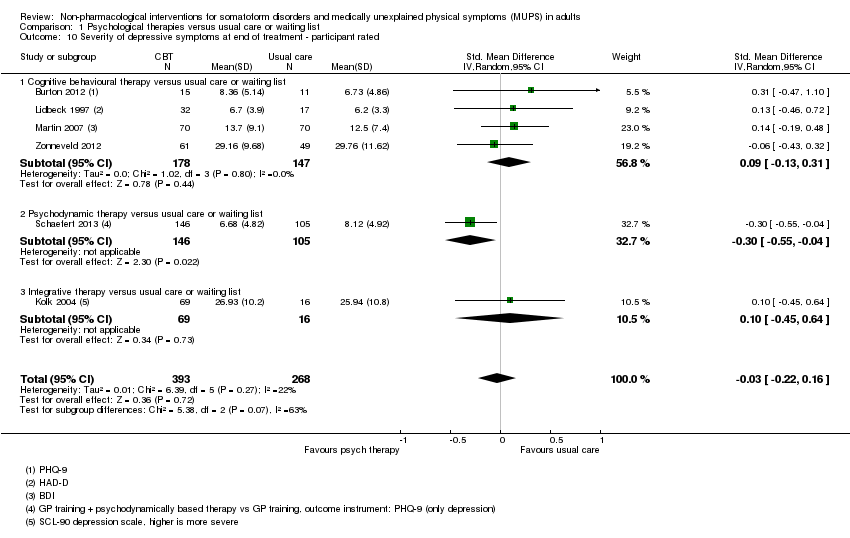
Comparison 1 Psychological therapies versus usual care or waiting list, Outcome 10 Severity of depressive symptoms at end of treatment ‐ participant rated.

Comparison 1 Psychological therapies versus usual care or waiting list, Outcome 11 Severity of depressive symptoms at end of treatment ‐ clinician rated.
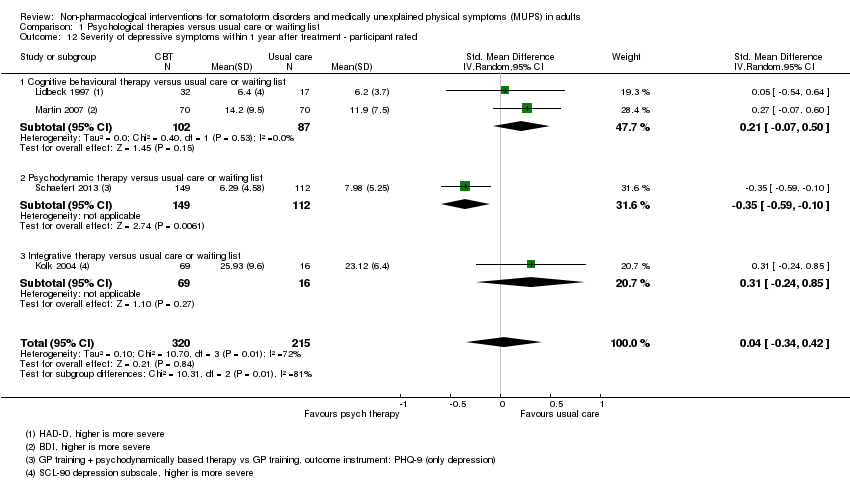
Comparison 1 Psychological therapies versus usual care or waiting list, Outcome 12 Severity of depressive symptoms within 1 year after treatment ‐ participant rated.

Comparison 1 Psychological therapies versus usual care or waiting list, Outcome 13 Severity of depressive symptoms within 1 year after treatment ‐ clinician rated.

Comparison 1 Psychological therapies versus usual care or waiting list, Outcome 14 Severity of depressive symptoms > 1 year after treatment ‐ clinician rated.
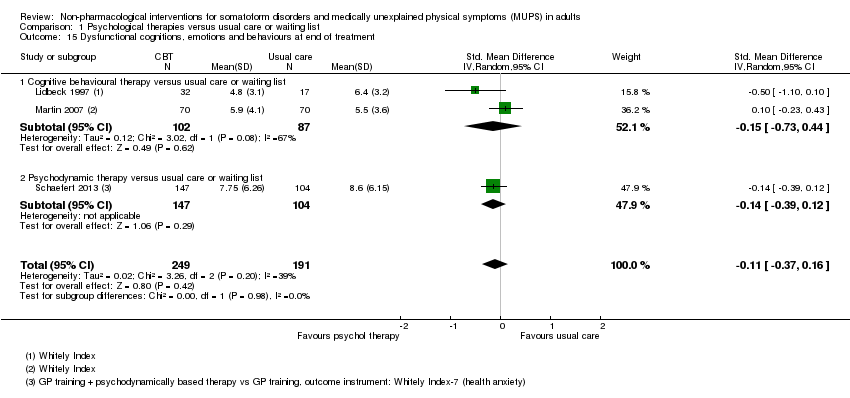
Comparison 1 Psychological therapies versus usual care or waiting list, Outcome 15 Dysfunctional cognitions, emotions and behaviours at end of treatment.
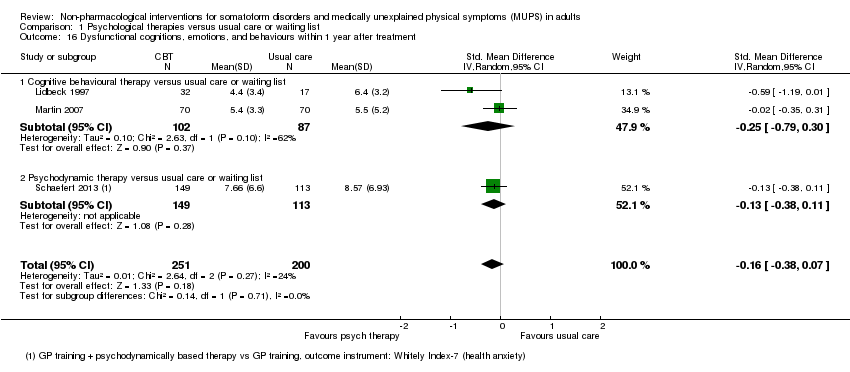
Comparison 1 Psychological therapies versus usual care or waiting list, Outcome 16 Dysfunctional cognitions, emotions, and behaviours within 1 year after treatment.

Comparison 1 Psychological therapies versus usual care or waiting list, Outcome 17 Adverse events.
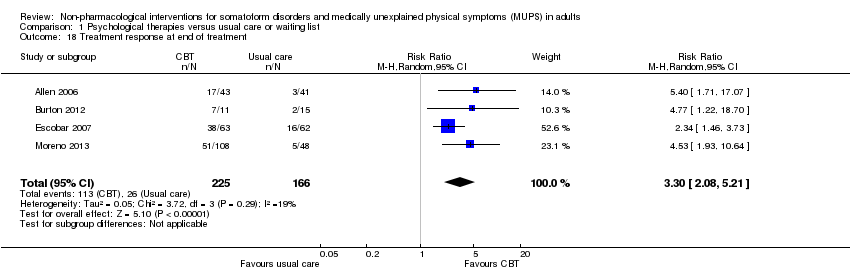
Comparison 1 Psychological therapies versus usual care or waiting list, Outcome 18 Treatment response at end of treatment.

Comparison 1 Psychological therapies versus usual care or waiting list, Outcome 19 Treatment response within 1 year after treatment.

Comparison 1 Psychological therapies versus usual care or waiting list, Outcome 20 Treatment response > 1 year after treatment.

Comparison 1 Psychological therapies versus usual care or waiting list, Outcome 21 Functional disability and quality of life at end of treatment.
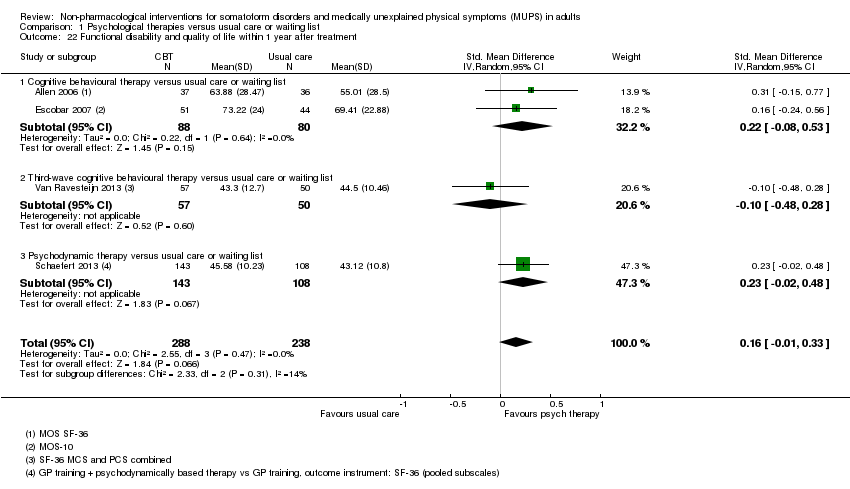
Comparison 1 Psychological therapies versus usual care or waiting list, Outcome 22 Functional disability and quality of life within 1 year after treatment.

Comparison 1 Psychological therapies versus usual care or waiting list, Outcome 23 Functional disability and quality of life > 1 year of treatment.

Comparison 1 Psychological therapies versus usual care or waiting list, Outcome 24 Healthcare use at end of treatment.
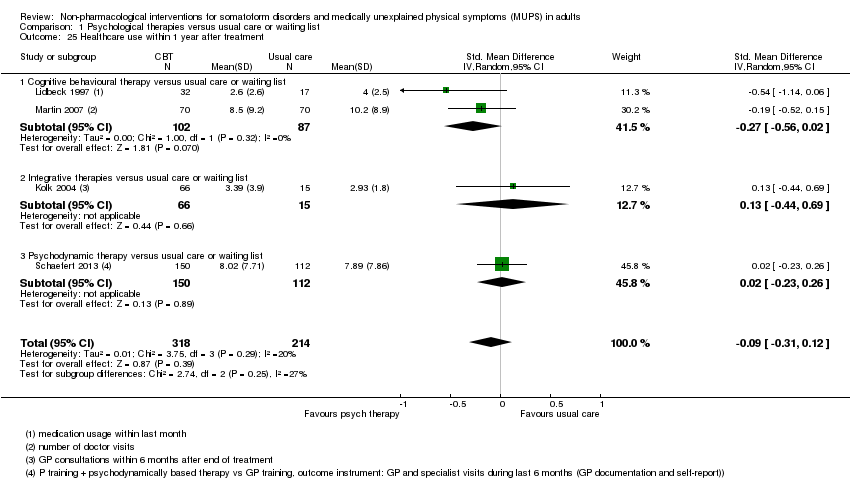
Comparison 1 Psychological therapies versus usual care or waiting list, Outcome 25 Healthcare use within 1 year after treatment.

Comparison 2 Psychological therapies versus enhanced care, Outcome 1 Severity of somatic symptoms at end of treatment.

Comparison 2 Psychological therapies versus enhanced care, Outcome 2 Severity of somatic symptoms within 1 year after treatment.

Comparison 2 Psychological therapies versus enhanced care, Outcome 3 Severity of somatic symptoms > 1 year after treatment.

Comparison 2 Psychological therapies versus enhanced care, Outcome 4 Acceptability.
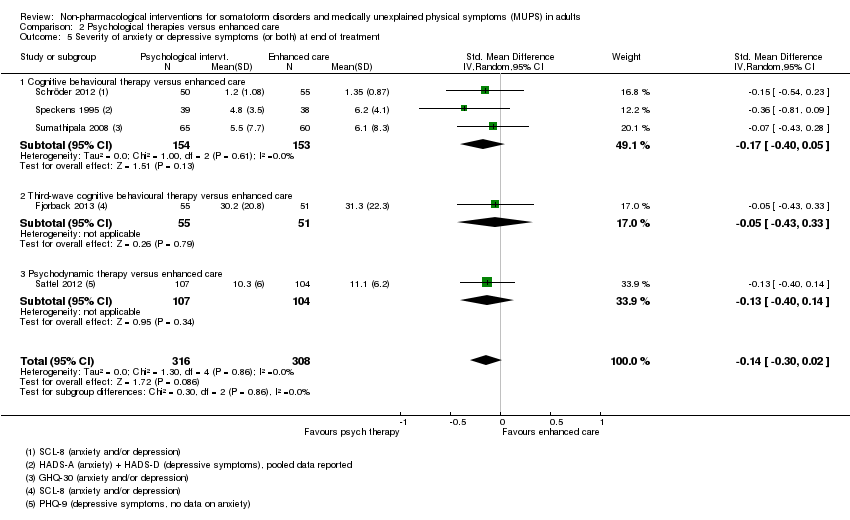
Comparison 2 Psychological therapies versus enhanced care, Outcome 5 Severity of anxiety or depressive symptoms (or both) at end of treatment.

Comparison 2 Psychological therapies versus enhanced care, Outcome 6 Severity of anxiety or depressive symptoms (or both) within 1 year after treatment.

Comparison 2 Psychological therapies versus enhanced care, Outcome 7 Severity of anxiety or depressive symptoms (or both) > 1 year after treatment.

Comparison 2 Psychological therapies versus enhanced care, Outcome 8 Dysfunctional cognitions, emotions, and behaviours at end of treatment.

Comparison 2 Psychological therapies versus enhanced care, Outcome 9 Dysfunctional cognitions, emotions, and behaviours within 1 year after treatment.

Comparison 2 Psychological therapies versus enhanced care, Outcome 10 Dysfunctional cognitions, emotions, and behaviours > 1 year after treatment.
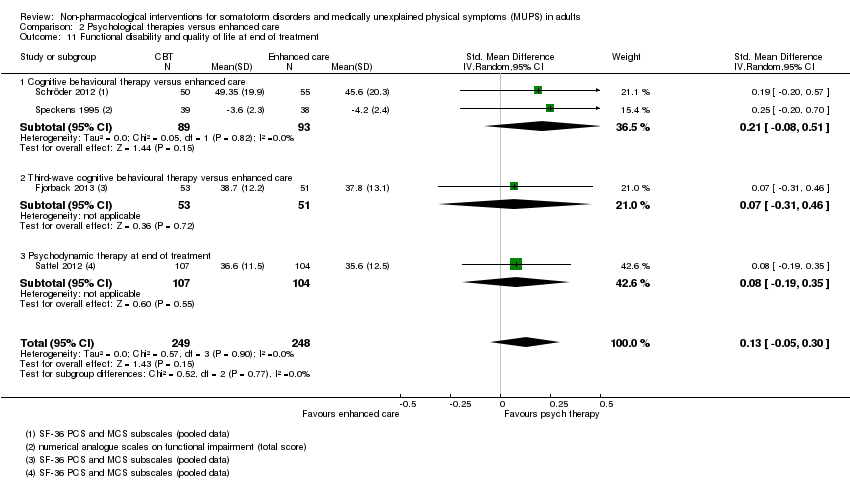
Comparison 2 Psychological therapies versus enhanced care, Outcome 11 Functional disability and quality of life at end of treatment.
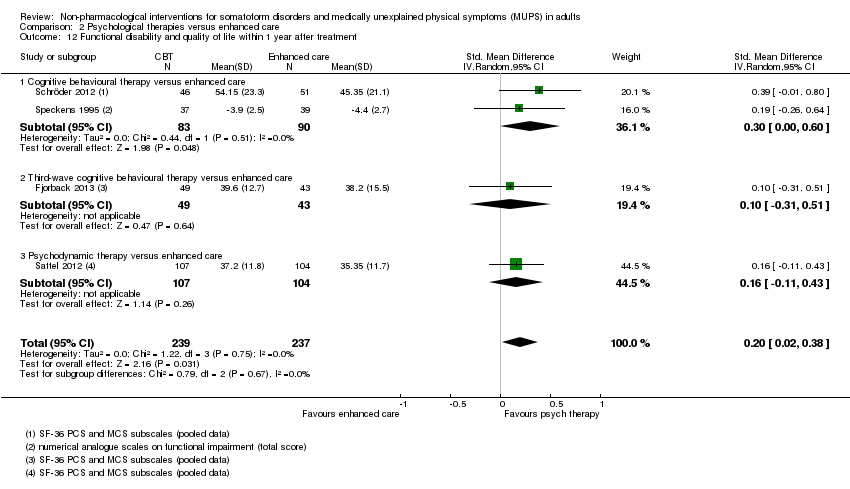
Comparison 2 Psychological therapies versus enhanced care, Outcome 12 Functional disability and quality of life within 1 year after treatment.
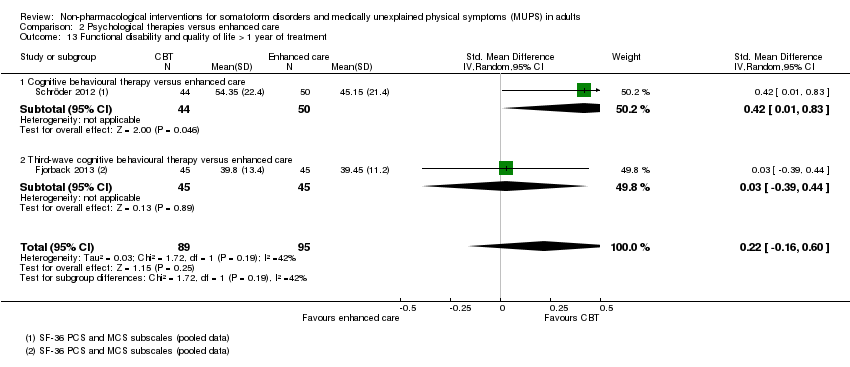
Comparison 2 Psychological therapies versus enhanced care, Outcome 13 Functional disability and quality of life > 1 year of treatment.
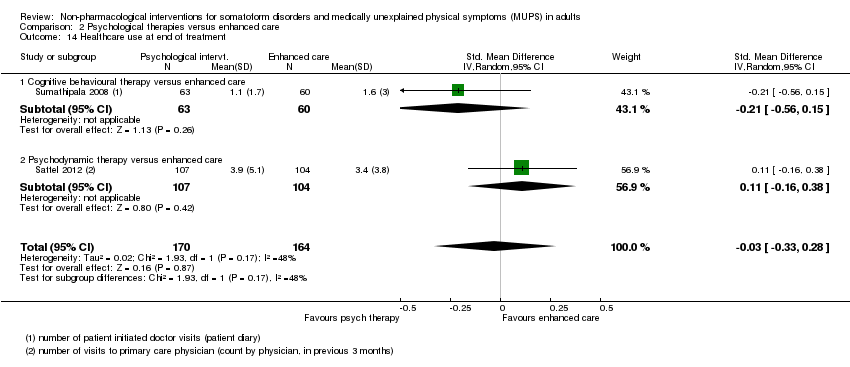
Comparison 2 Psychological therapies versus enhanced care, Outcome 14 Healthcare use at end of treatment.

Comparison 2 Psychological therapies versus enhanced care, Outcome 15 Healthcare use within 1 year after treatment.

Comparison 3 Cognitive behavioural therapy versus behavioural therapy, Outcome 1 Severity of somatic symptoms at end of treatment.
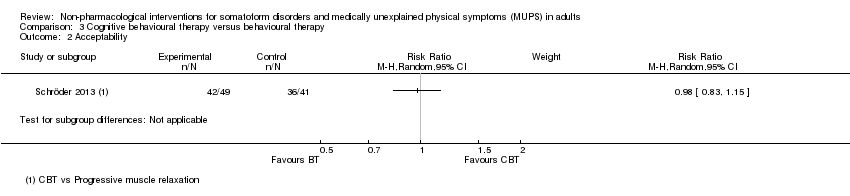
Comparison 3 Cognitive behavioural therapy versus behavioural therapy, Outcome 2 Acceptability.
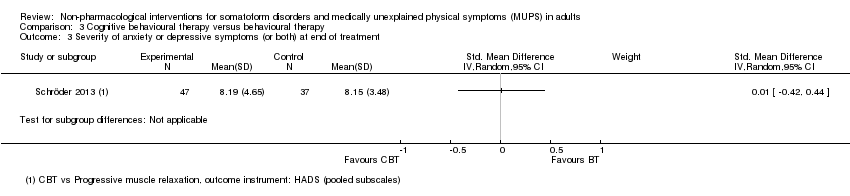
Comparison 3 Cognitive behavioural therapy versus behavioural therapy, Outcome 3 Severity of anxiety or depressive symptoms (or both) at end of treatment.

Comparison 3 Cognitive behavioural therapy versus behavioural therapy, Outcome 4 Functional disability and quality of life at end of treatment.
| Psychological therapy compared with usual care for somatoform disorders and medically unexplained physical symptoms | ||||||
| Patient or population: people with somatoform disorders and medically unexplained physical symptoms | ||||||
| Outcomes | Illustrative comparative risks* (95% CI) | Relative effect | No of participants | Quality of the evidence | Comments | |
| Assumed risk | Corresponding risk | |||||
| Usual care | Psychological therapy | |||||
| Severity of somatic symptoms at end of treatment | The mean severity of somatic symptoms at end of treatment ranged across control groups from | The mean severity of somatic symptoms at end of treatment in the intervention groups was | ‐ | 1081 | ⊕⊕⊝⊝ | A difference of 0.34 SMD was considered to be 'small to medium' |
| Acceptability | 896 per 1000 | 833 per 1000 | RR 0.93 | 1644 | ⊕⊕⊕⊝ | Excluding the outlier (see footnote) (70 participants) reduced I2 statistic from 70% to 33% |
| Dysfunctional cognitions, emotions, or behaviours (participant rated) at end of treatment | The mean dysfunctional cognitions, emotions, or behaviours (participant rated) at end of treatment in the control groups was | The mean dysfunctional cognitions, emotions, or behaviours (participant rated) at end of treatment in the intervention groups was | ‐ | 440 | ⊕⊕⊕⊝ | A difference of 0.11 SMD was considered to be 'small' |
| Treatment response at end of treatment | 157 per 1000 | 517 per 1000 | RR 3.30 | 391 | ⊕⊕⊝⊝ | ‐ |
| Functional disability/quality of life at end of treatment | ‐ | The mean functional disability/quality of life at end of treatment in the intervention groups was | ‐ | 730 | ⊕⊕⊝⊝ | A difference of 0.17 SMD was considered to be small |
| Healthcare use | ‐ | The mean healthcare use in the intervention groups was | ‐ | 532 | ⊕⊕⊕⊝ | Difference small and not statistically significant |
| *The basis for the assumed risk (e.g. the median control group risk across studies) is provided in footnotes. The corresponding risk (and its 95% confidence interval) is based on the assumed risk in the comparison group and the relative effect of the intervention (and its 95% CI). | ||||||
| GRADE Working Group grades of evidence | ||||||
| 1 Measured with different instruments using different scales. | ||||||
| Patient or population: somatoform disorders and medically unexplained physical symptoms | ||||||
| Outcomes | Illustrative comparative risks* (95% CI) | Relative effect | No of participants | Quality of the evidence | Comments | |
| Assumed risk | Corresponding risk | |||||
| Enhanced or structured care | Psychological therapies | |||||
| Severity of somatic symptoms at end of treatment | ‐ | The mean severity of somatic symptoms at end of treatment in the intervention groups was | ‐ | 624 | ⊕⊕⊕⊝ | 95% CI excluded large effect (> 0.5 SMD) |
| Acceptability | 904 per 1000 | 841 per 1000 | RR 0.93 | 679 | ⊕⊕⊕⊝ | ‐ |
| Dysfunctional cognitions, emotions, or behaviours at end of treatment | ‐ | The mean dysfunctional cognitions, emotions, or behaviours at end of treatment in the intervention groups was | ‐ | 499 | ⊕⊕⊕⊝ | 95% CI excluded clinically relevant effect |
| Treatment response at end of treatment | Study population | Not estimable | 0 | See comment | No studies reported on this outcome (see text) | |
| See comment | See comment | |||||
| Moderate | ||||||
| ‐ | ‐ | |||||
| Functional disability/quality of life at end of treatment | ‐ | The mean functional disability/quality of life at end of treatment in the intervention groups was | ‐ | 497 | ⊕⊕⊕⊝ | 95% CI excluded clinically relevant effect |
| Healthcare use within 1 year after treatment | ‐ | The mean healthcare use within 1 year after treatment in the intervention groups was | ‐ | 319 | ⊕⊕⊝⊝ | ‐ |
| *The basis for the assumed risk (e.g. the median control group risk across studies) is provided in footnotes. The corresponding risk (and its 95% confidence interval) is based on the assumed risk in the comparison group and the relative effect of the intervention (and its 95% CI). | ||||||
| GRADE Working Group grades of evidence | ||||||
| 1 Analysis 2.1. 11 No blinding (all studies) and >20% loss to follow up (2 studies) | ||||||
| Eligible for this review? | |||
| DSM‐IV | ICD‐10 | YES | NO |
| Somatisation disorder | Somatisation disorder | x | ‐ |
| Undifferentiated somatoform disorder (duration > 6 months) | Undifferentiated somatoform disorder (duration > 6 months) | x | ‐ |
| ‐ | Somatoform autonomic dysfunction | x | ‐ |
| Pain disorder | Persistent somatoform pain disorder | x | ‐ |
| Somatoform disorders, unspecified | Somatoform disorders unspecified | x | ‐ |
| Hypochondriasis | Hypochondriacal disorder | ‐ | x |
| ‐ | Other somatoform disorders | ‐ | x |
| Body dysmorphic disorder | Body dysmorphic disorder | ‐ | x |
| Conversion disorder | Dissociative and conversion disorders | ‐ | x |
| YES | NO | ||
| Alternative somatoform diagnoses (such as abridged somatisation disorder or multisomatoform disorder) | x | ‐ | |
| Chronic MUPS (duration ≥ 6 months) | x | ‐ | |
| Functional somatic syndromes | ‐ | x | |
| Specific functional somatic symptoms | ‐ | x | |
| DSM: Diagnostic and Statistical Manual of Mental Disorders; ICD: International Classification of Diseases. | |||
| Intervention | Group/alone | Duration | Number of sessions | Therapist | Comparison | duration of follow‐up | |
| Martin 2007 | CBT | group | once | 1 | psychologist and psychotherapeutic specialist | usual care | 6 months |
| Burton 2012 | psychological therapy in symptoms clinic | alone | 3 months | 4 | experienced specialised GP | usual care | 3 months |
| Schweickhardt 2007 | psychotherapy | alone | 2 weeks | 5 | psychotherapists | psychoeducational reading material | 6 months |
| Sumathipala 2000 | CBT | alone | 3 months | 6 | research psychiatrist | usual care | 3 months |
| Sumathipala 2008 | CBT | alone | 3 months | 6 | trained primary care physician | enhanced treatment as usual | 12 months |
| Schröder 2013 | CBT | group | 2 months | 8 | psychotherapist | progressive muscle relaxation | 6 months |
| Van Ravensteijn 2013 | mindfullness‐based cognitive therapy | group | 2 months | 8 | experienced mindfullness trainer | enhanced treatment as usual | 9 months |
| Fjorback 2013 | mindfullness | group | 3 months | 8 | experienced psychiatrist | enhanced treatment as usual | 15 months |
| Kashner 1995 | group psychological intervention + CL | group | 4 months | 8 | master level clinician | consultation letter | 12 months |
| Lidbeck 1997 | CBT | group | 3 months | 9 | trained physician | waiting list | 9 months |
| Schroder 2012 | stress intervention (psychotherapy + letter etc) | group + alone | 4 months | 9 | consultant or senior resident psychiatry | enhanced treatment as usual | 16 months |
| Katsamanis 2011 | psychophysiologic treatment + psychiatric consultation | alone | 10 weeks | 10 | psychologist or biofeedback clinician | psychiatric consultation | 10 weeks |
| Moreno 2013 | CBT + Letter (1) CBT + Letter (2) | alone (1) group (2) | 10 weeks | 10 | psychologist | usual care + letter | 12 months |
| Allen 2006 | CBT + psychiatric consultation | alone | 3 months | 10 | trained and experienced psychologist | psychiatric consultation | 15 months |
| Escobar 2007 | CBT + psychiatric consultation letter | alone | 3 months | 10 | therapist | usual care + PCL | 9 moths |
| Sattel 2012 | psychodynamic interpersonal psychotherapy | alone | 3 months | 12 | psychologist or physician with psychotherapy experience | enhanced treatment as usual | 9 months |
| Schaefert 2013 | GP training in MUPS + interpersonal psychodynamically based therapy | group | 9 months | 12 | psychosomatic specialist | GP training in MUPS | 12 months |
| Zonneveld 2012 | CBT | group | 13 weeks | 13 | psychologist | waiting list | 13 weeks |
| Schilte 2001 | disclosure intervention | alone | unclear | unclear | trained disclosure doctor | usual care | 24 months |
| Speckens 1995 | CBT | alone | 6 months | 6‐16 | trained physician and behavioural therapist | enhanced treatment as usual | 12 months |
| Kolk 2004 | psychological intervention (varied) | alone | max 6 months | max 12 | trained therapist | usual care | 12 months |
| CBT: cognitive behavioural therapy; GP: general practitioner; max: maximum; MUPS: medically unexplained physical symptoms. | |||||||
| Outcome or subgroup title | No. of studies | No. of participants | Statistical method | Effect size |
| 1 Severity of somatic symptoms at end of treatment Show forest plot | 10 | 1081 | Std. Mean Difference (IV, Random, 95% CI) | ‐0.34 [‐0.53, ‐0.16] |
| 1.1 Cognitive behavioural therapy versus usual care or waiting list | 6 | 593 | Std. Mean Difference (IV, Random, 95% CI) | ‐0.37 [‐0.69, ‐0.05] |
| 1.2 Behavioural therapy versus usual care or waiting list | 1 | 37 | Std. Mean Difference (IV, Random, 95% CI) | ‐0.22 [‐0.87, 0.43] |
| 1.3 Third‐wave cognitive behavioural therapy versus usual care or waiting list | 1 | 114 | Std. Mean Difference (IV, Random, 95% CI) | ‐0.31 [‐0.68, 0.06] |
| 1.4 Psychodynamic therapy versus usual care or waiting list | 1 | 252 | Std. Mean Difference (IV, Random, 95% CI) | ‐0.39 [‐0.64, ‐0.13] |
| 1.5 Integrative therapies versus usual care or waiting list | 1 | 85 | Std. Mean Difference (IV, Random, 95% CI) | ‐0.15 [‐0.69, 0.40] |
| 2 Severity of somatic symptoms within 1 year after treatment Show forest plot | 7 | 950 | Std. Mean Difference (IV, Random, 95% CI) | ‐0.24 [‐0.37, ‐0.11] |
| 2.1 Cognitive behavioural therapy versus usual care or waiting list | 4 | 496 | Std. Mean Difference (IV, Random, 95% CI) | ‐0.29 [‐0.49, ‐0.09] |
| 2.2 Third‐wave cognitive behavioural therapy versus usual care or waiting list | 1 | 107 | Std. Mean Difference (IV, Random, 95% CI) | ‐0.15 [‐0.53, 0.23] |
| 2.3 Psychodynamic therapy versus usual care or waiting list | 1 | 262 | Std. Mean Difference (IV, Random, 95% CI) | ‐0.20 [‐0.44, 0.05] |
| 2.4 Integrative therapies versus usual care or waiting list | 1 | 85 | Std. Mean Difference (IV, Random, 95% CI) | ‐0.15 [‐0.69, 0.40] |
| 3 Severity of somatic symptoms > 1 year after treatment Show forest plot | 2 | 228 | Std. Mean Difference (IV, Random, 95% CI) | ‐0.52 [‐0.80, ‐0.24] |
| 3.1 Cognitive behavioural therapy versus usual care or waiting list | 2 | 228 | Std. Mean Difference (IV, Random, 95% CI) | ‐0.52 [‐0.80, ‐0.24] |
| 4 Acceptability Show forest plot | 14 | 1644 | Risk Ratio (M‐H, Random, 95% CI) | 0.93 [0.88, 0.99] |
| 4.1 Cognitive behavioural therapy versus usual care or waiting list | 10 | 1037 | Risk Ratio (M‐H, Random, 95% CI) | 0.93 [0.85, 1.01] |
| 4.2 Behavioural therapy versus usual care or waiting list | 1 | 48 | Risk Ratio (M‐H, Random, 95% CI) | 0.9 [0.67, 1.21] |
| 4.3 Third‐wave cognitive behavioural therapy versus usual care or waiting list | 1 | 125 | Risk Ratio (M‐H, Random, 95% CI) | 0.85 [0.72, 1.00] |
| 4.4 Psychodynamic therapy versus usual care or waiting list | 1 | 328 | Risk Ratio (M‐H, Random, 95% CI) | 0.92 [0.88, 0.96] |
| 4.5 Integrative therapies versus usual care or waiting list | 1 | 106 | Risk Ratio (M‐H, Random, 95% CI) | 1.06 [0.81, 1.39] |
| 5 Severity of anxiety symptoms at end of treatment ‐ participant rated Show forest plot | 4 | 270 | Std. Mean Difference (IV, Random, 95% CI) | 0.06 [‐0.20, 0.32] |
| 5.1 Cognitive behavioural therapy versus usual care or waiting list | 3 | 185 | Std. Mean Difference (IV, Random, 95% CI) | 0.07 [‐0.22, 0.37] |
| 5.2 Integrative therapies versus usual care or waiting list | 1 | 85 | Std. Mean Difference (IV, Random, 95% CI) | 0.01 [‐0.53, 0.56] |
| 6 Severity of anxiety symptoms at end of treatment ‐ clinician rated Show forest plot | 3 | 320 | Std. Mean Difference (IV, Random, 95% CI) | ‐0.40 [‐0.63, ‐0.17] |
| 6.1 Cognitive behavioural therapy versus usual care | 2 | 284 | Std. Mean Difference (IV, Random, 95% CI) | ‐0.38 [‐0.63, ‐0.14] |
| 6.2 Behavioural therapy versus usual care | 1 | 36 | Std. Mean Difference (IV, Random, 95% CI) | ‐0.57 [‐1.24, 0.10] |
| 7 Severity of anxiety symptoms within 1 year after treatment ‐ participant rated Show forest plot | 2 | 134 | Std. Mean Difference (IV, Random, 95% CI) | 0.18 [‐0.22, 0.58] |
| 7.1 Cognitive behavioural therapy versus usual care or waiting list | 1 | 49 | Std. Mean Difference (IV, Random, 95% CI) | 0.0 [‐0.59, 0.59] |
| 7.2 Integrative therapies versus usual care or waiting list | 1 | 85 | Std. Mean Difference (IV, Random, 95% CI) | 0.33 [‐0.21, 0.88] |
| 8 Severity of anxiety symptoms within 1 year after treatment ‐ clinician rated Show forest plot | 2 | 251 | Std. Mean Difference (IV, Random, 95% CI) | ‐0.66 [‐1.15, ‐0.18] |
| 9 Severity of anxiety symptoms > 1 year after treatment ‐ clinician rated Show forest plot | 1 | Std. Mean Difference (IV, Random, 95% CI) | Totals not selected | |
| 10 Severity of depressive symptoms at end of treatment ‐ participant rated Show forest plot | 6 | 661 | Std. Mean Difference (IV, Random, 95% CI) | ‐0.03 [‐0.22, 0.16] |
| 10.1 Cognitive behavioural therapy versus usual care or waiting list | 4 | 325 | Std. Mean Difference (IV, Random, 95% CI) | 0.09 [‐0.13, 0.31] |
| 10.2 Psychodynamic therapy versus usual care or waiting list | 1 | 251 | Std. Mean Difference (IV, Random, 95% CI) | ‐0.30 [‐0.55, ‐0.04] |
| 10.3 Integrative therapy versus usual care or waiting list | 1 | 85 | Std. Mean Difference (IV, Random, 95% CI) | 0.10 [‐0.45, 0.64] |
| 11 Severity of depressive symptoms at end of treatment ‐ clinician rated Show forest plot | 3 | 316 | Std. Mean Difference (IV, Random, 95% CI) | ‐0.25 [‐0.48, ‐0.02] |
| 11.1 Cognitive behavioural therapy versus usual care or waiting list | 2 | 284 | Std. Mean Difference (IV, Random, 95% CI) | ‐0.25 [‐0.49, ‐0.01] |
| 11.2 Behavioural therapy versus usual care or waiting list | 1 | 32 | Std. Mean Difference (IV, Random, 95% CI) | ‐0.26 [‐0.96, 0.44] |
| 12 Severity of depressive symptoms within 1 year after treatment ‐ participant rated Show forest plot | 4 | 535 | Std. Mean Difference (IV, Random, 95% CI) | 0.04 [‐0.34, 0.42] |
| 12.1 Cognitive behavioural therapy versus usual care or waiting list | 2 | 189 | Std. Mean Difference (IV, Random, 95% CI) | 0.21 [‐0.07, 0.50] |
| 12.2 Psychodynamic therapy versus usual care or waiting list | 1 | 261 | Std. Mean Difference (IV, Random, 95% CI) | ‐0.35 [‐0.59, ‐0.10] |
| 12.3 Integrative therapy versus usual care or waiting list | 1 | 85 | Std. Mean Difference (IV, Random, 95% CI) | 0.31 [‐0.24, 0.85] |
| 13 Severity of depressive symptoms within 1 year after treatment ‐ clinician rated Show forest plot | 2 | 251 | Std. Mean Difference (IV, Random, 95% CI) | ‐0.55 [‐1.17, 0.07] |
| 14 Severity of depressive symptoms > 1 year after treatment ‐ clinician rated Show forest plot | 1 | Std. Mean Difference (IV, Random, 95% CI) | Totals not selected | |
| 15 Dysfunctional cognitions, emotions and behaviours at end of treatment Show forest plot | 3 | 440 | Std. Mean Difference (IV, Random, 95% CI) | ‐0.11 [‐0.37, 0.16] |
| 15.1 Cognitive behavioural therapy versus usual care or waiting list | 2 | 189 | Std. Mean Difference (IV, Random, 95% CI) | ‐0.15 [‐0.73, 0.44] |
| 15.2 Psychodynamic therapy versus usual care or waiting list | 1 | 251 | Std. Mean Difference (IV, Random, 95% CI) | ‐0.14 [‐0.39, 0.12] |
| 16 Dysfunctional cognitions, emotions, and behaviours within 1 year after treatment Show forest plot | 3 | 451 | Std. Mean Difference (IV, Random, 95% CI) | ‐0.16 [‐0.38, 0.07] |
| 16.1 Cognitive behavioural therapy versus usual care or waiting list | 2 | 189 | Std. Mean Difference (IV, Random, 95% CI) | ‐0.25 [‐0.79, 0.30] |
| 16.2 Psychodynamic therapy versus usual care or waiting list | 1 | 262 | Std. Mean Difference (IV, Random, 95% CI) | ‐0.13 [‐0.38, 0.11] |
| 17 Adverse events Show forest plot | 3 | 445 | Risk Ratio (M‐H, Random, 95% CI) | 1.31 [0.47, 3.66] |
| 18 Treatment response at end of treatment Show forest plot | 4 | 391 | Risk Ratio (M‐H, Random, 95% CI) | 3.30 [2.08, 5.21] |
| 19 Treatment response within 1 year after treatment Show forest plot | 3 | 332 | Risk Ratio (M‐H, Random, 95% CI) | 2.53 [1.25, 5.10] |
| 20 Treatment response > 1 year after treatment Show forest plot | 2 | 240 | Risk Ratio (M‐H, Random, 95% CI) | 10.31 [2.95, 36.02] |
| 21 Functional disability and quality of life at end of treatment Show forest plot | 7 | 730 | Std. Mean Difference (IV, Random, 95% CI) | 0.17 [0.03, 0.32] |
| 21.1 Cognitive behavioural therapy versus usual care or waiting list | 4 | 341 | Std. Mean Difference (IV, Random, 95% CI) | 0.15 [‐0.06, 0.37] |
| 21.2 Behavioural therapy versus usual care or waiting list | 1 | 34 | Std. Mean Difference (IV, Random, 95% CI) | 0.16 [‐0.51, 0.83] |
| 21.3 Third‐wave cognitive behavioural therapy versus usual care or waiting list | 1 | 111 | Std. Mean Difference (IV, Random, 95% CI) | 0.08 [‐0.29, 0.46] |
| 21.4 Psychodynamic therapy versus usual care or waiting list | 1 | 244 | Std. Mean Difference (IV, Random, 95% CI) | 0.24 [‐0.01, 0.50] |
| 22 Functional disability and quality of life within 1 year after treatment Show forest plot | 4 | 526 | Std. Mean Difference (IV, Random, 95% CI) | 0.16 [‐0.01, 0.33] |
| 22.1 Cognitive behavioural therapy versus usual care or waiting list | 2 | 168 | Std. Mean Difference (IV, Random, 95% CI) | 0.22 [‐0.08, 0.53] |
| 22.2 Third‐wave cognitive behavioural therapy versus usual care or waiting list | 1 | 107 | Std. Mean Difference (IV, Random, 95% CI) | ‐0.10 [‐0.48, 0.28] |
| 22.3 Psychodynamic therapy versus usual care or waiting list | 1 | 251 | Std. Mean Difference (IV, Random, 95% CI) | 0.23 [‐0.02, 0.48] |
| 23 Functional disability and quality of life > 1 year of treatment Show forest plot | 1 | 72 | Std. Mean Difference (IV, Random, 95% CI) | 0.36 [‐0.11, 0.82] |
| 24 Healthcare use at end of treatment Show forest plot | 2 | 117 | Std. Mean Difference (IV, Random, 95% CI) | ‐0.68 [‐1.06, ‐0.30] |
| 25 Healthcare use within 1 year after treatment Show forest plot | 4 | 532 | Std. Mean Difference (IV, Random, 95% CI) | ‐0.09 [‐0.31, 0.12] |
| 25.1 Cognitive behavioural therapy versus usual care or waiting list | 2 | 189 | Std. Mean Difference (IV, Random, 95% CI) | ‐0.27 [‐0.56, 0.02] |
| 25.2 Integrative therapies versus usual care or waiting list | 1 | 81 | Std. Mean Difference (IV, Random, 95% CI) | 0.13 [‐0.44, 0.69] |
| 25.3 Psychodynamic therapy versus usual care or waiting list | 1 | 262 | Std. Mean Difference (IV, Random, 95% CI) | 0.02 [‐0.23, 0.26] |
| Outcome or subgroup title | No. of studies | No. of participants | Statistical method | Effect size |
| 1 Severity of somatic symptoms at end of treatment Show forest plot | 5 | 624 | Std. Mean Difference (IV, Random, 95% CI) | ‐0.19 [‐0.43, 0.04] |
| 1.1 Cognitive behavioural therapy versus enhanced care | 3 | 307 | Std. Mean Difference (IV, Random, 95% CI) | ‐0.34 [‐0.71, 0.03] |
| 1.2 Third‐wave cognitive behavioural therapy versus enhanced care | 1 | 106 | Std. Mean Difference (IV, Random, 95% CI) | 0.01 [‐0.38, 0.39] |
| 1.3 Psychodynamic therapy versus enhanced care | 1 | 211 | Std. Mean Difference (IV, Random, 95% CI) | ‐0.04 [‐0.31, 0.23] |
| 2 Severity of somatic symptoms within 1 year after treatment Show forest plot | 5 | 593 | Std. Mean Difference (IV, Random, 95% CI) | ‐0.21 [‐0.40, ‐0.02] |
| 2.1 Cognitive behavioural therapy versus enhanced care | 3 | 289 | Std. Mean Difference (IV, Random, 95% CI) | ‐0.30 [‐0.60, ‐0.00] |
| 2.2 Third‐wave cognitive behavioural therapy versus enhanced care | 1 | 93 | Std. Mean Difference (IV, Random, 95% CI) | 0.05 [‐0.36, 0.46] |
| 2.3 Psychodynamic therapy versus enhanced care | 1 | 211 | Std. Mean Difference (IV, Random, 95% CI) | ‐0.20 [‐0.47, 0.07] |
| 3 Severity of somatic symptoms > 1 year after treatment Show forest plot | 2 | 172 | Std. Mean Difference (IV, Random, 95% CI) | ‐0.32 [‐0.73, 0.10] |
| 3.1 Cognitive behavioural therapy versus enhanced care | 1 | 82 | Std. Mean Difference (IV, Random, 95% CI) | ‐0.53 [‐0.98, ‐0.09] |
| 3.2 Third‐wave cognitive behavioural therapy versus enhanced care | 1 | 90 | Std. Mean Difference (IV, Random, 95% CI) | ‐0.11 [‐0.53, 0.30] |
| 4 Acceptability Show forest plot | 5 | 679 | Risk Ratio (M‐H, Random, 95% CI) | 0.93 [0.87, 1.00] |
| 4.1 Cognitive behavioural therapy versus enhanced care | 3 | 349 | Risk Ratio (M‐H, Random, 95% CI) | 0.91 [0.82, 1.02] |
| 4.2 Third‐wave cognitive behavioural therapy versus enhanced care | 1 | 119 | Risk Ratio (M‐H, Random, 95% CI) | 0.91 [0.82, 1.01] |
| 4.3 Psychodynamic therapy versus enhanced care | 1 | 211 | Risk Ratio (M‐H, Random, 95% CI) | 1.01 [0.89, 1.14] |
| 5 Severity of anxiety or depressive symptoms (or both) at end of treatment Show forest plot | 5 | 624 | Std. Mean Difference (IV, Random, 95% CI) | ‐0.14 [‐0.30, 0.02] |
| 5.1 Cognitive behavioural therapy versus enhanced care | 3 | 307 | Std. Mean Difference (IV, Random, 95% CI) | ‐0.17 [‐0.40, 0.05] |
| 5.2 Third‐wave cognitive behavioural therapy versus enhanced care | 1 | 106 | Std. Mean Difference (IV, Random, 95% CI) | ‐0.05 [‐0.43, 0.33] |
| 5.3 Psychodynamic therapy versus enhanced care | 1 | 211 | Std. Mean Difference (IV, Random, 95% CI) | ‐0.13 [‐0.40, 0.14] |
| 6 Severity of anxiety or depressive symptoms (or both) within 1 year after treatment Show forest plot | 5 | 593 | Std. Mean Difference (IV, Random, 95% CI) | ‐0.13 [‐0.29, 0.03] |
| 6.1 Cognitive behavioural therapy versus enhanced care | 3 | 289 | Std. Mean Difference (IV, Random, 95% CI) | ‐0.17 [‐0.40, 0.06] |
| 6.2 Third‐wave behavioural therapy versus enhanced care | 1 | 93 | Std. Mean Difference (IV, Random, 95% CI) | ‐0.04 [‐0.45, 0.36] |
| 6.3 Psychodynamic therapy versus enhanced care | 1 | 211 | Std. Mean Difference (IV, Random, 95% CI) | ‐0.11 [‐0.38, 0.16] |
| 7 Severity of anxiety or depressive symptoms (or both) > 1 year after treatment Show forest plot | 2 | 184 | Std. Mean Difference (IV, Random, 95% CI) | ‐0.26 [‐0.55, 0.03] |
| 7.1 Cognitive behavioural therapy versus enhanced care | 1 | 94 | Std. Mean Difference (IV, Random, 95% CI) | ‐0.36 [‐0.77, 0.04] |
| 7.2 Third‐wave cognitive behavioural therapy versus enhanced care | 1 | 90 | Std. Mean Difference (IV, Random, 95% CI) | ‐0.15 [‐0.56, 0.26] |
| 8 Dysfunctional cognitions, emotions, and behaviours at end of treatment Show forest plot | 4 | 499 | Std. Mean Difference (IV, Random, 95% CI) | ‐0.09 [‐0.29, 0.10] |
| 8.1 Cognitive behavioural therapy versus enhanced care | 2 | 182 | Std. Mean Difference (IV, Random, 95% CI) | ‐0.28 [‐0.57, 0.01] |
| 8.2 Third‐wave cognitive behavioural therapy versus enhanced care | 1 | 106 | Std. Mean Difference (IV, Random, 95% CI) | 0.06 [‐0.32, 0.44] |
| 8.3 Psychodynamic therapy versus enhanced care | 1 | 211 | Std. Mean Difference (IV, Random, 95% CI) | 0.0 [‐0.27, 0.27] |
| 9 Dysfunctional cognitions, emotions, and behaviours within 1 year after treatment Show forest plot | 4 | 477 | Std. Mean Difference (IV, Random, 95% CI) | ‐0.24 [‐0.49, 0.00] |
| 9.1 Cognitive behavioural therapy versus enhanced care | 2 | 173 | Std. Mean Difference (IV, Random, 95% CI) | ‐0.45 [‐0.83, ‐0.07] |
| 9.2 Third‐wave cognitive behavioural therapy versus enhanced care | 1 | 93 | Std. Mean Difference (IV, Random, 95% CI) | ‐0.03 [‐0.44, 0.38] |
| 9.3 Psychodynamic therapy versus enhanced care | 1 | 211 | Std. Mean Difference (IV, Random, 95% CI) | ‐0.13 [‐0.40, 0.14] |
| 10 Dysfunctional cognitions, emotions, and behaviours > 1 year after treatment Show forest plot | 2 | 184 | Std. Mean Difference (IV, Random, 95% CI) | ‐0.58 [‐1.27, 0.11] |
| 10.1 Cognitive behavioural therapy versus enhanced care | 1 | 94 | Std. Mean Difference (IV, Random, 95% CI) | ‐0.94 [‐1.36, ‐0.51] |
| 10.2 Third‐wave cognitive behavioural therapy versus enhanced care | 1 | 90 | Std. Mean Difference (IV, Random, 95% CI) | ‐0.23 [‐0.64, 0.19] |
| 11 Functional disability and quality of life at end of treatment Show forest plot | 4 | 497 | Std. Mean Difference (IV, Random, 95% CI) | 0.13 [‐0.05, 0.30] |
| 11.1 Cognitive behavioural therapy versus enhanced care | 2 | 182 | Std. Mean Difference (IV, Random, 95% CI) | 0.21 [‐0.08, 0.51] |
| 11.2 Third‐wave cognitive behavioural therapy versus enhanced care | 1 | 104 | Std. Mean Difference (IV, Random, 95% CI) | 0.07 [‐0.31, 0.46] |
| 11.3 Psychodynamic therapy at end of treatment | 1 | 211 | Std. Mean Difference (IV, Random, 95% CI) | 0.08 [‐0.19, 0.35] |
| 12 Functional disability and quality of life within 1 year after treatment Show forest plot | 4 | 476 | Std. Mean Difference (IV, Random, 95% CI) | 0.20 [0.02, 0.38] |
| 12.1 Cognitive behavioural therapy versus enhanced care | 2 | 173 | Std. Mean Difference (IV, Random, 95% CI) | 0.30 [0.00, 0.60] |
| 12.2 Third‐wave cognitive behavioural therapy versus enhanced care | 1 | 92 | Std. Mean Difference (IV, Random, 95% CI) | 0.10 [‐0.31, 0.51] |
| 12.3 Psychodynamic therapy versus enhanced care | 1 | 211 | Std. Mean Difference (IV, Random, 95% CI) | 0.16 [‐0.11, 0.43] |
| 13 Functional disability and quality of life > 1 year of treatment Show forest plot | 2 | 184 | Std. Mean Difference (IV, Random, 95% CI) | 0.22 [‐0.16, 0.60] |
| 13.1 Cognitive behavioural therapy versus enhanced care | 1 | 94 | Std. Mean Difference (IV, Random, 95% CI) | 0.42 [0.01, 0.83] |
| 13.2 Third‐wave cognitive behavioural therapy versus enhanced care | 1 | 90 | Std. Mean Difference (IV, Random, 95% CI) | 0.03 [‐0.39, 0.44] |
| 14 Healthcare use at end of treatment Show forest plot | 2 | 334 | Std. Mean Difference (IV, Random, 95% CI) | ‐0.03 [‐0.33, 0.28] |
| 14.1 Cognitive behavioural therapy versus enhanced care | 1 | 123 | Std. Mean Difference (IV, Random, 95% CI) | ‐0.21 [‐0.56, 0.15] |
| 14.2 Psychodynamic therapy versus enhanced care | 1 | 211 | Std. Mean Difference (IV, Random, 95% CI) | 0.11 [‐0.16, 0.38] |
| 15 Healthcare use within 1 year after treatment Show forest plot | 2 | 319 | Std. Mean Difference (IV, Random, 95% CI) | ‐0.24 [‐0.46, ‐0.01] |
| 15.1 Cognitive behavioural therapy versus enhanced care | 1 | 108 | Std. Mean Difference (IV, Random, 95% CI) | ‐0.08 [‐0.46, 0.30] |
| 15.2 Psychodynamic therapy versus enhanced care | 1 | 211 | Std. Mean Difference (IV, Random, 95% CI) | ‐0.32 [‐0.59, ‐0.05] |
| Outcome or subgroup title | No. of studies | No. of participants | Statistical method | Effect size |
| 1 Severity of somatic symptoms at end of treatment Show forest plot | 1 | Std. Mean Difference (IV, Random, 95% CI) | Subtotals only | |
| 2 Acceptability Show forest plot | 1 | Risk Ratio (M‐H, Random, 95% CI) | Subtotals only | |
| 3 Severity of anxiety or depressive symptoms (or both) at end of treatment Show forest plot | 1 | Std. Mean Difference (IV, Random, 95% CI) | Subtotals only | |
| 4 Functional disability and quality of life at end of treatment Show forest plot | 1 | Std. Mean Difference (IV, Random, 95% CI) | Subtotals only | |