Intervenciones no farmacológicas para los trastornos somatoformes y los síntomas físicos sin explicación médica (SFSEM) en adultos
Resumen
Antecedentes
Los síntomas físicos sin explicación médica (SFSEM) son síntomas físicos para los cuales no puede encontrarse ninguna explicación médica adecuada después del examen apropiado. La presencia de SFSEM es la característica clave de las afecciones conocidas como “trastornos somatoformes”. Se han desarrollado diversos tratamientos psicológicos y físicos para tratar los trastornos somatoformes y los SFSEM. Aunque hay varias revisiones sobre las intervenciones no farmacológicas para los trastornos somatoformes y los SFSEM, no existe un resumen completo de todo el espectro.
Objetivos
Evaluar los efectos de las intervenciones no farmacológicas para los trastornos somatoformes (específicamente el trastorno de somatización, el trastorno somatoforme indiferenciado, los trastornos somatoformes inespecíficos, la disfunción autonómica somatoforme, el trastorno de dolor y los diagnósticos somatoformes alternativos propuestos en la bibliografía) y los SFSEM en adultos, en comparación con tratamiento habitual, controles en lista de espera, atención de placebo, placebo psicológico, atención mejorada o estructurada y otras terapias psicológicas o fisioterapias.
Métodos de búsqueda
Se hicieron búsquedas en el registro especializado del Grupo de Revisión Cochrane de Depresión, Ansiedad y Neurosis (Cochrane Depression, Anxiety and Neurosis Review Group, CCDANCTR) hasta noviembre 2013. Este registro incluye ensayos controlados relevantes (ECA) de The Cochrane Library, EMBASE, MEDLINE y PsycINFO. Se ejecutó una búsqueda adicional en el Registro Cochrane Central de Ensayos Controlados (Cochrane Central Register of Controlled Trials) y una búsqueda de referencias citadas en Web of Science. También se buscó en la literatura gris, en actas de congresos, registros de ensayos internacionales y en revisiones sistemáticas pertinentes.
Criterios de selección
Se incluyeron ECA y ensayos controlados aleatorios por grupos en adultos principalmente diagnosticados con un trastorno somatoforme o un concepto de diagnóstico alternativo de SFSEM, que habían sido asignados a una intervención no farmacológica en comparación con atención habitual, control en lista de espera, atención o placebo psicológico, atención mejorada, u otra intervención psicológica o de fisioterapia, solas o en combinación.
Obtención y análisis de los datos
Cuatro autores de la revisión, trabajando en parejas, realizaron la extracción de los datos y la evaluación del riesgo de sesgo. Los desacuerdos se resolvieron mediante discusión o consulta con otro autor de la revisión. Se agruparon los datos de los estudios que consideraban la misma comparación mediante las diferencias de medias estandarizadas (DME) o los cocientes de riesgos (CR) y un modelo de efectos aleatorios. Los resultados primarios fueron la gravedad de los síntomas somáticos y la aceptabilidad del tratamiento.
Resultados principales
Se incluyeron 21 estudios con 2658 participantes asignados al azar. Todos los estudios evaluaron la efectividad de alguna forma de tratamiento psicológico. No se encontró ningún estudio que incluyera fisioterapia.
Catorce estudios evaluaron formas de la terapia cognitivo‐conductual (TCC); los restantes evaluaron terapias conductuales, TCC de tercera generación (de atención plena), terapias psicodinámicas y terapia integradora. Quince estudios incluidos compararon la terapia psicológica estudiada con atención habitual o una lista de espera. Cinco estudios compararon la intervención con atención mejorada o estructurada. Sólo un estudio comparó la terapia cognitivo‐conductual con la terapia de conducta.
Entre los 21 estudios, el número medio de sesiones varió de uno a 13, durante un periodo de un día a nueve meses. La duración del seguimiento varió entre dos semanas y 24 meses. Los participantes se reclutaron de diversos contextos de asistencia sanitaria y la población abierta. La duración de los síntomas, informada por nueve estudios, fue de al menos varios años, lo cual sugiere que la mayoría de los participantes tenía síntomas crónicos al inicio.
Debido a la naturaleza de la intervención, la falta de cegamiento de los participantes, los terapeutas y los evaluadores de resultado dieron lugar a un riesgo alto de sesgo en estos ítems para la mayoría de los estudios. Once estudios (52% de los estudios) informaron pérdidas durante el seguimiento de más del 20%. Para otros ítems, la mayoría de los estudios estuvieron en riesgo bajo de sesgo. Rara vez se informaron eventos adversos.
Para todos los estudios que comparaban alguna forma de terapia psicológica con atención habitual o una lista de espera que podría estar incluida en el metanálisis, la terapia psicológica dio lugar a síntomas menos graves al final del tratamiento (DME ‐0,34; intervalo de confianza [IC] del 95%: ‐0,53 a ‐0,16; 10 estudios, 1081 participantes analizados). Este efecto se consideró pequeño a mediano; la heterogeneidad fue moderada y la calidad general de las pruebas fue baja. En comparación con la atención habitual, las terapias psicológicas dieron lugar a una proporción de un 7% mayor de abandonos durante el tratamiento (CR aceptabilidad 0,93; IC del 95%: 0,88 a 0,99; 14 estudios, 1644 participantes, pruebas de calidad moderada). La extracción de un estudio con valor atípico redujo la diferencia a un 5%. Los resultados para el subgrupo de estudios que comparaba la TCC con atención habitual fueron similares a los del grupo completo.
Cinco estudios (624 participantes analizados) evaluaron la gravedad de los síntomas comparando alguna terapia psicológica con atención mejorada, y no encontraron pruebas claras de una diferencia al final del tratamiento (DME agrupadas ‐0,19; IC del 95%: ‐0,43 a 0,04; heterogeneidad considerable; pruebas de baja calidad). Cinco estudios (679 participantes) revelaron que las terapias psicológicas fueron algo menos aceptables en cuanto a los abandonos que la atención mejorada (CR 0,93; IC del 95%: 0,87 a 1,00; pruebas de calidad moderada).
Conclusiones de los autores
Cuando todas las terapias psicológicas incluidas en esta revisión se combinaron fueron superiores a la atención habitual o la lista de espera en cuanto a la reducción de la gravedad de los síntomas, aunque los tamaños del efecto fueron pequeños. Como tratamiento único, sólo la TCC se ha estudiado de forma adecuada para permitir la posibilidad de extraer conclusiones tentativas para la práctica. En comparación con la atención habitual o condiciones en lista de espera, la TCC redujo los síntomas somáticos, con un efecto pequeño y diferencias apreciables en los efectos entre los estudios de la TCC. Los efectos fueron duraderos durante y después del año de seguimiento. En comparación con la atención mejorada o estructurada, las terapias psicológicas en general no fueron más efectivas para la mayoría de los resultados. En comparación con la atención mejorada, la TCC no fue más efectiva. La calidad general de las pruebas que contribuyen a esta revisión fue calificada de baja a moderada.
Los grupos de intervención no informaron ningún daño importante. Sin embargo, debido a que la mayoría de los estudios no describió los eventos adversos como una medida de resultado explícita, este resultado debe interpretarse con cuidado.
Una cuestión importante fue que todos los estudios de esta revisión incluían a participantes dispuestos a recibir tratamiento psicológico. En la práctica diaria, también hay una proporción apreciable de participantes que no está dispuesta a aceptar tratamientos psicológicos para los trastornos somatoformes o los SFSEM. No está claro el tamaño de este grupo y cómo lo anterior influye en la relevancia de la TCC en la práctica clínica.
El número de estudios que investigaron diversas modalidades de tratamiento (diferentes de la TCC) debe ser mayor; lo cual es especialmente relevante a los estudios relacionados con las fisioterapias. Los estudios futuros deben incluir participantes de varios grupos de edad; también deben realizar esfuerzos para cegar a los evaluadores de resultado y para realizar evaluaciones de seguimiento al menos hasta un año después del final del tratamiento.
Resumen en términos sencillos
Terapias de conversación y fisioterapias para los síntomas físicos sin explicación médica: una revisión de la evidencia
¿Quién puede estar interesado en esta revisión?
Pacientes con síntomas físicos no explicados (trastornos somatoformes) y su familia y amigos.
Profesionales que trabajan con pacientes con trastornos somatoformes o que trabajan en los servicios de atención del dolor crónico.
Médicos generales.
¿Por qué es importante esta revisión?
Hasta una de cada tres personas que consultan al médico acerca de síntomas físicos presentan síntomas físicos sin explicación médica (SFSEM) que no tienen ninguna causa clara. Los SFSEM son una característica clave de los problemas de salud denominados trastornos somatoformes. Los SFSEM y los trastornos somatoformes a menudo causan considerable dificultad y dan lugar a que los pacientes pasen mucho tiempo consultando a médicos y profesionales de la salud para tratar de encontrar la causa de los síntomas y el tratamiento correcto.
Las terapias de conversación para los SFSEM se recomiendan para ayudar con los problemas de salud mental que existen junto con los síntomas físicos, y para ayudar a los pacientes a cambiar la forma de pensar acerca de sus síntomas físicos. Las fisioterapias para los SFSEM procuran ayudar a los pacientes a mejorar el funcionamiento físico mediante diversos tipos de ejercicio. Esta revisión procuró examinar las pruebas sobre las terapias de conversación y las fisioterapias para los SFSEM y los trastornos somatoformes.
¿Qué preguntas pretende contestar esta revisión?
¿Cuál es la calidad de la investigación actual sobre las terapias de conversación y las fisioterapias para los SFSEM?
¿Las terapias de conversación son un tratamiento efectivo para los SFSEM en comparación con el tratamiento habitual o la lista de espera?
¿Qué tipos de terapias de conversación son más efectivas?
¿Las fisioterapias son un tratamiento efectivo para los SFSEM?
¿Cuán aceptables son las terapias de conversación y las fisioterapias para los pacientes con SFSEM?
¿Qué estudios se incluyeron en la revisión?
Se utilizaron las bases de datos de búsquedas para encontrar todos los estudios de las terapias de conversación y las fisioterapias para los pacientes con trastornos somatoformes publicados hasta noviembre de 2013. Para estar incluidos en la revisión, los estudios tenían que comparar terapias de conversación o fisioterapias con tratamiento habitual, lista de espera, atención mejorada o estructurada (en la que un médico ofrece citas estructuradas al paciente pero ningún tratamiento específico para los SFSEM), u otra terapia de conversación o fisioterapia. Se incluyeron estudios en adultos a partir de los 18 años de edad con un diagnóstico claro de trastornos somatoformes o problemas principales indicativos de SFSEM.
Se incluyeron 21 estudios en la revisión con 2658 participantes.
¿Qué nos dicen las pruebas de la revisión?
Se calificó la calidad de la investigación actual como de baja a moderada. Catorce de los 21 estudios se centraron en la terapia cognitivo‐conductual, que es una forma específica de terapia de conversación basada en la idea de que los pensamientos y las creencias pueden influir en las emociones y los comportamientos.
La terapia cognitivo‐conductual fue más efectiva que la atención habitual en la reducción de la gravedad de los SFSEM. Para otros tipos de tratamiento, se encontró sólo un par de estudios que proporcionaron pruebas insuficientes para las conclusiones.
La terapia cognitivo‐conductual no fue más efectiva que la atención mejorada proporcionada por el médico.
Ningún estudio de la fisioterapia cumplió con los criterios para estar incluido en la revisión.
Las terapias de conversación fueron aceptables para los pacientes y pocos pacientes abandonaron los ensayos; sin embargo, lo anterior puede no reflejar la práctica clínica real debido a que los participantes en estudio eran pacientes con trastornos somatoformes o SFSEM que estaban dispuestos a probar terapias de conversación. En la práctica clínica, una proporción alta de pacientes puede no estar dispuesta a aceptar estos tratamientos.
¿Qué debe suceder a continuación?
Los revisores sugieren que deben realizarse ensayos de alta calidad futuros para averiguar más acerca de qué grupos de pacientes recibe más beneficios de la terapia cognitivo‐conductual y cómo puede administrarse más eficazmente. También indican que se necesitan más estudios de otras terapias de conversación, y la atención debe centrarse en los estudios de alta calidad de las fisioterapias.
Authors' conclusions
Summary of findings
| Psychological therapy compared with usual care for somatoform disorders and medically unexplained physical symptoms | ||||||
| Patient or population: people with somatoform disorders and medically unexplained physical symptoms | ||||||
| Outcomes | Illustrative comparative risks* (95% CI) | Relative effect | No of participants | Quality of the evidence | Comments | |
| Assumed risk | Corresponding risk | |||||
| Usual care | Psychological therapy | |||||
| Severity of somatic symptoms at end of treatment | The mean severity of somatic symptoms at end of treatment ranged across control groups from | The mean severity of somatic symptoms at end of treatment in the intervention groups was | ‐ | 1081 | ⊕⊕⊝⊝ | A difference of 0.34 SMD was considered to be 'small to medium' |
| Acceptability | 896 per 1000 | 833 per 1000 | RR 0.93 | 1644 | ⊕⊕⊕⊝ | Excluding the outlier (see footnote) (70 participants) reduced I2 statistic from 70% to 33% |
| Dysfunctional cognitions, emotions, or behaviours (participant rated) at end of treatment | The mean dysfunctional cognitions, emotions, or behaviours (participant rated) at end of treatment in the control groups was | The mean dysfunctional cognitions, emotions, or behaviours (participant rated) at end of treatment in the intervention groups was | ‐ | 440 | ⊕⊕⊕⊝ | A difference of 0.11 SMD was considered to be 'small' |
| Treatment response at end of treatment | 157 per 1000 | 517 per 1000 | RR 3.30 | 391 | ⊕⊕⊝⊝ | ‐ |
| Functional disability/quality of life at end of treatment | ‐ | The mean functional disability/quality of life at end of treatment in the intervention groups was | ‐ | 730 | ⊕⊕⊝⊝ | A difference of 0.17 SMD was considered to be small |
| Healthcare use | ‐ | The mean healthcare use in the intervention groups was | ‐ | 532 | ⊕⊕⊕⊝ | Difference small and not statistically significant |
| *The basis for the assumed risk (e.g. the median control group risk across studies) is provided in footnotes. The corresponding risk (and its 95% confidence interval) is based on the assumed risk in the comparison group and the relative effect of the intervention (and its 95% CI). | ||||||
| GRADE Working Group grades of evidence | ||||||
| 1 Measured with different instruments using different scales. | ||||||
| Patient or population: somatoform disorders and medically unexplained physical symptoms | ||||||
| Outcomes | Illustrative comparative risks* (95% CI) | Relative effect | No of participants | Quality of the evidence | Comments | |
| Assumed risk | Corresponding risk | |||||
| Enhanced or structured care | Psychological therapies | |||||
| Severity of somatic symptoms at end of treatment | ‐ | The mean severity of somatic symptoms at end of treatment in the intervention groups was | ‐ | 624 | ⊕⊕⊕⊝ | 95% CI excluded large effect (> 0.5 SMD) |
| Acceptability | 904 per 1000 | 841 per 1000 | RR 0.93 | 679 | ⊕⊕⊕⊝ | ‐ |
| Dysfunctional cognitions, emotions, or behaviours at end of treatment | ‐ | The mean dysfunctional cognitions, emotions, or behaviours at end of treatment in the intervention groups was | ‐ | 499 | ⊕⊕⊕⊝ | 95% CI excluded clinically relevant effect |
| Treatment response at end of treatment | Study population | Not estimable | 0 | See comment | No studies reported on this outcome (see text) | |
| See comment | See comment | |||||
| Moderate | ||||||
| ‐ | ‐ | |||||
| Functional disability/quality of life at end of treatment | ‐ | The mean functional disability/quality of life at end of treatment in the intervention groups was | ‐ | 497 | ⊕⊕⊕⊝ | 95% CI excluded clinically relevant effect |
| Healthcare use within 1 year after treatment | ‐ | The mean healthcare use within 1 year after treatment in the intervention groups was | ‐ | 319 | ⊕⊕⊝⊝ | ‐ |
| *The basis for the assumed risk (e.g. the median control group risk across studies) is provided in footnotes. The corresponding risk (and its 95% confidence interval) is based on the assumed risk in the comparison group and the relative effect of the intervention (and its 95% CI). | ||||||
| GRADE Working Group grades of evidence | ||||||
| 1 Analysis 2.1. 11 No blinding (all studies) and >20% loss to follow up (2 studies) | ||||||
Background
Description of the condition
Medically unexplained physical symptoms (MUPS) are physical symptoms for which adequate evidence of an underlying pathophysiological process cannot be identified after appropriate examination and investigation. MUPS are common in all healthcare settings. Up to one‐third of all people presenting with physical symptoms have MUPS (Kirmayer 2004). The presence of MUPS is the key feature of conditions known as somatoform disorders. The Diagnostic and Statistical Manual of Mental Disorders (DSM; APA 2000) and International Classification of Diseases (ICD; WHO 2004) describe four somatoform diagnostic categories that include MUPS as their main indication. These categories are: somatisation disorder, (persistent somatoform) pain disorder, undifferentiated somatoform disorder, and unspecified somatoform disorder. The ICD also describes a fifth category: somatoform autonomic dysfunction disorder. All these disorders are established through a validated psychiatric diagnostic interview. Many different diagnostic revisions of somatoform disorders have been suggested and used in research since the early 2000s. Examples of proposed revised diagnoses include abridged somatisation disorder (Escobar 1998), multisomatoform disorder (Kroenke 1997), bodily distress disorder (Fink 2007), and complex somatic symptom disorder (Dimsdale 2009). These alternative diagnoses have their own diagnostic criteria, mainly based on symptom counts. Finally, in some fields, MUPS are not described as a feature of a specific disorder, but as a health problem in their own right. As a result, the treatment of MUPS in general is also described in literature, for example, in primary care research. Assessing the presence of MUPS is usually based on the combination of a validated somatic symptom scale, the duration of symptoms, and clinical judgement by the physician.
In some health care settings the term 'somatoform' is falling out of favour, as people can find this term offensive. In these settings the term is being replaced with other terms such as 'functional'.
Somatoform disorders and MUPS may lead to functional impairment, high levels of psychological distress, a reduced quality of life, and a troubled doctor‐patient relationship (Escobar 1987; Gureje 1997; Ring 2004; Zoccolillo 1986). Furthermore, chronic MUPS may lead to absence from work, fragmented and high utilisation of health care, and the associated high costs for society (Konnopka 2012; Kroenke 1989; Smith 1986).
DSM 5 describes the 'somatic symptom disorder' (SSD), which requires explicit cognitive criteria (e.g. excessive and disproportionate thoughts, feelings, and behaviours regarding symptoms) (APA 2013). The diagnosis does not require the somatic symptoms to be medically unexplained.
Description of the intervention
In previous decades, many pharmacological and non‐pharmacological interventions for somatoform disorders and MUPS were developed. The use of antidepressants, in particular, as pharmacological agents for syndromes of MUPS (Ford 2009; Pae 2009), or chronic pain (Saarto 2007), was tested. The most relevant groups of antidepressants are the tricyclic antidepressants, selective serotonin reuptake inhibitors, and selective serotonin and noradrenaline (norepinephrine) reuptake inhibitors. In addition to antidepressants, antiepileptic drugs are also commonly used for somatoform disorders (Moore 2014; Silberstein 2002), although they are not advised in guidelines. Pharmacological interventions will be described in a separate forthcoming Cochrane review (published protocol: Kleinstäuber 2013) and this review only focuses on non‐pharmacological interventions.
Most non‐pharmacological interventions for MUPS focus on addressing cognitions, behaviour, coping styles, and functional consequences of symptoms. These interventions include psychological therapies as well as physical therapies. Psychological therapies are mostly used to tackle underlying psychological disorders and problems, and aim to change the way that people perceive their symptoms in order to help them to manage their symptoms. Cognitive behavioural therapy (CBT) appears to be a promising treatment in this category, if people accept the treatment (Kroenke 2000). Physical therapies usually concern physical activity treatments, which aim to improve physical function by expanding physical activity and thereby reducing symptoms. In the paragraph below, we described examples of several frequently studied forms of psychological and physical therapies.
How the intervention might work
Psychological therapies ‐ cognitive behavioural therapy
The first and most commonly used and investigated psychological therapy for MUPS is CBT, which is based on the cognitive behavioural model (Deary 2007). This model proposes that MUPS are caused by a self perpetuating multi‐factorial cycle, based on the interaction of different factors in several domains, including somatic (physical) aspects, cognitions (thoughts), behaviour, emotions, and environment (Sharpe 1992). This model provides a framework to incorporate people's personal predisposing, precipitating, and perpetuating factors according to their symptoms. CBT, as a consequence, focuses on addressing or changing cognitions and behaviours that people have in interaction with their symptoms.
Reattribution is a specific form of CBT (Goldberg 1989). This method aims to encourage people to reattribute their MUPS to physiological or psychosocial causes rather than to somatic causes. Reattribution consists of three stages: 1. making the person feel understood; 2. changing the agenda of the person, and the doctor, and their mutual agenda during the consultations; and 3. making the link between physical symptoms and psychosocial problems.
This self propagating disadvantageous situation is illustrated by the case of a person with low back pain who moves less freely and more stiffly because of the pain; this, in turn, causes the low back pain to continue and possibly worsen, and creates more stress. Reattribution might focus on making the person realise that stress caused by work may be responsible for causing or perpetuating the low back pain.
Problem‐solving treatment is another form of CBT that has been used for people with MUPS and somatoform disorders. The aim is to reduce complaints associated with unresolved problems in daily life by enhancing a person's problem‐solving capacities in a step‐by‐step manner. This therapy has a positive effect on mental and physical health problems in general (Malouff 2007).
Psychological therapies ‐ behavioural therapy
Behavioural therapy, the second group, aims to constructively change a person's behaviour towards their symptoms using operant conditioning ‐ also known as instrumental conditioning ‐ in which a response in a certain context is followed by a reinforcing stimulus or consequence, thereby increasing the likelihood that the same response will follow in future. Biofeedback therapy is an important behavioural intervention relevant to this review. In this therapy, one or more physiological measures (such as heart rate, respiratory rate, or muscle tension) are thought to relate to the person's physical symptoms, and people are taught to control these measures voluntarily. As a result, they develop a personal strategy for controlling them (Nanke 2003b; Schwartz 2003). Other forms of behavioural therapy include relaxation therapy (Loew 2000), and psycho‐education (Guerney 1971).
Other psychological therapies
A third group of psychological therapies, more aimed at increasing insight, such as:
-
third‐wave cognitive behavioural therapy (i.e. the development of a new attitude towards symptoms, based on self regulation of attention and acceptance) (van Ravensteijn 2013);
-
psychodynamic therapies, a form of depth psychology, which focusses on revealing the unconscious content of a person's psyche in order to alleviate psychological of physical tension (Noyes 2008). This might include group therapy, in which people regularly come together to discuss their symptoms, supervised by a trained group leader. The therapy aims to stimulate an active search for causes and perpetuating factors of symptoms, and to treat them by remedial education aiming at insight;
-
humanistic therapies, focusing on self development, growth, and responsibilities. Treatment aims to help individuals recognise their strengths, creativity, and choices in the 'here and now'. An example is person‐centred therapy, which specifically focusses on an individual's self esteem and values; and
-
integrative therapies, which integrate components from several theoretical schools, e.g. cognitive analytical therapy, which aims to work with the person to identify procedural sequences, chains of events, thoughts and emotions that explain how a target problem (e.g. a physical symptom) is established and maintained, and other psychodynamic therapies (Noyes 2008).
Enhanced care
Another group of therapies offered to people with MUPS is enhanced care. Within these therapies people receive care as usual (mostly by their general practitioners (GP)), enhanced with, for example, participant education, structured counselling moments, a psychiatric interview, or a reattribution training of the doctor (Rosendal 2013). Within these therapies, there is no specific treatment agenda or structure, the aim is to offer the person some tools to assist in the recovery process, stimulating self management. This category of treatment was not mentioned in the protocol for this current review, but added post‐hoc when we found that it had been used as a comparator in several studies.
Physical therapies ‐ physical activity training
Several studies have indicated that mental health, including mood, pain thresholds, and sleep, can be improved by low‐ or moderate‐intensity activity (Weyerer 1994). Graded activity training is an operant‐conditioning behavioural approach in which physical activity is expanded step by step, based on a predetermined time schedule. It focusses on changing the fear‐avoidance behaviour that people with MUPS may have for particular physical activities (Lindström 1992). Supervised aerobic exercise training has beneficial effects on the physical capacity and symptoms of people with fibromyalgia (Busch 2007). A similar effect was found for graded activity training in people with chronic fatigue syndrome (Edmonds 2004;Yancey 2012). In non‐specific low back pain, exercise appeared to be slightly effective at decreasing pain and improving function (Hayden 2005). However, for graded activity the evidence is lacking (Van der Giessen 2012).
Other physical therapies
Other examples of physical therapies for somatoform disorders and MUPS include activation therapy, where physical and behavioural activation is increased in a step‐wise fashion, and running therapy, where running is used therapeutically, mainly to influence the level of stress.
Why it is important to do this review
Although there are several reviews on non‐pharmacological interventions for somatoform disorders and MUPS, a complete overview of the whole spectrum is missing. Some reviews did not include a meta‐analysis (Edwards 2010; Sumathipala 2007), while other reviews included only specific treatment types (Kroenke 2000; Nezu 2001), or applied restrictions on diagnostic types of MUPS or on treatment setting (Allen 2002; Edwards 2010; Kleinstäuber 2011; Rosendal 2013). Furthermore, currently there are no reviews that evaluate variations in treatment effects on the basis of diagnosis and severity of symptoms at baseline, setting, or healthcare provider.
In this review, we aimed to give an overview of the evidence for non‐pharmacological interventions for somatoform disorders and MUPS. This will help healthcare providers and patients to make optimal treatment decisions. In addition, the results of this review will provide insight into gaps in the evidence that merit future research. This review will complement the existing portfolio of four Cochrane reviews covering somatoform disorders (Hoedeman 2010; Ipser 2009; Ruddy 2005; Thompson 2007), and also the Cochrane review on pharmacological interventions for somatoform disorders, which is currently being developed (see Kleinstäuber 2013 for protocol).
Objectives
To assess the effects of non‐pharmacological interventions for somatoform disorders (specifically somatisation disorder, undifferentiated somatoform disorder, somatoform disorder unspecified, somatoform autonomic dysfunction, pain disorder, and alternative somatoform diagnoses proposed in the literature) and MUPS in adults in comparison with treatment as usual, waiting list controls, attention placebo, psychological placebo, enhanced or structured care, and other psychological or physical therapies.
Methods
Criteria for considering studies for this review
Types of studies
We included randomised controlled trials (RCTs) and cluster randomised controlled trials (CRCTs). We also planned to include data from the first phase of cross‐over trials, but we identified no such trials that met our inclusion criteria.
We excluded quasi‐randomised trials (e.g. allocation to the study group by day of the week).
Types of participants
Participant characteristics
Participants had to be at least 18 years old. We applied no maximum age, as the condition can be present at any age. We placed no restriction on gender or culture.
Diagnosis
-
Participants had to meet the criteria for a somatoform disorder according to DSM III (APA 1980), DSM IV‐TR (APA 2000), ICD‐9 (WHO 1975), or ICD‐10 (WHO 2004), or the criteria for one of the alternative somatoform diagnoses proposed in the literature. The primary diagnosis (a somatoform disorder) had to be made on the basis of a structured clinical interview such as the Structured Clinical Interview for Mental Disorders (SCID; First 2002; Spitzer 1990), the World Health Organization (WHO) Composite International Diagnostic Interview (CIDI; WHO 1990), the MINI International Neuropsychiatric Interview Plus (Mini‐Plus; Sheehan 1998), or diagnostic checklists such as the International Diagnostic Checklists (IDCL; Janca 1996). The secondary diagnosis of an alternative somatoform diagnosis needed to be based on the criteria that characterise that specific disorder, for example, abridged somatisation disorder needed to be established through use of the Somatic Symptom Index (SSI; Escobar 1998).
-
Participants were characterised with MUPS as their primary problem, on the basis of a validated scale for the assessment of MUPS, such as the Screening for Somatoform Disorders (Screening für Somatoforme Störungen) (SOMS; Rief 1997), the Bradford Somatic Inventory (Mumford 1991), or component subscales of validated standardised instruments for the assessment of general psychopathology or general health status, such as the Patient Health Questionnaire‐15 (PHQ‐15; Kroenke 2002), the subscale 'Somatisation' of the Four Dimensional Symptom Questionnaire (4DSQ; Terluin 2006), the subscale 'Somatisation' of the Symptom Checklist‐90‐R (SCL‐90R; Derogatis 1986), or the Brief Symptom Inventory (BSI; Derogatis 1983).
As the subdivision of these two diagnostic concepts (somatoform disorders and MUPS) is based on differences in selection methods used in different research settings rather than on differences between individual people, it is possible that the nature and severity of symptoms may show a certain overlap between the two groups.
We disregarded the DSM‐5 criteria for somatoform disorders for this version of the review. In the DSM‐5, one category, the SSD, replaced the four diagnostic categories of the somatoform disorders (APA 2013). This disorder was diagnosed on the basis of explicit psychological criteria (e.g. excessive and disproportionate thoughts, feelings, and behaviours regarding symptoms), and diagnosis did not require the somatic symptoms to be medically unexplained. However, as the publication of the DSM‐5 was recent, there are currently no instruments available to establish the diagnosis. As a result, to our knowledge, no trials have been performed that use these criteria. We will add the SSD diagnosis to the list of conditions in future updates of the review, if more information about diagnostic instruments becomes available and once studies that use these criteria have been performed.
See Table 1 for an overview of all diagnostic categories of somatoform disorders and MUPS, and a clear indication of whether or not they were eligible for the current review.
| Eligible for this review? | |||
| DSM‐IV | ICD‐10 | YES | NO |
| Somatisation disorder | Somatisation disorder | x | ‐ |
| Undifferentiated somatoform disorder (duration > 6 months) | Undifferentiated somatoform disorder (duration > 6 months) | x | ‐ |
| ‐ | Somatoform autonomic dysfunction | x | ‐ |
| Pain disorder | Persistent somatoform pain disorder | x | ‐ |
| Somatoform disorders, unspecified | Somatoform disorders unspecified | x | ‐ |
| Hypochondriasis | Hypochondriacal disorder | ‐ | x |
| ‐ | Other somatoform disorders | ‐ | x |
| Body dysmorphic disorder | Body dysmorphic disorder | ‐ | x |
| Conversion disorder | Dissociative and conversion disorders | ‐ | x |
| YES | NO | ||
| Alternative somatoform diagnoses (such as abridged somatisation disorder or multisomatoform disorder) | x | ‐ | |
| Chronic MUPS (duration ≥ 6 months) | x | ‐ | |
| Functional somatic syndromes | ‐ | x | |
| Specific functional somatic symptoms | ‐ | x | |
DSM: Diagnostic and Statistical Manual of Mental Disorders; ICD: International Classification of Diseases.
Co‐morbidities
As we aimed to summarise interventions for multiple symptoms, we excluded studies that examined participants diagnosed with only one specific functional syndrome or symptom (e.g. fibromyalgia or fatigue). Moreover, existing Cochrane reviews address specific syndromes and complaints (Bernardy 2013; Price 2008; Zijdenbos 2009).
Setting
We place no restrictions on the type of setting.
Subsets of participants
Some studies could include 'eligible' participants as well as 'ineligible' participants for this review, for example when an age cut‐off was used that was different to the cut‐off of this review. When no detailed information was available about these subsets of participants, we requested the data from the trial authors. If this did not yield any further information, we included the study only if at least 80% of the sample population had the characteristic of interest (e.g. aged 18 years or over). The Characteristics of included studies and Characteristics of excluded studies tables document the decisions about the eligibility of these subsets of participants. We assessed the impact of these decisions using sensitivity analysis.
Types of interventions
Experimental interventions
Eligible studies included one or more of the following experimental interventions.
-
Psychological therapies:
-
-
CBT (e.g. reattribution therapy and problem‐solving therapy);
-
behavioural therapy (e.g. classical CBT, biofeedback therapy, relaxation therapy, and psycho‐education);
-
third‐wave CBT (e.g. mindfulness);
-
psychodynamic therapies (e.g. group therapy);
-
humanistic therapies (e.g. person‐centred therapy);
-
integrative therapies (e.g. cognitive analytical therapy).
-
-
-
Physical therapies:
-
-
physical activity training (e.g. graded activity training);
-
other physical therapies (e.g. activation therapy or running therapy).
-
-
We excluded interventions based on complementary medicine from this review. In addition, pharmacological interventions and consultation letter interventions were beyond the scope of this review; they were evaluated in other Cochrane reviews (Hoedeman 2010; Kleinstäuber 2013).
However, in several of the studies, in both study arms a consultation letter was sent to the primary care physician after baseline assessment, in addition to the planned psychological therapy or comparison condition. Post‐hoc, we decided that this was not a reason for exclusion, and we categorised these studies according to the main comparison (We conducted a sensitivity analysis to explore this decision).
Comparator interventions
We accepted the following comparator interventions.
-
Normal/usual treatment (e.g. treatment according to (multidisciplinary) guidelines or common practice in primary or secondary care) or waiting list procedures.
-
Attention or psychological placebo (an attention placebo was regarded as being inactive by both participants and researchers in a trial, while a psychological placebo was regarded as active by participants but inactive by researchers).
-
Enhanced or structured care (e.g. care as usual by physician trained in reattribution, or structured appointments with a physician without a specific treatment being performed). This comparator was not foreseen at the protocol stage, but added afterwards (see Differences between protocol and review).
-
Other psychological therapies (as per the list of experimental interventions above).
-
Other physical therapies (as per the list of experimental interventions above).
Types of outcome measures
We included studies that met the inclusion criteria described above regardless of whether they reported on the following outcomes.
Primary outcomes
(Outcomes marked with an asterisk were included in the 'Summary of findings' tables).
1. Severity/intensity of somatic symptoms*
If a validated self report scale was used for symptom severity, we extracted the results for this instrument for the meta‐analysis. Validated scales for the assessment of MUPS considered for this review were already described in Criteria for considering studies for this review above. Where multiple visual analogue self report scales or unvalidated scales were used, the first two review authors (NvD, MdB) decided which scale most closely approximates MUPS. This was supervised by two other review authors (HvdH, BT), who were experts on somatoform disorders, MUPS, and clinical diagnostics, but who were not directly involved in the process of study selection or data extraction and management, so that they were blinded to the results. We examined clinician‐rated severity of MUPS separately and it was not combined with self report outcomes into one effect‐size index.
2. Acceptability*
We measured acceptability by the complement of the proportion of trial participants who dropped out during the trial from either the experimental or the comparator intervention.
Secondary outcomes
3. Depression and anxiety
We distinguished between validated clinician‐rated instruments (e.g. the Hamilton Depression Rating Scale (HDRS) (Hamilton 1960), the Hamilton Anxiety Rating Scale (HARS) (Hamilton 1959)), and participant self report instruments (e.g. BDI (Beck 1961), and the Beck Anxiety Inventory (BAI) (Beck 1988)).
4. Dysfunctional cognitions, emotions, or behaviours (participant‐rated)*
We measured dysfunctional cognitions, emotions, or behaviours by validated self report scales (e.g. the Whitely Index (WI) (Pilowsky 1967), Illness Attitude Scales (IAS) (Kellner 1986), and the Scale for the Assessment of Illness Behavior (SAIB (Rief 2003)).
5. Adverse events
We expected that the frequency of adverse events of non‐pharmacological interventions would be low, but not absent. Forms of psychotherapy may lead to psychological decompensation, while an intervention such as running therapy may lead to certain injuries. When possible, we described the most common adverse effects for the included studies narratively (defined as effects that occur in at least 10% of participants receiving the specific therapy), as well as significant differences in the rate of occurrence of adverse events between intervention and control groups. However, it must be noted that RCTs and CRCTs are not the optimal study design for obtaining information about rare or long‐term adverse outcomes, limiting our interpretation of adverse effect data.
6. Treatment response (responder versus non‐responder)*
We measured treatment response using the clinician‐rated Clinical Global Impression Scale (CGI) ‐ Improvement item (Guy 1976); this scale defined responders as those with a score of "1 = very much improved" or "2 = much improved". Alternatively, we used the number of participants who responded to the treatment according to the author's definition. We calculated response rates out of the total number of randomised participants.
7. Functional disability and quality of life*
We assessed functional disability and quality of life through validated clinician‐rated scales (e.g. the Global Assessment of Functioning (GAF) (Hall 1995)) or validated self report instruments (e.g. the 36‐item Short Form Questionnaire (SF‐36) (Ware 1992); or the Sheehan Disability Scale (SDS) (Sheehan 1983)).
8. Healthcare use*
We assessed healthcare use as measured by direct measurements (e.g. consultation counts), or through participant‐rated measurements (e.g. healthcare use diary or Trimbos/iMTA questionnaire for Costs associated with Psychiatric Illness (TiC‐P; Hakkaart‐van Roijen 2002).
Hierarchy of outcome measures
If there were multiple instruments measuring the same outcome, we preferred whichever instrument was most commonly used from those listed above. Several studies used both the Physical Component Scale (PCS) and the Mental Component Scale (MCS) of the SF‐36, and sometimes also the subdomains. In these cases, we restricted ourselves to the main domains and combined PCS and MCS into one outcome.
Timing of outcome assessment
We analysed primary and secondary outcomes at the following time points, if available:
-
immediately post treatment;
-
within 12 months after treatment ending; and
-
more than 12 months after treatment ended.
Search methods for identification of studies
Electronic searches
The Cochrane Depression, Anxiety and Neurosis Review Group's Specialized Register (CCDANCTR)
The Cochrane Depression, Anxiety and Neurosis Group (CCDAN) maintains two clinical trials registers at the editorial base in Bristol, UK: a references register and a studies‐based register. The CCDANCTR‐References Register contains over 36,000 reports of RCTs in depression, anxiety and neurosis. Approximately 60% of these references have been tagged to individual, coded trials. The coded trials are held in the CCDANCTR‐Studies Register and records are linked between the two registers through the use of unique Study ID tags. Coding of trials is based on the EU‐Psi coding manual, using a controlled vocabulary. Reports of trials for inclusion in the Group's registers are collated from routine (weekly), generic searches of MEDLINE (1950 to date), EMBASE (1974 to date), and PsycINFO (1967 to date); quarterly searches of the Cochrane Central Register of Controlled Trials (CENTRAL), and review‐specific searches of additional databases. Reports of trials are also sourced from international trials registers c/o the WHO trials portal (the International Clinical Trials Registry Platform (ICTRP)), pharmaceutical companies, and handsearching of key journals, conference proceedings, and other (non‐Cochrane) systematic reviews and meta‐analyses.
Details of CCDAN's generic search strategies (used to identify RCTs) can be found on the Group's website.
1. We searched the CCDANCTR (Studies and References Registers) on 29 November 2013 using the following free‐text terms: (somatization or somatisation or somatoform or hysteri* or briquet or polysymptom* or multisomatoform or somatizer* or (somatic NEAR symptom*) or (MUPS or “medical* unexplained” or "unexplained medical*" or (unexplained NEAR (symptom* or syndrom*)) or "frequent attend*" or (multiple NEAR (“physical symptom*” or “symptom diagnos*”)) OR neurastheni*)
We screened the records retrieved manually for non‐pharmacological interventions.
2. We conducted complementary searches on the following bibliographic databases using relevant subject headings (controlled vocabularies) and search syntax, appropriate to each resource:
-
Cochrane Central Register of Controlled Trials (CENTRAL) (all years) (Appendix 1);
-
Web of Science (from 1945 onwards, cited references search only (April 2014)).
3. To identify ongoing trials, we searched the ClinicalTrials.gov register (clinicaltrials.gov/), the Current Controlled Trials metaRegister of Controlled Trials ‐ active registers (mRCT; www.controlled‐trials.com/mrct/), and the WHO International Clinical Trials Registry Platform Search Portal (www.who.int/trialsearch).
We applied no restrictions regarding date, language, or publication status to the searches. We will revise the search strategies for future updates, as these will include studies that use DSM‐5 criteria.
Searching other resources
Grey literature
We searched the ProQuest Dissertation & Theses Database (www.proquest.com), National Guideline Clearing House (guideline.gov/) and Open Grey (www.opengrey.eu/) for grey literature.
Handsearching
We searched the conference proceedings for the following associations from 2009 if available (for titles not already indexed in EMBASE or PsycINFO, or already handsearched within The Cochrane Collaboration).
-
Annual meeting of the American Psychiatric Association (APA);
-
International Congress of Behavioral Medicine (ICBM);
-
European Conference on Psychosomatic Research (ECPR);
-
Annual Meeting of the European Association for Consultation‐Liaison Psychiatry and Psychosomatics (EACLPP);
-
Annual congress of the Dutch Network on Unexplained Physical Symptoms (NOLK).
Reference lists
We checked the reference lists of all included studies and relevant systematic reviews to identify additional studies that might have been missed from the original electronic searches (e.g. references that were unpublished or in press). We also conducted a cited reference search on the Web of Science (15 April 2014) for citations to primary reports of included studies.
Correspondence
We contacted researchers and subject experts for information on unpublished or ongoing studies or to request additional trial data.
Data collection and analysis
Selection of studies
In the first step, two review authors (NvD, MdB) independently screened the titles and abstracts of reports identified from the literature search. We discarded studies that obviously did not fulfil the inclusion criteria at this stage of the screening process. Two review authors (NvD, MdB) retrieved eligible or potentially eligible articles for full‐text assessment. We identified and excluded duplicate records and we collated multiple reports that related to the same study so that each study ‐ rather than each report ‐ was the unit of interest in the review. After full‐text assessment, the review authors identified studies for inclusion and exclusion. We recorded reasons for exclusion of studies, and resolved disagreements by consensus ‐ if necessary with the involvement of a third review author (JvdW). We listed studies for which additional information was required in order to determine their suitability for inclusion in the review as 'Studies awaiting assessment'. We recorded the selection process in sufficient detail to complete a PRISMA flow diagram (Moher 2009), and Characteristics of included studies and Characteristics of excluded studies tables.
Data extraction and management
We used a data collection form, piloted on one study in the review, to extract study characteristics and outcome data. Independently, four review authors (NvD, MdB, HvdW, HvM) extracted study characteristics and outcome data from included studies. If necessary, we contacted the authors of trial reports for clarification or for additional information. We organised data using the most recent version of Review Manager 5 software (RevMan 2012). We negotiated disagreements with another review author. We extracted data on the following study characteristics.
-
Trial characteristics: first author, publication year, status of publication, language of publication.
-
Details of methodology: study design, study setting, total duration of study, details of any 'run‐in' period, number of study centres and location, withdrawals, lost to follow‐ups.
-
Participants' characteristics: source of sample, size of sample, mean age, age range, gender, severity and duration of MUPS at baseline, diagnostic criteria, inclusion and exclusion criteria, selection instrument (e.g. interview), presence of a somatoform diagnosis, co‐morbidity, and previous treatments for MUPS.
-
Intervention characteristics: intervention, category of non‐pharmacological intervention, healthcare provider performing the intervention, intervention frequency and duration, comparison, concomitant MUPS‐related interventions (e.g. pharmacotherapy) and number of drop‐outs due to adverse effects or inefficacy of treatment.
-
Outcome measures: primary and secondary outcome measures (as specified in Primary outcomes; Secondary outcomes), summary statistics of continuous data (mean, standard deviation (SD)) and dichotomous data (number of responders), timing of outcome assessments, intention‐to‐treat (ITT) analysis (with last observation carried forward (LOCF)) or observed cases/completer analysis and other methods of estimating the outcome for participants who dropped out (e.g. mixed‐effect analyses).
-
Notes: source of funding for trial and any notable conflicts of interest for trial authors.
We noted in the Characteristics of included studies table whether outcome data were reported in a usable way. We resolved disagreements by consensus. Two review author (NvD, HvdW) entered data into Review Manager 5 for analysis (RevMan 2012). We double‐checked that data had been entered correctly by comparing the data presented in the systematic review with the data in the study reports. A third review author (MdB) spot‐checked study characteristics for accuracy against the trial reports.
Main comparisons
We aimed to stratify comparisons according to treatment classes as described in Types of interventions when the available data allowed. For physical therapies, we planned to perform a specific analysis for physical activity training, all other therapies would be combined into one group. We planned the following main comparisons for each class of non‐pharmacological treatment.
-
Treatment versus care as usual or waiting list procedures.
-
Treatment versus attention or psychological placebo.
-
Treatment versus another non‐pharmacological treatment.
After inclusion of eligible articles, we concluded that all studies addressed some form of psychological therapy; no studies addressed 'treatment versus attention or psychological placebo'; and no studies addressed any form of physical therapy. In addition, as mentioned above (How the intervention might work), we found several studies comparing a psychological therapy to a form of enhanced or structured care. As a result of these findings, we decided to add the comparison 'psychological therapy versus enhanced care'. So the final categorisation of comparisons was as follows:
-
psychological therapy versus usual care (or waiting list procedures);
-
psychological therapy versus enhanced (or structured) care;
-
psychological therapy versus another psychological therapy.
If in future updates of this review we find new studies not fitting into this categorisation (e.g. comparing some physical therapy with psychological therapy), we will update the categorisations.
Assessment of risk of bias in included studies
Independently, two review authors (NvD, MdB) assessed the risk of bias for each study using the criteria outlined in the Cochrane Handbook for Systematic Reviews of Interventions (Higgins 2011). We resolved any disagreements by discussion or by involving another review author (HvM, HvdW). We assessed the risk of bias for the following domains.
-
Random sequence generation: was the method used to generate the sequence of randomised allocation adequate for the production of comparable groups?
-
Allocation concealment: was the allocation adequately concealed so that intervention allocations could not have been foreseen in advance of, or during, enrolment?
-
Blinding:
-
was knowledge of the allocation of treatment by the participants and study personnel adequately prevented during the study?
-
was knowledge of the allocation of treatment by the outcome assessor(s) adequately prevented during the study?
-
-
Incomplete outcome data: were incomplete outcome data adequately addressed? Was the completeness of outcome data described, including attrition and exclusions from analyses? If there were attritions and exclusions in the treatment and control groups, they were reported, along with the underlying reasons? We also reported whether the review authors conducted any re‐inclusions in their analyses.
-
Selective outcome reporting: were reports of the study free of suggestion of selective outcome reporting?
-
Other sources of bias: was the study apparently free of other sources that could produce risk of bias?
-
Treatment fidelity: were therapies based on protocols or manuals? Were therapy sessions adequately monitored to assess whether they adhered to treatment protocols and manuals?
-
Researcher allegiance: could researchers be expected to have a preference for one of the treatment modalities?
-
Therapist qualifications: were the therapists qualified to perform the interventions?
In order to assess risk of bias in the following specific types of study design, we made additional judgements.
-
Multiple‐intervention studies: were data presented for each of the groups to which participants were randomised?
-
Cross‐over trials:
-
was it clear that the order of receiving a treatment was randomised?
-
were unbiased data from the first treatment period available?
-
-
CRCTs:
-
were individuals recruited to the trial after the clusters had been randomised?
-
were methods of stratified or pair‐matched randomisations of clusters used?
-
were adequate statistical analyses (taking clustering into account) used?
-
We judged each potential source of bias as to be of high, low, or unclear risk and provided a supporting quotation from the study as justification for our judgement in the 'Risk of bias' table. We summarised the risk of bias judgements across different studies for each of the domains by means of a 'Risk of bias' figure. Where information on risk of bias related to unpublished data or correspondence with researchers, we noted this in the 'Risk of bias' table. When considering treatment effects, we took into account the risk of bias for the studies that contributed to each outcome.
Measures of treatment effect
Dichotomous data
For dichotomous outcomes, we used risk ratio (RR) as the summary statistic, together with 95% confidence intervals (CI). If relevant, we calculated the number needed to treat for an additional beneficial outcome (NNTB) for every class of non‐pharmacological treatment for which we found a statistically significant treatment effect. We used the RR estimate and the control risk from the pooled control groups for this calculation.
Continuous data
As different measures were used to assess the same outcome, we pooled data using the standardised mean difference (SMD); we calculated 95% CI. Specific attention was paid to the secondary outcome 'functional disability and quality of life', as the direction of scales for these outcomes can differ. An increase on a scale of functional disability usually indicates deterioration, while an increase on a scale for quality of life often indicates improvement. We ensured that it was appropriate to pool the data (e.g. different instruments measuring the same underlying concept). Using the SMD does not correct for such differences in the direction of scales. In this case, we multiplied the mean values from the smaller set of studies by ‐1 to ensure that all the scales pointed in the same direction.
Unit of analysis issues
Cluster‐randomised controlled trials
In order to avoid unit‐of‐analysis errors for trials in which incorrect statistical analyses were conducted, we performed approximate analyses for continuous outcomes based on inflating standard errors. Before we entered data into Review Manager 5 for meta‐analytic calculations (RevMan 2012), we multiplied the standard error of the effect estimate (from an analysis that did not take clustering into account) by the square root of the design effect. The design effect was 1+ ((M‐1)* ICC), where M was the mean cluster size and ICC was the intracluster correlation coefficient. We assumed a common design effect across intervention groups. If the ICC was not available in the published report, we used an external estimate (0.03) obtained from Campbell 2005. We meta‐analysed these inflated variances using Review Manager 5 (RevMan 2012), and the generic inverse‐variance method. For dichotomous data, we divided both the number of events and the group sizes by the design effect (Higgins 2011, Chapter 16.3).
Studies with multiple treatment groups
In trials with more than two relevant non‐pharmacological treatment arms, we managed data as follows.
If the different experimental treatments were of the same class of treatments (e.g. psychotherapy), we summarised them into a single group and compared it with the control group. For continuous data, we pooled means and SDs across all of the treatment arms as a function of the number of participants in each arm (Higgins 2011, Table 7.7.a). For dichotomous outcomes, we summed both the sample sizes and the numbers of participants with events across groups.
If the different treatments were of different classes (e.g. a form of psychotherapy versus a physical activity intervention), we included each pair‐wise comparison separately, but divided the 'shared control‐group' into two or more smaller groups (according to the number of intervention groups). For dichotomous outcomes, we divided both the number of events and the total number of participants over these groups. For continuous outcomes, we divided only the total number of participants over these groups and left the means and SDs unchanged. Although this method only partially overcomes the unit‐of‐analysis error, the advantage of this approach is that it permits investigation of heterogeneity across intervention arms.
Cross‐over trials
We found no cross‐over trials. For future updates of our review, we will only include cross‐over trials for meta‐analysis if relevant data are available, or can be obtained, from the first treatment period for both the treatment and control group(s).
Dealing with missing data
We attempted to contact trial authors in order to verify key study characteristics and obtain outcome data that were not reported in the articles. When we could not retrieve missing data, we managed the data as follows.
Dichotomous data
We managed missing dichotomous data through ITT analysis, in which we assumed that participants who dropped out after randomisation had a negative outcome. We conducted sensitivity analyses for dichotomous data according to Gamble and Hollis (Gamble 2005): we calculated best‐case/worst‐case scenarios for the clinical response outcome, in which we assumed, for the best‐case scenario, that drop‐outs in the active treatment group had positive outcomes and those in the control group had negative outcomes; and, for the worst‐case scenario, that drop‐outs in the active treatment group had negative outcomes and those in the control group had positive outcomes. This method provided boundaries for the observed treatment effect.
Continuous data
Where continuous data were missing, we performed analysis on an endpoint basis, including only participants with a final assessment, or by using LOCF to the final assessment where reported by the trial authors. If necessary, we performed sensitivity analyses where we compared outcomes with the observed case data versus the LOCF data. When using LOCF data, we used the baseline SD as a more conservative approach. If SDs were missing, we calculated them from t‐, F‐, P, or CI values (Higgins 2011), or standard errors (Altman 1996).
Assessment of heterogeneity
We assessed the groups for clinical similarities including elements such as age, gender, and setting.
First, we assessed statistical heterogeneity visually by inspecting forest plots of standardised mean effect sizes and of relative risks. We used the I2 statistic as a second test: I2 describes the percentage of variability in effect estimates that is due to heterogeneity rather than chance.
We used conventions of interpretation defined by Higgins (Higgins 2011). In the case of substantial levels (i.e. where I2 = 50% to 90%) and considerable levels (I2 = 75% to 100%) of heterogeneity, we explored data further by means of subgroup and sensitivity analyses (see below). However, these were not clear‐cut criteria, as the importance of the observed I2 also depends on the magnitude and direction of treatment effects and the strength of evidence for heterogeneity (Deeks 2008; Higgins 2003); for example: if the I2 value fell slightly below 50% (e.g. 45%) and the direction and magnitude of treatment effects suggested important heterogeneity, we investigated the data further.
Assessment of reporting biases
We created funnel plots (treatment effect versus standard error of the effect size), if we included at least 10 trials in a meta‐analysis, according to the recommendations of the Cochrane Handbook for Systematic Reviews of Interventions (Higgins 2011; Sterne 2011). When analysing and interpreting a funnel plot, we considered all potential reasons for asymmetry, not just publication bias (e.g. differences in methodological quality, true heterogeneity in intervention effects).
Data synthesis
If we found two or more included studies in a comparison category (see Data extraction and management) that used the same outcome construct, we performed a meta‐analysis of the results. Two authors (NvD, JvdW) entered data into Review Manager 5 software (RevMan 2012). We expected to find high heterogeneity in non‐pharmacological therapy approaches and in symptom severity, duration of symptoms and co‐morbidities among the various study populations. Therefore, we analysed dichotomous and continuous treatment effects using a random‐effects model. For studies of which data could not be combined, we summarised the results narratively.
Subgroup analysis and investigation of heterogeneity
If analysis of heterogeneity indicated significant heterogeneity, we performed subgroup analysis in order to explore whether methodological and clinical differences between the trials had produced systematic differences observed in the treatment outcomes. If we found statistically significant differences between subgroups, we reported the results of the corresponding subgroup meta‐analysis. If subgroup analysis provided no explanation for heterogeneity, we did not report the results of meta‐analysis.
When available data allowed (at least 10 studies), we performed subgroup analyses based on the following factors (only for the primary outcomes).
-
Severity, based on symptom count, and duration of MUPS at baseline.
-
Diagnosis at baseline.
-
Somatoform disorders versus alternative somatoform diagnoses versus MUPS.
-
Psychiatric and somatic co‐morbidity: as known from various mental disorders, co‐morbid psychological and somatic problems can modify the efficacy of an intervention. Therefore, we compared the effects of non‐pharmacological interventions for people with somatoform disorders or MUPS with or without co‐morbid mental or somatic disorders.
-
Primary care versus secondary care and tertiary care, including healthcare provider performing the intervention.
-
Treatment as usual versus a waiting list procedure as a control intervention.
Sensitivity analysis
We planned sensitivity analyses to evaluate the robustness of the conclusions in conjunction with decisions made during the review process. Sensitivity analyses would inform that the results of the review did not depend on specific decisions that were made during the review process. In case of sufficient data (i.e. at least 10 studies), we planned these analyses to examine the effects of the following options, restricted to the primary outcome.
-
Exclusion of CRCTs.
-
Exclusion of studies with unclear allocation concealment, or only a subset of relevant participants.
-
Exclusion of studies with unclear methods of sequence generation.
-
Exclusion of trials where missing data have been imputed.
-
Exclusion of studies with a drop‐out rate higher than 20%.
'Summary of findings' tables
We added 'Summary of main results' tables for the two main comparisons to create a structured overview of the main review results for the two subgroup comparisons with the largest number of studies: CBT versus usual care and CBT versus enhanced care. The table only includes information about the outcome measures marked with an asterisk (see Primary outcomes; Secondary outcomes), as these were considered the most important for the current review. For the same reason, the selected time point was end of therapy, except for healthcare use, where we thought the period within one year after end of treatment was more meaningful. For dichotomous outcomes (acceptability, treatment response), we reported an assumed and corresponding absolute risk with 95% CI as well as a relative risk ‐ corresponding to the RR with 95% CI obtained from meta‐analysis. For continuous outcomes, in the column of assumed and corresponding risk, we presented a difference in means or SMD with 95% CI. We used footnotes in order to specify the source or rationale for each assumed and corresponding risk. In order to assess the quality of body of evidence for each outcome, we used the GRADE approach (GRADEpro software; Schünemann 2008), classifying the quality of evidence for each study as 'high', 'moderate', 'low', or 'very low'. We explained judgements other than 'high' quality in footnotes or the Comments column in the 'Summary of main results' table.
Results
Description of studies
Results of the search
Searches were conducted up to November 2013 (CCDAN registers) and April 2014 (cited reference searches). Figure 1 shows the PRISMA flow diagram of the study selection.
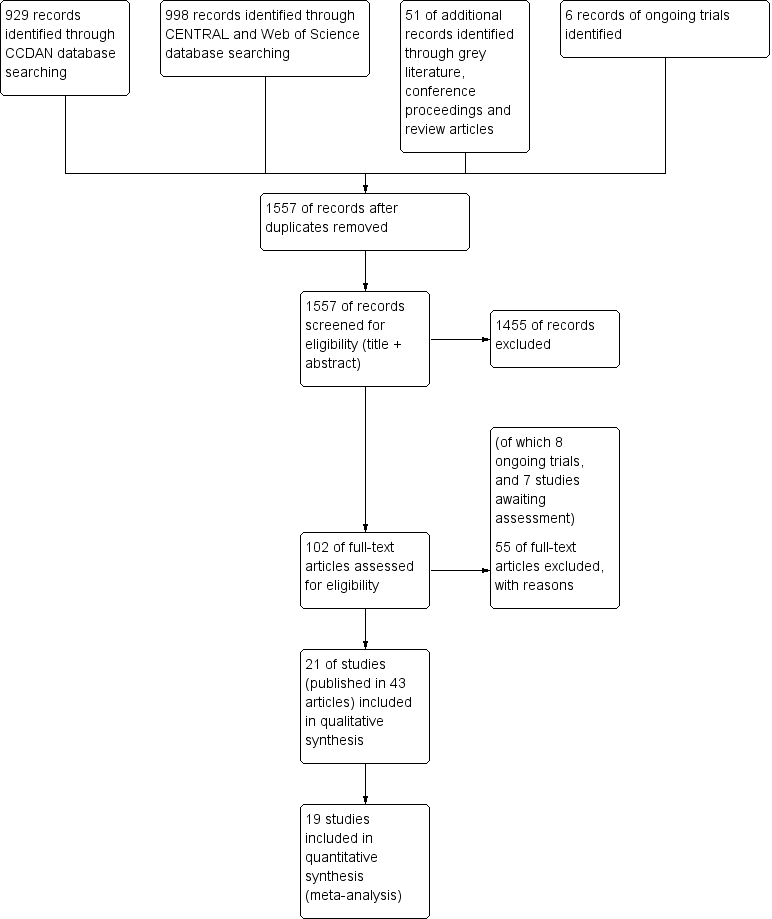
6 Study flow diagram.
Literature database searches
In the search of the CDANCTR‐Studies and CCDANCTR‐Reference Register (from now on referred to as CCDAN database), we found 929 abstracts after de‐duplication. We excluded 842 records, based on the title and abstract, leaving 82 references (65 studies) selected for full‐text retrieval. After reading the full‐text, we judged 27 studies (49 articles) eligible for inclusion in this review. We excluded 35 studies (38 articles) and six articles are still awaiting assessment, for example, due to unavailability of a full‐text article or difficulties in contacting authors.
The search of CENTRAL database found 995 records. After removing duplicates from the CCDAN search, there were 568 new references. After title and abstract screening, we excluded 560 references, and selected eight articles for full‐text reading. After full‐text reading, we excluded five articles, and judged three articles eligible for inclusion; however, all three articles described studies already included in the review (e.g. long‐term follow‐up results) (Gili 2014; Schröder 2013; Zonneveld 2012). As the Schröder article reported a more detailed trial methodology and higher number of participants, we decided to use this article as the main reference of this study (Schröder 2013) instead of Zaby 2008, which was retrieved from the CCDAN search.
We performed a cited reference search on the Web of Science, for citations to primary reports of all studies expected to be included in this review. When handsearching the retrieved articles, we identified three additional relevant references. After full‐text reading, we included one new study (Burton 2012), and excluded one article due to randomisation method (Rembold 2011). One article (Chernyak 2014) described an already included study (Sattel 2012).
Grey literature
We performed searches for grey literature in the databases of www.guideline.gov (36 results), www.opengrey.eu (eight results), and www.proquest.com (no results). We found no new articles. We screened the conference proceedings of the International Congress of Behavioral Medicine (ICBM, 2010 and 2012), the Annual Meeting of the European Association for Consultation‐Liaison Psychiatry and Psychosomatics and the European Conference on Psychosomatic Research (EACLPP/ECPR, 2009, 2010, 2011, 2012), the Annual Meeting of the American Psychiatric Association (APA, abstracts and syllabus of 2009‐2013), and the Annual congress of the Dutch Network on Unexplained Physical Symptoms (NOLK, 2013) and found no new articles.
Systematic reviews
We found 14 reviews about (specific) non‐pharmacological interventions for somatoform disorders or MUPS. After title screening in the reference lists of the reviews, we selected seven additional articles for screening of abstract. After abstract reading, we excluded four articles, and selected three articles for full‐text reading. However, none of these three articles were eligible due to lack of randomisation or inappropriate selection method (Hellmann 1990; Lupke 1996; Tschuschke 2007).
Trial registers
We performed ongoing trial searches in the databases of www.clinicaltrials.gov, www.controlled‐trials.com, and www.who.int/trialsearch. We found six potentially eligible ongoing trials. As full details of the design and study results were not available, we could not included these studies in the review (see Characteristics of ongoing studies table).
Contacting authors
We tried to contact 10 trial authors for missing information regarding the eligibility of studies; four responded and provided the desired information (Lidbeck 1997; Gottschalk 2011; Pols 2008; Steel 2011). The other six trials are listed in the Studies awaiting classification table.
We contacted authors of 20 of the included studies for additional information regarding study design and outcomes, of which 10 provided requested data.
Included studies
We included 21 studies, reported in 43 publications, in this review (see Characteristics of included studies table). All included studies concerned psychological interventions.
Design
Twenty of the included 21 studies had a parallel‐group, individually randomised design (RCT). One study had a cluster‐randomised design (Schaefert 2013). We found not trials with a cross‐over design.
Sample size
The total number of randomised participants was 2658, a mean number of 127 per study (range 32 to 328). Two studies included fewer than 25 participants per arm (Burton 2012; Katsamanis 2011). Most studies reported 25 to 75 participants per arm. Three studies included 75 to 100 participants per arm (Escobar 2007; Schilte 2001; Sumathipala 2008), and two studies included more than 100 participants per arm (Sattel 2012; Schaefert 2013). The largest study was Schaefert 2013, with 328 randomised participants.
Setting
Eight studies recruited participants in primary care only (Burton 2012; Escobar 2007; Moreno 2013; Schaefert 2013; Schilte 2001; Sumathipala 2000; Sumathipala 2008; Van Ravesteijn 2013). Only two studies recruited in secondary care (e.g. outpatient clinics) (Sattel 2012;Speckens 1995), and one study recruited inpatients in hospitals (Schweickhardt 2007). Seven studies recruited via medical settings as well as the open population (e.g. through advertisements) (Allen 2006; Kashner 1995; Katsamanis 2011; Kolk 2004; Martin 2007; Schröder 2013; Zonneveld 2012). Three studies recruited via primary care as well as secondary care (Fjorback 2013; Lidbeck 1997; Schröder 2012).
In one study, treatment was performed in group sessions by GPs in primary care who were trained in the specific psychological technique, combined with a psychosomatic specialist (Schaefert 2013). In six other studies, treatment took place at a department of psychiatry or psychology (Allen 2006; Escobar 2007; Fjorback 2013; Katsamanis 2011; Kolk 2004; Van Ravesteijn 2013). Another six studies treated participants in other outpatient clinics (Kashner 1995; Lidbeck 1997; Schröder 2012; Sumathipala 2000; Sumathipala 2008; Zonneveld 2012). Five studies treated participants in specific outpatient symptom clinics or outpatient clinics for psychosomatics (Burton 2012; Martin 2007; Sattel 2012; Schröder 2013; Speckens 1995). One study treated participants as inpatients (they were admitted to a ward) (Schweickhardt 2007). One study treated participants at home (Schilte 2001). Finally, in one study the treatment setting was unknown (Moreno 2013).
Five of 21 studies were carried out in the Netherlands (Kolk 2004; Schilte 2001; Speckens 1995; Van Ravesteijn 2013; Zonneveld 2012). Five studies were carried out in Germany (Martin 2007; Sattel 2012; Schaefert 2013; Schröder 2013; Schweickhardt 2007). Other studies were carried out in the USA (Allen 2006; Escobar 2007; Kashner 1995; Katsamanis 2011), Denmark (Fjorback 2013;Schröder 2012), Spain (Moreno 2013), Sri Lanka (Sumathipala 2000; Sumathipala 2008), Scotland (Burton 2012), and Sweden (Lidbeck 1997). Only two studies were carried out in a developing country (Sri Lanka) (Sumathipala 2000; Sumathipala 2008).
Several of the included studies were performed by the same research groups, or at least had an overlap of authors. This was the case for the studies of Allen 2006, Escobar 2007, and Katsamanis 2011, for the studies of Fjorback 2013 and Schröder 2012, for the studies of Sumathipala (Sumathipala 2000; Sumathipala 2008), and for the studies of Speckens 1995 and Van Ravesteijn 2013.
Participants
Proportion of women
Most studies recruited women than men, as found in epidemiological studies (Fink 1999; Fink 2004). Only one study reported more men in the intervention group (56%, Speckens 1995). The proportion of women among all participants in all treatment groups ranged between 66% (Burton 2012) and 89% (Allen 2006;Escobar 2007).
Age
The mean age was 43 years in all included studies, ranging from 35 years (Kolk 2004;Sumathipala 2008) to 49 years (Martin 2007;Schaefert 2013). One study did not provide the mean age of participants (Katsamanis 2011), but only provided data about the proportion of participants under and over 40 years old.
Diagnosis
Diagnostic criteria and inclusion criteria varied widely between studies. Fourteen studies used standardised diagnostic interviews (such as CIDI or SCID) to establish the diagnosis, the other seven studies used standardised questionnaires (such as SOMS or PHQ‐15). In nine studies, symptoms were referred to as medically unexplained symptoms or unexplained physical symptoms. Three studies used the diagnoses of somatisation disorder and somatoform disorder to describe the symptoms (Allen 2006; Kashner 1995;Lidbeck 1997). Two studies used only the term somatisation (Schilte 2001; Schweickhardt 2007). One study spoke of abridged somatisation disorder (Moreno 2013), and two other studies spoke of multiple somatoform symptoms (Martin 2007; Schröder 2013). The other four studies used individual terminologies such as bodily distress syndrome (Fjorback 2013; Katsamanis 2011; Sattel 2012; Schröder 2012).
Exclusion criteria varied between studies, but often included dementia, severe psychopathology such as psychosis, active suicidal thoughts, alcohol dependence, pregnancy, and current psychological therapy.
Eleven studies reported severity of symptoms at baseline in terms of number of symptoms. This number varied widely, ranging from a lifetime number of seven symptoms (Martin 2007), to a current number of 32 symptoms (Schröder 2012). Other studies used somatic symptom scales or did not report baseline severity at all. Only nine studies reported exact duration of symptoms, all of them reported a duration of at least several years, ranging from 3.5 years (Sumathipala 2008) to 25 years (Allen 2006). Four additional studies reported a minimal duration of symptoms, the other eight did not report on symptom duration at baseline.
Seven studies reported on psychiatric co‐morbidity in general, percentages of participants with a current co‐morbid axis 1 disorder varied between 41% (Zonneveld 2012) and 92% (Escobar 2007). Depression and anxiety were the co‐morbidities reported most often. Twelve studies reported symptoms or disorders of depression and anxiety, methods of establishment and percentages varied widely. Only two studies reported physical co‐morbidities such as hypertension, arthrosis, or asthma (Schaefert 2013; Van Ravesteijn 2013). Four studies did not report any co‐morbidities (Kashner 1995; Sattel 2012; Sumathipala 2000; Sumathipala 2008).
Interventions
As described in the Types of interventions section, we aimed to select studies investigating psychological therapies, as well as studies on physical therapies. However, we found no studies on physical therapies that were eligible for inclusion. All 21 included studies evaluated a form of psychological therapy. We classified psychological therapies into six subcategories, as pre‐defined by the Cochrane Depression, Anxiety and Neurosis Review Group: CBT, behaviour therapy, or other therapies such as third‐wave CBT, psychodynamic therapy, humanistic therapy, or integrative therapies. Fourteen studies described certain forms of CBT. Two studies evaluated behaviour therapies (Katsamanis 2011;Schilte 2001). Two studies described third‐wave CBT (mindfulness) (Fjorback 2013; Van Ravesteijn 2013), and two studies described psychodynamic therapies (Sattel 2012; Schaefert 2013). In the study of Kolk et al., participants received CBT, client‐centred or eclectic therapy, depending on the therapist the participant was assigned to (Kolk 2004); we classified this as integrative therapy. None of the included studies described humanistic therapies.
Table 2 provides a summary overview of the main characteristics of the interventions of the included studies. In eight studies, the participants received group therapy, and in 11 studies they received individual therapy. In one study, participants received both (Schröder 2012), and in one study there were two intervention groups of which one group received group CBT, and one group received personal CBT (Moreno 2013).
| Intervention | Group/alone | Duration | Number of sessions | Therapist | Comparison | duration of follow‐up | |
| Martin 2007 | CBT | group | once | 1 | psychologist and psychotherapeutic specialist | usual care | 6 months |
| Burton 2012 | psychological therapy in symptoms clinic | alone | 3 months | 4 | experienced specialised GP | usual care | 3 months |
| Schweickhardt 2007 | psychotherapy | alone | 2 weeks | 5 | psychotherapists | psychoeducational reading material | 6 months |
| Sumathipala 2000 | CBT | alone | 3 months | 6 | research psychiatrist | usual care | 3 months |
| Sumathipala 2008 | CBT | alone | 3 months | 6 | trained primary care physician | enhanced treatment as usual | 12 months |
| Schröder 2013 | CBT | group | 2 months | 8 | psychotherapist | progressive muscle relaxation | 6 months |
| Van Ravensteijn 2013 | mindfullness‐based cognitive therapy | group | 2 months | 8 | experienced mindfullness trainer | enhanced treatment as usual | 9 months |
| Fjorback 2013 | mindfullness | group | 3 months | 8 | experienced psychiatrist | enhanced treatment as usual | 15 months |
| Kashner 1995 | group psychological intervention + CL | group | 4 months | 8 | master level clinician | consultation letter | 12 months |
| Lidbeck 1997 | CBT | group | 3 months | 9 | trained physician | waiting list | 9 months |
| Schroder 2012 | stress intervention (psychotherapy + letter etc) | group + alone | 4 months | 9 | consultant or senior resident psychiatry | enhanced treatment as usual | 16 months |
| Katsamanis 2011 | psychophysiologic treatment + psychiatric consultation | alone | 10 weeks | 10 | psychologist or biofeedback clinician | psychiatric consultation | 10 weeks |
| Moreno 2013 | CBT + Letter (1) CBT + Letter (2) | alone (1) group (2) | 10 weeks | 10 | psychologist | usual care + letter | 12 months |
| Allen 2006 | CBT + psychiatric consultation | alone | 3 months | 10 | trained and experienced psychologist | psychiatric consultation | 15 months |
| Escobar 2007 | CBT + psychiatric consultation letter | alone | 3 months | 10 | therapist | usual care + PCL | 9 moths |
| Sattel 2012 | psychodynamic interpersonal psychotherapy | alone | 3 months | 12 | psychologist or physician with psychotherapy experience | enhanced treatment as usual | 9 months |
| Schaefert 2013 | GP training in MUPS + interpersonal psychodynamically based therapy | group | 9 months | 12 | psychosomatic specialist | GP training in MUPS | 12 months |
| Zonneveld 2012 | CBT | group | 13 weeks | 13 | psychologist | waiting list | 13 weeks |
| Schilte 2001 | disclosure intervention | alone | unclear | unclear | trained disclosure doctor | usual care | 24 months |
| Speckens 1995 | CBT | alone | 6 months | 6‐16 | trained physician and behavioural therapist | enhanced treatment as usual | 12 months |
| Kolk 2004 | psychological intervention (varied) | alone | max 6 months | max 12 | trained therapist | usual care | 12 months |
CBT: cognitive behavioural therapy; GP: general practitioner; max: maximum; MUPS: medically unexplained physical symptoms.
The duration of treatment ranged from one day (one single session) (Martin 2007) to nine months (Schaefert 2013), most often between one and three months.
The mean number of sessions varied among studies and ranged from one session (Martin 2007) to 13 sessions (Zonneveld 2012). Thirteen studies used five to 10 sessions. Four studies used one to five sessions (Burton 2012; Martin 2007; Schilte 2001; Schweickhardt 2007). Four studies used more than 10 sessions (Sattel 2012; Schaefert 2013; Speckens 1995; Zonneveld 2012).
All studies performed follow‐up assessment, but one did not report the outcomes of all follow‐ups (Schilte 2001). Reported duration of follow‐up varied between two weeks (Schweickhardt 2007) and 24 months (Schilte 2001).
Comparisons
As described in the Types of interventions section, we aimed to select the following comparator interventions: usual treatment or waiting list, attention or psychological placebo, and other psychological/physical therapies. Fifteen studies compared an intervention to usual treatment or a waiting list. One of these studies had two intervention groups (receiving psychological therapy) and one control group (receiving usual care) (Moreno 2013). None of the included studies described a placebo comparator intervention, but five included studies compared an intervention with enhanced or structured care (i.e. more than just usual care or a waiting list condition) (Fjorback 2013; Sattel 2012; Schröder 2012; Speckens 1995; Sumathipala 2000). We had not foreseen this comparator at the protocol stage, so we added this later as an additional comparison. Examples of the enhanced care control condition were a basic training for GPs in the detection and management of psychiatric disorders (Speckens 1995). See Characteristics of included studies for details.
One study used compared two psychological therapies (Schröder 2013). This study also included a waiting list group, but we excluded data from this group from our analysis as participants were not randomly assigned to this group (see Other potential sources of bias section for details). We found no studies that compared psychological interventions with physical therapies.
In one study, GPs in both study arms were trained in diagnosis and management of medically unexplained symptoms (Schaefert 2013). In addition, the GPs in the intervention group conducted group sessions for people with MUPS, together with a psychosomatic specialist.
In six studies, in both study arms a consultation letter was sent to the primary care physician after baseline assessment, in addition to the planned psychological therapy (Allen 2006; Escobar 2007; Fjorback 2013; Katsamanis 2011; Moreno 2013; Schröder 2012). This was not a reason for exclusion, and we categorised these studies according to the main comparison. In sensitivity analyses, we assessed the effect of the interventions excluding these studies.
Scale used to measure outcomes
As described in the section Types of outcome measures, we aimed to retrieve data about our primary outcomes: severity of somatic symptoms and acceptability and on our secondary outcomes: depression and anxiety, dysfunctional cognitions, emotions or behaviours, adverse events, treatment response, functional disability and quality of life, and healthcare use.
Severity or intensity of somatic symptoms (or both) was most often measured using the PHQ‐15 (Kroenke 2002, five studies), the subscale 'Somatisation' of the SCL‐90R (Derogatis 1986, five studies), the SOMS (Rief 1997, three studies), the BSI (Derogatis 1983, three studies), and the Clinical Global Impession Scale for Somatoform Disorders (CGI‐SD; APA 2000, three studies). Two studies used more than one instrument for severity or intensity of somatic symptoms (or both) (Escobar 2007; Martin 2007). Two other studies did not report severity or intensity of somatic symptoms (or both) (Kashner 1995; Lidbeck 1997). Acceptability was calculated from provided data about the total number of randomised participants in the study groups and the total number of participants who completed assessments at end of treatment (also in the control group). For anxiety and depressive symptoms, studies mostly used Hospital Anxiety and Depression Scale (HADS) subscales (Zigmond 1983, five studies), SCL‐90R subscales (Derogatis 1986; three studies), and PHQ‐9 (Kroenke 2001, three studies). Dysfunctional cognitions, emotions, and behaviours were mostly operationalised as health anxiety, and measured by the WI (Pilowsky 1967, seven studies). Withdrawals due to adverse events were incidentally registered by the authors. Treatment response was mainly registered using the clinician‐rated CGI (Guy 1976, three studies). Functional disability was mainly measured using the SF‐36 (Ware 1992, 10 studies) and the Short Form 12 Questionnaire (SF‐12; a shortened version of the SF‐36, three studies). No standardised questionnaire was used to measure healthcare use, and mostly consultation counts (as counted by physicians or participants) were reported.
Excluded studies
Reasons for exclusion of studies were recorded for all studies that were read in full‐text. Common reasons included the absence of a randomisation procedure or a participant selection method that did not include a standardised interview or questionnaire. We also excluded three studies in which GPs were trained to provide some psychological therapy (Blankenstein 2001; Toft 2010;Van der Feltz‐Cornelis 2006); these studies were included in another Cochrane review (Rosendal 2013). The Characteristics of excluded studies table provides an overview of all excluded studies.
Ongoing studies
Searches of trial databases and personal communication identified eight ongoing studies that appear to meet the inclusion criteria for this review (Agger 2012; Hassett 2007; Olde Hartman 2013; Rief 2013; Schröder 2014; Sitnikova 2014; Steel 2011; Zimmermann 2014). No findings have yet been reported or obtained from these studies. The Characteristics of ongoing studies table provides an overview of these ongoing studies.
Studies awaiting classification
There are six studies awaiting classification, mostly due to unavailability of the full‐text articles. We attempted to contact all study authors and searched for the articles in various sources. All studies awaiting classification are potentially eligible studies that could not yet be incorporated into the review (see Characteristics of studies awaiting classification table).
Risk of bias in included studies
We classified the methodological quality of the 21 studies according to The Cochrane Collaboration's tool for assessing the risk of bias (see above). The final ratings are reported in the Characteristics of included studies table. A risk of bias summary graph (Figure 2) and summary figure (Figure 3) are also presented.
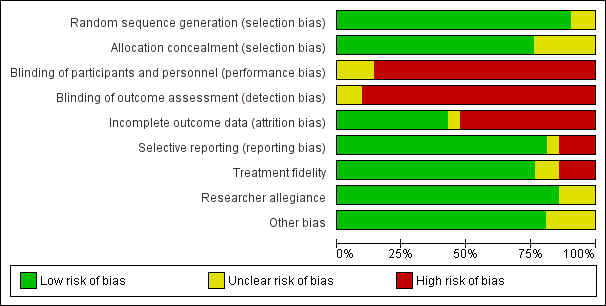
Risk of bias graph: review authors' judgements about each risk of bias item presented as percentages across all included studies.

Risk of bias summary: review authors' judgements about each risk of bias item for each included study.
Allocation
Sequence generation
While all studies specified that participants were randomly allocated to conditions (or GP practices randomised to treatment or control conditions), there were two studied that did not describe how sequence generation was performed (Kashner 1995; Schröder 2013). Therefore, we rated them as 'uncertain'. We rated the other studies as 'low risk' as they all used random sequence generation methods, whether by computer or non‐digital, for example, using random number tables (Kolk 2004; Martin 2007), or a sequence of labelled cards in envelopes or bags (Fjorback 2013; Schilte 2001; Schweickhardt 2007; Sumathipala 2000).
Allocation concealment
For five studies, it was unclear who performed allocation, or whether the person allocating participants to the trial groups was independent. Therefore, we rated these studies 'unclear' (Allen 2006; Escobar 2007; Kashner 1995; Katsamanis 2011; Schröder 2013). We rated the remaining 16 studies 'low risk of bias' as there was an adequate description of the person performing allocation or the relation to the researchers and therapists(e.g. "randomisation was carried out independently by a nurse who was not participating in the study") (Lidbeck 1997).
Blinding
Blinding of participants and personnel
In 18 studies, blinding of participants and personnel was not possible, due to the nature of the interventions (e.g. psychological group therapy versus waiting list). As this may have influenced the judgement, we rated almost all studies 'high risk'. We rated two studies 'unclear' because one of the two groups (participants or personnel) was blinded and the other was not (Sumathipala 2000; Van Ravesteijn 2013). One study did not describe blinding of personnel (Schröder 2013), and, therefore, we rated it 'unclear'.
Blinding of outcome assessment
In 19 studies, blinding of outcome assessment was not possible as most outcomes were participant reported. In one study, outcomes were assessed by blinded interviewers, but they did this together with the participants (who were not blinded) (Escobar 2007). We rated this study 'unclear'. One study mainly used clinician‐rated instruments (Moreno 2013). The outcome assessor was blinded, but, as there also were a few participant report instruments (and participants were not blinded), we rated this study 'unclear'.
Incomplete outcome data
All studies reported follow‐up rates; nine (43%) studies reported a loss to follow‐up of 20% or less. We rated these studies 'low risk'. We rated one study 'unclear', because it had a high loss to follow‐up, but corrected for this statistically by multiple imputation (Fjorback 2013). The remaining 11 studies reported high loss to follow‐up (greater than 20%) and, therefore, we rated them 'high risk'.
Selective reporting
Seventeen studies reported all intended outcomes and, therefore, we rated them 'low risk'. For one study, a protocol was lacking, therefore it was impossible to evaluate the possibility of selective outcome reporting (Fjorback 2013). We rated this study 'unclear'. We rated the remaining three studies 'high risk'. In Kashner 1995, the outcome 'days in bed' was described as assessed, but was not reported in the article. In Moreno 2013, healthcare use and CGI were mentioned as outcomes in the protocol, but they were not reported. Schilte 2001 performed follow‐up measurements at six, 12, and 24 months, but only reported outcomes of the last follow‐up moment.
Treatment fidelity
Sixteen studies used a treatment manual or protocol for studied treatments. We rated them 'low risk'. Three studies did not apply a structured intervention according to a protocol (Burton 2012; Kolk 2004; Schilte 2001), therefore, we rated them 'high risk'. The two remaining studies did provide information about a form of structure in treatment, but did not mention a protocol or manual for this. We rated them 'unclear'.
Researcher allegiance
In 18 studies, researchers did not report to have a preference for one of the treatment modalities. In the studies of Burton 2012, Lidbeck 1997, and Schaefert 2013, an author was also (one of) the therapist(s), which may have caused some bias. Therefore, we rated these studies 'unclear'.
Other potential sources of bias
We included two multiple intervention studies (Moreno 2013; Schröder 2013). In the first study, data were presented for each groups to which participants were randomised, so no other potential sources of bias were found (rating: 'low risk'). In the second study, participants were randomised for CBT or progressive muscle relaxation (PMR) using random sequences. When both groups were full, newly included participants were allocated to the waiting list group. In a later stage, these participants were included in both intervention groups. As participants were their own controls due to this method, we decided to exclude data from the waiting list group from analysis. For this reason, we rated this study 'unclear'.
One of the studies was a CRCT (Schaefert 2013). GPs were randomised, after which individuals were recruited. We considered the randomisation method and statistical analysis appropriate for the study design.
In the studies of Schilte 2001 and Katsamanis 2011, we found considerable baseline imbalances. In the study of Schweickhardt 2007, a high percentage (29%) of participants from the control group became involved in psychotherapy. This may have influenced the results, although this study provided data for only one outcome (acceptability) and the effects were in the same order of magnitude as in other studies. We rated these three studies 'unclear'.
Effects of interventions
See: Summary of findings for the main comparison Psychological therapy compared with usual care or waiting list for somatoform disorders and medically unexplained physical symptoms; Summary of findings 2 Psychological therapy compared with enhanced or structured care for somatoform disorders and medically unexplained physical symptoms
For the description of the results, we stratified the comparisons in the following way (as per the categories of therapies presented in Types of interventions, where data allowed):
-
Psychological therapies versus usual care or waiting list:
-
CBT versus usual care or waiting list;
-
behavioural therapy versus usual care or waiting list;
-
third‐wave CBT versus usual care or waiting list;
-
psychodynamic therapy versus usual care or waiting list;
-
integrative therapies versus usual care or waiting list;
-
-
Psychological therapies versus enhanced or structured care:
-
CBT versus enhanced or structured care;
-
third‐wave CBT versus enhanced or structured care;
-
psychodynamic therapy versus enhanced or structured care;
-
-
Psychological therapy versus another psychological therapy:
-
CBT versus behavioural therapy.
-
Most studies provided data for some of the outcomes. One study did not provide any data that were suitable for meta‐analysis, because the authors only reported change scores (Schilte 2001). Across all comparisons, outcomes, and time points, we created 44 forest plots. Most of these included data from only a limited number of studies: 25 of the forest plots included three or fewer studies, only two included 10 or more studies. Below, we present the results of the meta‐analyses. We also give attention to the subgroups that included a considerable proportion of the studies contributing to the overall comparisons: CBT versus usual care or waiting list and CBT versus enhanced or structured care, because these subgroups were more homogeneous in terms of type of intervention than the overall comparisons. In terms of risk of bias, the studies that provided outcomes for the meta‐analyses were representative for the whole group (i.e. covered the broad spectrum of risk of bias assessments across items).
1. Pschological therapy versus usual care or waiting list
Fifteen studies, with 1805 randomised participants, compared some form of psychological therapy with usual care or waiting list controls. They addressed the following psychological therapies:
-
CBT versus usual care or waiting list: 10 studies, 1037 randomised participants (Allen 2006; Burton 2012; Escobar 2007; Kashner 1995; Lidbeck 1997; Martin 2007; Moreno 2013; Schweickhardt 2007; Sumathipala 2000; Zonneveld 2012);
-
behavioural therapy versus usual care or waiting list: two studies, 209 randomised participants (Katsamanis 2011; Schilte 2001);
-
third‐wave CBT versus usual care or waiting list: one study, 125 randomised participants (Van Ravesteijn 2013);
-
psychodynamic therapy versus usual care or waiting list: one study, 328 randomised participants (Schaefert 2013);
-
integrative therapies versus usual care or waiting list: one study, 106 randomised participants (Kolk 2004).
In four of these studies, this was combined with a consultation letter sent to the primary care physician after baseline assessment, in both treatment arms (Allen 2006; Escobar 2007; Katsamanis 2011; Moreno 2013). A consultation letter provided recommendations for the primary care physician tailored to the individual person's diagnosis, symptoms, and problems. In one study, the GPs in both treatment groups were trained in diagnosis and management of MUPS (Schaefert 2013).
Below we describe the main results, sorted by outcomes. Graded evidence (i.e. using the GRADE approach) is only described for the outcomes that were selected for the 'Summary of findings' tables.
Apart from CBT, for each of the other types of psychological therapy only one study provided outcomes. Hence, for each of these separate treatment types there was insufficient evidence. Below, we described results for the whole group and for the subgroup of studies that compared CBT with usual treatment.
Primary outcomes
1.1 Severity of somatic symptoms
Combining all studies that compared some psychological therapy with usual care or waiting list, psychological therapies were significantly more effective at end of treatment, though the effect was small (SMD ‐0.34; 95% CI ‐0.53 to ‐0.16; 10 studies, 1081 analysed participants, Analysis 1.1). Heterogeneity was moderate (I2 = 49%), and the overall quality of the evidence was low (summary of findings Table for the main comparison). Compared with usual care, the subgroup of studies that used CBT were also significantly more effective in reducing severity of symptoms at end of treatment (SMD ‐0.37; 95% CI ‐0.69 to ‐0.05; 6 studies, 593 participants, random‐effects model; Analysis 1.1, subgroup 1.1.1). Heterogeneity was substantial (I2 = 70%), and the overall quality of the evidence was low. The point estimates of all but one of the studies favoured the CBT group. The two studies with the smallest effects offered low‐intensity CBT (Burton 2012; Martin 2007). A post‐hoc analysis without these two studies provided an SMD of ‐0.58 (a moderate effect size) (95% CI ‐0.77 to ‐0.38) and reduced heterogeneity (I2 = 0%.
At follow‐up, measurements within one year of follow‐up, the effect of psychological therapies remained significant (SMD ‐0.24; 95% CI ‐0.37 to ‐0.11; 7 studies, 950 participants; I2 = 0%). The same was the case for the subgroup of CBT studies (SMD ‐0.29; 95% CI ‐0.49 to ‐0.09; 4 studies, 496 participants; Analysis 1.2, subgroup 1.2.1). Heterogeneity was low (I2 = 17%).
Only two studies (all of CBT) with 228 participants provided data for this severity of symptoms beyond one year of follow‐up (SMD ‐0.52; 95% CI ‐0.80 to ‐0.24; Analysis 1.3). Heterogeneity was low (I2 = 0%).
1.2 Acceptability
Compared with usual care, psychological therapies resulted in a higher proportion of drop‐outs (RR acceptability 0.93; 95% CI 0.88 to 0.99 favouring usual care; 14 studies, 1644 participants; Analysis 1.4). Heterogeneity was moderate (I2 = 70%). For the studies comparing CBT with usual care, results were of the same magnitude but no longer statistically significant (RR acceptability 0.93; 95% CI 0.85 to 1.01 favouring usual care; 10 studies, 1037 participants; Analysis 1.4, subanalysis 1.4.1). Heterogeneity was considerable (I2 = 78%). See under Subgroup analysis and investigation of heterogeneity for results of a subgroup analysis. The overall quality of the evidence for this outcome was moderate.
Secondary outcomes
1.3 Severity of anxiety or depressive symptoms (or both)
For participant‐rated anxiety symptoms, there was no significant difference at end of treatment (SMD 0.06; 95% CI ‐0.20 to 0.32, 4 studies, 270 participants; Analysis 1.5). For the studies comparing CBT with usual care, results were similar (SMD 0.07; 95% CI ‐0.22 to 0.37; 3 studies, 185 participants; Analysis 1.5). Within one year of follow‐up only two studies were available (SMD 0.18; 95% CI ‐0.22 to 0.58; 134 participants; Analysis 1.7).
For clinician‐rated anxiety symptoms at end of treatment, there was a statistically significant difference at end of treatment in favour psychological therapies (SMD ‐0.40; 95% CI ‐0.63 to ‐0.17; 3 studies, 320 participants; Analysis 1.6). Within and beyond one year of follow‐up, differences remained statistically significant (within one year: SMD ‐0.66; 95% CI ‐1.15 to ‐0.18, 2 studies both CBT, 251 participants; Analysis 1.8; beyond one year: SMD ‐0.91; 95% CI ‐1.26 to ‐0.55; 1 study, 156 participants; Analysis 1.9).
For participant‐rated depressive symptoms, there was no significant difference at end of treatment (SMD ‐0.03; 95% CI ‐0.22 to 0.16; 6 studies, 661 participants; Analysis 1.10). Similar results were found for the studies that compared CBT with usual care (SMD 0.09; 95% CI ‐0.13 to 0.31; 4 studies, 325 participants; Analysis 1.10), and for outcomes after not more than one year of follow‐up (SMD 0.04; 95% CI ‐0.34 to 0.42; four studies, 535 participants; Analysis 1.12).
For clinician‐rated depressive symptoms, there was a statistically significant difference at end of treatment in favour of p
sychological therapies (SMD ‐0.25; 95% CI ‐0.48 to ‐0.02; 3 studies, 316 participants; Analysis 1.11). Within one year of follow‐up, the difference was no longer statistically significant (SMD ‐0.55; 95% CI ‐1.17 to 0.07; 2 studies, 251 participants; Analysis 1.13). Only one study reported on this outcome beyond one year after treatment (SMD ‐0.81; 95% CI ‐1.16 to ‐0.46; 156 participants; Analysis 1.14).
1.4 Dysfunctional cognitions, emotions, and behaviours
Three studies, two of which compared CBT with usual care, with 440 participants, reported on dysfunctional cognitions, emotions, and behaviours. At end of treatment, there was no significant difference between the two groups (SMD ‐0.11; 95% CI ‐0.37 to 0.16; Analysis 1.15). The quality of the evidence was moderate. At follow‐up within one year, differences remained non‐significant (SMD ‐0.16; 95% CI ‐0.38 to 0.07; Analysis 1.16).
1.5 Adverse events
Only three studies, all comparing CBT with usual care, reported on adverse events during the treatment period. One study could not be included in the meta‐analysis, because no adverse events were found in both groups. The pooled result of the other two studies also showed no significant differences between both conditions (RR 1.31; 95% CI 0.47 to 3.66; 445 participants; I2 = 0%; Analysis 1.17).
1.6 Treatment response (clinician rated)
All four studies addressing clinician‐rated treatment response comparing CBT with usual care. At end of treatment, results strongly favoured the treatment group (RR 3.30; 95% CI 2.08 to 5.21; 4 studies, 391 participants; I2 = 19%; Analysis 1.18). We considered the quality of the evidence to be low for this outcome. Three studies provided data for clinician‐rated treatment response within one year after end of treatment, still in favour of the treatment group (RR 2.53; 95% CI 1.25 to 5.10; 332 participants; I2 = 59%; Analysis 1.19). At longer follow up (greater than one year after treatment) only two studies reported outcomes, highly favouring the treatment group (RR 10.31; 95% CI 2.95 to 36.02; 240 participants; Analysis 1.20).
1.7 Functional disability and quality of life
Seven studies, of which four addressing CBT reported on functional disability and quality of life, using a variety of instruments. At the end of treatment, a statistically significant effect was found favouring the psychological therapies (SMD 0.17; 95% CI 0.03 to 0.32; 7 studies, 730 participants; I2 = 0%; Analysis 1.21). We judged the evidence to be moderate. At follow‐up within one year after treatment, differences were similar but no longer significant (less than one year: SMD 0.16; 95% CI ‐0.01 to 0.33; 4 studies, 526 participants; I2 = 0%; Analysis 1.22). After one year, only one study provided data for functional disability and quality of life (Analysis 1.23).
Four studies compared CBT with usual care. At end of treatment, a non‐significant difference was found favouring CBT (SMD 0.15; 95% CI ‐0.06 to 0.37; 4 studies, 341 participants; I2 = 0%; Analysis 1.21, subanalysis 1.21.1).
1.8 Healthcare use
Six studies assessed healthcare use, operationalised in different ways, with moderate quality of evidence. During the treatment phase, two studies found a significant difference in the number of participant‐initiated doctor visits and medication usage in favour of CBT (SMD ‐0.68; 95% CI ‐1.06 to ‐0.30; 117 participants; Analysis 1.24). In the period less than one year after treatment, perhaps a more relevant timeframe, four studies found no clear evidence of a difference (SMD ‐0.09; 95% CI ‐0.31 to 0.12; 532 participants; I2 = 20%; Analysis 1.25). We judged the quality of the evidence to be moderate. For one of the studies, the effect was in the opposite direction, that is, favouring the control group (Kolk 2004). No study provided data for healthcare use beyond one year after treatment. See footnotes of analyses for details about the way healthcare use was assessed.
2. Psychological therapy versus enhanced or structures care
Five studies with 680 randomised participants compared a certain psychological therapy with enhanced or structured care (see Characteristics of included studies for details). They addressed the following treatments:
-
CBT versus enhanced or structured care: three studies, 349 randomised participants (Schröder 2012; Speckens 1995;Sumathipala 2008);
-
third‐wave CBT versus enhanced or structured care: one study, 120 randomised participants (Fjorback 2013);
-
psychodynamic therapy versus enhanced or structured care: one study, 211 randomised participants (Sattel 2012).
In two of these studies, treatment was combined with a consultation letter sent to the primary care physician after baseline assessment, in both treatment arms (Fjorback 2013; Schröder 2012).
Below we describe the main results, sorted by outcomes. Apart from CBT, only one or two trials provided data for each of the three other types of psychological therapy; hence, for each of these other treatment types there was insufficient evidence. Below, we do not describe the results for these subgroups separately. The reader is referred to the combined forest plots for each outcome.
Primary outcomes
2.1 Severity of somatic symptoms
Five studies (with 624 analysed participants) assessed severity of somatic symptoms comparing some psychological therapy versus enhanced care (pooled SMD ‐0.19; 95% CI ‐0.43 to 0.04; I2 = 53%; Analysis 2.1). We considered the quality of the evidence to be low (summary of findings Table 2). Within one year of follow‐up, this effect was similar but now statistically significant (SMD ‐0.21; 95% CI ‐0.40 to ‐0.02; 5 studies, 593 participants; I2 = 25%; Analysis 2.2). Only two studies each comparing a different psychological therapy to enhanced care, assessed severity of somatic symptoms beyond one year after treatment (SMD ‐0.32; 95% CI ‐0.73 to 0.10; 172 participants; Analysis 2.3). The subgroup of studies comparing CBT with enhanced care showed similar results. Heterogeneity was substantial at the end of treatment (I2 = 62%) and moderate within one year after treatment (I2 = 39%).
2.2 Acceptability
Five studies, with 679 analysed participants, showed that psychological therapies were less acceptable in terms of drop‐outs than enhanced care (RR 0.93; 95% CI 0.87 to 1.00; Analysis 2.4). Heterogeneity was moderate (I2 = 36%), and we judged the quality of the evidence to be moderate. The largest subgroup was CBT. Compared with enhanced care, moderate‐quality evidence showed that there was no clear difference between CBT and enhanced or structured care (RR 0.91; 95% CI 0.82 to 1.02; 3 studies, 331 participants; Analysis 2.4, subgroup 2.4.1). Heterogeneity was moderate to considerable (I2 = 50%).
Secondary outcomes
2.3 Severity of anxiety or depressive symptoms (or both)
Five studies assessed severity of anxiety or depressive symptoms (or both) at end of treatment (SMD ‐0.14; 95% CI ‐0.30 to 0.02; 624 analysed participants; I2 = 0%; Analysis 2.5), showing no clear difference. Similar results were found within one year after treatment (SMD ‐0.13; 95% CI ‐0.29 to 0.03; 5 studies, 593 participants; Analysis 2.6) and beyond one year after treatment (SMD ‐0.26; 95% CI ‐0.55 to 0.03; 2 studies, 184 participants; Analysis 2.7).
The studies investigating CBT showed no significant difference in level of anxiety and depressive symptoms between CBT and enhanced care at end of treatment (SMD ‐0.17; 95% CI ‐0.40 to 0.05; 3 studies. 307 participants; Analysis 2.5, subanalysis 2.5.1) and within one year after treatment (SMD ‐0.17; 95% CI ‐0.40 to 0.06; 3 studies, 289 participants; Analysis 2.6, subanalysis 2.6.1). Heterogeneity was low (I2 = 0% at end of treatment and within one year after treatment). Only one CBT study reported on severity of anxiety or depressive symptoms (or both) beyond one year after treatment (Analysis 2.7).
2.4 Dysfunctional cognitions, emotions, and behaviours
Four studies, with 499 analysed participants, provided data for dysfunctional cognitions, emotions, and behaviours at end of treatment, showing no clear evidence of a difference between psychological therapy and enhanced care (SMD ‐0.09; 95% CI ‐0.29 to 0.10; I2 = 14%; Analysis 2.8). We judged quality of the evidence to be moderate. At follow‐up within one year after treatment, the difference was statistically significant (P value = 0.05), favouring the psychological therapy over enhanced care (SMD ‐0.24; 95% CI ‐0.49 to 0.00; 4 studies, 477 participants; I2 = 42%, Analysis 2.9). Beyond one year of follow‐up, only two studies reported on dysfunctional cognitions, emotions, and behaviours and showed no significant difference (SMD ‐0.58; 95% CI ‐1.27 to 0.11; 2 studies, 184 participants; I2 = 82%; Analysis 2.10).
The two studies comparing CBT with enhanced care showed no clear evidence of a difference in dysfunctional cognitions, emotions, and behaviours at end of treatment (SMD ‐0.28; 95% CI ‐0.57 to 0.01; 2 studies, 182 participants; Analysis 2.8). Heterogeneity was low (I2 = 0%). However, within one year after treatment, levels of dysfunctional cognitions, emotions, and behaviours were significantly lower for CBT (SMD ‐0.45; 95% CI ‐0.83 to ‐0.07; 2 studies, 173 participants; Analysis 2.9), though more heterogeneous (I2 = 37%). This effect was even more significant at more than one year after treatment, although this comparison only included one study (SMD ‐0.94; 95% CI ‐1.36 to ‐0.51; 94 participants; Analysis 2.10) (Schröder 2012).
2.5 Adverse events
None of the studies comparing psychological therapy versus enhanced or structures care reported information about adverse events.
2.6 Treatment response
None of the included studies comparing psychological therapy versus enhanced or structures care reported about treatment response using a standardised method as described in Secondary outcomes. One study reported about treatment response, but for this outcome measure the SF‐36 (Ware 1992) was used (Schröder 2012). In this review, we used the outcomes of this questionnaire in the analyses of functional disability. Another study reported about participants' perceived change in symptoms (Speckens 1995). At all measurement moments after baseline, participants were asked if their symptoms were "recovered", "improved", "the same", or "worse" since the previous measurement, using a non‐standardised questionnaire. At the end of treatment, 32 (82%) participants in the intervention group declared that symptoms were improved or recovered versus 24 (64%) participants in the control group. Six months after treatment, 27 (73%) participants of intervention group reported recovery or improvement versus 23 (59%) participants of the control group.
2.7 Functional disability and quality of life
At end of treatment, four studies with 497 analysed participants reporting on functional disability and quality of life, found no significant difference (SMD 0.13; 95% CI ‐0.05 to 0.30; I2 = 0%; Analysis 2.11). We considered the quality of the evidence to be moderate. Within one year of follow‐up, there was a small effect in favour of psychological therapies (SMD 0.20; 95% CI 0.02 to 0.38; 5 studies, 727 participants; I2 = 0%; Analysis 2.12). Only two studies reported on functional disability and quality of life beyond one year of follow‐up and there was no clear evidence of a difference between the interventions (SMD 0.22; 95% CI ‐0.16 to 0.60; 2 studies, 184 participants; Analysis 2.13).
For the studies comparing CBT with enhanced care, at end of treatment, moderate‐quality evidence showed no significant difference in terms of level of function/quality of life, with a large CI but homogeneous population (SMD 0.21; 95% CI ‐0.08 to 0.51; 2 studies, 182 participants; I2 = 0%; Analysis 2.11). There was a small but significant difference in favour of CBT within one year after treatment (SMD 0.30; 95% CI 0.00 to 0.60; 2 studies, 173 participants; Analysis 2.12). At this time point, heterogeneity was low (I2 = 0%). After one year of follow‐up, only one study provided data. In this study, CBT resulted in a significantly higher level of function compared with enhanced care (SMD 0.42; 95% CI 0.01 to 0.83; 94 participants; Analysis 2.13).
2.8 Healthcare use
Only two studies provided usable data for this analysis and quality of the evidence was low (Sumathipala 2008; Sattel 2012). There were no significant differences healthcare use between psychological therapies and enhanced care, neither at end of treatment (Analysis 2.14), nor within one year after end of treatment (Analysis 2.15). See footnotes of analyses for details about the way healthcare use was assessed.
3. Psychological therapy versus other psychological therapy
Only one included study addressed psychological therapy versus other psychological therapy (Schröder 2013, 173 randomised participants). The study compared CBT with PMR therapy. The study also included a waiting list group, but we excluded this group from analyses as participants in the waiting list group were not randomly assigned (for details, see the Other potential sources of bias section).
Primary outcomes
3.1 Severity of somatic symptoms
No significant difference was found for severity of somatic symptoms between CBT and PMR at end of treatment (SMD 0.10; 95% CI ‐0.33 to 0.53; 84 participants; Analysis 3.1).
3.2 Acceptability
There was no significant difference in drop‐out rates between CBT and PMR during treatment (SMD 0.98; 95% CI 0.83 to 1.15; 90 participants; Analysis 3.2).
Secondary outcomes
3.3 Severity of anxiety or depressive symptoms (or both) at end of treatment
There was no significant difference in level of depression and anxiety between CBT and PMR at end of treatment (SMD 0.01; 95% CI ‐0.42 to 0.44; 84 participants; Analysis 3.3).
3.4 Dysfunctional cognitions, emotions, and behaviours
The study did not report about dysfunctional cognitions, emotions, and behaviours.
3.5 Adverse events
The study comparing CBT with PMR did not report about adverse events.
3.6 Treatment response
The study comparing CBT with PMR did not report about treatment response.
3.7 Functional disability and quality of life
There was no significant difference in level of function between CBT and PMR at end of treatment (SMD 0.28; 95% CI ‐0.15 to 0.71; 84 participants; Analysis 3.4).
3.8 Healthcare use
The study comparing CBT with PMR did not report about healthcare use.
Subgroup analyses and investigation of heterogeneity
For most comparisons and outcomes, we considered the number of studies to be too small to explore possible sources of heterogeneity.
Sensitivity analyses
Although we stated in our protocol that we would only perform sensitivity analyses when at least 10 studies were available, we performed some analyses with fewer studies, in response to peer reviewers' requests.
Consultation letters
For our first comparison, we repeated the analysis for the primary outcomes excluding the studies that included consultation letters in both study arms. For symptom severity at end of treatment, the original analysis included 10 studies with 1081 participants (pooled SMD ‐0.34; 95% CI ‐0.53 to ‐0.16; I2 = 49%; Analysis 1.1). Excluding the three studies with consultation letters resulted in seven remaining studies with 722 participants, and a pooled of SMD ‐0.22 (95% CI ‐0.40 to ‐0.03; I2 = 24%) (Allen 2006; Escobar 2007;Moreno 2013).
At follow‐up measurements within one year of follow‐up, the original analysis showed that the effect of psychological therapies compared with usual care CBT remained significant (SMD ‐0.24; 95% CI ‐0.37 to ‐0.11; 7 studies, 950 participants; Analysis 1.2). Heterogeneity was low (I2 = 0%). Excluding the same three studies with a consultation letter as above resulted in four remaining studies with 594 participants, and a pooled SMD of ‐0.14 (95% CI ‐0.31 to 0.02) and also low heterogeneity (I2 = 0%).
Outliers
For our first comparison, with 14 studies, the outcome acceptability showed considerable heterogeneity (I2 = 70%; Analysis 1.4), the effect was small but statistically significant (RR 0.93; 95% CI 0.88 to 0.99). One of the studies was a clear outlier (Kashner 1995), with only 20/44 (45%) participants in the CBT group completing the treatment phase versus all of the 26 participants in the control group (100% acceptability) (see also the funnel plot; Figure 4). Removing this study from the analysis (a post hoc choice) reduced the heterogeneity from 70% to 33%. The pooled results for the remaining studies resulted in a somewhat smaller effect (RR 0.95; 95% CI 0.92 to 0.99; 13 studies, 1574 analysed participants). As the outlying study had an extreme low acceptability in the intervention group, publication bias was not an issue.
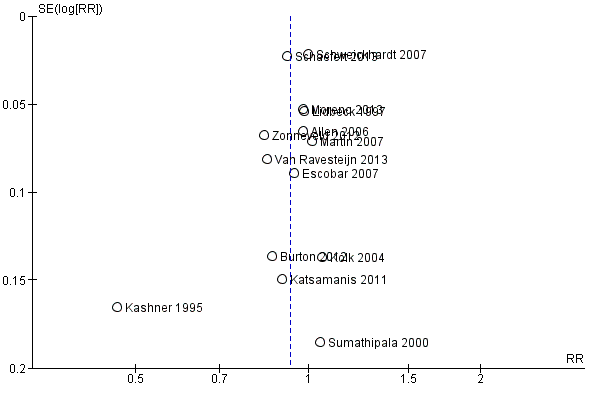
Funnel plot of comparison: 1 Psychological therapies versus usual care or waiting list, outcome: 1.4 Acceptability.
Reporting bias
In few studies, we considered reporting bias to be a serious problem. However, our assessment was suboptimal, as for most of the studies no protocol was available, so we could not compare the published outcomes with the planned outcomes. One study evidently assessed more outcomes than initially reported (Moreno 2013), but this was at least partially overcome by a later publication, and by additional outcome data provided by the authors on request. The only funnel plot we were able to produce (because enough studies were available) did reveal one outlier, but this did not suggest any publication bias (see Figure 4).
Discussion
Summary of main results
We added two 'Summary of findings' tables to create a structured overview of the main review results, using the GRADE methodology (summary of findings Table for the main comparison; summary of findings Table 2). These tables only addressed the most important outcome measures (marked with an asterisk in the section 'Types of outcome measures') of the two main comparisons. A summary of the main findings for all comparisons follows below.
Psychological therapy versus usual care
Fifteen studies compared some form of psychological therapy with usual care or a waiting list. Combining 10 of these studies, the psychological therapy was significantly more effective on symptom severity at end of treatment, though the effect was small. Heterogeneity was considerable and the overall quality of the evidence was low. Six of the 10 studies compared CBT with usual care; for this subgroup it was also apparent that CBT was more effective in reducing severity of symptoms at the end of treatment. The treatment effect of psychological therapies as a whole was also noted within one year of follow‐up (seven studies). After one year, the evidence was limited to two studies (both CBT), but still in favour of the psychological therapy. Results for treatment response, one of our secondary outcomes, supported the findings for symptom severity, with moderate‐quality evidence.
Regarding the other primary outcome, acceptability, we found a 7% difference in drop‐outs, favouring the usual care group. The quality of the evidence was moderate. After we removed an apparent outlier, the result was smaller (5%), but still statistically significant. There was no significant difference in drop‐out rates between CBT and usual care.
For participant‐rated symptoms of depression and anxiety, there was no significant difference at the end of treatment or at follow‐up. However, in three studies using clinician‐rated instruments, the level of anxiety and depression was slightly lower in the psychological therapy groups at the end of treatment. For anxiety, this difference became larger at follow‐up. For clinician‐rated depressive symptoms, this effect fluctuated during follow‐up (no effect within one year (two studies) and a large effect after one year of follow‐up (one study)). Only three studies reported adverse effects and dysfunctional cognitions, emotions, and behaviours. There was no clear evidence of a difference on these outcomes. There was a small difference in functional disability at the end of treatment favouring psychological therapies. This effect was not apparent during follow‐up. Two studies (both on CBT) found a small difference in favour of psychological therapies on healthcare use during treatment, four studies found no effect within one year of follow‐up. Due to the small number of studies, these results should be considered with caution.
Only two studies compared behavioural therapy with usual care, of which only one provided relevant data (Katsamanis 2011). In this study, there were no significant differences for any of the outcomes. Only one study compared third‐wave CBT (mindfulness therapy) with usual care (Van Ravesteijn 2013). In this study, mindfulness was more acceptable than usual care, but no evidence of differences was found with respect to other outcomes. One study compared a variety of psychological therapies with usual care (therapy depended on the orientation of the 15 participating therapists) (Kolk 2004). In this study, there was no evidence of differences with respect to any of the outcomes. This comparison had a high external validity as it emulated the way the referral process normally works.
Psychological therapy versus enhanced or structured care
Five studies compared a certain psychological therapy with enhanced or structured care. The quality of the evidence was moderate for most outcomes. At the end of treatment, there was no clear evidence of a difference for symptom severity, but there was a small statistically significant difference within one year after end of treatment. The psychological therapy groups had a 7% higher drop‐out rate than the control groups.
There was no clear evidence of a difference between the groups in terms of severity of anxiety or depressive symptoms (or both) at the end of treatment and within one year after treatment. There was no clear evidence of a difference between the groups in terms of dysfunctional cognitions, emotions, and behaviours at end of treatment, but at follow‐up within one year of treatment there was a small effect in favour of psychological therapy over enhanced care. None of the studies in this comparison reported information about adverse events or treatment response in a standardised way. For functional disability and quality of life, there was no clear evidence of a difference at the end of treatment, but there was a small significant difference within one year of follow‐up. There were no significant differences in healthcare use between psychological therapies and enhanced care.
Three of the studies compared CBT with enhanced or structured care. For symptom severity, CBT showed similar results as the whole group. There were no differences in drop‐out rates. In addition, there were no significant differences in levels of anxiety and depressive symptoms at the end of treatment and within one year after treatment. Only one study reported data after one year. At the end of treatment, CBT did not result in lower levels of dysfunctional cognitions, emotions, and behaviours, compared with enhanced care. However, within one year of treatment, these levels were lower for CBT (two studies). Only one study reported beyond one year of treatment. The level of functional disability at the end of treatment was comparable for CBT and enhanced care. Within and after one year of treatment there was a small difference in favour of CBT, although only a few studies were included in these analyses. Only one CBT study reported data about healthcare use and found no evidence of difference.
Psychological therapy versus another psychological therapy
Only one study compared two forms of psychological therapy (CBT versus PMR). There were no differences between the groups for any of the outcomes.
Overall completeness and applicability of evidence
The aim of this review was to assess the effects of non‐pharmacological interventions for somatoform disorders (specifically somatisation disorder, undifferentiated somatoform disorder, somatoform disorders unspecified, somatoform autonomic dysfunction, pain disorder, and alternative somatoform diagnoses proposed in literature) and MUPS in adults in comparison with treatment as usual, waiting list controls, attention placebo, psychological placebo, enhanced care, and other psychological or physical therapies.
Studies
A thorough literature search in electronic databases and many other resources such as conference proceedings, international trial registers, grey unpublished literature, and reference lists resulted in 21 studies that could be included in this review. In comparison to other existing reviews about non‐pharmacological interventions for MUPS or somatoform disorders (e.g. Kleinstäuber 2011; Kroenke 2007; Rosendal 2013), this number of eligible studies is quite high. Hence, a considerable number of studies was available in order to address our questions. However, only a few studies contributed to most of the outcomes. In addition, due to the small number of studies, we were unable to consider the effect of study characteristics (setting, severity, chronicity) on the outcomes.
We believe that the included studies cover a broad spectrum of settings, and both RCTs and CRCTs were included. Participants were recruited in various ways and from various healthcare settings, including primary care, secondary care, tertiary care, and the open population. In the included studies, therapists had different backgrounds (e.g. GPs, psychologists, and other physicians) and different levels of experience. A limitation of the included studies was the relatively low number of included participants per study as most studies only included 25 to 75 participants per study arm.
A critical issue concerns the fact that somatoform disorders are conceptually overlapping with certain functional somatic syndromes, which we excluded from the current review when studies only focused on one of these (e.g. chronic fatigue syndrome and irritable bowel syndrome). However, the results of the current review should be interpreted as part of a portfolio of various Cochrane reviews covering somatoform disorders (Hoedeman 2010; Ipser 2009; Ruddy 2005; Thompson 2007); the Cochrane review on pharmacological interventions for somatoform disorders, which is currently being developed (see Kleinstäuber 2013 for protocol) and Cochrane reviews focusing on different functional syndromes (e.g. Moore 2014).
It is debatable whether our inclusion criterion that selection of participants should include a diagnostic interview or questionnaire to establish MUPS or somatoform disorder was not too strict. We excluded several potentially relevant randomised trials because they did not fulfil this criterion. It is unclear whether these excluded studies included participants of similar severity as the included studies.
Participants
With only two exceptions (Sumathipala 2000; Sumathipala 2008), studies were performed in developed countries (Western Europe and USA).
Most studies randomised more women than men. This is in line with existing reviews, as MUPS and somatoform disorders are more common among women. Included studies cover a broad age range. However, as the mean age of participants was in the 30s or 40s in most of the studies, it may be possible that younger and older people were relatively underpresented. Severity of MUPS at baseline was mostly analysed based on the number of symptoms or duration (or both) of symptoms. The number of symptoms at baseline varied widely, ranging from a lifetime number of symptoms of seven (Martin 2007) to a current number of symptoms of 32 (Schröder 2012). Baseline duration, only reported in nine studies, ranged on average from four to 25 years. This suggests that most of the included participants may have had chronic symptoms at baseline. Included studies also reported high psychiatric co‐morbidity rates, percentages of participants with a current co‐morbid axis 1 disorder varied between 41% (Zonneveld 2012) and 92% (Escobar 2007). Taking these findings together, we can say that a limitation may be that participants of included studies were people with relatively severe forms of somatoform disorders and MUPS. The milder forms, with lower levels of co‐morbidity may have been underpresented. In contrast, people with milder symptoms may need less intensive therapy.
Interventions
Fourteen of the included studies compared CBT with another intervention. As a result, relatively robust conclusions could be drawn about the effectiveness of CBT. The number of studies describing other psychological therapies (such as behavioural therapies, third‐wave CBT, or psychodynamic therapies) was too low to draw conclusions about these forms of therapy. Duration and number of treatment sessions varied widely between the included studies.
It is especially remarkable that we found no studies on physical therapies (such as running therapy). We believe that there is a clear need for this type of research.
Many included studies used forms of enhanced care or other forms of therapy as the control treatment. A limitation of this method may be an underestimation of the treatment effect, due to small inter‐group differences. This is illustrated since these studies found fewer and smaller effects than studies comparing a treatment with usual care.
Outcomes
In this review, the outcome of functional impairment introduced a problem, as a certain number of studies used SF‐36 subscales as the outcome measure. As a result, we reported physical functioning and mental functioning or even subdomains separately. We decided to pool the two main domains into one outcome, but this led to the limitation that differences in effects for physical and mental functioning, as found in some studies (e.g. Zonneveld 2012), disappeared.
Another problem of the current review was that, with one exception, there were not enough studies to assess reporting bias with funnel plots. According to recommendations of the Cochrane Handbook for Systematic Reviews of Interventions, there should be at least 10 studies to perform this (Sterne 2011). In future updates of this review, the addition of new studies may enable us to produce funnel plots for more comparisons and outcomes.
Adverse effects were very infrequently reported and various ways of reporting were used. Therefore, it was impossible to extract these in a standardised way in order to include them in our meta‐analytical calculations, except for the first comparison (psychological therapy versus usual care or waiting list). We also have to emphasise again that RCTs and CRCTs are not sufficient to gain information about the more rare or longer‐term (or both) adverse events.
The difference in effect between participant‐reported symptoms of anxiety and depression and physician‐reported symptoms is interesting. In most studies, both participants and physicians were aware of the treatment that was provided, but physicians may have been more biased towards active treatment than participants. In contrast, we should realise that the studies that asked participants to rate their symptoms were not always the same as the studies that asked physicians, so it is possible that other study characteristics have caused these differences.
Quality of the evidence
According to the first quality criterion risk of bias defined by the guidelines by GRADE, Figure 2 and Figure 3 showed that in regard to different types of biases most of our included studies showed a low risk. However, a few specific domains were often rated as being at high risk of bias across the studies. Especially for blinding of the outcome measurement, we identified a high risk of bias in most of the included studies. Most studies could not blind the outcome reporters, mostly the participants, due to the nature of the intervention. A high risk of bias in blinding of participants and personnel was found for the same reason. Nine studies (43% of studies) reported incomplete outcomes, defined as a loss to follow‐up of more than 20%. Reasons for loss to follow‐up were not systematically described. Another study aspect that affected the quality of the evidence was the generally low number of included participants per study. It has to be taken into account that several of the included studies were performed before the publication and implementation of current quality criteria for conducting and reporting RCTs.
The small number of studies did not allow us to assess the effects in subgroups of participants or interventions. Apart from CBT, all other comparisons between specific therapies and usual care or enhanced care, the number of studies was too small (often only one study). We did not consider indirectness (a GRADE item comparing the interventions and outcomes in which we are interested to what was actually studied in the included studies) and publication bias to be important sources of risk of bias, publication bias because of our thorough search process; the overall completeness of reporting, and the fact that several studies that did not find an effect.
Potential biases in the review process
This review has several methodological strengths. The quality of meta‐analyses depends on the robustness of the search methods used. In this review, the electronic search was thorough and large in scale with broad parameters. We evaluated published and unpublished studies. The selection criteria were broad, which led to the selection of a relatively high number of studies. We also included non‐English studies. As a result, it seems likely that all or almost all evidence in the searched databases that should have been included was included. However, as we did not search Asian databases, this may have led to a potential bias.
The study was performed according to a pre‐published protocol. Different review authors performed evaluation of studies for selection, extract data, and assess risk of bias, with the possibility of consulting another review author to resolve disputes. However, due to the fact that not all choices that had to be made were foreseen, there were also post hoc decisions. Excluding studies that trained GPs to deliver some psychological therapy was one of these decisions. In addition, we performed the allocation of the included studies to the different groups of treatment for analyses post hoc. Another post hoc decision was the addition of enhanced or structured care as a comparator. We made decisions very carefully and included achieving consensus between several review authors with specific knowledge in the field. However, some studies were difficult to categorise, as, for example, treatments included elements of different treatment categories. Therefore, allocation of these studies remained slightly arbitrary. Another post hoc decision was to combine the physical component scale and the mental component scale of the SF‐36 into one outcome. Other post hoc decisions were to carry out sensitivity analyses by excluding studies that included consultation letters in both study groups, and by excluding studies with the least intensive interventions.
Although we attempted to obtain missing data from the authors of included studies, it was not possible in every case to obtain these data, and, therefore, the included studies were not represented fully in the meta‐analyses. This may also have led to a certain form of bias, although it is difficult to say in what direction this bias would be.
As described in the section Types of outcome measures, we aimed to retrieve data about severity/intensity of MUPS; acceptability; depression and anxiety; dysfunctional cognitions, emotions, or behaviours; adverse events; treatment response; functional disability; and quality of life. However, the number of studies reporting on many of our outcomes was relatively low. Results about depression; anxiety; dysfunctional cognitions, emotions, and behaviours; adverse events; and treatment response were frequently lacking. Therefore, we could not draw robust conclusions about these outcome measures.
Although acceptability was a primary outcome of our study, we restricted this to the period from randomisation to the end of treatment. We did not take into account the acceptability of the interventions in the recruitment phase. Participants for whom the intervention or control condition was unattractive probably did not participate. This affects the external validity of study findings.
In this review, we used point estimates at all follow‐up periods to evaluate treatment effect, instead of scores based on change from baseline. We chose this method as these results were retrievable from most of the studies, and combining follow‐up outcome data with change from baseline data was considered inappropriate given our choice of SMDs due to the variety of outcome measures that had to be combined (Higgins 2011, Chapter 9.4.5.2). However, pooling the results of follow‐up measurements has the disadvantage that baseline values (and possible baseline differences) are not taken into account. As data were pooled in most analyses, we believe that distortions such as these are generally corrected by the other studies in the analyses. Some studies only reported data about change from baseline (without the actual baseline data) (e.g. Burton 2012; Fjorback 2013). These data could not be used in this review. We contacted authors in order to be obtain the required data, and were successful in many cases though not all.
Agreements and disagreements with other studies or reviews
Several systematic reviews have addressed non‐pharmacological treatments for participants with some form of somatoform disorder or MUPS (Allen 2002; Blankenstein 2001 (thesis, chapter 2); Guthrie 1996; Hofmann 2012; Huibers 2007; Kleinstäuber 2011; Koelen 2014; Kroenke 2000; Kroenke 2007; Looper 2002; Nezu 2001; Rosendal 2013; Sumathipala 2007). As many of the included studies in our review were published after 2005, we focused this discussion on the systematic reviews that were published after 2005.
In general, we can say that the results of this review are in line with results of existing reviews. In most reviews, the majority of included studies concerned CBT in some form, and small effect sizes were found. In other reviews, also limited evidence was found for other forms of psychological therapies. Studies investigating physical therapies for somatoform disorders or MUPS were also hardly reported in other reviews.
Hofmann et al. evaluated the effectiveness of CBT for a broad range of conditions, including somatoform disorders and chronic pain and fatigue (Hofmann 2012). Within the somatoform disorders category of DSM‐IV, meta‐analyses primarily examined the efficacy of psychological interventions for hypochondriasis and body dysmorphic disorder, which were both excluded from this review. For chronic fatigue and pain, the effect of a range on treatments was reviewed, including relaxation techniques, mindfulness‐based techniques, acceptance‐based techniques, biofeedback, psycho‐education, and behavioural and cognitive behavioural treatments. Results of these meta‐analyses revealed varying effect sizes for these treatments depending on the type of chronic pain targeted; however, CBT treatments for chronic pain were consistently in the small‐to‐medium effect size range. For fatigue, effect sizes were medium.
Huibers et al. published one Cochrane review focusing on psychosocial interventions provided by GPs (Huibers 2007). They included 10 studies, addressing five distinct disorders or health complaints, one of which was somatisation, for which three RCTs were found. One of these was also included in the current review (Lidbeck 1997). The authors of the Cochrane review concluded that there was little evidence available for the use of psychosocial interventions by GPs, while the conclusions of the three separate studies were slightly more positive, indicating that the model of training GPs in psychosocial interventions could be beneficial and with modifications might be useful in practice.
Kleinstäuber et al. evaluated the effect of short‐term psychotherapy on multiple medically unexplained symptoms (Kleinstäuber 2011). They included a relatively high number of studies (27 studies), showing a considerable overlap with this review (nine studies also in our review). Most of the 18 studies that we did not include in our review were either not randomised or used a participant selection procedure that did not fulfil our criteria. Like our review, they found small but stable effect sizes of CBT on severity of symptoms versus usual care. For quality of life and medical healthcare utilisation, non‐significant effects were found directly after psychotherapy, which increased to significant small effects at follow‐up assessment. For depression and anxiety, a small effect was found, which disappeared over time. The authors concluded that current psychotherapeutic concepts do not sufficiently focus on co‐morbid depression or anxiety.
Rosendal et al. published one Cochrane review focusing on enhanced care for people with functional somatic symptoms and disorders, performed by generalists in primary care (Rosendal 2013). Seven studies fulfilled their inclusion criteria, three of which were also potential candidates for inclusion in this review (Blankenstein 2001;Larisch 2004;Toft 2010, see Excluded studies). For most outcomes, they found small and non‐significant overall effect sizes. They concluded that current evidence does not answer the question whether enhanced care delivered by frontline primary care professionals has an effect or not on the outcome of people with functional somatic symptoms. They pointed out that enhanced care may have an effect when delivered per protocol to well‐defined groups of people with functional disorders, but that this needs further investigation.
Sumathipala searched for systematic reviews and trials published since 2000, addressing treatments for people with medically unexplained symptoms (Sumathipala 2007). He found six systematic reviews and 14 new trials. He concluded that CBT was efficacious for either symptom syndromes or for the broader category of medically unexplained symptoms, reducing physical symptoms, psychological distress, and disability. He found limited level II evidence for other interventions such as collaborative care models, consultation letters, reattribution therapy, and bioenergetics exercise. Sumathipala 2007 included a relatively low number of studies in primary care.
In 2014, one systematic review was published on psychotherapy compared with treatment as usual for severe somatoform disorders (Koelen 2014). Ten randomised and six non‐randomised trials were included. Of the randomised trials, two were also included in our review. One of the other randomised trials may also be relevant for our review and was listed under Studies awaiting classification, to be examined for a future update (Nickel 2006). The authors of this systematic review concluded that psychotherapy was effective, but further studies are needed to examine specific interventions and mechanisms of change.
Risk of bias graph: review authors' judgements about each risk of bias item presented as percentages across all included studies.
Risk of bias summary: review authors' judgements about each risk of bias item for each included study.
Funnel plot of comparison: 1 Psychological therapies versus usual care or waiting list, outcome: 1.4 Acceptability.

Comparison 1 Psychological therapies versus usual care or waiting list, Outcome 1 Severity of somatic symptoms at end of treatment.

Comparison 1 Psychological therapies versus usual care or waiting list, Outcome 2 Severity of somatic symptoms within 1 year after treatment.

Comparison 1 Psychological therapies versus usual care or waiting list, Outcome 3 Severity of somatic symptoms > 1 year after treatment.

Comparison 1 Psychological therapies versus usual care or waiting list, Outcome 4 Acceptability.

Comparison 1 Psychological therapies versus usual care or waiting list, Outcome 5 Severity of anxiety symptoms at end of treatment ‐ participant rated.

Comparison 1 Psychological therapies versus usual care or waiting list, Outcome 6 Severity of anxiety symptoms at end of treatment ‐ clinician rated.

Comparison 1 Psychological therapies versus usual care or waiting list, Outcome 7 Severity of anxiety symptoms within 1 year after treatment ‐ participant rated.

Comparison 1 Psychological therapies versus usual care or waiting list, Outcome 8 Severity of anxiety symptoms within 1 year after treatment ‐ clinician rated.
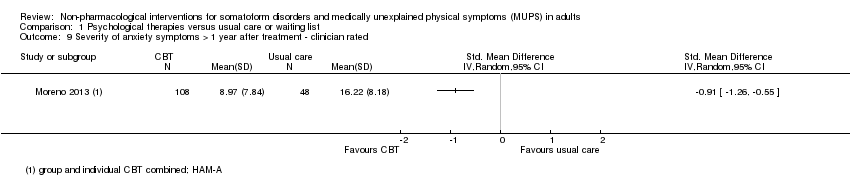
Comparison 1 Psychological therapies versus usual care or waiting list, Outcome 9 Severity of anxiety symptoms > 1 year after treatment ‐ clinician rated.

Comparison 1 Psychological therapies versus usual care or waiting list, Outcome 10 Severity of depressive symptoms at end of treatment ‐ participant rated.
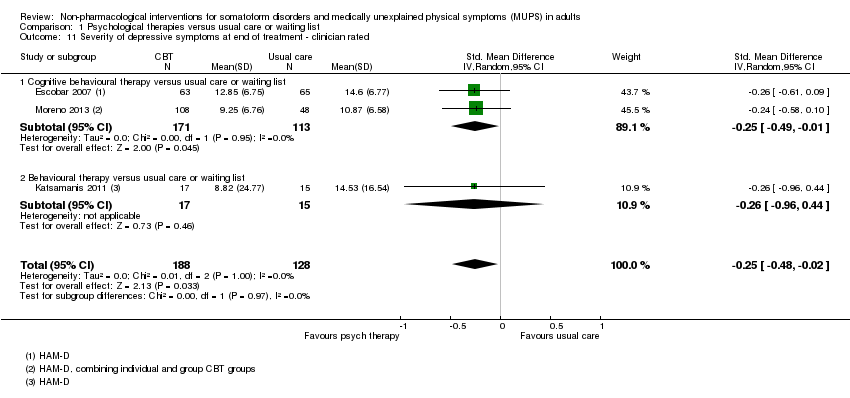
Comparison 1 Psychological therapies versus usual care or waiting list, Outcome 11 Severity of depressive symptoms at end of treatment ‐ clinician rated.
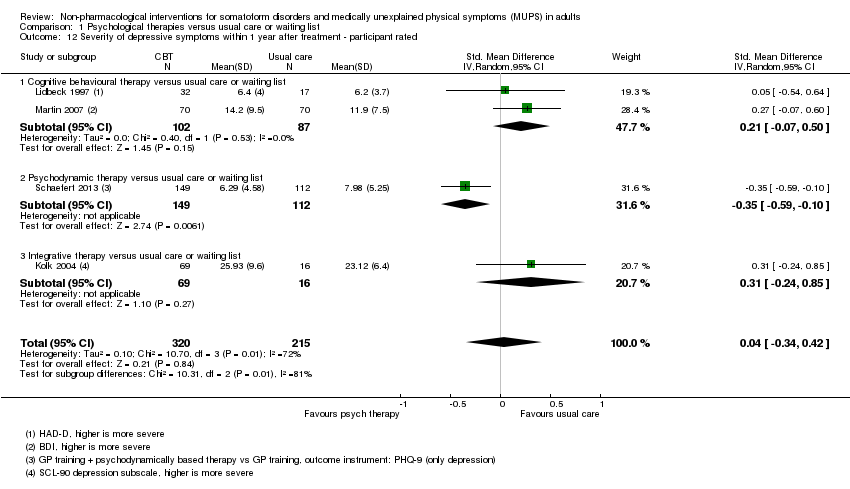
Comparison 1 Psychological therapies versus usual care or waiting list, Outcome 12 Severity of depressive symptoms within 1 year after treatment ‐ participant rated.

Comparison 1 Psychological therapies versus usual care or waiting list, Outcome 13 Severity of depressive symptoms within 1 year after treatment ‐ clinician rated.

Comparison 1 Psychological therapies versus usual care or waiting list, Outcome 14 Severity of depressive symptoms > 1 year after treatment ‐ clinician rated.

Comparison 1 Psychological therapies versus usual care or waiting list, Outcome 15 Dysfunctional cognitions, emotions and behaviours at end of treatment.

Comparison 1 Psychological therapies versus usual care or waiting list, Outcome 16 Dysfunctional cognitions, emotions, and behaviours within 1 year after treatment.

Comparison 1 Psychological therapies versus usual care or waiting list, Outcome 17 Adverse events.
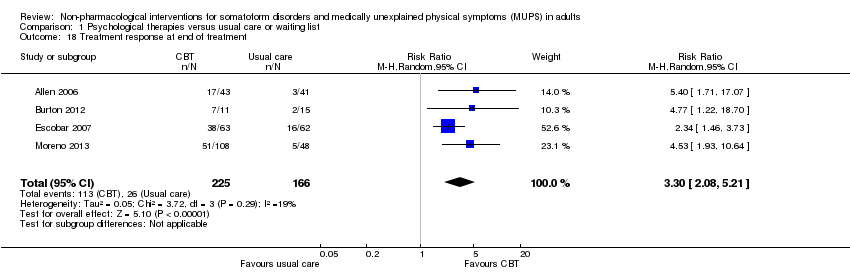
Comparison 1 Psychological therapies versus usual care or waiting list, Outcome 18 Treatment response at end of treatment.

Comparison 1 Psychological therapies versus usual care or waiting list, Outcome 19 Treatment response within 1 year after treatment.
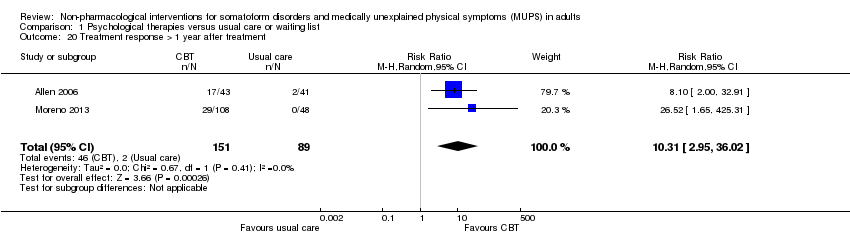
Comparison 1 Psychological therapies versus usual care or waiting list, Outcome 20 Treatment response > 1 year after treatment.
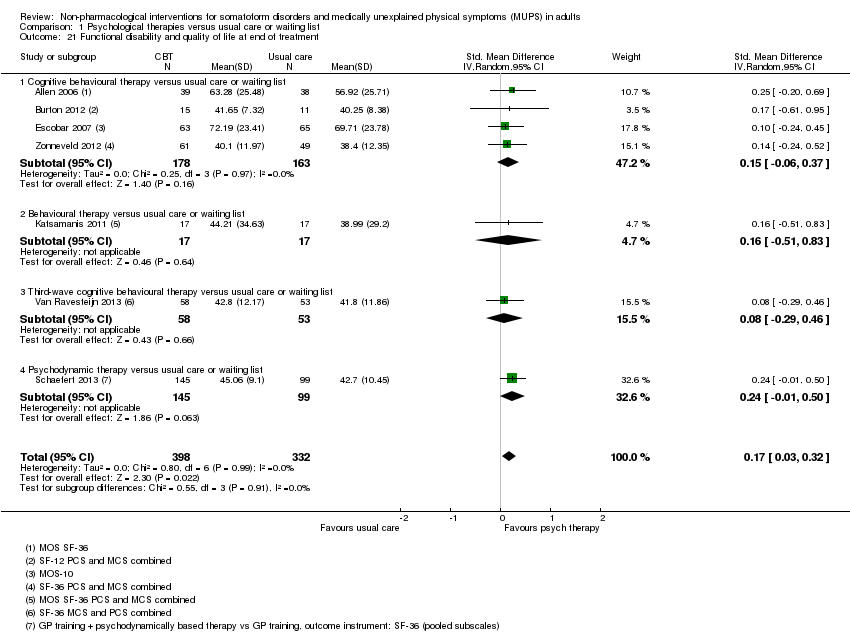
Comparison 1 Psychological therapies versus usual care or waiting list, Outcome 21 Functional disability and quality of life at end of treatment.
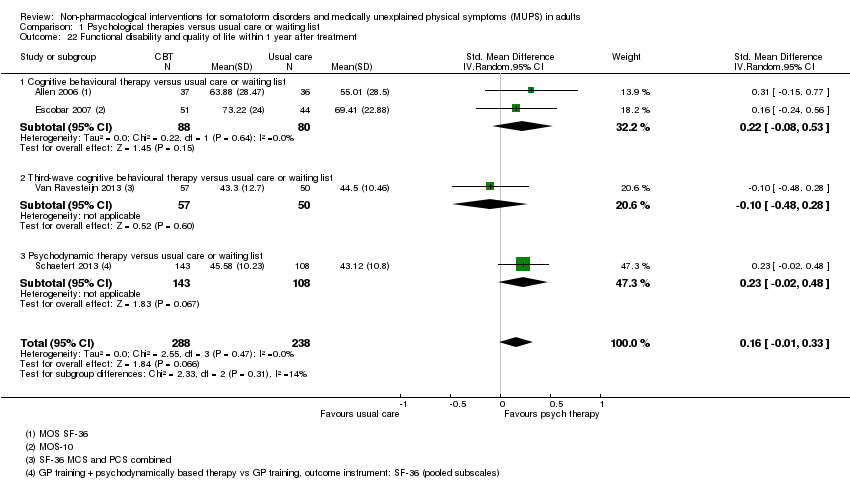
Comparison 1 Psychological therapies versus usual care or waiting list, Outcome 22 Functional disability and quality of life within 1 year after treatment.
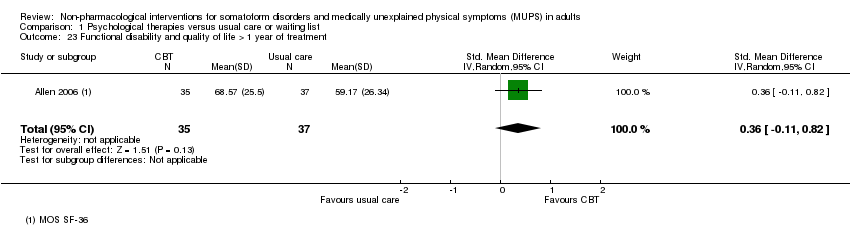
Comparison 1 Psychological therapies versus usual care or waiting list, Outcome 23 Functional disability and quality of life > 1 year of treatment.

Comparison 1 Psychological therapies versus usual care or waiting list, Outcome 24 Healthcare use at end of treatment.

Comparison 1 Psychological therapies versus usual care or waiting list, Outcome 25 Healthcare use within 1 year after treatment.
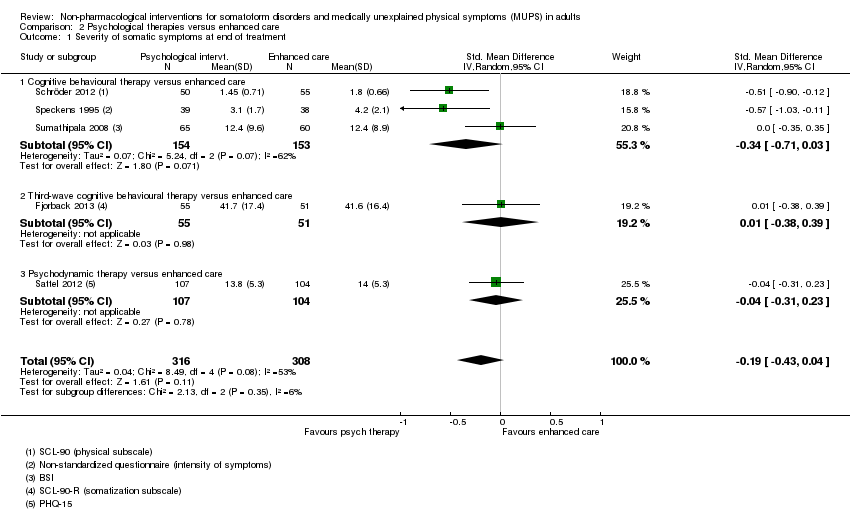
Comparison 2 Psychological therapies versus enhanced care, Outcome 1 Severity of somatic symptoms at end of treatment.

Comparison 2 Psychological therapies versus enhanced care, Outcome 2 Severity of somatic symptoms within 1 year after treatment.

Comparison 2 Psychological therapies versus enhanced care, Outcome 3 Severity of somatic symptoms > 1 year after treatment.

Comparison 2 Psychological therapies versus enhanced care, Outcome 4 Acceptability.
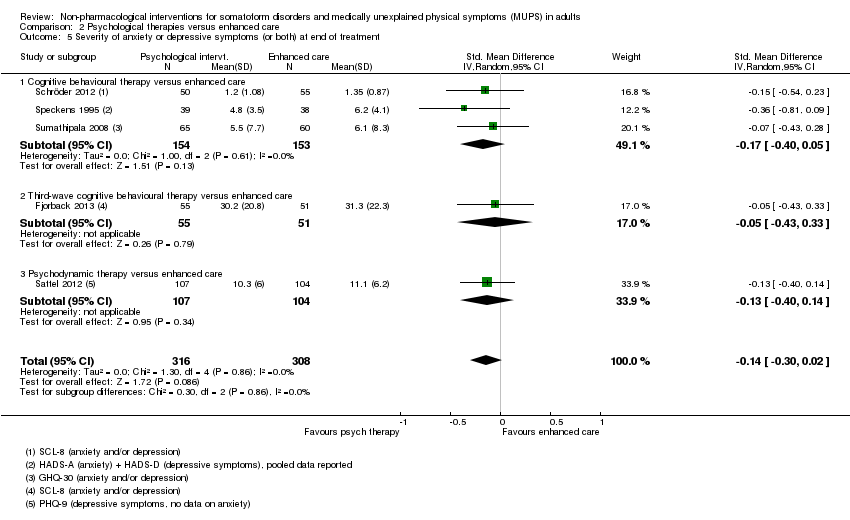
Comparison 2 Psychological therapies versus enhanced care, Outcome 5 Severity of anxiety or depressive symptoms (or both) at end of treatment.
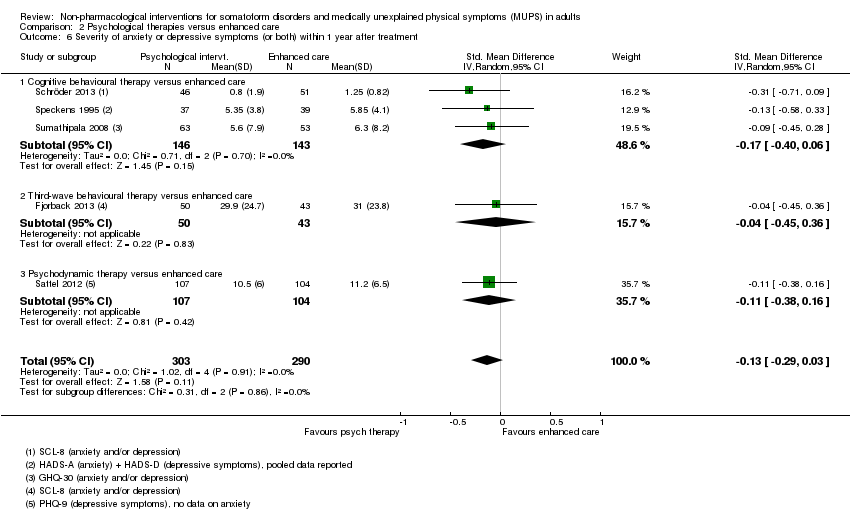
Comparison 2 Psychological therapies versus enhanced care, Outcome 6 Severity of anxiety or depressive symptoms (or both) within 1 year after treatment.

Comparison 2 Psychological therapies versus enhanced care, Outcome 7 Severity of anxiety or depressive symptoms (or both) > 1 year after treatment.
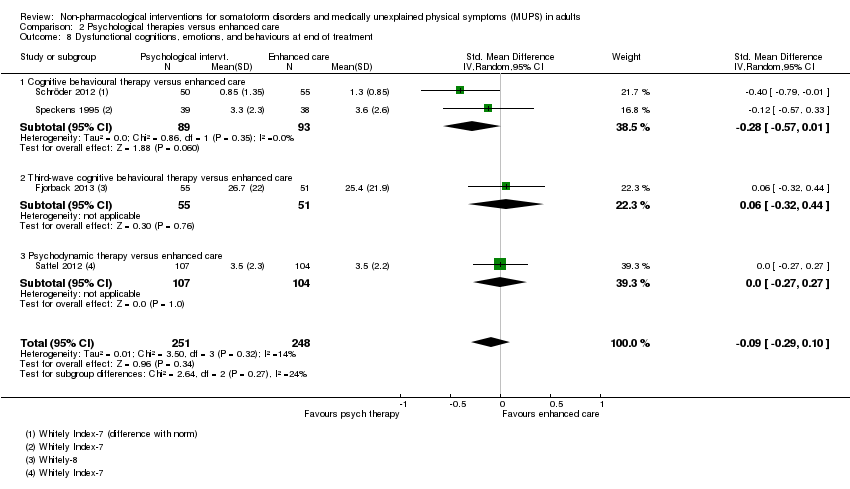
Comparison 2 Psychological therapies versus enhanced care, Outcome 8 Dysfunctional cognitions, emotions, and behaviours at end of treatment.

Comparison 2 Psychological therapies versus enhanced care, Outcome 9 Dysfunctional cognitions, emotions, and behaviours within 1 year after treatment.

Comparison 2 Psychological therapies versus enhanced care, Outcome 10 Dysfunctional cognitions, emotions, and behaviours > 1 year after treatment.

Comparison 2 Psychological therapies versus enhanced care, Outcome 11 Functional disability and quality of life at end of treatment.

Comparison 2 Psychological therapies versus enhanced care, Outcome 12 Functional disability and quality of life within 1 year after treatment.

Comparison 2 Psychological therapies versus enhanced care, Outcome 13 Functional disability and quality of life > 1 year of treatment.

Comparison 2 Psychological therapies versus enhanced care, Outcome 14 Healthcare use at end of treatment.

Comparison 2 Psychological therapies versus enhanced care, Outcome 15 Healthcare use within 1 year after treatment.
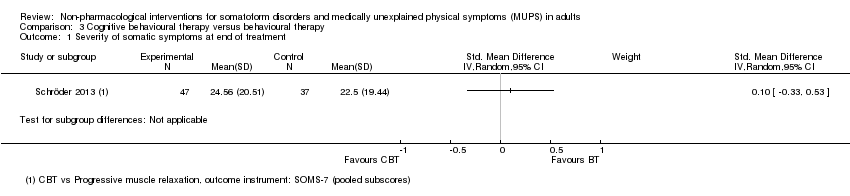
Comparison 3 Cognitive behavioural therapy versus behavioural therapy, Outcome 1 Severity of somatic symptoms at end of treatment.

Comparison 3 Cognitive behavioural therapy versus behavioural therapy, Outcome 2 Acceptability.

Comparison 3 Cognitive behavioural therapy versus behavioural therapy, Outcome 3 Severity of anxiety or depressive symptoms (or both) at end of treatment.

Comparison 3 Cognitive behavioural therapy versus behavioural therapy, Outcome 4 Functional disability and quality of life at end of treatment.
| Psychological therapy compared with usual care for somatoform disorders and medically unexplained physical symptoms | ||||||
| Patient or population: people with somatoform disorders and medically unexplained physical symptoms | ||||||
| Outcomes | Illustrative comparative risks* (95% CI) | Relative effect | No of participants | Quality of the evidence | Comments | |
| Assumed risk | Corresponding risk | |||||
| Usual care | Psychological therapy | |||||
| Severity of somatic symptoms at end of treatment | The mean severity of somatic symptoms at end of treatment ranged across control groups from | The mean severity of somatic symptoms at end of treatment in the intervention groups was | ‐ | 1081 | ⊕⊕⊝⊝ | A difference of 0.34 SMD was considered to be 'small to medium' |
| Acceptability | 896 per 1000 | 833 per 1000 | RR 0.93 | 1644 | ⊕⊕⊕⊝ | Excluding the outlier (see footnote) (70 participants) reduced I2 statistic from 70% to 33% |
| Dysfunctional cognitions, emotions, or behaviours (participant rated) at end of treatment | The mean dysfunctional cognitions, emotions, or behaviours (participant rated) at end of treatment in the control groups was | The mean dysfunctional cognitions, emotions, or behaviours (participant rated) at end of treatment in the intervention groups was | ‐ | 440 | ⊕⊕⊕⊝ | A difference of 0.11 SMD was considered to be 'small' |
| Treatment response at end of treatment | 157 per 1000 | 517 per 1000 | RR 3.30 | 391 | ⊕⊕⊝⊝ | ‐ |
| Functional disability/quality of life at end of treatment | ‐ | The mean functional disability/quality of life at end of treatment in the intervention groups was | ‐ | 730 | ⊕⊕⊝⊝ | A difference of 0.17 SMD was considered to be small |
| Healthcare use | ‐ | The mean healthcare use in the intervention groups was | ‐ | 532 | ⊕⊕⊕⊝ | Difference small and not statistically significant |
| *The basis for the assumed risk (e.g. the median control group risk across studies) is provided in footnotes. The corresponding risk (and its 95% confidence interval) is based on the assumed risk in the comparison group and the relative effect of the intervention (and its 95% CI). | ||||||
| GRADE Working Group grades of evidence | ||||||
| 1 Measured with different instruments using different scales. | ||||||
| Patient or population: somatoform disorders and medically unexplained physical symptoms | ||||||
| Outcomes | Illustrative comparative risks* (95% CI) | Relative effect | No of participants | Quality of the evidence | Comments | |
| Assumed risk | Corresponding risk | |||||
| Enhanced or structured care | Psychological therapies | |||||
| Severity of somatic symptoms at end of treatment | ‐ | The mean severity of somatic symptoms at end of treatment in the intervention groups was | ‐ | 624 | ⊕⊕⊕⊝ | 95% CI excluded large effect (> 0.5 SMD) |
| Acceptability | 904 per 1000 | 841 per 1000 | RR 0.93 | 679 | ⊕⊕⊕⊝ | ‐ |
| Dysfunctional cognitions, emotions, or behaviours at end of treatment | ‐ | The mean dysfunctional cognitions, emotions, or behaviours at end of treatment in the intervention groups was | ‐ | 499 | ⊕⊕⊕⊝ | 95% CI excluded clinically relevant effect |
| Treatment response at end of treatment | Study population | Not estimable | 0 | See comment | No studies reported on this outcome (see text) | |
| See comment | See comment | |||||
| Moderate | ||||||
| ‐ | ‐ | |||||
| Functional disability/quality of life at end of treatment | ‐ | The mean functional disability/quality of life at end of treatment in the intervention groups was | ‐ | 497 | ⊕⊕⊕⊝ | 95% CI excluded clinically relevant effect |
| Healthcare use within 1 year after treatment | ‐ | The mean healthcare use within 1 year after treatment in the intervention groups was | ‐ | 319 | ⊕⊕⊝⊝ | ‐ |
| *The basis for the assumed risk (e.g. the median control group risk across studies) is provided in footnotes. The corresponding risk (and its 95% confidence interval) is based on the assumed risk in the comparison group and the relative effect of the intervention (and its 95% CI). | ||||||
| GRADE Working Group grades of evidence | ||||||
| 1 Analysis 2.1. 11 No blinding (all studies) and >20% loss to follow up (2 studies) | ||||||
| Eligible for this review? | |||
| DSM‐IV | ICD‐10 | YES | NO |
| Somatisation disorder | Somatisation disorder | x | ‐ |
| Undifferentiated somatoform disorder (duration > 6 months) | Undifferentiated somatoform disorder (duration > 6 months) | x | ‐ |
| ‐ | Somatoform autonomic dysfunction | x | ‐ |
| Pain disorder | Persistent somatoform pain disorder | x | ‐ |
| Somatoform disorders, unspecified | Somatoform disorders unspecified | x | ‐ |
| Hypochondriasis | Hypochondriacal disorder | ‐ | x |
| ‐ | Other somatoform disorders | ‐ | x |
| Body dysmorphic disorder | Body dysmorphic disorder | ‐ | x |
| Conversion disorder | Dissociative and conversion disorders | ‐ | x |
| YES | NO | ||
| Alternative somatoform diagnoses (such as abridged somatisation disorder or multisomatoform disorder) | x | ‐ | |
| Chronic MUPS (duration ≥ 6 months) | x | ‐ | |
| Functional somatic syndromes | ‐ | x | |
| Specific functional somatic symptoms | ‐ | x | |
| DSM: Diagnostic and Statistical Manual of Mental Disorders; ICD: International Classification of Diseases. | |||
| Intervention | Group/alone | Duration | Number of sessions | Therapist | Comparison | duration of follow‐up | |
| Martin 2007 | CBT | group | once | 1 | psychologist and psychotherapeutic specialist | usual care | 6 months |
| Burton 2012 | psychological therapy in symptoms clinic | alone | 3 months | 4 | experienced specialised GP | usual care | 3 months |
| Schweickhardt 2007 | psychotherapy | alone | 2 weeks | 5 | psychotherapists | psychoeducational reading material | 6 months |
| Sumathipala 2000 | CBT | alone | 3 months | 6 | research psychiatrist | usual care | 3 months |
| Sumathipala 2008 | CBT | alone | 3 months | 6 | trained primary care physician | enhanced treatment as usual | 12 months |
| Schröder 2013 | CBT | group | 2 months | 8 | psychotherapist | progressive muscle relaxation | 6 months |
| Van Ravensteijn 2013 | mindfullness‐based cognitive therapy | group | 2 months | 8 | experienced mindfullness trainer | enhanced treatment as usual | 9 months |
| Fjorback 2013 | mindfullness | group | 3 months | 8 | experienced psychiatrist | enhanced treatment as usual | 15 months |
| Kashner 1995 | group psychological intervention + CL | group | 4 months | 8 | master level clinician | consultation letter | 12 months |
| Lidbeck 1997 | CBT | group | 3 months | 9 | trained physician | waiting list | 9 months |
| Schroder 2012 | stress intervention (psychotherapy + letter etc) | group + alone | 4 months | 9 | consultant or senior resident psychiatry | enhanced treatment as usual | 16 months |
| Katsamanis 2011 | psychophysiologic treatment + psychiatric consultation | alone | 10 weeks | 10 | psychologist or biofeedback clinician | psychiatric consultation | 10 weeks |
| Moreno 2013 | CBT + Letter (1) CBT + Letter (2) | alone (1) group (2) | 10 weeks | 10 | psychologist | usual care + letter | 12 months |
| Allen 2006 | CBT + psychiatric consultation | alone | 3 months | 10 | trained and experienced psychologist | psychiatric consultation | 15 months |
| Escobar 2007 | CBT + psychiatric consultation letter | alone | 3 months | 10 | therapist | usual care + PCL | 9 moths |
| Sattel 2012 | psychodynamic interpersonal psychotherapy | alone | 3 months | 12 | psychologist or physician with psychotherapy experience | enhanced treatment as usual | 9 months |
| Schaefert 2013 | GP training in MUPS + interpersonal psychodynamically based therapy | group | 9 months | 12 | psychosomatic specialist | GP training in MUPS | 12 months |
| Zonneveld 2012 | CBT | group | 13 weeks | 13 | psychologist | waiting list | 13 weeks |
| Schilte 2001 | disclosure intervention | alone | unclear | unclear | trained disclosure doctor | usual care | 24 months |
| Speckens 1995 | CBT | alone | 6 months | 6‐16 | trained physician and behavioural therapist | enhanced treatment as usual | 12 months |
| Kolk 2004 | psychological intervention (varied) | alone | max 6 months | max 12 | trained therapist | usual care | 12 months |
| CBT: cognitive behavioural therapy; GP: general practitioner; max: maximum; MUPS: medically unexplained physical symptoms. | |||||||
| Outcome or subgroup title | No. of studies | No. of participants | Statistical method | Effect size |
| 1 Severity of somatic symptoms at end of treatment Show forest plot | 10 | 1081 | Std. Mean Difference (IV, Random, 95% CI) | ‐0.34 [‐0.53, ‐0.16] |
| 1.1 Cognitive behavioural therapy versus usual care or waiting list | 6 | 593 | Std. Mean Difference (IV, Random, 95% CI) | ‐0.37 [‐0.69, ‐0.05] |
| 1.2 Behavioural therapy versus usual care or waiting list | 1 | 37 | Std. Mean Difference (IV, Random, 95% CI) | ‐0.22 [‐0.87, 0.43] |
| 1.3 Third‐wave cognitive behavioural therapy versus usual care or waiting list | 1 | 114 | Std. Mean Difference (IV, Random, 95% CI) | ‐0.31 [‐0.68, 0.06] |
| 1.4 Psychodynamic therapy versus usual care or waiting list | 1 | 252 | Std. Mean Difference (IV, Random, 95% CI) | ‐0.39 [‐0.64, ‐0.13] |
| 1.5 Integrative therapies versus usual care or waiting list | 1 | 85 | Std. Mean Difference (IV, Random, 95% CI) | ‐0.15 [‐0.69, 0.40] |
| 2 Severity of somatic symptoms within 1 year after treatment Show forest plot | 7 | 950 | Std. Mean Difference (IV, Random, 95% CI) | ‐0.24 [‐0.37, ‐0.11] |
| 2.1 Cognitive behavioural therapy versus usual care or waiting list | 4 | 496 | Std. Mean Difference (IV, Random, 95% CI) | ‐0.29 [‐0.49, ‐0.09] |
| 2.2 Third‐wave cognitive behavioural therapy versus usual care or waiting list | 1 | 107 | Std. Mean Difference (IV, Random, 95% CI) | ‐0.15 [‐0.53, 0.23] |
| 2.3 Psychodynamic therapy versus usual care or waiting list | 1 | 262 | Std. Mean Difference (IV, Random, 95% CI) | ‐0.20 [‐0.44, 0.05] |
| 2.4 Integrative therapies versus usual care or waiting list | 1 | 85 | Std. Mean Difference (IV, Random, 95% CI) | ‐0.15 [‐0.69, 0.40] |
| 3 Severity of somatic symptoms > 1 year after treatment Show forest plot | 2 | 228 | Std. Mean Difference (IV, Random, 95% CI) | ‐0.52 [‐0.80, ‐0.24] |
| 3.1 Cognitive behavioural therapy versus usual care or waiting list | 2 | 228 | Std. Mean Difference (IV, Random, 95% CI) | ‐0.52 [‐0.80, ‐0.24] |
| 4 Acceptability Show forest plot | 14 | 1644 | Risk Ratio (M‐H, Random, 95% CI) | 0.93 [0.88, 0.99] |
| 4.1 Cognitive behavioural therapy versus usual care or waiting list | 10 | 1037 | Risk Ratio (M‐H, Random, 95% CI) | 0.93 [0.85, 1.01] |
| 4.2 Behavioural therapy versus usual care or waiting list | 1 | 48 | Risk Ratio (M‐H, Random, 95% CI) | 0.9 [0.67, 1.21] |
| 4.3 Third‐wave cognitive behavioural therapy versus usual care or waiting list | 1 | 125 | Risk Ratio (M‐H, Random, 95% CI) | 0.85 [0.72, 1.00] |
| 4.4 Psychodynamic therapy versus usual care or waiting list | 1 | 328 | Risk Ratio (M‐H, Random, 95% CI) | 0.92 [0.88, 0.96] |
| 4.5 Integrative therapies versus usual care or waiting list | 1 | 106 | Risk Ratio (M‐H, Random, 95% CI) | 1.06 [0.81, 1.39] |
| 5 Severity of anxiety symptoms at end of treatment ‐ participant rated Show forest plot | 4 | 270 | Std. Mean Difference (IV, Random, 95% CI) | 0.06 [‐0.20, 0.32] |
| 5.1 Cognitive behavioural therapy versus usual care or waiting list | 3 | 185 | Std. Mean Difference (IV, Random, 95% CI) | 0.07 [‐0.22, 0.37] |
| 5.2 Integrative therapies versus usual care or waiting list | 1 | 85 | Std. Mean Difference (IV, Random, 95% CI) | 0.01 [‐0.53, 0.56] |
| 6 Severity of anxiety symptoms at end of treatment ‐ clinician rated Show forest plot | 3 | 320 | Std. Mean Difference (IV, Random, 95% CI) | ‐0.40 [‐0.63, ‐0.17] |
| 6.1 Cognitive behavioural therapy versus usual care | 2 | 284 | Std. Mean Difference (IV, Random, 95% CI) | ‐0.38 [‐0.63, ‐0.14] |
| 6.2 Behavioural therapy versus usual care | 1 | 36 | Std. Mean Difference (IV, Random, 95% CI) | ‐0.57 [‐1.24, 0.10] |
| 7 Severity of anxiety symptoms within 1 year after treatment ‐ participant rated Show forest plot | 2 | 134 | Std. Mean Difference (IV, Random, 95% CI) | 0.18 [‐0.22, 0.58] |
| 7.1 Cognitive behavioural therapy versus usual care or waiting list | 1 | 49 | Std. Mean Difference (IV, Random, 95% CI) | 0.0 [‐0.59, 0.59] |
| 7.2 Integrative therapies versus usual care or waiting list | 1 | 85 | Std. Mean Difference (IV, Random, 95% CI) | 0.33 [‐0.21, 0.88] |
| 8 Severity of anxiety symptoms within 1 year after treatment ‐ clinician rated Show forest plot | 2 | 251 | Std. Mean Difference (IV, Random, 95% CI) | ‐0.66 [‐1.15, ‐0.18] |
| 9 Severity of anxiety symptoms > 1 year after treatment ‐ clinician rated Show forest plot | 1 | Std. Mean Difference (IV, Random, 95% CI) | Totals not selected | |
| 10 Severity of depressive symptoms at end of treatment ‐ participant rated Show forest plot | 6 | 661 | Std. Mean Difference (IV, Random, 95% CI) | ‐0.03 [‐0.22, 0.16] |
| 10.1 Cognitive behavioural therapy versus usual care or waiting list | 4 | 325 | Std. Mean Difference (IV, Random, 95% CI) | 0.09 [‐0.13, 0.31] |
| 10.2 Psychodynamic therapy versus usual care or waiting list | 1 | 251 | Std. Mean Difference (IV, Random, 95% CI) | ‐0.30 [‐0.55, ‐0.04] |
| 10.3 Integrative therapy versus usual care or waiting list | 1 | 85 | Std. Mean Difference (IV, Random, 95% CI) | 0.10 [‐0.45, 0.64] |
| 11 Severity of depressive symptoms at end of treatment ‐ clinician rated Show forest plot | 3 | 316 | Std. Mean Difference (IV, Random, 95% CI) | ‐0.25 [‐0.48, ‐0.02] |
| 11.1 Cognitive behavioural therapy versus usual care or waiting list | 2 | 284 | Std. Mean Difference (IV, Random, 95% CI) | ‐0.25 [‐0.49, ‐0.01] |
| 11.2 Behavioural therapy versus usual care or waiting list | 1 | 32 | Std. Mean Difference (IV, Random, 95% CI) | ‐0.26 [‐0.96, 0.44] |
| 12 Severity of depressive symptoms within 1 year after treatment ‐ participant rated Show forest plot | 4 | 535 | Std. Mean Difference (IV, Random, 95% CI) | 0.04 [‐0.34, 0.42] |
| 12.1 Cognitive behavioural therapy versus usual care or waiting list | 2 | 189 | Std. Mean Difference (IV, Random, 95% CI) | 0.21 [‐0.07, 0.50] |
| 12.2 Psychodynamic therapy versus usual care or waiting list | 1 | 261 | Std. Mean Difference (IV, Random, 95% CI) | ‐0.35 [‐0.59, ‐0.10] |
| 12.3 Integrative therapy versus usual care or waiting list | 1 | 85 | Std. Mean Difference (IV, Random, 95% CI) | 0.31 [‐0.24, 0.85] |
| 13 Severity of depressive symptoms within 1 year after treatment ‐ clinician rated Show forest plot | 2 | 251 | Std. Mean Difference (IV, Random, 95% CI) | ‐0.55 [‐1.17, 0.07] |
| 14 Severity of depressive symptoms > 1 year after treatment ‐ clinician rated Show forest plot | 1 | Std. Mean Difference (IV, Random, 95% CI) | Totals not selected | |
| 15 Dysfunctional cognitions, emotions and behaviours at end of treatment Show forest plot | 3 | 440 | Std. Mean Difference (IV, Random, 95% CI) | ‐0.11 [‐0.37, 0.16] |
| 15.1 Cognitive behavioural therapy versus usual care or waiting list | 2 | 189 | Std. Mean Difference (IV, Random, 95% CI) | ‐0.15 [‐0.73, 0.44] |
| 15.2 Psychodynamic therapy versus usual care or waiting list | 1 | 251 | Std. Mean Difference (IV, Random, 95% CI) | ‐0.14 [‐0.39, 0.12] |
| 16 Dysfunctional cognitions, emotions, and behaviours within 1 year after treatment Show forest plot | 3 | 451 | Std. Mean Difference (IV, Random, 95% CI) | ‐0.16 [‐0.38, 0.07] |
| 16.1 Cognitive behavioural therapy versus usual care or waiting list | 2 | 189 | Std. Mean Difference (IV, Random, 95% CI) | ‐0.25 [‐0.79, 0.30] |
| 16.2 Psychodynamic therapy versus usual care or waiting list | 1 | 262 | Std. Mean Difference (IV, Random, 95% CI) | ‐0.13 [‐0.38, 0.11] |
| 17 Adverse events Show forest plot | 3 | 445 | Risk Ratio (M‐H, Random, 95% CI) | 1.31 [0.47, 3.66] |
| 18 Treatment response at end of treatment Show forest plot | 4 | 391 | Risk Ratio (M‐H, Random, 95% CI) | 3.30 [2.08, 5.21] |
| 19 Treatment response within 1 year after treatment Show forest plot | 3 | 332 | Risk Ratio (M‐H, Random, 95% CI) | 2.53 [1.25, 5.10] |
| 20 Treatment response > 1 year after treatment Show forest plot | 2 | 240 | Risk Ratio (M‐H, Random, 95% CI) | 10.31 [2.95, 36.02] |
| 21 Functional disability and quality of life at end of treatment Show forest plot | 7 | 730 | Std. Mean Difference (IV, Random, 95% CI) | 0.17 [0.03, 0.32] |
| 21.1 Cognitive behavioural therapy versus usual care or waiting list | 4 | 341 | Std. Mean Difference (IV, Random, 95% CI) | 0.15 [‐0.06, 0.37] |
| 21.2 Behavioural therapy versus usual care or waiting list | 1 | 34 | Std. Mean Difference (IV, Random, 95% CI) | 0.16 [‐0.51, 0.83] |
| 21.3 Third‐wave cognitive behavioural therapy versus usual care or waiting list | 1 | 111 | Std. Mean Difference (IV, Random, 95% CI) | 0.08 [‐0.29, 0.46] |
| 21.4 Psychodynamic therapy versus usual care or waiting list | 1 | 244 | Std. Mean Difference (IV, Random, 95% CI) | 0.24 [‐0.01, 0.50] |
| 22 Functional disability and quality of life within 1 year after treatment Show forest plot | 4 | 526 | Std. Mean Difference (IV, Random, 95% CI) | 0.16 [‐0.01, 0.33] |
| 22.1 Cognitive behavioural therapy versus usual care or waiting list | 2 | 168 | Std. Mean Difference (IV, Random, 95% CI) | 0.22 [‐0.08, 0.53] |
| 22.2 Third‐wave cognitive behavioural therapy versus usual care or waiting list | 1 | 107 | Std. Mean Difference (IV, Random, 95% CI) | ‐0.10 [‐0.48, 0.28] |
| 22.3 Psychodynamic therapy versus usual care or waiting list | 1 | 251 | Std. Mean Difference (IV, Random, 95% CI) | 0.23 [‐0.02, 0.48] |
| 23 Functional disability and quality of life > 1 year of treatment Show forest plot | 1 | 72 | Std. Mean Difference (IV, Random, 95% CI) | 0.36 [‐0.11, 0.82] |
| 24 Healthcare use at end of treatment Show forest plot | 2 | 117 | Std. Mean Difference (IV, Random, 95% CI) | ‐0.68 [‐1.06, ‐0.30] |
| 25 Healthcare use within 1 year after treatment Show forest plot | 4 | 532 | Std. Mean Difference (IV, Random, 95% CI) | ‐0.09 [‐0.31, 0.12] |
| 25.1 Cognitive behavioural therapy versus usual care or waiting list | 2 | 189 | Std. Mean Difference (IV, Random, 95% CI) | ‐0.27 [‐0.56, 0.02] |
| 25.2 Integrative therapies versus usual care or waiting list | 1 | 81 | Std. Mean Difference (IV, Random, 95% CI) | 0.13 [‐0.44, 0.69] |
| 25.3 Psychodynamic therapy versus usual care or waiting list | 1 | 262 | Std. Mean Difference (IV, Random, 95% CI) | 0.02 [‐0.23, 0.26] |
| Outcome or subgroup title | No. of studies | No. of participants | Statistical method | Effect size |
| 1 Severity of somatic symptoms at end of treatment Show forest plot | 5 | 624 | Std. Mean Difference (IV, Random, 95% CI) | ‐0.19 [‐0.43, 0.04] |
| 1.1 Cognitive behavioural therapy versus enhanced care | 3 | 307 | Std. Mean Difference (IV, Random, 95% CI) | ‐0.34 [‐0.71, 0.03] |
| 1.2 Third‐wave cognitive behavioural therapy versus enhanced care | 1 | 106 | Std. Mean Difference (IV, Random, 95% CI) | 0.01 [‐0.38, 0.39] |
| 1.3 Psychodynamic therapy versus enhanced care | 1 | 211 | Std. Mean Difference (IV, Random, 95% CI) | ‐0.04 [‐0.31, 0.23] |
| 2 Severity of somatic symptoms within 1 year after treatment Show forest plot | 5 | 593 | Std. Mean Difference (IV, Random, 95% CI) | ‐0.21 [‐0.40, ‐0.02] |
| 2.1 Cognitive behavioural therapy versus enhanced care | 3 | 289 | Std. Mean Difference (IV, Random, 95% CI) | ‐0.30 [‐0.60, ‐0.00] |
| 2.2 Third‐wave cognitive behavioural therapy versus enhanced care | 1 | 93 | Std. Mean Difference (IV, Random, 95% CI) | 0.05 [‐0.36, 0.46] |
| 2.3 Psychodynamic therapy versus enhanced care | 1 | 211 | Std. Mean Difference (IV, Random, 95% CI) | ‐0.20 [‐0.47, 0.07] |
| 3 Severity of somatic symptoms > 1 year after treatment Show forest plot | 2 | 172 | Std. Mean Difference (IV, Random, 95% CI) | ‐0.32 [‐0.73, 0.10] |
| 3.1 Cognitive behavioural therapy versus enhanced care | 1 | 82 | Std. Mean Difference (IV, Random, 95% CI) | ‐0.53 [‐0.98, ‐0.09] |
| 3.2 Third‐wave cognitive behavioural therapy versus enhanced care | 1 | 90 | Std. Mean Difference (IV, Random, 95% CI) | ‐0.11 [‐0.53, 0.30] |
| 4 Acceptability Show forest plot | 5 | 679 | Risk Ratio (M‐H, Random, 95% CI) | 0.93 [0.87, 1.00] |
| 4.1 Cognitive behavioural therapy versus enhanced care | 3 | 349 | Risk Ratio (M‐H, Random, 95% CI) | 0.91 [0.82, 1.02] |
| 4.2 Third‐wave cognitive behavioural therapy versus enhanced care | 1 | 119 | Risk Ratio (M‐H, Random, 95% CI) | 0.91 [0.82, 1.01] |
| 4.3 Psychodynamic therapy versus enhanced care | 1 | 211 | Risk Ratio (M‐H, Random, 95% CI) | 1.01 [0.89, 1.14] |
| 5 Severity of anxiety or depressive symptoms (or both) at end of treatment Show forest plot | 5 | 624 | Std. Mean Difference (IV, Random, 95% CI) | ‐0.14 [‐0.30, 0.02] |
| 5.1 Cognitive behavioural therapy versus enhanced care | 3 | 307 | Std. Mean Difference (IV, Random, 95% CI) | ‐0.17 [‐0.40, 0.05] |
| 5.2 Third‐wave cognitive behavioural therapy versus enhanced care | 1 | 106 | Std. Mean Difference (IV, Random, 95% CI) | ‐0.05 [‐0.43, 0.33] |
| 5.3 Psychodynamic therapy versus enhanced care | 1 | 211 | Std. Mean Difference (IV, Random, 95% CI) | ‐0.13 [‐0.40, 0.14] |
| 6 Severity of anxiety or depressive symptoms (or both) within 1 year after treatment Show forest plot | 5 | 593 | Std. Mean Difference (IV, Random, 95% CI) | ‐0.13 [‐0.29, 0.03] |
| 6.1 Cognitive behavioural therapy versus enhanced care | 3 | 289 | Std. Mean Difference (IV, Random, 95% CI) | ‐0.17 [‐0.40, 0.06] |
| 6.2 Third‐wave behavioural therapy versus enhanced care | 1 | 93 | Std. Mean Difference (IV, Random, 95% CI) | ‐0.04 [‐0.45, 0.36] |
| 6.3 Psychodynamic therapy versus enhanced care | 1 | 211 | Std. Mean Difference (IV, Random, 95% CI) | ‐0.11 [‐0.38, 0.16] |
| 7 Severity of anxiety or depressive symptoms (or both) > 1 year after treatment Show forest plot | 2 | 184 | Std. Mean Difference (IV, Random, 95% CI) | ‐0.26 [‐0.55, 0.03] |
| 7.1 Cognitive behavioural therapy versus enhanced care | 1 | 94 | Std. Mean Difference (IV, Random, 95% CI) | ‐0.36 [‐0.77, 0.04] |
| 7.2 Third‐wave cognitive behavioural therapy versus enhanced care | 1 | 90 | Std. Mean Difference (IV, Random, 95% CI) | ‐0.15 [‐0.56, 0.26] |
| 8 Dysfunctional cognitions, emotions, and behaviours at end of treatment Show forest plot | 4 | 499 | Std. Mean Difference (IV, Random, 95% CI) | ‐0.09 [‐0.29, 0.10] |
| 8.1 Cognitive behavioural therapy versus enhanced care | 2 | 182 | Std. Mean Difference (IV, Random, 95% CI) | ‐0.28 [‐0.57, 0.01] |
| 8.2 Third‐wave cognitive behavioural therapy versus enhanced care | 1 | 106 | Std. Mean Difference (IV, Random, 95% CI) | 0.06 [‐0.32, 0.44] |
| 8.3 Psychodynamic therapy versus enhanced care | 1 | 211 | Std. Mean Difference (IV, Random, 95% CI) | 0.0 [‐0.27, 0.27] |
| 9 Dysfunctional cognitions, emotions, and behaviours within 1 year after treatment Show forest plot | 4 | 477 | Std. Mean Difference (IV, Random, 95% CI) | ‐0.24 [‐0.49, 0.00] |
| 9.1 Cognitive behavioural therapy versus enhanced care | 2 | 173 | Std. Mean Difference (IV, Random, 95% CI) | ‐0.45 [‐0.83, ‐0.07] |
| 9.2 Third‐wave cognitive behavioural therapy versus enhanced care | 1 | 93 | Std. Mean Difference (IV, Random, 95% CI) | ‐0.03 [‐0.44, 0.38] |
| 9.3 Psychodynamic therapy versus enhanced care | 1 | 211 | Std. Mean Difference (IV, Random, 95% CI) | ‐0.13 [‐0.40, 0.14] |
| 10 Dysfunctional cognitions, emotions, and behaviours > 1 year after treatment Show forest plot | 2 | 184 | Std. Mean Difference (IV, Random, 95% CI) | ‐0.58 [‐1.27, 0.11] |
| 10.1 Cognitive behavioural therapy versus enhanced care | 1 | 94 | Std. Mean Difference (IV, Random, 95% CI) | ‐0.94 [‐1.36, ‐0.51] |
| 10.2 Third‐wave cognitive behavioural therapy versus enhanced care | 1 | 90 | Std. Mean Difference (IV, Random, 95% CI) | ‐0.23 [‐0.64, 0.19] |
| 11 Functional disability and quality of life at end of treatment Show forest plot | 4 | 497 | Std. Mean Difference (IV, Random, 95% CI) | 0.13 [‐0.05, 0.30] |
| 11.1 Cognitive behavioural therapy versus enhanced care | 2 | 182 | Std. Mean Difference (IV, Random, 95% CI) | 0.21 [‐0.08, 0.51] |
| 11.2 Third‐wave cognitive behavioural therapy versus enhanced care | 1 | 104 | Std. Mean Difference (IV, Random, 95% CI) | 0.07 [‐0.31, 0.46] |
| 11.3 Psychodynamic therapy at end of treatment | 1 | 211 | Std. Mean Difference (IV, Random, 95% CI) | 0.08 [‐0.19, 0.35] |
| 12 Functional disability and quality of life within 1 year after treatment Show forest plot | 4 | 476 | Std. Mean Difference (IV, Random, 95% CI) | 0.20 [0.02, 0.38] |
| 12.1 Cognitive behavioural therapy versus enhanced care | 2 | 173 | Std. Mean Difference (IV, Random, 95% CI) | 0.30 [0.00, 0.60] |
| 12.2 Third‐wave cognitive behavioural therapy versus enhanced care | 1 | 92 | Std. Mean Difference (IV, Random, 95% CI) | 0.10 [‐0.31, 0.51] |
| 12.3 Psychodynamic therapy versus enhanced care | 1 | 211 | Std. Mean Difference (IV, Random, 95% CI) | 0.16 [‐0.11, 0.43] |
| 13 Functional disability and quality of life > 1 year of treatment Show forest plot | 2 | 184 | Std. Mean Difference (IV, Random, 95% CI) | 0.22 [‐0.16, 0.60] |
| 13.1 Cognitive behavioural therapy versus enhanced care | 1 | 94 | Std. Mean Difference (IV, Random, 95% CI) | 0.42 [0.01, 0.83] |
| 13.2 Third‐wave cognitive behavioural therapy versus enhanced care | 1 | 90 | Std. Mean Difference (IV, Random, 95% CI) | 0.03 [‐0.39, 0.44] |
| 14 Healthcare use at end of treatment Show forest plot | 2 | 334 | Std. Mean Difference (IV, Random, 95% CI) | ‐0.03 [‐0.33, 0.28] |
| 14.1 Cognitive behavioural therapy versus enhanced care | 1 | 123 | Std. Mean Difference (IV, Random, 95% CI) | ‐0.21 [‐0.56, 0.15] |
| 14.2 Psychodynamic therapy versus enhanced care | 1 | 211 | Std. Mean Difference (IV, Random, 95% CI) | 0.11 [‐0.16, 0.38] |
| 15 Healthcare use within 1 year after treatment Show forest plot | 2 | 319 | Std. Mean Difference (IV, Random, 95% CI) | ‐0.24 [‐0.46, ‐0.01] |
| 15.1 Cognitive behavioural therapy versus enhanced care | 1 | 108 | Std. Mean Difference (IV, Random, 95% CI) | ‐0.08 [‐0.46, 0.30] |
| 15.2 Psychodynamic therapy versus enhanced care | 1 | 211 | Std. Mean Difference (IV, Random, 95% CI) | ‐0.32 [‐0.59, ‐0.05] |
| Outcome or subgroup title | No. of studies | No. of participants | Statistical method | Effect size |
| 1 Severity of somatic symptoms at end of treatment Show forest plot | 1 | Std. Mean Difference (IV, Random, 95% CI) | Subtotals only | |
| 2 Acceptability Show forest plot | 1 | Risk Ratio (M‐H, Random, 95% CI) | Subtotals only | |
| 3 Severity of anxiety or depressive symptoms (or both) at end of treatment Show forest plot | 1 | Std. Mean Difference (IV, Random, 95% CI) | Subtotals only | |
| 4 Functional disability and quality of life at end of treatment Show forest plot | 1 | Std. Mean Difference (IV, Random, 95% CI) | Subtotals only | |