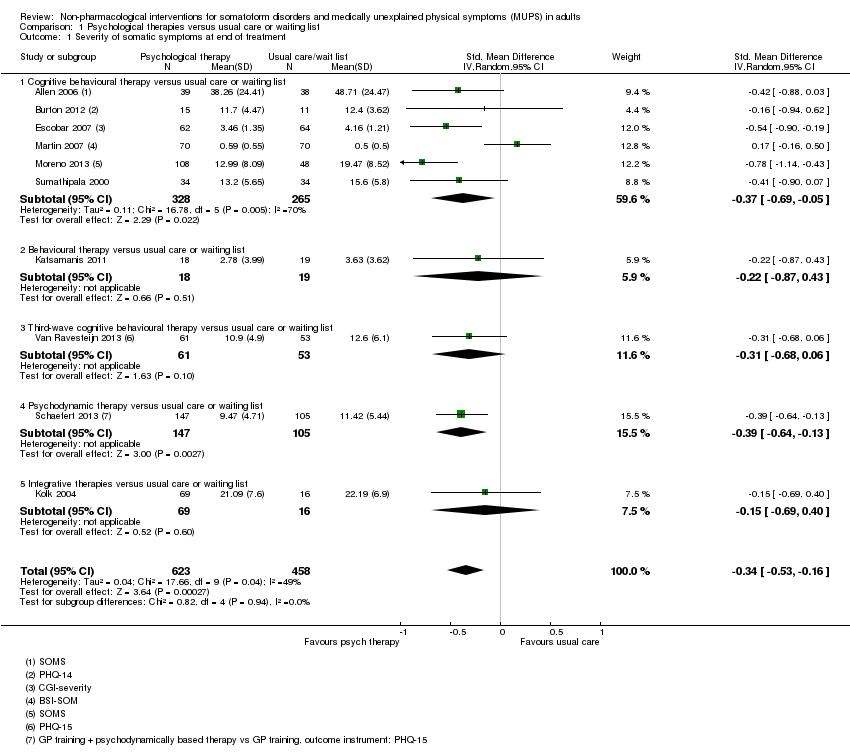
| 1 Severity of somatic symptoms at end of treatment Show forest plot | 10 | 1081 | Std. Mean Difference (IV, Random, 95% CI) | ‐0.34 [‐0.53, ‐0.16] |
|
| 1.1 Cognitive behavioural therapy versus usual care or waiting list | 6 | 593 | Std. Mean Difference (IV, Random, 95% CI) | ‐0.37 [‐0.69, ‐0.05] |
| 1.2 Behavioural therapy versus usual care or waiting list | 1 | 37 | Std. Mean Difference (IV, Random, 95% CI) | ‐0.22 [‐0.87, 0.43] |
| 1.3 Third‐wave cognitive behavioural therapy versus usual care or waiting list | 1 | 114 | Std. Mean Difference (IV, Random, 95% CI) | ‐0.31 [‐0.68, 0.06] |
| 1.4 Psychodynamic therapy versus usual care or waiting list | 1 | 252 | Std. Mean Difference (IV, Random, 95% CI) | ‐0.39 [‐0.64, ‐0.13] |
| 1.5 Integrative therapies versus usual care or waiting list | 1 | 85 | Std. Mean Difference (IV, Random, 95% CI) | ‐0.15 [‐0.69, 0.40] |
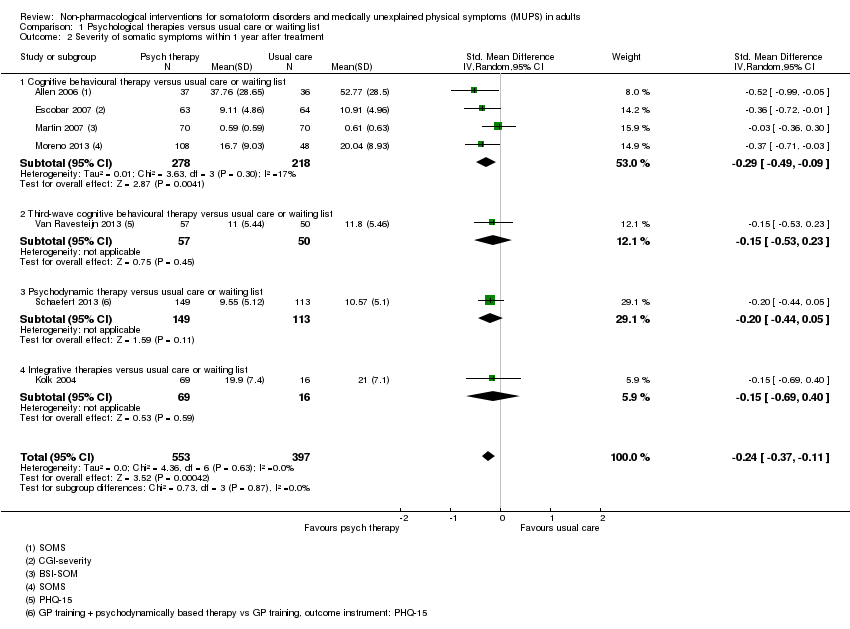
| 2 Severity of somatic symptoms within 1 year after treatment Show forest plot | 7 | 950 | Std. Mean Difference (IV, Random, 95% CI) | ‐0.24 [‐0.37, ‐0.11] |
|
| 2.1 Cognitive behavioural therapy versus usual care or waiting list | 4 | 496 | Std. Mean Difference (IV, Random, 95% CI) | ‐0.29 [‐0.49, ‐0.09] |
| 2.2 Third‐wave cognitive behavioural therapy versus usual care or waiting list | 1 | 107 | Std. Mean Difference (IV, Random, 95% CI) | ‐0.15 [‐0.53, 0.23] |
| 2.3 Psychodynamic therapy versus usual care or waiting list | 1 | 262 | Std. Mean Difference (IV, Random, 95% CI) | ‐0.20 [‐0.44, 0.05] |
| 2.4 Integrative therapies versus usual care or waiting list | 1 | 85 | Std. Mean Difference (IV, Random, 95% CI) | ‐0.15 [‐0.69, 0.40] |
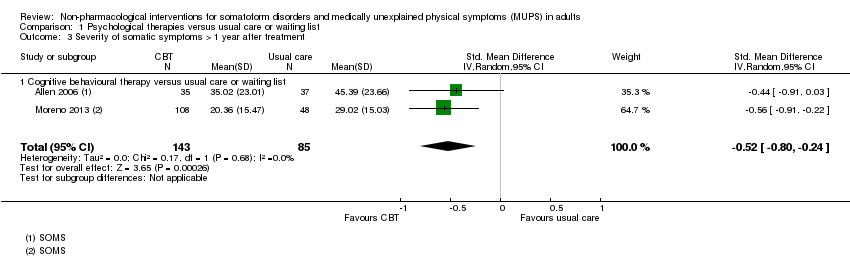
| 3 Severity of somatic symptoms > 1 year after treatment Show forest plot | 2 | 228 | Std. Mean Difference (IV, Random, 95% CI) | ‐0.52 [‐0.80, ‐0.24] |
|
| 3.1 Cognitive behavioural therapy versus usual care or waiting list | 2 | 228 | Std. Mean Difference (IV, Random, 95% CI) | ‐0.52 [‐0.80, ‐0.24] |
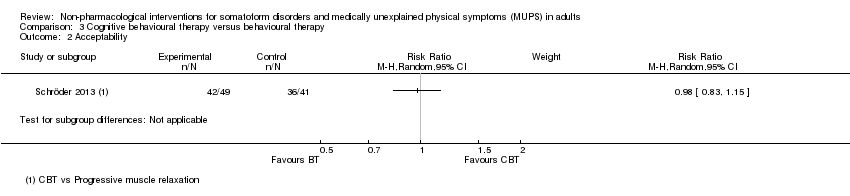
| 4 Acceptability Show forest plot | 14 | 1644 | Risk Ratio (M‐H, Random, 95% CI) | 0.93 [0.88, 0.99] |
|
| 4.1 Cognitive behavioural therapy versus usual care or waiting list | 10 | 1037 | Risk Ratio (M‐H, Random, 95% CI) | 0.93 [0.85, 1.01] |
| 4.2 Behavioural therapy versus usual care or waiting list | 1 | 48 | Risk Ratio (M‐H, Random, 95% CI) | 0.9 [0.67, 1.21] |
| 4.3 Third‐wave cognitive behavioural therapy versus usual care or waiting list | 1 | 125 | Risk Ratio (M‐H, Random, 95% CI) | 0.85 [0.72, 1.00] |
| 4.4 Psychodynamic therapy versus usual care or waiting list | 1 | 328 | Risk Ratio (M‐H, Random, 95% CI) | 0.92 [0.88, 0.96] |
| 4.5 Integrative therapies versus usual care or waiting list | 1 | 106 | Risk Ratio (M‐H, Random, 95% CI) | 1.06 [0.81, 1.39] |
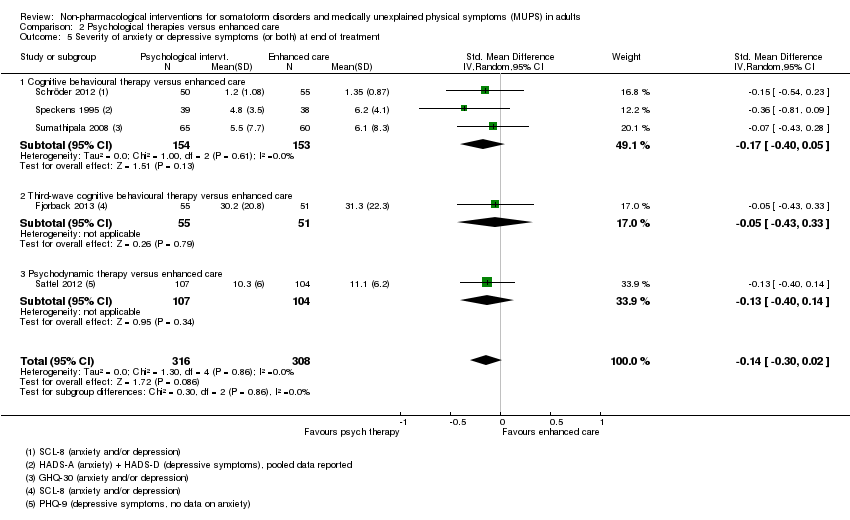
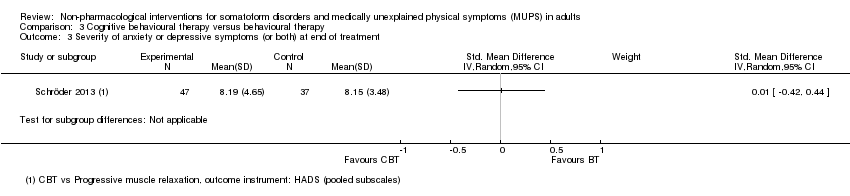
| 5 Severity of anxiety symptoms at end of treatment ‐ participant rated Show forest plot | 4 | 270 | Std. Mean Difference (IV, Random, 95% CI) | 0.06 [‐0.20, 0.32] |
|
| 5.1 Cognitive behavioural therapy versus usual care or waiting list | 3 | 185 | Std. Mean Difference (IV, Random, 95% CI) | 0.07 [‐0.22, 0.37] |
| 5.2 Integrative therapies versus usual care or waiting list | 1 | 85 | Std. Mean Difference (IV, Random, 95% CI) | 0.01 [‐0.53, 0.56] |
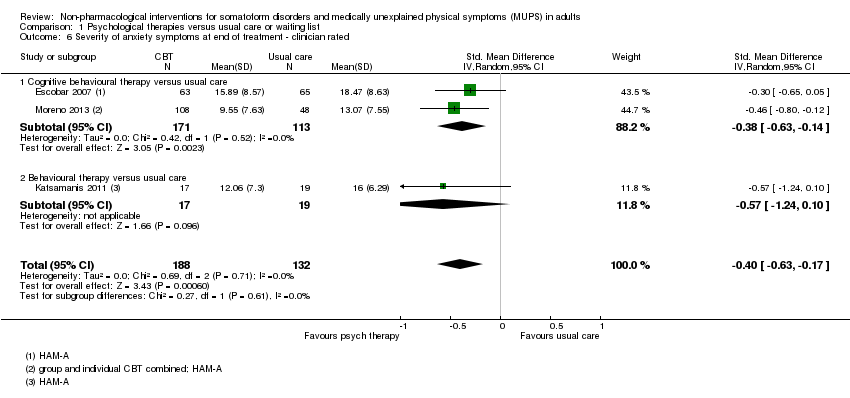
| 6 Severity of anxiety symptoms at end of treatment ‐ clinician rated Show forest plot | 3 | 320 | Std. Mean Difference (IV, Random, 95% CI) | ‐0.40 [‐0.63, ‐0.17] |
|
| 6.1 Cognitive behavioural therapy versus usual care | 2 | 284 | Std. Mean Difference (IV, Random, 95% CI) | ‐0.38 [‐0.63, ‐0.14] |
| 6.2 Behavioural therapy versus usual care | 1 | 36 | Std. Mean Difference (IV, Random, 95% CI) | ‐0.57 [‐1.24, 0.10] |
| 7 Severity of anxiety symptoms within 1 year after treatment ‐ participant rated Show forest plot | 2 | 134 | Std. Mean Difference (IV, Random, 95% CI) | 0.18 [‐0.22, 0.58] |
|
| 7.1 Cognitive behavioural therapy versus usual care or waiting list | 1 | 49 | Std. Mean Difference (IV, Random, 95% CI) | 0.0 [‐0.59, 0.59] |
| 7.2 Integrative therapies versus usual care or waiting list | 1 | 85 | Std. Mean Difference (IV, Random, 95% CI) | 0.33 [‐0.21, 0.88] |
| 8 Severity of anxiety symptoms within 1 year after treatment ‐ clinician rated Show forest plot | 2 | 251 | Std. Mean Difference (IV, Random, 95% CI) | ‐0.66 [‐1.15, ‐0.18] |
|
| 9 Severity of anxiety symptoms > 1 year after treatment ‐ clinician rated Show forest plot | 1 | | Std. Mean Difference (IV, Random, 95% CI) | Totals not selected |
|
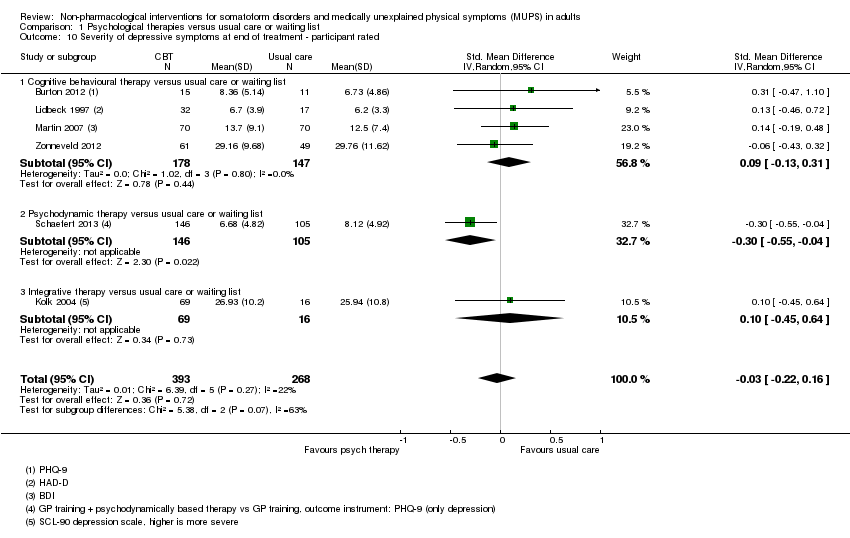
| 10 Severity of depressive symptoms at end of treatment ‐ participant rated Show forest plot | 6 | 661 | Std. Mean Difference (IV, Random, 95% CI) | ‐0.03 [‐0.22, 0.16] |
|
| 10.1 Cognitive behavioural therapy versus usual care or waiting list | 4 | 325 | Std. Mean Difference (IV, Random, 95% CI) | 0.09 [‐0.13, 0.31] |
| 10.2 Psychodynamic therapy versus usual care or waiting list | 1 | 251 | Std. Mean Difference (IV, Random, 95% CI) | ‐0.30 [‐0.55, ‐0.04] |
| 10.3 Integrative therapy versus usual care or waiting list | 1 | 85 | Std. Mean Difference (IV, Random, 95% CI) | 0.10 [‐0.45, 0.64] |
| 11 Severity of depressive symptoms at end of treatment ‐ clinician rated Show forest plot | 3 | 316 | Std. Mean Difference (IV, Random, 95% CI) | ‐0.25 [‐0.48, ‐0.02] |
|
| 11.1 Cognitive behavioural therapy versus usual care or waiting list | 2 | 284 | Std. Mean Difference (IV, Random, 95% CI) | ‐0.25 [‐0.49, ‐0.01] |
| 11.2 Behavioural therapy versus usual care or waiting list | 1 | 32 | Std. Mean Difference (IV, Random, 95% CI) | ‐0.26 [‐0.96, 0.44] |
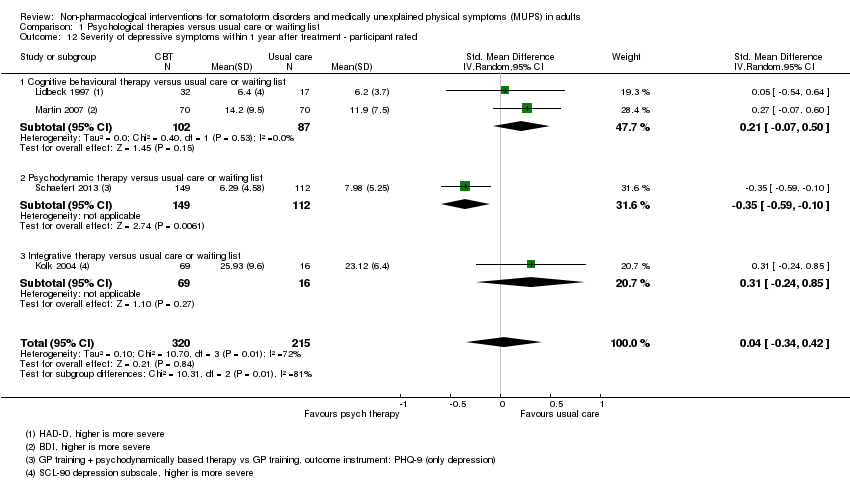
| 12 Severity of depressive symptoms within 1 year after treatment ‐ participant rated Show forest plot | 4 | 535 | Std. Mean Difference (IV, Random, 95% CI) | 0.04 [‐0.34, 0.42] |
|
| 12.1 Cognitive behavioural therapy versus usual care or waiting list | 2 | 189 | Std. Mean Difference (IV, Random, 95% CI) | 0.21 [‐0.07, 0.50] |
| 12.2 Psychodynamic therapy versus usual care or waiting list | 1 | 261 | Std. Mean Difference (IV, Random, 95% CI) | ‐0.35 [‐0.59, ‐0.10] |
| 12.3 Integrative therapy versus usual care or waiting list | 1 | 85 | Std. Mean Difference (IV, Random, 95% CI) | 0.31 [‐0.24, 0.85] |
| 13 Severity of depressive symptoms within 1 year after treatment ‐ clinician rated Show forest plot | 2 | 251 | Std. Mean Difference (IV, Random, 95% CI) | ‐0.55 [‐1.17, 0.07] |
|
| 14 Severity of depressive symptoms > 1 year after treatment ‐ clinician rated Show forest plot | 1 | | Std. Mean Difference (IV, Random, 95% CI) | Totals not selected |
|
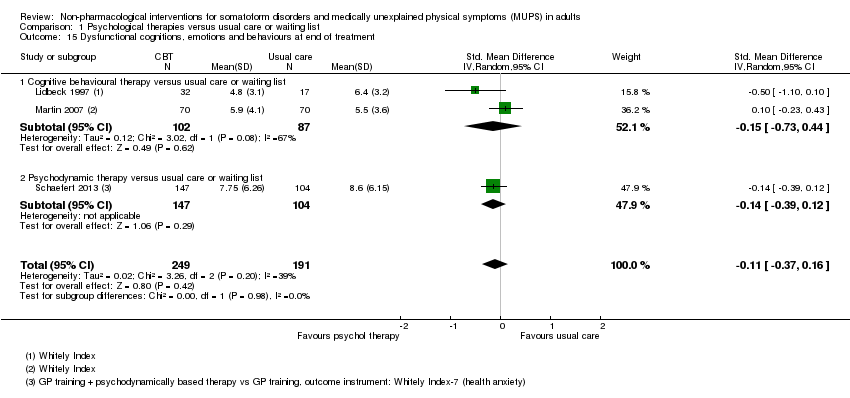
| 15 Dysfunctional cognitions, emotions and behaviours at end of treatment Show forest plot | 3 | 440 | Std. Mean Difference (IV, Random, 95% CI) | ‐0.11 [‐0.37, 0.16] |
|
| 15.1 Cognitive behavioural therapy versus usual care or waiting list | 2 | 189 | Std. Mean Difference (IV, Random, 95% CI) | ‐0.15 [‐0.73, 0.44] |
| 15.2 Psychodynamic therapy versus usual care or waiting list | 1 | 251 | Std. Mean Difference (IV, Random, 95% CI) | ‐0.14 [‐0.39, 0.12] |
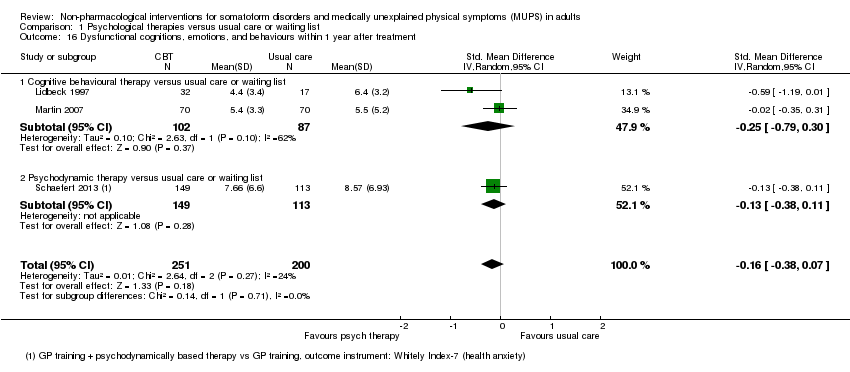
| 16 Dysfunctional cognitions, emotions, and behaviours within 1 year after treatment Show forest plot | 3 | 451 | Std. Mean Difference (IV, Random, 95% CI) | ‐0.16 [‐0.38, 0.07] |
|
| 16.1 Cognitive behavioural therapy versus usual care or waiting list | 2 | 189 | Std. Mean Difference (IV, Random, 95% CI) | ‐0.25 [‐0.79, 0.30] |
| 16.2 Psychodynamic therapy versus usual care or waiting list | 1 | 262 | Std. Mean Difference (IV, Random, 95% CI) | ‐0.13 [‐0.38, 0.11] |
| 17 Adverse events Show forest plot | 3 | 445 | Risk Ratio (M‐H, Random, 95% CI) | 1.31 [0.47, 3.66] |
|
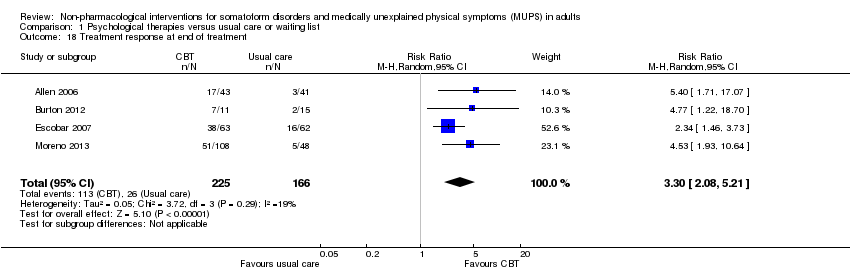
| 18 Treatment response at end of treatment Show forest plot | 4 | 391 | Risk Ratio (M‐H, Random, 95% CI) | 3.30 [2.08, 5.21] |
|
| 19 Treatment response within 1 year after treatment Show forest plot | 3 | 332 | Risk Ratio (M‐H, Random, 95% CI) | 2.53 [1.25, 5.10] |
|
| 20 Treatment response > 1 year after treatment Show forest plot | 2 | 240 | Risk Ratio (M‐H, Random, 95% CI) | 10.31 [2.95, 36.02] |
|
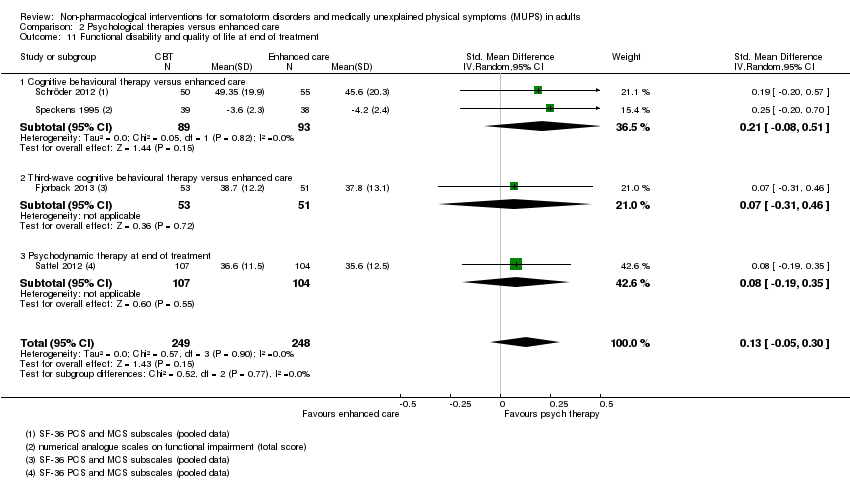
| 21 Functional disability and quality of life at end of treatment Show forest plot | 7 | 730 | Std. Mean Difference (IV, Random, 95% CI) | 0.17 [0.03, 0.32] |
|
| 21.1 Cognitive behavioural therapy versus usual care or waiting list | 4 | 341 | Std. Mean Difference (IV, Random, 95% CI) | 0.15 [‐0.06, 0.37] |
| 21.2 Behavioural therapy versus usual care or waiting list | 1 | 34 | Std. Mean Difference (IV, Random, 95% CI) | 0.16 [‐0.51, 0.83] |
| 21.3 Third‐wave cognitive behavioural therapy versus usual care or waiting list | 1 | 111 | Std. Mean Difference (IV, Random, 95% CI) | 0.08 [‐0.29, 0.46] |
| 21.4 Psychodynamic therapy versus usual care or waiting list | 1 | 244 | Std. Mean Difference (IV, Random, 95% CI) | 0.24 [‐0.01, 0.50] |
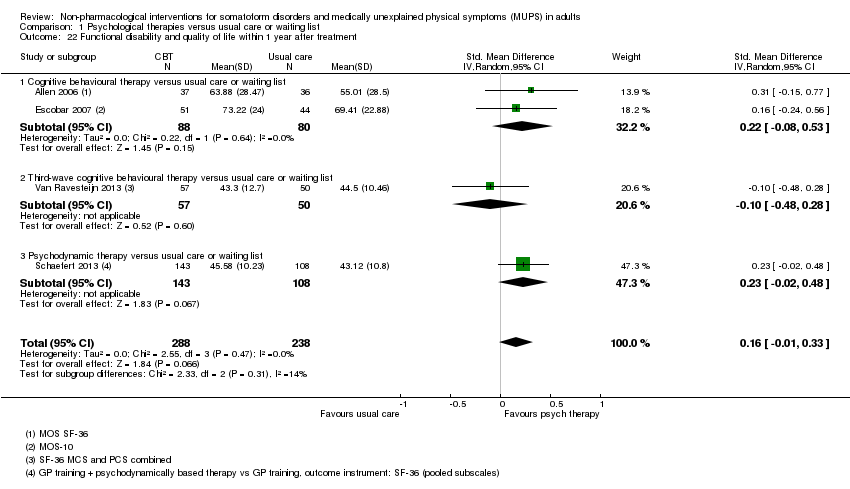
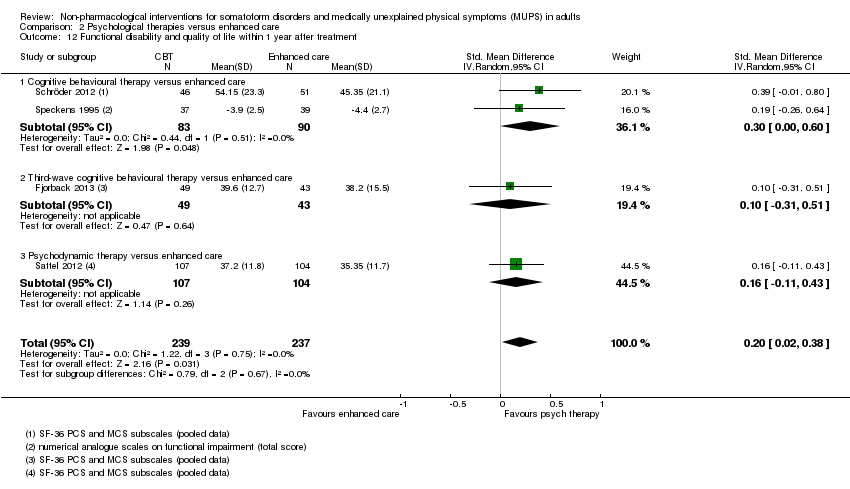
| 22 Functional disability and quality of life within 1 year after treatment Show forest plot | 4 | 526 | Std. Mean Difference (IV, Random, 95% CI) | 0.16 [‐0.01, 0.33] |
|
| 22.1 Cognitive behavioural therapy versus usual care or waiting list | 2 | 168 | Std. Mean Difference (IV, Random, 95% CI) | 0.22 [‐0.08, 0.53] |
| 22.2 Third‐wave cognitive behavioural therapy versus usual care or waiting list | 1 | 107 | Std. Mean Difference (IV, Random, 95% CI) | ‐0.10 [‐0.48, 0.28] |
| 22.3 Psychodynamic therapy versus usual care or waiting list | 1 | 251 | Std. Mean Difference (IV, Random, 95% CI) | 0.23 [‐0.02, 0.48] |
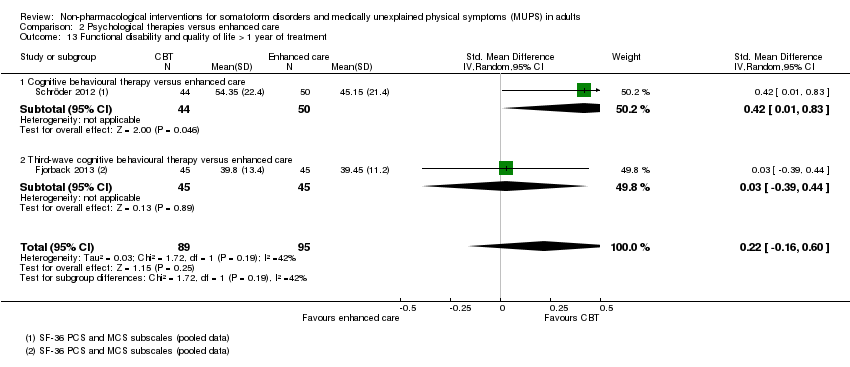
| 23 Functional disability and quality of life > 1 year of treatment Show forest plot | 1 | 72 | Std. Mean Difference (IV, Random, 95% CI) | 0.36 [‐0.11, 0.82] |
|
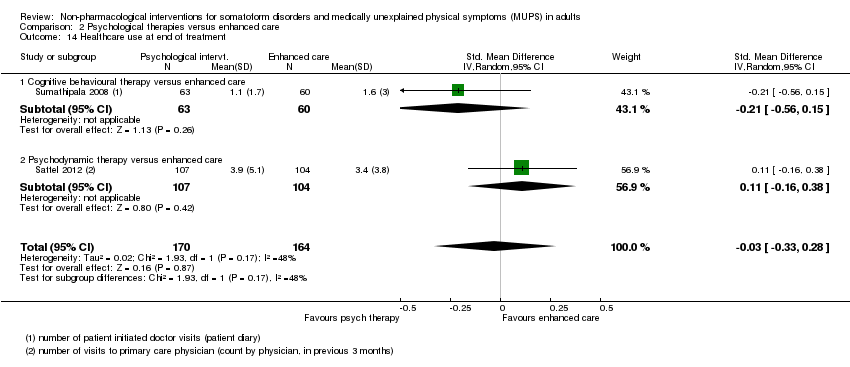
| 24 Healthcare use at end of treatment Show forest plot | 2 | 117 | Std. Mean Difference (IV, Random, 95% CI) | ‐0.68 [‐1.06, ‐0.30] |
|
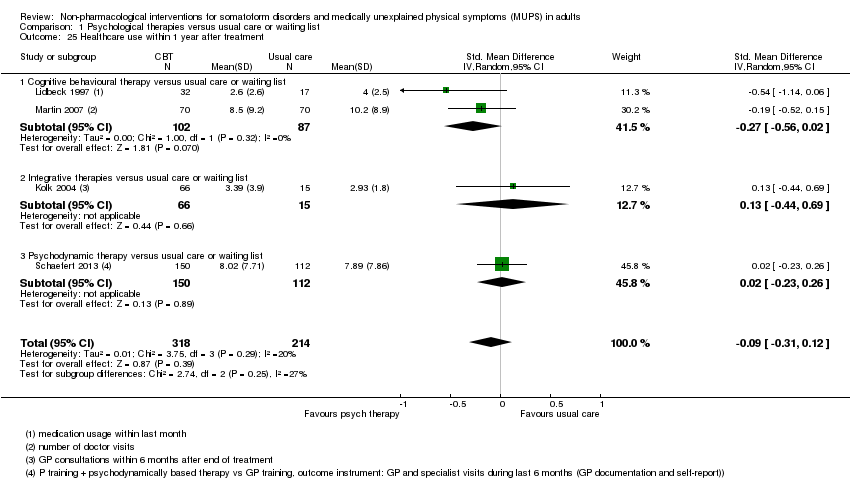
| 25 Healthcare use within 1 year after treatment Show forest plot | 4 | 532 | Std. Mean Difference (IV, Random, 95% CI) | ‐0.09 [‐0.31, 0.12] |
|
| 25.1 Cognitive behavioural therapy versus usual care or waiting list | 2 | 189 | Std. Mean Difference (IV, Random, 95% CI) | ‐0.27 [‐0.56, 0.02] |
| 25.2 Integrative therapies versus usual care or waiting list | 1 | 81 | Std. Mean Difference (IV, Random, 95% CI) | 0.13 [‐0.44, 0.69] |
| 25.3 Psychodynamic therapy versus usual care or waiting list | 1 | 262 | Std. Mean Difference (IV, Random, 95% CI) | 0.02 [‐0.23, 0.26] |