Uso sistemático de medidas de desenlace informadas por el paciente (MDIP) para mejorar el tratamiento de los trastornos de salud mental frecuentes en adultos
Referencias
Referencias de los estudios incluidos en esta revisión
Referencias de los estudios excluidos de esta revisión
Referencias de los estudios en espera de evaluación
Referencias de los estudios en curso
Referencias adicionales
Characteristics of studies
Characteristics of included studies [ordered by study ID]
| Methods | Study design: Individual randomised controlled trial Setting: 2 inpatient clinics and 4 outpatient clinics in mental health care institutions Country: Norway | |
| Participants | Diagnosis:
Method of diagnosis: Routine diagnosis by the treating therapist, using the ICD‐10 Age: Mean age 35.8, SD 11.6, range 18‐65 Sex: 231 (68%) female Number: 377 invited, 340 accepted, 321 randomised, (feedback group 174, controls 147), of whom 259 (81%) were followed up (feedback group 144, controls 115) Inclusion criteria:
Exclusion criteria:
Co‐morbidities:
Losses to follow‐up/withdrawal: 19 excluded as incorrectly randomised; 62 (19%) failed to complete follow‐up outcome measures: 14 in the feedback group failed to complete the initial OQ‐45, 15 in the non‐feedback group 16 in the feedback group only completed one OQ‐45 questionnaire, 17 in the non‐feedback group Demographics considered: Not stated, beyond age and gender Ethnicity: Not stated | |
| Interventions | PROM used as intervention: Outcome Questionnaire 45 (OQ‐45) Participants were randomly assigned to either: 1) Feedback to therapist Duration: variable, number of clinic visits determined by therapist Therapist given feedback prior to seeing participant. (Therapist free to discuss feedback with participant) 2) Control group Duration: variable, number of clinic visits determined by therapist The comparison group also completed OQ‐45s but their scores were kept hidden from the therapists and participants. | |
| Outcomes | Time points for assessment: at last clinic visit Outcomes of the trial (as reported):
Subgroups: Effect of being a 'signal' case (not on track) examined in general linear modelling *outcomes prespecified for this review | |
| Notes | Dates of study: Inclusion period June 2010‐September 2013 Funding: Not stated | |
| Risk of bias | ||
| Bias | Authors' judgement | Support for judgement |
| Random sequence generation (selection bias) | Low risk | "patients were randomized into the FB or NFB conditions in blocks of 8 and by gender" (p3) |
| Allocation concealment (selection bias) | Unclear risk | No details provided |
| Blinding of participants and personnel (performance bias) | High risk | "The OQ‐Analyst software provides the therapist and patient with a report showing the session‐by‐session progress" (p3) |
| Blinding of outcome assessment (detection bias) | High risk | The PROM used for feedback was also used for outcome assessment, so the participants themselves were the outcome assessors and they were not blind to whether or not they received the intervention |
| Incomplete outcome data (attrition bias) | High risk | 19% failed to complete the outcome measure, with an imbalance between groups (30/174 (17%) in feedback group versus 32/147 (22%) in the non‐feedback group |
| Selective reporting (reporting bias) | Low risk | No evidence of selective reporting found |
| Other bias | Unclear risk | Only 25% of the therapists employed at the clinics agreed to participate, and three quarters of the patients included were seen in the clinic where the project leader and main coordinator worked, suggesting that the therapists seeing clients in that study were self‐selected for their enthusiasm for routine outcome monitoring |
| Methods | Study design: Individual randomised controlled trial Setting: Inpatient psychotherapy Country: Germany | |
| Participants | Diagnosis:
Mean (SD) number of F‐diagnoses according to ICD‐10: Intervention group 1.59 (0.90), Control group 1.66 (0.89) Method of diagnosis: Clinician diagnosis according to ICD‐10 Age: mean 49.41 years, SD 8.63. Range not reported Sex: 73 (61.9%) female Number: 118 randomised, (58 intervention group, 60 control group) Inclusion criteria: Consecutive admissions to inpatient psychotherapy Exclusion criteria: Not reported Co‐morbidities: Not reported Losses to follow‐up/withdrawals: None (all inpatients, final assessment conducted at discharge)
Demographics considered: Age and gender only Ethnicity: Not reported | |
| Interventions | PROM used as intervention: Questionnaire for assessing success and course of psychotherapeutic treatment (FEV) Participants were randomly assigned to either: Intervention group (58): Mean values of FEV at admission were converted into T‐scores and were presented together with the percentage of goal attainment (agreed on at admission) on a feedback form Feedback was provided to therapists the following working day. Feedback to clinician only, but they were allowed to discuss results with participants Control group (60): No feedback to clinician or participant | |
| Outcomes | Outcomes:
Time points for assessment: FEV and FEP values were assessed at admission, 2 days later and on a weekly basis. CGI and VEV were assessed at discharge *outcomes prespecified for this review | |
| Notes | Dates of study: Not stated Funding: Not stated | |
| Risk of bias | ||
| Bias | Authors' judgement | Support for judgement |
| Random sequence generation (selection bias) | High risk | Quote: "Der Randomisierungsprozess erfasste alle Patienten und erfolgte per Münzwurf" (tossing a coin) p.23 |
| Allocation concealment (selection bias) | High risk | Quote: "Der Randomisierungsprozess erfasste alle Patienten und erfolgte per Münzwurf" (tossing a coin) p.23 |
| Blinding of participants and personnel (performance bias) | High risk | Not possible to blind participants and personnel due to the nature of the intervention |
| Blinding of outcome assessment (detection bias) | Unclear risk | Not reported |
| Incomplete outcome data (attrition bias) | Low risk |
|
| Selective reporting (reporting bias) | Low risk | No evidence of selective reporting found |
| Other bias | Low risk | No other perceived bias |
| Methods | Study design: Cluster randomised controlled trial Setting: Primary care across 74 sites Country: USA | |
| Participants | Diagnosis: Major depressive disorder Method of diagnosis: Not specified Age: Intervention group, M = 46.6 (SD = 15.0); control group, M = 45.3 (SD = 15.4); range = 18‐65+ Sex: 216 Male, 425 Female, 274 not reported Number: 915 randomised, 642 in analysis (364 intervention group, 278 control group) Inclusion criteria:
Exclusion criteria:
Co‐morbidities:
Losses to follow‐up/withdrawals:
Demographics considered:
Ethnicity:
(Patients could indicate multiple options for ethnicity; groups are not mutually exclusive). | |
| Interventions | PROM used as intervention: PHQ‐9 Participants were randomly assigned to either: Intervention group (503) Duration: 6 months, number of clinic visits determined by physician PHQ‐9 scores of each participant faxed to physicians on a monthly basis along with previous scores obtained, percentage change in baseline score, criteria for interpreting the results, general reminders and possible treatment adjustments Control group (412) Duration: 6 months, number of clinic visits determined by physician PHQ‐9 scores of each participant faxed to physicians after 6 months (end of study period) along with previous scores obtained, percentage change in baseline score, criteria for interpreting the results, general reminders and possible treatment adjustments | |
| Outcomes | Time points for assessment: (7), Baseline, months 1‐6 Outcomes of the trial (as reported):
*outcomes prespecified for this review | |
| Notes | Dates of study: 2009‐2010 Sources of funding: Bristol‐Myers Squibb, Otsuka Pharmaceutical Co., Ltd Characteristics and data obtained from both Chang 2012 (primary reference) and Yeung 2012 | |
| Risk of bias | ||
| Bias | Authors' judgement | Support for judgement |
| Random sequence generation (selection bias) | High risk | "Investigator sites were alternately (1:1) cluster‐assigned to usual care and intervention arms prior to patient enrolment." (p.106) We judged this at a high risk of bias due to the alternate assignment of sites |
| Allocation concealment (selection bias) | High risk | See comments above in 'Random sequence generation' |
| Blinding of participants and personnel (performance bias) | Low risk | "Physicians were blinded as to which study arm their practice was assigned to, and all physicians were not informed of the frequency at which patient status reports would be delivered for either arm." (p. 867 Yeung 2012). We judged this as adequate blinding given the study design |
| Blinding of outcome assessment (detection bias) | Low risk | Outcome was measured using the PROM used for feedback, but "Physicians were blinded as to which study arm their practice was assigned to, and all physicians were not informed of the frequency at which patient status reports would be delivered for either arm" (p. 867 Yeung 2012) |
| Incomplete outcome data (attrition bias) | High risk | Per protocol analysis performed ‐ 273/915 (29.9%) participants not included. Imbalance in numbers excluded between groups |
| Selective reporting (reporting bias) | High risk | The CGI‐S and PGI‐S were both recorded at baseline and different time points throughout the study but not reported. They were not used as interventions but should have been reported as outcomes. See p. 867 Yeung 2012 for full details No response was forthcoming from the authors on enquiring about these data |
| Other bias | Low risk | No other perceived bias |
| Methods | Study design: Individual randomised controlled trial Setting: 3 outpatient clinics in 2 mental health care institutions Country: Netherlands | |
| Participants | Diagnosis:
Method of diagnosis: Routine diagnosis by the treating therapist, using the DSM‐IV Age: Mean age 36.8, SD 12.0, range not given Sex: 61% female Number: 544 randomised, (feedback group 269, controls 275), of whom 413 (76%) were followed up (feedback group 206, controls 207) Inclusion criteria
Exclusion criteria
Co‐morbidities
Losses to follow‐up/withdrawal: 131 failed to complete baseline or 3 follow‐up outcome measures Feedback group: < 3 sessions of treatment (24), < 33% OQ‐45 administration (21), stopped completing OQ‐45 questionnaires before session 3 (13), baseline OQ‐45 missing (5) Control group: < 3 sessions of treatment (30), < 33% OQ‐45 administration (17), stopped completing OQ‐45 questionnaires before session 3 (17), baseline OQ‐45 missing (4) Demographics considered: Marital status, education Ethnicity: Not stated | |
| Interventions | PROM used as intervention: Outcome Questionnaire 45 (OQ‐45) Participants were randomly assigned to either 1) Feedback to therapist Duration: variable, number of clinic visits determined by therapist Therapist given feedback prior to seeing client. (Therapist free to discuss feedback with participant) 2) Control group Duration: variable, number of clinic visits determined by therapist The comparison group also completed OQ‐45s but their scores were kept hidden from the therapists and participants | |
| Outcomes | Time points for assessment: collected at every visit for first 5 visits, then every 5 visits for a year and at last clinic visit Outcomes of the trial (as reported):
Subgroups: Intervention and control groups were sub‐divided into 'on‐track (OT)', and 'not on track (NOT)', and rate‐of‐change results reported separately for two subgroups *outcomes prespecified for this review | |
| Notes | Dates of study: Not stated Funding: Not stated | |
| Risk of bias | ||
| Bias | Authors' judgement | Support for judgement |
| Random sequence generation (selection bias) | Low risk | Author reported that participants were assigned completely at random to feedback or no feedback using the feedback software |
| Allocation concealment (selection bias) | Low risk | Author reported that participants were not aware of their condition, unless therapists in the feedback group decided to discuss the feedback with the participant ‐ this was explicitly allowed |
| Blinding of participants and personnel (performance bias) | High risk | Not possible to blind clinicians and study personnel due to the nature of the intervention |
| Blinding of outcome assessment (detection bias) | High risk | The PROM used for feedback was also used for outcome assessment, so the participants themselves were the outcome assessors and they were not blind to whether or not they received the intervention |
| Incomplete outcome data (attrition bias) | High risk | High rates of attrition:
|
| Selective reporting (reporting bias) | Low risk | No evidence of selective reporting found |
| Other bias | Low risk | No other perceived bias |
| Methods | Study design: Individual randomised controlled trial Setting: Outpatient clinics in mental health care institutions or private practices Country: Netherlands | |
| Participants | Diagnosis:
Method of diagnosis: Routine diagnosis by the treating therapist, using the DSM‐IV Age: Mean age 38.2, SD 12.0, range not given Sex: 68% female Number: 604 randomised, (therapist feedback only 205, therapist and patient feedback 207, controls 192), of whom 475 (79%) were followed up (therapist feedback only 159, therapist and patient feedback 172, controls 144) Inclusion criteria:
Exclusion criteria:
Co‐morbidities:
Losses to follow‐up/withdrawal: 129 failed to complete the three outcome measures Demographics considered: Education beyond high school Ethnicity: Not stated | |
| Interventions | PROM used as intervention: Outcome Questionnaire 45 (OQ‐45) and message comparing current OQ‐45 total score, baseline score, and cut‐off score for normal functioning Participants were randomly assigned to either: 1) Feedback to therapist only Duration: variable, number of clinic visits determined by therapist Therapist given feedback prior to seeing client. (Therapist free to discuss feedback with participant) 2) Feedback to therapist and participant Duration: variable, number of clinic visits determined by therapist. Participants received the same feedback as the therapists 3) Control group Duration: variable, number of clinic visits determined by therapist The comparison group also completed OQ‐45s but their scores were kept hidden from the therapists and participants. | |
| Outcomes | Time points for assessment: at last clinic visit. Analyses were conducted for subgroups of short‐term (up to 35 weeks) and long‐term (35‐78 weeks) therapy Outcomes of the trial (as reported): Rate of change of OQ‐45 total score* Subgroups: intervention and control groups were sub‐divided into 'on‐track (OT)', and 'not on track (NOT)', and rate‐of‐change results reported separately for NOT subgroups only *outcomes prespecified for this review | |
| Notes | Dates of study: 1 July 2006‐ 30 June 2011 Funding: Netherlands Organization for Health Research and Development (ZonMW) | |
| Risk of bias | ||
| Bias | Authors' judgement | Support for judgement |
| Random sequence generation (selection bias) | Low risk | "the online feedback system allocated the patient to one of the three conditions" The author reported that block randomisation was used to ensure each clinician had participants in all three conditions |
| Allocation concealment (selection bias) | Low risk | "the online feedback system allocated the patient to one of the three conditions" |
| Blinding of participants and personnel (performance bias) | High risk | Not possible to blind participants and personnel due to the nature of the intervention |
| Blinding of outcome assessment (detection bias) | High risk | The PROM used for feedback was also used for outcome assessment, so the participants themselves were the outcome assessors and they were not blind to whether or not they received the intervention |
| Incomplete outcome data (attrition bias) | High risk | High rates of attrition:
|
| Selective reporting (reporting bias) | Low risk | No evidence of selective reporting found |
| Other bias | Low risk | No other perceived bias |
| Methods | Study design: Individual randomised controlled trial Setting: Psychiatric outpatients: 2 sites in Malmö Country: Sweden | |
| Participants | Diagnosis:
Method of diagnosis: Not specified Age: Mean (SD): 38 (12.8) intervention group, 39 (14.1) control group Sex: 274 (73%) female, 100 (27%) male Number: 374 randomised (188 intervention group, 186 control group), all in ITT analysis; 262 followed up and in per protocol analysis (136 intervention group, 126 control group) Inclusion criteria:
Exclusion criteria:
Co‐morbidities: Not stated Losses to follow‐up/withdrawals:
Demographics considered:
Ethnicity:
| |
| Interventions | PROM used as intervention: Outcome Questionnaire 45 (OQ‐45) with feedback to both therapist and client Participants were randomly assigned to either: 1) Intervention group (188) Duration: variable, number of clinic visits determined by therapist Therapist received a feedback message showing total score on OQ‐45, the subscales and a diagram of treatment progress. Therapist could read feedback prior to seeing participant. Participant received feedback via treatment progress diagram 2) Control group (186) Duration: variable, number of clinic visits determined by therapist Participants completed OQ‐45 but no feedback to clinician or participant | |
| Outcomes | Time points for assessment: Each clinic visit, reported at last clinic visit Outcomes of the trial (as reported):
*outcomes prespecified for this review | |
| Notes | Dates of study: 12 February 2007 to 10 February 2008 Source of funding: A grant from the Improved process for reporting of illness in Skåne, Skåne County Council; the Skåne County Council’s Research and Development Foundation and the Swedish Social Insurance Agency, Malmö | |
| Risk of bias | ||
| Bias | Authors' judgement | Support for judgement |
| Random sequence generation (selection bias) | Low risk | Quote: "Two different versions (feedback and control) of patient information were put into envelopes in a pre‐randomized order. The randomization list was prepared using a computer program, which assigned the patient to one of the two groups at random" |
| Allocation concealment (selection bias) | Low risk | Quote: "The sealed envelopes were available at the reception and handed out in the same order as the patients were registered." "Everyone involved — patient, receptionist, therapist and researcher — were blinded to the allocation" |
| Blinding of participants and personnel (performance bias) | High risk | Not possible to blind participants and personnel due to the nature of the intervention |
| Blinding of outcome assessment (detection bias) | High risk | The PROM used for feedback was also used for outcome assessment, so the participants themselves were the outcome assessors and they were not blind to whether or not they received the intervention |
| Incomplete outcome data (attrition bias) | High risk | High rates of attrition:
However, ITT analysis performed as well as per protocol |
| Selective reporting (reporting bias) | Low risk | ITT analysis performed as well as per protocol |
| Other bias | Low risk | No other perceived bias |
| Methods | Study design: Individual randomised controlled trial Setting: Psychotherapy clinic Country: USA | |
| Participants | Diagnosis: Axis I mood disorders (74%) and anxiety disorders (21%); 65 (32%) received two diagnoses Method of diagnosis: Routine diagnosis by the treating therapist Age: Mean age 30.8, SD 10.5, range not given. Sex: 137 female, 64 male, 112 not reported Number: 313 randomised, of whom 201 were followed up (therapist feedback only 70, therapist and client feedback 67, controls 64) Inclusion criteria:
Exclusion criteria:
Co‐morbidities: Not stated Losses to follow‐up/withdrawal: 108 failed to attend for a second session, 1 was removed by the therapist because it was thought the feedback was potentially detrimental, and 3 declined to complete the outcome measure and removed themselves from the study Demographics considered: Marital status, employment status Ethnicity:
| |
| Interventions | PROM used as intervention: Outcome Questionnaire 45 (OQ‐45) and algorithm on recommended actions as a function of number of treatment sessions provided and level of distress; 13 different instructions for therapists and 9 for clients. Participants were randomly assigned to either: 1) Feedback to therapist only Duration: variable, number of clinic visits determined by therapist Therapist received feedback that included 4 colour codes with actions recommended for each (white: consider termination; green: no change; yellow: consider altering treatment; red: review and decide on new course of action). Therapist given feedback prior to seeing client 2) Feedback to therapist and client Duration: variable, number of clinic visits determined by therapist 3) Control group Duration: variable, number of clinic visits determined by therapist The comparison group also completed OQ‐45s but their scores were kept hidden from the therapists and clients | |
| Outcomes | Time points for assessment: at last clinic visit Outcomes of the trial (as reported):
Subgroups: Both intervention and control groups were sub‐divided into 'on‐track (OT)', i.e. green or white coded, and 'not on track (NOT)', i.e. yellow or red coded, and extent of change results reported separately for NOT subgroup only *outcomes prespecified for this review | |
| Notes | Dates of study: Not stated Source of funding: Not stated | |
| Risk of bias | ||
| Bias | Authors' judgement | Support for judgement |
| Random sequence generation (selection bias) | Low risk | Quote: "Patients were assigned to treatment conditions using a randomized block design, with therapists serving as the blocking variable" |
| Allocation concealment (selection bias) | Unclear risk | No details available, no response to enquiry to author |
| Blinding of participants and personnel (performance bias) | High risk | Not possible to blind participants and personnel due to the nature of the intervention |
| Blinding of outcome assessment (detection bias) | High risk | The PROM used for feedback was also used for outcome assessment, so the participants themselves were the outcome assessors and they were not blind to whether or not they received the intervention |
| Incomplete outcome data (attrition bias) | High risk | 112/313 participants (35.8%) were excluded from the analysis (108 did not attend at least one follow‐up session after initial assessment, 3 did not complete the outcome measures, and 1 was removed by their therapist) |
| Selective reporting (reporting bias) | Unclear risk | Reliable change and clinically significant change results not reported for 'on‐track (OT)' subgroup |
| Other bias | Unclear risk | Clients started on medication, or receiving a change in medication, during treatment were excluded |
| Methods | Study design: Individual randomised controlled trial Setting: University counselling centre Country: USA | |
| Participants | Diagnosis: 80% diagnosed, of whom:
Method of diagnosis: Routine diagnosis by the treating clinician Age: Mean 22.23 years, range 17‐57 Sex: 427 female, 183 male Number: 609 randomised (307 intervention group, 302 control group), all followed up and in per protocol analysis Inclusion criteria:
Exclusion criteria:
Co‐morbidities: Not stated Losses to follow‐up/withdrawal: None reported Demographics considered: Not stated Ethnicity:
| |
| Interventions | PROM used as intervention: Outcome Questionnaire 45 (OQ‐45) and algorithm on recommended actions. Feedback to clinician (but could be shared with client and was in some cases at least by all but 6 therapists) Participants were randomly assigned to either: 1) Intervention group (307) Duration: variable, number of clinic visits determined by therapist Therapist received feedback that included 4 colour codes with actions recommended for each (white: consider termination; green: no change; yellow: consider altering treatment; red: review and decide on new course of action) Therapist given feedback prior to seeing client 2) Control group (302) Duration: variable, number of clinic visits determined by therapist The comparison group also completed OQ‐45s but their scores were kept hidden from the therapists and clients | |
| Outcomes | Time points for assessment: collected at baseline, weekly and at last clinic visit Outcomes of the trial (as reported):
Subgroups: Both intervention and control groups were sub‐divided into 'on‐track (OT)', i.e. green or white coded, and 'not on track (NOT)', i.e. yellow or red coded, and results reported separately for each subgroup within intervention and control arms *outcomes prespecified for this review | |
| Notes | Dates of study: Enrolment from October 1998–April 1999 Source of funding: University funded | |
| Risk of bias | ||
| Bias | Authors' judgement | Support for judgement |
| Random sequence generation (selection bias) | Unclear risk | Quote: "Approximately half (n = 307) were randomly assigned to the experimental (feedback) group and half (n = 302) were randomly assigned to the control (no feedback) group' |
| Allocation concealment (selection bias) | Unclear risk | Quote: 'Approximately half (n = 307) were randomly assigned to the experimental (feedback) group and half (n = 302) were randomly assigned to the control (no feedback) group' |
| Blinding of participants and personnel (performance bias) | High risk | Not possible to blind participants and personnel due to the nature of the intervention |
| Blinding of outcome assessment (detection bias) | High risk | The PROM used for feedback was also used for outcome assessment, so the participants themselves were the outcome assessors and they were not blind to whether or not they received the intervention |
| Incomplete outcome data (attrition bias) | Low risk | According to the paper, 609 were randomised and all were included in the analysis without a single dropout (we were unable to confirm this with the author) |
| Selective reporting (reporting bias) | High risk | Clinically significant change details not provided for on‐track participants (majority of participants) |
| Other bias | Low risk | No other perceived bias |
| Methods | Study design: Cluster randomised controlled trial Setting: Primary care (Health Maintenance Organisation (HMO)) Country: USA | |
| Participants | Diagnosis: Method of diagnosis: Diagnostic Interview Schedule (DIS) for the DSM‐III‐R Age: Mean 42 yrs (SD 10) in intervention group; 44 (11) in controls. Range 21‐65 Sex: 336 female, 237 male, 45 not reported Number: 618 randomised (389 intervention, 229 control) Inclusion criteria: Symptoms of anxiety and depression on Hopkins Symptom Checklist (SCL‐90) above ‘threshold’ on two occasions Exclusion criteria: Previously diagnosed mental health condition or received treatment in the past 6 months Co‐morbidities: 394 (69%) had co‐morbidities; not specified further Losses to follow‐up/withdrawals:
Demographics considered:
Ethnicity: 112 non‐white | |
| Interventions | PROM used as intervention: Mental Health Patient Profile, constructed from SCL‐90, DIS, and SF‐36 Participants were randomly assigned to either: 1) Intervention group (389): The PROMs were administered by researchers outside the practice and the results summarised for the treating physicians. Feedback to clinician only 2) Control group (229): No feedback of PROM scores to clinician or participant | |
| Outcomes | Outcomes: Mathias 1994:
Mazonson 1996:
Subgroups: 4 severity subgroups (anxiety symptoms only, anxiety symptoms and disorder, anxiety and depression symptoms, anxiety and depression disorders) Time points for assessment: 12 weeks and 5 months *outcomes prespecified for this review | |
| Notes | Duration: Not stated Funding: Supported by a grant from the Upjohn Company, and Take Care Colorado Characteristics and data obtained from both Mathias 1994 (primary reference) and Mazonson 1996 | |
| Risk of bias | ||
| Bias | Authors' judgement | Support for judgement |
| Random sequence generation (selection bias) | High risk | Quote: "The physicians were randomized by call group to either the demonstration or control arm." Baseline imbalances in participant numbers and demographics |
| Allocation concealment (selection bias) | High risk | Cluster randomisation means physicians were aware of allocation |
| Blinding of participants and personnel (performance bias) | High risk | Not possible to blind participants and personnel due to the nature of the intervention |
| Blinding of outcome assessment (detection bias) | High risk | Outcome assessment was carried out by the researchers administering the PROMs and feeding back the results to the physicians, who were therefore aware of allocation |
| Incomplete outcome data (attrition bias) | High risk | The 45 participants lost to follow‐up had higher mean scores for SF‐36 than the participants followed up |
| Selective reporting (reporting bias) | Low risk | No evidence of selective reporting found |
| Other bias | Low risk | No other perceived bias |
| Methods | Study design: Individual randomised controlled trial Setting: University counselling service Country: Ireland | |
| Participants | Diagnosis: 4 'dominant representations':
Method of diagnosis: Routine diagnosis by the treating clinician Age: Mean (SD) = 23.82 (6.46) years, range 18‐59 Sex: 58.2% female: 50.8% in intervention group and 66.7% in control group Number: 149 randomised at clinic intake, of which 110 followed up and included in per protocol analysis (59 intervention group and 51 control) Inclusion criteria:
Exclusion criteria:
Co‐morbidities: not stated Losses to follow‐up/withdrawal 32/180 originally assigned declined consent or dropped out before the first assessment. A further 39/149 (26.2%) failed to complete the second assessment (18 intervention group, 21 control group) Demographics considered: Not stated Ethnicity: Not stated | |
| Interventions | PROM used as intervention: Outcome rating scale (ORS) scores. Feedback to both clinician and participant who reviewed the scores together Participants were randomly assigned to either: 1) Intervention group (59) Duration: variable, number of clinic visits determined by therapist Therapist received feedback that included a graph of projected progress, and actual progress. Therapist given feedback while seeing client 2) Control group (51) Duration: variable, number of clinic visits determined by therapist The comparison group also completed ORS but their scores were kept hidden from the therapists and clients | |
| Outcomes | Time points for assessment: at last clinic visit Outcomes of the trial (as reported):
Subgroups: Both intervention and control groups were sub‐divided into 4 diagnostic groups (above) *outcomes prespecified for this review | |
| Notes | Dates of study: Enrolment from November 2008–February 2009 Source of funding: University funded | |
| Risk of bias | ||
| Bias | Authors' judgement | Support for judgement |
| Random sequence generation (selection bias) | Low risk | Quote: "For randomisation an online random number generator was utilised" |
| Allocation concealment (selection bias) | Low risk | Quote: "Clients were randomly assigned at intake to either the 'feedback' or 'no feedback' condition" (before assignment to a therapist) |
| Blinding of participants and personnel (performance bias) | High risk | Not possible to blind participants and personnel due to the nature of the intervention |
| Blinding of outcome assessment (detection bias) | High risk | The PROM used for feedback was also used for outcome assessment, so the participants themselves were the outcome assessors and they were not blind to whether or not they received the intervention |
| Incomplete outcome data (attrition bias) | High risk | 180 originally assigned in total; 31 did not complete first assessment; 149 randomised; 39 (26.2%) failed to complete the second assessment; 110/149 included in per protocol analysis |
| Selective reporting (reporting bias) | Unclear risk | Proportion with clinically significant change in ORS score (to 25+/40) not reported |
| Other bias | Low risk | No other perceived bias |
| Methods | Study design: Individual randomised controlled trial Setting: Inpatient facility for people with psychosomatic disorder Country: Germany | |
| Participants | Diagnosis: Psychosomatic disorder Method of diagnosis: Not stated Age: Mean (SD) = 47.62 (13.44) years, range not stated (participants in per protocol analysis) Sex: 60.6% female: 264/436 participants Number: 436 randomised, of which 252 followed up and included in per protocol analysis (20 intervention group and 23 control of the 'not on track' group, 111 intervention group and 98 control group of the 'on track' group) Inclusion criteria:
Exclusion criteria:
Co‐morbidities: 'Not on track' group:
'On track' group:
Losses to follow‐up/withdrawal: 184/436 originally randomised excluded as treatment duration not long enough to provide OQ‐45 data for the intake week and at least 2 more weeks (69/184 due to severe distress, 31/184 data available for only 1 or 2 weeks, 84/184 unclear) 'On‐track' group missing data:
Demographics considered:
Ethnicity: Not stated | |
| Interventions | PROM used as intervention: OQ‐45 (German version), ASC (Assessment of Signal Cases). Feedback given to clinician only, but free to discuss with clients Participants were randomly assigned to either: 1) Intervention group (111 in 'on track' group, 23 in 'not on track' group) Duration: Mean duration of treatment 3.6 weeks OQ‐45 scores and ASC data of each participant given to therapists on a weekly basis, after being entered into OQ‐Analyst. Therapist received feedback indicating if participant at risk of deterioration: yellow: consider altering treatment; red: review and decide on new course of action). Therapist given feedback prior to seeing client 2) Control group (98 in 'on track' group, 20 in 'not on track' group) Duration: Mean duration of treatment 3.4 weeks OQ‐45 and ASC completed by each participant every week but not shared with therapists | |
| Outcomes | Time points for assessment: (5), Baseline, weeks 1, 2, 3 and discharge week or last available OQ‐45 assessment Outcomes of the trial (as reported):
*outcomes prespecified for this review | |
| Notes | Dates of study: October 2010‐July 2012 Sources of funding: University Professorship awarded to Michael Lambert Characteristics and data obtained from both Probst 2013 (primary reference) and Probst 2014 | |
| Risk of bias | ||
| Bias | Authors' judgement | Support for judgement |
| Random sequence generation (selection bias) | Unclear risk | No details provided. No response from authors when contacted to clarify |
| Allocation concealment (selection bias) | Unclear risk | No details provided |
| Blinding of participants and personnel (performance bias) | High risk | Not possible to blind therapists due to the nature of the intervention |
| Blinding of outcome assessment (detection bias) | High risk | The PROM used for feedback was also used for outcome assessment, so the participants themselves were the outcome assessors and they were not blind to whether or not they received the intervention |
| Incomplete outcome data (attrition bias) | High risk | 184/436 (42.2%) participants excluded as did not complete 1 or more assessments. Analysis done per protocol |
| Selective reporting (reporting bias) | Low risk | No evidence of selective reporting found |
| Other bias | Low risk | No other perceived bias |
| Methods | Study design: Individual randomised controlled trial (Study 1 of 2 described in paper) Setting: University counselling service Country: USA | |
| Participants | Diagnosis: Not stated in paper. The lead author confirmed by email that more than 90% of the study participants would have had qualifying clinical diagnoses of anxiety and depressive disorders Method of diagnosis: Clinical only Age: Mean (SD) = 20.17 (1.9) years, range 18 ‐27 Sex: 53 female, 18 male, 60 not reported Number: 131 randomised at clinic intake, of which 74 followed up and included in per protocol analysis (50 intervention group and 24 control) Inclusion criteria:
Exclusion criteria:
Co‐morbidities: Not stated Losses to follow‐up/withdrawal: 57/131 (43.5%) either failed to return for a second session (24), did not complete the PROMs consistently in the feedback arm (5) or did not complete a post‐treatment measure in the no‐feedback arm (33) Demographics considered: Not stated Ethnicity:
| |
| Interventions | PROM used as intervention: PCOMS (Partners for Change Outcome Management System) including ORS (Outcome Rating Scale) and SRS (Session Rating Scale) Feedback to both clinician and participant who reviewed the scores together Participants were randomly assigned to either: 1) Intervention group (50) Duration: variable, number of clinic visits determined by therapist Therapists received and viewed feedback together with clients 2) Control group (24) Duration: variable, number of clinic visits determined by therapist The comparison group also completed ORS but their scores were kept hidden from the therapists and clients | |
| Outcomes | Time points for assessment: baseline, weekly, at last clinic visit Outcomes of the trial (as reported):
*outcomes prespecified for this review | |
| Notes | Dates of study: Not stated Source of funding: Not stated | |
| Risk of bias | ||
| Bias | Authors' judgement | Support for judgement |
| Random sequence generation (selection bias) | Low risk | Quote: ..."roughly half of the participants were originally randomly assigned to the feedback...via a randomised block design to help control for therapist effects". and ".....the first client was randomized using a random number generator to either the feedback or TAU condition.The second client was then assigned to the other condition." (Author correspondence, see Table 1 1) |
| Allocation concealment (selection bias) | Low risk | "This was done by the person who assigned clients at the respective centers, after enrollment into the study. Investigators and client participants could not foresee which condition a participant would placed into." (Author correspondence) |
| Blinding of participants and personnel (performance bias) | High risk | Not possible to blind participants and personnel due to the nature of the intervention |
| Blinding of outcome assessment (detection bias) | High risk | The PROM used for feedback was also used for outcome assessment, so the participants themselves were the outcome assessors and they were not blind to whether or not they received the intervention |
| Incomplete outcome data (attrition bias) | Unclear risk | Substantial proportion failed to complete and were left out of per protocol analysis (57/131, 43.5%) |
| Selective reporting (reporting bias) | High risk | SRS completed at end of each session in feedback group, but results not reported |
| Other bias | Unclear risk | No other perceived bias |
| Study ID | Response | Additional info | Outcome |
| No | Failed to respond | Email sent to [email protected] and [email protected] on 22 January 2015 regarding randomisation process, CGI‐S and PGI‐S outcomes and criteria for diagnosis | |
| Yes | Invited to become a co‐author | Replied immediately to an email sent on 17 June 2015. Provided details of data on OQ‐45 scores and further information on generation of random sequence and allocation concealment All data extraction was done by TK and MEG as KdJ became a co‐author of the review | |
| Yes | Reply on 28 January 2015 in response to email sent on 22 January: "We collected the data in a naturalistic setting at 2 clinics with clients who were already in treatment in some cases. We did collect outcome data over the course of the study period, but we do not have first and last measurements in all cases. I also do not have specific information regarding the clients (such as diagnoses). Therapists were aware which condition they were in as the independent variable was whether or not they received progress feedback. Clients did not know which condition they were in" | ||
| Yes | Emails sent to [email protected] on 22 January 2015, 29 July 2015 and 10 August 2015 enquiring about separate outcome data per diagnostic group. Reply on 30 August with requested information | ||
| No | Failed to contact | Study too old ‐ contact details of authors unobtainable | |
| No | Failed to respond | Email sent to [email protected]‐regensburg.de on 22 January 2015 regarding details of randomisation and blinding | |
| Yes | Reply on 3 February 2015 in response to email sent 22 January 2015: query about breakdown of outcome data per diagnostic group, with tabulated data provided | ||
| Yes | Reply on 3 February 2015 in response to email sent 22 January 2015: to query about randomisation, allocation concealment and outcome blinding: Randomisation: "When a client was assigned to a therapist, the first client was randomised using a random number generator to either the feedback or TAU condition. The second client was then assigned to the other condition." Allocation concealment: "This was done by the person who assigned clients at the respective centres. This was done after enrolment into the study. Investigators and client participants could not foresee which condition a participant would be placed into." Outcome blinding: "The researchers did not know which condition participants were in until the time of analysis." Query over discrepancy in data presented in main text and table: "The table is correct and it should be 4.69. That is what was used in the analyses as well." Further data regarding number of treatment sessions and standard deviations provided on request in December 2015 Further information provided on diagnoses of study participants on 3 May 2016, confirming that more than 90% of them would have had qualifying clinical diagnoses of anxiety or depressive disorders, or both | ||
| Yes | Reply on 26 March 2015 in response to email sent on 26 March 2015 enquiring about the details of managed care in place in some of the study participants, and about outcome data. "Managed care consisted of session limits and utilization review". Further email exchanges from 31 March to 2 April to enquire about blinding details. Reply on 13 May 2016 to email sent 13 May 2016, enquiring whether study participants would have met our review inclusion/exclusion characteristics, confirming that they would have met them | ||
| No | Failed to respond | Email sent to [email protected] on 22 January 2015 as listed as corresponding author on all four studies. Enquiries about randomisation procedure and allocation concealment. No reply regarding any of the studies was made. Further email sent to [email protected] and Michael Lambert on 17 July 2015, no reply received | |
| Yes | Email sent to [email protected] on 18 November 2015, reply received: further data provided on OQ‐45 outcomes and number of treatment sessions on 7 December 2015 |
| Methods | Study design: Cluster randomised controlled trial (Study 2 of 2 studies described in paper) Setting: Community‐based graduate (Masters) training clinic Country: USA | |
| Participants | Diagnosis: Not stated in paper. The lead author confirmed by email that more than 90% of the study participants would have had qualifying clinical diagnoses of anxiety and depressive disorders Method of diagnosis: Clinical only Age: Mean (SD) = 32.96 (12.32) years, range 18‐69 Sex: 51 female, 21 male, 24 not reported Number: 96 randomised at clinic intake, of which 74 followed up and included in per protocol analysis (45 intervention group and 29 control) Inclusion criteria:
Exclusion criteria:
Co‐morbidities: Not stated Losses to follow‐up/withdrawal: 22/96 (22.9%) either failed to return for a second session (8), did not complete the PROMs consistently in the feedback arm (4) or did not complete a post‐treatment measure in the no‐feedback arm (10) Demographics considered: Not stated Ethnicity:
| |
| Interventions | PROM used as intervention: PCOMS (Partners for Change Outcome Management System) including ORS (Outcome Rating Scale) and SRS (Session Rating Scale) Feedback to both clinician and participant who reviewed the scores together Participants were randomly assigned to either: 1) Intervention group (45) Duration: variable, number of clinic visits determined by therapist Therapists received and viewed feedback together with clients 2) Control group (29) Duration: variable, number of clinic visits determined by therapist The comparison group also completed ORS but their scores were kept hidden from the therapists and clients | |
| Outcomes | Time points for assessment: baseline, weekly, at last clinic visit Outcomes of the trial (as reported):
*outcomes prespecified for this review | |
| Notes | Dates of study: Not stated Source of funding: Not stated | |
| Risk of bias | ||
| Bias | Authors' judgement | Support for judgement |
| Random sequence generation (selection bias) | Low risk | Quote:"Therapists, rather than clients were randomly assigned to the feedback and no‐feedback conditions" |
| Allocation concealment (selection bias) | High risk | Cluster randomisation means therapists were aware of allocation |
| Blinding of participants and personnel (performance bias) | High risk | Not possible to blind participants and personnel due to the nature of the intervention |
| Blinding of outcome assessment (detection bias) | High risk | The PROM used for feedback was also used for outcome assessment, so the participants themselves were the outcome assessors and they were not blind to whether or not they received the intervention |
| Incomplete outcome data (attrition bias) | Unclear risk | Substantial proportion failed to complete and were left out of per protocol analysis (22/96, 23%) |
| Selective reporting (reporting bias) | High risk | SRS completed at end of each session in feedback group, but results not reported |
| Other bias | Unclear risk | No other perceived bias |
| Methods | Study design: Cluster randomised controlled trial Setting: Private outpatient psychotherapy Country: Germany | |
| Participants | Diagnosis: Mean (SD) number of F‐diagnoses according to ICD‐10: Intervention group 1.71 (0.92), Control group 1.46 (0.77) Method of diagnosis: According to ICD (intervention group: ICDL‐Checklist, control group: ICD ‐10 criteria) Age: Intervention group: mean 40.16 years, SD 11.38. Control group: mean 41.27 years, SD 11.03. Range not reported Sex: 1117 (68.6%) female (Wittmann et al., 2012) Number: 4452 approached, 1708 patients gave consent to participate: 1031 intervention group, 677 control group 1629 randomised: 968 intervention group, 661 control (Wittmann et al. 2011) Inclusion criteria: Starting outpatient psychotherapy, between 1 April 2005 and 30 June 2010; diagnosis F3‐F6, 18 years or older Exclusion criteria: Diagnosis F1 or F2 Co‐morbidities: Not reported Losses to follow‐up/withdrawals: 1598 (98.2%) completed baseline assessment, 597 (36.7%) completed post‐treatment assessment, and 468 (28.8%) completed follow‐up assessment 12 months post‐treatment Demographics considered: Marital status, partnership status, persons living in household, living situation, education, training qualification, job status, income, ability to work Ethnicity: German nationality: intervention group 97.8%, control group 96.0% | |
| Interventions | PROM used as intervention: Comprehensive inventory of psychometric measurement instruments. Decision rules ("reorientation of the expert system") were developed and optimised to guide decisions (on indications for and prolongation of psychotherapy) based on the feedback. No extra contact or treatment was given to the participants in the intervention group as a result of reorientation of the expert system Participants were randomly assigned to either: 1) Intervention group: Feedback to clinician only on 4‐point scale: consistent reduction of problems; reduction of problems; no clinically relevant changes; increase of problems 2) Control group: No feedback to clinician or participant | |
| Outcomes | Outcomes:
Time points for assessment: Pre‐treatment, post‐treatment, and 12 months post‐treatment | |
| Notes | Duration: 01/05/2005‐31/05/2011, 73 months Funding: Techniker Krankenkasse health insurance programme | |
| Risk of bias | ||
| Bias | Authors' judgement | Support for judgement |
| Random sequence generation (selection bias) | Unclear risk | Drawing lots: "Aus jeder der Zellen wurden per Zufall die teilnehmenden Therapeuten zur IG oder KG zugelost" (Wittmann et al., 2011, p42) |
| Allocation concealment (selection bias) | High risk | Cluster randomisation means therapists were aware of allocation. Allocation was restricted according to gender and treatment modalities |
| Blinding of participants and personnel (performance bias) | Unclear risk | Blinding of participants not reported. |
| Blinding of outcome assessment (detection bias) | Unclear risk | Blinding of outcome assessors not reported |
| Incomplete outcome data (attrition bias) | High risk | Only 36.7% completed post‐treatment assessment, and 28.8% completed follow‐up assessment 12 months post‐treatment |
| Selective reporting (reporting bias) | Unclear risk | Unclear whether selective reporting had taken place |
| Other bias | Unclear risk | No other perceived bias |
| Methods | Study design: Individual randomised controlled trial Setting: Hospital‐based outpatient clinic Country: USA | |
| Participants | Diagnosis:
Method of diagnosis: Routine diagnosis by the treating therapist Age: Mean age (SD) 36.10 (13.32), range not given Sex: 64.2% female (241), 34.9% male (129) of the 370 included in analysis, 94 not reported Number: 464 recruited, of whom 370 were followed up. 163 'on‐track (OT)' all improved. 207 'not on track (NOT)' clients underwent 'Assessment for Signal Clients (ASC)' and were randomised to therapist and client feedback (109), or treatment as usual (98) Inclusion criteria:
Exclusion criteria:
Co‐morbidities: Not stated Losses to follow‐up/withdrawal: 94 failed to attend for a second session Demographics considered:
Ethnicity:
| |
| Interventions | PROM used as intervention: Outcome Questionnaire 45 (OQ‐45), including 3 subscales: subjective discomfort, interpersonal relationships, and social role performance Participants were randomly assigned to either: 1) Feedback Duration: variable, number of clinic visits determined by therapist Feedback to clinicians consisted of session‐by‐session OQ‐45 progress feedback along with alerts to therapists each time a client took the measure. Therapists were given feedback prior to seeing clients that included four colour codes with actions recommended for each (white: consider termination; green: no change; yellow: consider altering treatment; red: review and decide on new course of action). Therapists were instructed to share OQ‐45 scores with clients Subgroups: both intervention and control groups were sub‐divided into 'on‐track (OT)', i.e. green or white coded, and 'not on track (NOT)', i.e. yellow or red coded. The ASC was used for 'not on track (NOT)' clients only, and results were reported for the NOT subgroup only Therapists were also provided with a Clinical Support Tool (CST) intervention manual, which provided guidelines for interpreting the ASC, a decision tree, and an interventions list to prompt therapist action 2) Control group Duration: variable, number of clinic visits determined by therapist The treatment‐as‐usual group also completed OQ‐45s but their scores were kept hidden from the therapists and clients | |
| Outcomes | Time points for assessment: Baseline, each clinic visit, at last clinic visit Outcomes of the trial (as reported): All reported for NOT subgrouponly:
*outcomes prespecified for this review | |
| Notes | Dates of study: Not stated Source of funding: Susa Young Gates University Professorship awarded to Michael J Lambert | |
| Risk of bias | ||
| Bias | Authors' judgement | Support for judgement |
| Random sequence generation (selection bias) | Low risk | Quote: "patients were randomly assigned by the research staff". "Patients in this study were randomly assigned to experimental conditions using a block randomized design, with therapists serving as the blocking variable." p. 640 |
| Allocation concealment (selection bias) | Unclear risk | No details |
| Blinding of participants and personnel (performance bias) | High risk | Not possible to blind participants and personnel due to the nature of the intervention |
| Blinding of outcome assessment (detection bias) | High risk | The PROM used for feedback was also used for outcome assessment, so the participants themselves were the outcome assessors and they were not blind to whether or not they received the intervention |
| Incomplete outcome data (attrition bias) | High risk | 94/464 (20.3%) failed to complete the second assessment and were omitted from the analysis |
| Selective reporting (reporting bias) | Unclear risk | No results reported for OT subgroup, except that they all improved with no differences between feedback and no‐feedback groups |
| Other bias | Low risk | No other perceived bias |
| Methods | Study design: Individual randomised controlled trial Setting: Rural community mental health centre ‐ 3 sites Country: USA | |
| Participants | Diagnosis:
Method of diagnosis: Not stated. Author confirmed by email that diagnosis was clinical, and that more than 90% would have had diagnoses of anxiety and depressive disorders Age: Control group mean age (SD) 37.5 (14.32), feedback group mean age (SD) 32.14 (10.51), non‐feedback group mean age (SD) 32.91 (13.36) Sex: 72% female (91/127) Number: 127 (38 control, 66 feedback, 23 no feedback) Inclusion criteria:
Exclusion criteria:
Co‐morbidities: Not stated Losses to follow‐up/withdrawal: 14/38 in control group, 26/66 in feedback group and 10/23 in non‐feedback group withdrew after T1. A further 18 withdrew after T2 (group status not given). No reasons given for drop‐outs Demographics considered:
Ethnicity:
| |
| Interventions | PROM used as intervention: Outcome Questionnaire (OQ‐45) with subscales 3 groups: 1) a feedback condition, in which the clients completed the OQ at each session, and the clinicians were provided with information regarding client progress following each session 2) a non‐feedback condition in which clients completed the OQ at each session, but the clinicians were not provided with the results of the measures 3) a control condition in which clients were not assessed with the OQ measures at each session | |
| Outcomes | Time points for assessment: (3) Baseline, 2 months, 4 months Outcomes as reported by study authors:
*outcomes prespecified for this review Ϯ = no usable data provided for inclusion in this review | |
| Notes | Dates of study: Not stated Source of funding: Study conducted for doctoral thesis, no source of funding disclosed | |
| Risk of bias | ||
| Bias | Authors' judgement | Support for judgement |
| Random sequence generation (selection bias) | Low risk | "Clients were randomly assigned by case number to either the control condition for case numbers ending in 3, 6 or 9" |
| Allocation concealment (selection bias) | Unclear risk | No details provided |
| Blinding of participants and personnel (performance bias) | High risk | Not possible to blind participants and personnel due to the nature of the intervention |
| Blinding of outcome assessment (detection bias) | High risk | The PROM used for feedback was also used for outcome assessment, so the participants themselves were the outcome assessors and they were not blind to whether or not they received the intervention |
| Incomplete outcome data (attrition bias) | High risk | 14/38 dropped out in control group, 26/66 dropped out in feedback group and 10/23 dropped out in no feedback group. Further 18 across groups dropped out between T2 and T3. Balanced drop out rates but high, and substantially higher participants in feedback group compared to no feedback group |
| Selective reporting (reporting bias) | Low risk | No evidence of selective reporting |
| Other bias | Low risk | No other perceived bias |
| Methods | Study design: Individual randomised controlled trial Setting: University counselling centre Country: USA | |
| Participants | Diagnosis: 74.6% diagnosed:
Method of diagnosis: Routine diagnosis by the treating clinician Age: Mean 22.88 (SD 3.54), range 18‐54 Sex: 648 female, 333 male, 358 not reported Number: 1339 randomised, of whom 981 (73.2%) followed up and in per protocol analysis (499 intervention, 482 control) Inclusion criteria:
Exclusion criteria:
Co‐morbidities: Not stated Losses to follow‐up/withdrawal 1339 included originally, of whom 358 (26.7%) excluded due to not completing an outcome measure, or not returning for a second session Demographics considered: Not stated Ethnicity:
| |
| Interventions | PROM used as intervention: Outcome Questionnaire 45 (OQ‐45) and algorithm on recommended actions. Feedback to clinician (but could be shared with client) Participants were randomly assigned to either: 1) Intervention group (499) Duration: variable, number of clinic visits determined by therapist Therapist received feedback that included 4 colour codes with actions recommended for each (white: consider termination; green: no change; yellow: consider altering treatment; red: review and decide on new course of action). Therapist given feedback prior to seeing client. When clients identified as 'not on track (NOT)', therapists had option of using a clinical support tool (CST) which included a decision tree and a list of possible interventions 2) Control group (482) Duration: variable, number of clinic visits determined by therapist The comparison group also completed OQ‐45s but their scores were kept hidden from the therapists and clients | |
| Outcomes | Time points for assessment: Baseline, per session and at last clinic visit Outcomes of the trial (as reported):
Subgroups: both intervention and control groups were sub‐divided into 'on‐track (OT)', i.e. green or white coded, and 'not on track (NOT)', i.e. yellow or red coded, and results reported separately for each subgroup within intervention and control arms *outcomes prespecified for this review | |
| Notes | Dates of study: Not stated Source of funding: Not stated | |
| Risk of bias | ||
| Bias | Authors' judgement | Support for judgement |
| Random sequence generation (selection bias) | Unclear risk | Quote: "The participants in the experimental (Fb) and control groups (NFb) were divided into groups based on random assignment" |
| Allocation concealment (selection bias) | Unclear risk | Not stated |
| Blinding of participants and personnel (performance bias) | High risk | Not possible to blind participants and personnel due to the nature of the intervention |
| Blinding of outcome assessment (detection bias) | High risk | The PROM used for feedback was also used for outcome assessment, so the participants themselves were the outcome assessors and they were not blind to whether or not they received the intervention |
| Incomplete outcome data (attrition bias) | High risk | 1339 randomised, of whom 358 (26.7%) excluded due to not completing an outcome measure, or not returning for a second session. Per protocol analysis undertaken |
| Selective reporting (reporting bias) | Low risk | No evidence of selective reporting found |
| Other bias | Low risk | No other perceived bias |
Characteristics of excluded studies [ordered by study ID]
| Study | Reason for exclusion |
| Ineligible population | |
| PROMs not used for outcome monitoring | |
| PROMs not used for outcome monitoring | |
| Complex quality improvement programme | |
| PROMs not used for outcome monitoring | |
| Non randomised study | |
| Non randomised study | |
| Non randomised study | |
| Non randomised study | |
| PROMs not used for outcome monitoring | |
| Ineligible population | |
| Ineligible population | |
| Ineligible population | |
| PROMs not used for outcome monitoring | |
| Non randomised study | |
| PROMs not used for outcome monitoring (only therapeutic alliance and patient satisfaction reported) | |
| Complex quality improvement programme | |
| Ineligible population | |
| Non randomised study |
Characteristics of studies awaiting assessment [ordered by study ID]
| Methods | Randomised controlled trial with 2 arms. Patients individually randomised to 8 weeks of individual therapy with either a clinician receiving weekly feedback reports, or a clinician not receiving weekly feedback reports |
| Participants | People seeking services for depression at a community mental health centre (CMHC) in Philadelphia, USA. Inclusion criterion: a clinically meaningful level of depressive symptoms (score of 11 or above on Inventory for Depressive Symptomatology, QIDS). Pre‐dominantly female African‐Americans, with a mean age of 39 |
| Interventions | Community Clinician Feedback System (CCFS) including a clinical feedback report identifying patients who were not progressing as expected judged on basis of scores on BASIS‐24 (24‐Item Behavior and Symptom Identification Scale). Scores presented on coloured graph showing line of expected recovery along with patient’s actual BASIS‐24 scores. Patients 'off track' for improvement completed Community Clinician Feedback Questionnaire (CCFQ) covering demographic background, treatment motivation, attitudes and expectations about treatment, therapeutic alliance, suicide risk, substance use, perceived social support, psychosocial stressors, violence potential, personality disorder, interpersonal distress, interpersonal patterns, cognitive distortions, compensatory skills, and trauma history |
| Outcomes | Primary outcome: rate of change across treatment weeks on the total score of the BASIS‐24, plus percentage of patients achieving reliable change, clinically significant change, and both reliable and clinically significant change. Secondary outcomes: patient and clinician satisfaction |
| Notes |
| Methods | Open, individually randomised parallel‐group controlled trial |
| Participants | Outpatients attending a mental health hospital in Norway. All patients offered treatment at the out‐patient unit between 6 weeks and 3 months after referral were invited |
| Interventions | Partners for Change Outcome Management System (PCOMS) feedback scales, including the Outcome Rating Scale (ORS), and Session rating Scale (SRS) |
| Outcomes | Primary outcome measures: Behaviour and Symptom Identification Scale 32 (BASIS‐32) and Patient Activation Measure (PAM). Secondary outcome measures: Treatment Alliance Scale (TAS), Client Satisfaction Questionnaire‐8 (CSQ), Short Form‐12 (SF‐12), Outcome Rating Scale (ORS) and Session Rating Scale (SRS), “Patient motivation” (PM) and “Patient participation” (PP) |
| Notes |
Characteristics of ongoing studies [ordered by study ID]
| Trial name or title | Shared Decision Making in mental health care using Routine Outcome Monitoring as a source of information: a cluster randomised controlled trial |
| Methods | Multi‐centre 2‐arm cluster randomised controlled trial: pairs of teams from the same mental health organisation are randomly assigned to either the experimental or control conditions (matched pairs) |
| Participants | Clients attending specialised mental health care treated in subgroups by: age (adolescents, adults and elderly patients), diagnosis (psychotic, common mental and personality disorders); and setting (outpatient, day‐clinic and clinic) |
| Interventions | Shared Decision Making (SDM) using Routine Outcome Monitoring (ROM) as a source of information (SDM‐ROM model), using ROMs tailored to patient subgroup |
| Outcomes | Primary outcome: degree of decisional conflict, measured using Decisional Conflict Scale (DCS). Secondary outcomes: patient‐clinician relationship assessed using Dutch version of Working Alliance Inventory Short Form (WAI‐S); treatment outcome using either Manchester Short Quality of Live Measurement (MANSA‐VN‐16) for long‐term patients or the Outcome Questionnaire (OQ‐45) for short term patients |
| Starting date | August 2015 |
| Contact information | Margot Metz, Trimbos Institute of Mental Health and Addiction, Utrecht, and GGZ Breburg, Tilburg, The Netherlands, email: [email protected] |
| Notes |
| Trial name or title | Effects of systematic patient feedback on therapy outcome and dropout: A randomized controlled study on adult out‐patients at a community mental health centre |
| Methods | 2 groups: Control (psychotherapy as usual); Intervention (psychotherapy along with feedback to therapist of a PROM administered at the beginning and end of every therapy session) |
| Participants | 18 years or older Referred for treatment of mental disorder |
| Interventions | Partners for Change Outcome Management System (PCOMS) (KOR ‐ Norwegian) |
| Outcomes | Health care utilisation (referral and drop out rate); symptom level; patient satisfaction; level of functioning; preferences for involvement in decision making; patient activation measure; use of health services (number of visits at General Practitioner or use of other health services) |
| Starting date | December 2012 |
| Contact information | John Morten Koksvik, MD 0047 73 86 40 00 [email protected] Mariela Lara 0047 73 86 40 00 [email protected] |
| Notes | Sponsors and Collaborators: Norwegian University of Science and Technology Principal Investigator: Mariela M Lara MA |
| Trial name or title | Assessing psychotherapy outcome in treatment as usual versus treatment as usual with the STIC feedback system |
| Methods | 2 groups: treatment‐as‐usual (TAU) versus TAU plus feedback to therapist through weekly online client questionnaires |
| Participants | Individuals, couples, and families |
| Interventions | Systemic Therapy Inventory of Change (STIC) |
| Outcomes | Change in mental health symptoms at termination, tailored to client demographics, including some or all of: Beck Depression Inventory II; Beck Anxiety Inventory; Outcome Questionnaire 45; Short‐form 36 Health Survey; Revised Dyadic Adjustment Scale; Family Assessment Device; Strengths‐Difficulties Questionnaire |
| Starting date | December 2013 |
| Contact information | Contact: Tara Latta:847 733 4300 ext 322 [email protected]; Jacob Goldsmith, Ph.D. 847 733 4300 ext 860 jgoldsmith2@family‐institute.org |
| Notes |
| Trial name or title | A randomised trial of routine computerised outcome and process clinical measures monitoring in mental health outpatient services: preparing for the planned public mental health reform in Israel |
| Methods | The suggested study is a 2‐stage (implementation and intervention) open trial. 900 new outpatients in 'Shalvata' clinics will be recruited and randomised to intervention (ROM) and control groups. Assessment questionnaires will be filled periodically using 'CORE‐NET', a computerised system enabling repeated measurements and feedback in a user‐friendly and efficient manner |
| Participants | New patients attending clinic and beginning therapy |
| Interventions | Control group: Infrequently complete CORE‐OM (once a year) and results not fed back to therapists Intervention group: Feedback of CORE‐OM rating scale to therapists (completed between once a week and every 3 months) |
| Outcomes | Overall clinical wellbeing as measured by the CORE‐OM rating scale Hospitalisation rates |
| Starting date | July 2014 |
| Contact information | Ori Ganor, MD 972‐54‐5454886 [email protected] Lior Biran, Clinical Psychologist 972‐54‐4708886 [email protected]; [email protected] |
| Notes | Sponsors and Collaborators: Shalvata Mental Health Center Principal Investigators: Ori Ganor MD, Lior Biran |
| Trial name or title | Using the PHQ‐9 and GAD‐7 as feedback instruments in brief psychotherapy |
| Methods | Randomised controlled trial with 3 arms: Continuous Client Feedback (scores given to client and discussed with therapist); Continuous Self Feedback (scores given to to client only); Control (clients complete symptom and quality‐of‐life scales only before first session and before last or 10th session, whichever occurs first) |
| Participants | Aged 18‐64, with diagnosis of major depressive disorder, generalized anxiety disorder, or adjustment disorder, undergoing brief psychotherapy |
| Interventions | Patient Health Questionnaire‐9 (PHQ‐9) and Generalized Anxiety Disorder 7‐Item Scale (GAD‐7) PROMs |
| Outcomes | Primary outcome measures: Change in depressive symptoms on PHQ‐9 and change in anxiety symptoms on GAD‐7 at end of treatment (up to 10 weeks) Secondary outcome measures: WHO ‐ Quality of Life BREF Scale for physical health, psychological health, social relationships, and environment; and Schwartz Outcome Scale |
| Starting date | November 2015 |
| Contact information | Contact: Krystal G Ludwig, MA, 6104135983, [email protected] David York, PhD, 3026230201, [email protected], Christiana Healthcare, Wilmington, Delaware, United States |
| Notes |
| Trial name or title | Routine Process Monitoring, systematic patient feedback in the primary and specialised mental healthcare |
| Methods | Randomised controlled trial with 2 arms: Routine Process Monitoring + Treatment as usual (TAU‐RPM), and Treatment as Usual (TAU) |
| Participants | Patients aged 18 years or older, assigned to have psychological treatment in primary care or specialised mental healthcare |
| Interventions | Feedback of Session Rating Scale (SRS) and Outcome Rating Scale (ORS) scores completed in each treatment session |
| Outcomes | Primary outcomes: Outcome Questionaire 45 symptom score and Dutch Mental Health Continuum ‐ Short Form (MHC‐SF). Secondary outcomes: dropout, patient‐satisfaction, duration of therapy, and treatment costs. Assessed at 5 weeks', 13 weeks', and 26 weeks' follow‐up |
| Starting date | December 2015 |
| Contact information | Dr AM Bovendeerd, Steenwijk, The Netherlands Tel: +31 (0)521 534140 email: [email protected] |
| Notes |
| Trial name or title | Self‐monitoring and personalised feedback as a tool to boost depression treatment |
| Methods | Randomised controlled trial with 3 arms: ‘Do’‐module (n = 50): patients report ESM data via their smartphone, 5 times a day for 28 days, with weekly feedback (to the patient) on positive affect (PA) and activities. ‘Think’‐module (n = 50): patients report ESM data via their smartphone, 5 times a day for 28 days, with weekly feedback (to the patient) on negative affect (NA) and thinking patterns. Control group (n = 50): patients on the wait list |
| Participants | Patients aged between 18 and 65 years for whom depression treatment is indicated by the practitioner |
| Interventions | Self‐monitoring and personalised feedback through the Experience Sampling Method (ESM) |
| Outcomes | Change in depression symptom severity on self‐report Inventory of Depressive Symptomatology; change in psychosocial functioning on Outcome Questionnaire 45; self‐esteem and control over own lives on Dutch Empowerment questionnaire |
| Starting date | March 2016 |
| Contact information | Dr JACJ Bastiaansen, Groningen, The Netherlands Tel: +31 (0)503 611169 email: [email protected] |
| Notes |
Data and analyses
| Outcome or subgroup title | No. of studies | No. of participants | Statistical method | Effect size |
| 1 Mean improvement in symptom scores: OQ‐45 PROMS Show forest plot | 9 | 3438 | Mean Difference (IV, Random, 95% CI) | ‐1.14 [‐3.15, 0.86] |
| Analysis 1.1  Comparison 1 Difference in outcome feeding back OQ‐45 or ORS scores versus no feedback, Outcome 1 Mean improvement in symptom scores: OQ‐45 PROMS. | ||||
| 2 Mean improvement in symptom scores: OQ‐45 or ORS PROMs Show forest plot | 12 | 3696 | Std. Mean Difference (IV, Random, 95% CI) | ‐0.07 [‐0.16, 0.01] |
| Analysis 1.2 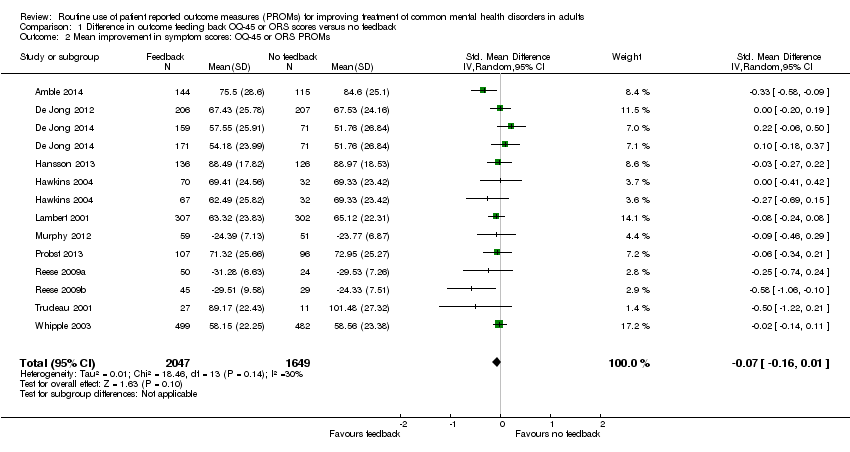 Comparison 1 Difference in outcome feeding back OQ‐45 or ORS scores versus no feedback, Outcome 2 Mean improvement in symptom scores: OQ‐45 or ORS PROMs. | ||||
| 3 Number of treatment sessions received: all participants Show forest plot | 7 | 2608 | Mean Difference (IV, Random, 95% CI) | ‐0.02 [‐0.42, 0.39] |
| Analysis 1.3  Comparison 1 Difference in outcome feeding back OQ‐45 or ORS scores versus no feedback, Outcome 3 Number of treatment sessions received: all participants. | ||||
| Outcome or subgroup title | No. of studies | No. of participants | Statistical method | Effect size |
| 1 Mean improvement in symptom scores by setting Show forest plot | 12 | 3696 | Std. Mean Difference (IV, Random, 95% CI) | ‐0.07 [‐0.16, 0.01] |
| Analysis 2.1  Comparison 2 Subgroup analysis: Setting, Outcome 1 Mean improvement in symptom scores by setting. | ||||
| 1.1 Multidisciplinary mental health care setting | 7 | 1848 | Std. Mean Difference (IV, Random, 95% CI) | ‐0.05 [‐0.18, 0.07] |
| 1.2 Psychological therapy setting | 5 | 1848 | Std. Mean Difference (IV, Random, 95% CI) | ‐0.10 [‐0.23, 0.03] |
| Outcome or subgroup title | No. of studies | No. of participants | Statistical method | Effect size |
| 1 Mean improvement in symptom scores by whether participants were given a formal diagnosis or not Show forest plot | 12 | 3696 | Std. Mean Difference (IV, Random, 95% CI) | ‐0.07 [‐0.16, 0.01] |
| Analysis 3.1  Comparison 3 Subgroup analysis: Whether participants were given a formal diagnosis or not, Outcome 1 Mean improvement in symptom scores by whether participants were given a formal diagnosis or not. | ||||
| 1.1 Mean improvement in symptom scores: participants given a formal diagnosis | 3 | 1144 | Std. Mean Difference (IV, Random, 95% CI) | ‐0.01 [‐0.23, 0.21] |
| 1.2 Mean difference in symptom scores: participants not given a formal diagnosis | 9 | 2552 | Std. Mean Difference (IV, Random, 95% CI) | ‐0.08 [‐0.15, 0.00] |
| Outcome or subgroup title | No. of studies | No. of participants | Statistical method | Effect size |
| 1 Mean improvement in symptom scores: feedback given to clinician, participant or both Show forest plot | 12 | 3696 | Std. Mean Difference (IV, Random, 95% CI) | ‐0.07 [‐0.16, 0.01] |
| Analysis 4.1 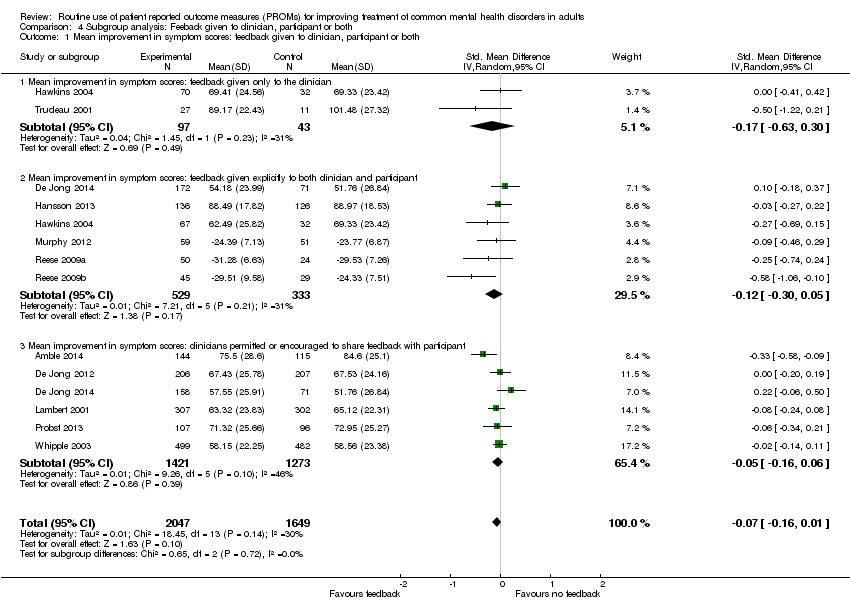 Comparison 4 Subgroup analysis: Feeback given to clinician, participant or both, Outcome 1 Mean improvement in symptom scores: feedback given to clinician, participant or both. | ||||
| 1.1 Mean improvement in symptom scores: feedback given only to the clinician | 2 | 140 | Std. Mean Difference (IV, Random, 95% CI) | ‐0.17 [‐0.63, 0.30] |
| 1.2 Mean improvement in symptom scores: feedback given explicitly to both clinician and participant | 6 | 862 | Std. Mean Difference (IV, Random, 95% CI) | ‐0.12 [‐0.30, 0.05] |
| 1.3 Mean improvement in symptom scores: clinicians permitted or encouraged to share feedback with participant | 6 | 2694 | Std. Mean Difference (IV, Random, 95% CI) | ‐0.05 [‐0.16, 0.06] |
| Outcome or subgroup title | No. of studies | No. of participants | Statistical method | Effect size |
| 1 Mean improvement in symptom scores by whether feedback included treatment instructions or an algorithm Show forest plot | 12 | 3696 | Std. Mean Difference (IV, Random, 95% CI) | ‐0.07 [‐0.16, 0.01] |
| Analysis 5.1  Comparison 5 Subgroup analysis: Whether feedback included treatment instructions or an algorithm, Outcome 1 Mean improvement in symptom scores by whether feedback included treatment instructions or an algorithm. | ||||
| 1.1 Mean improvement in symptom scores: treatment instructions or algorithm | 2 | 1184 | Std. Mean Difference (IV, Random, 95% CI) | ‐0.03 [‐0.14, 0.09] |
| 1.2 Mean improvement in symptom scores: no treatment instructions or algorithm | 10 | 2512 | Std. Mean Difference (IV, Random, 95% CI) | ‐0.09 [‐0.20, 0.02] |
| Outcome or subgroup title | No. of studies | No. of participants | Statistical method | Effect size |
| 1 Mean improvement in symptom scores by whether studies involved Michael Lambert Show forest plot | 9 | Std. Mean Difference (IV, Random, 95% CI) | Subtotals only | |
| Analysis 6.1  Comparison 6 Subgroup analysis: studies involving Michael Lambert versus studies not involving him, Outcome 1 Mean improvement in symptom scores by whether studies involved Michael Lambert. | ||||
| 1.1 Mean improvement in symptom scores: studies involving Michael Lambert | 5 | 2032 | Std. Mean Difference (IV, Random, 95% CI) | ‐0.06 [‐0.15, 0.03] |
| 1.2 Mean improvement in symptom scores: studies not involving Michael Lambert | 4 | 1406 | Std. Mean Difference (IV, Random, 95% CI) | ‐0.02 [‐0.19, 0.15] |
| Outcome or subgroup title | No. of studies | No. of participants | Statistical method | Effect size |
| 1 Mean improvement in symptom scores: 'not on track' participants only Show forest plot | 10 | 923 | Std. Mean Difference (IV, Random, 95% CI) | ‐0.22 [‐0.35, ‐0.09] |
| Analysis 7.1  Comparison 7 Post hoc analyses ‐ 'on track' and 'not on track' participants, Outcome 1 Mean improvement in symptom scores: 'not on track' participants only. | ||||
| 2 Number of treatment sessions received by 'on track' and 'not on track' participants Show forest plot | 5 | 2114 | Mean Difference (IV, Random, 95% CI) | 0.06 [‐0.91, 1.02] |
| Analysis 7.2  Comparison 7 Post hoc analyses ‐ 'on track' and 'not on track' participants, Outcome 2 Number of treatment sessions received by 'on track' and 'not on track' participants. | ||||
| 2.1 Number of treatment sessions received by "on track" participants only | 4 | 1633 | Mean Difference (IV, Random, 95% CI) | ‐0.69 [‐1.10, ‐0.29] |
| 2.2 Number of treatment sessions received by "not on track" participants only | 5 | 481 | Mean Difference (IV, Random, 95% CI) | 0.73 [‐2.04, 3.50] |

PRISMA flow diagram

Risk of bias summary: review authors' judgements about each risk of bias item for each included study.

Risk of bias graph: review authors' judgements about each risk of bias item presented as percentages across all included studies.
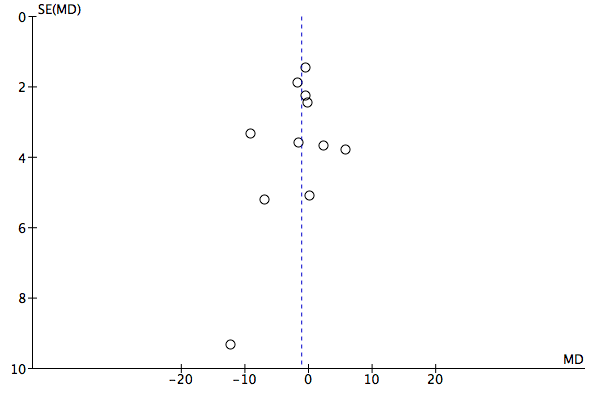
Funnel plot of comparison: 1 Difference in outcome feeding back OQ‐45 or ORS scores versus no feedback, outcome: 1.1 Mean improvement in symptom scores: OQ‐45 PROMS.

Funnel plot of comparison: 1 Difference in outcome feeding back OQ‐45 or ORS scores versus no feedback, outcome: 1.2 Mean improvement in symptom scores: OQ‐45 or ORS PROMs.

Comparison 1 Difference in outcome feeding back OQ‐45 or ORS scores versus no feedback, Outcome 1 Mean improvement in symptom scores: OQ‐45 PROMS.

Comparison 1 Difference in outcome feeding back OQ‐45 or ORS scores versus no feedback, Outcome 2 Mean improvement in symptom scores: OQ‐45 or ORS PROMs.

Comparison 1 Difference in outcome feeding back OQ‐45 or ORS scores versus no feedback, Outcome 3 Number of treatment sessions received: all participants.

Comparison 2 Subgroup analysis: Setting, Outcome 1 Mean improvement in symptom scores by setting.
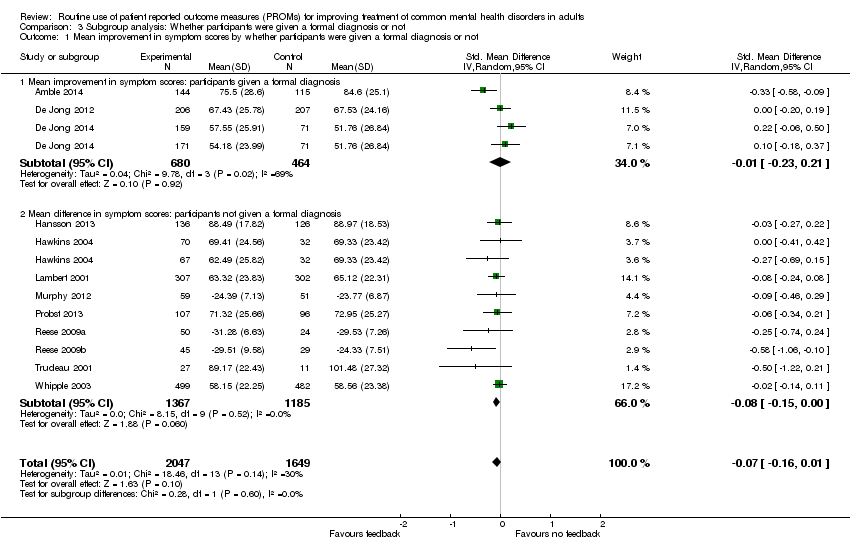
Comparison 3 Subgroup analysis: Whether participants were given a formal diagnosis or not, Outcome 1 Mean improvement in symptom scores by whether participants were given a formal diagnosis or not.

Comparison 4 Subgroup analysis: Feeback given to clinician, participant or both, Outcome 1 Mean improvement in symptom scores: feedback given to clinician, participant or both.

Comparison 5 Subgroup analysis: Whether feedback included treatment instructions or an algorithm, Outcome 1 Mean improvement in symptom scores by whether feedback included treatment instructions or an algorithm.

Comparison 6 Subgroup analysis: studies involving Michael Lambert versus studies not involving him, Outcome 1 Mean improvement in symptom scores by whether studies involved Michael Lambert.
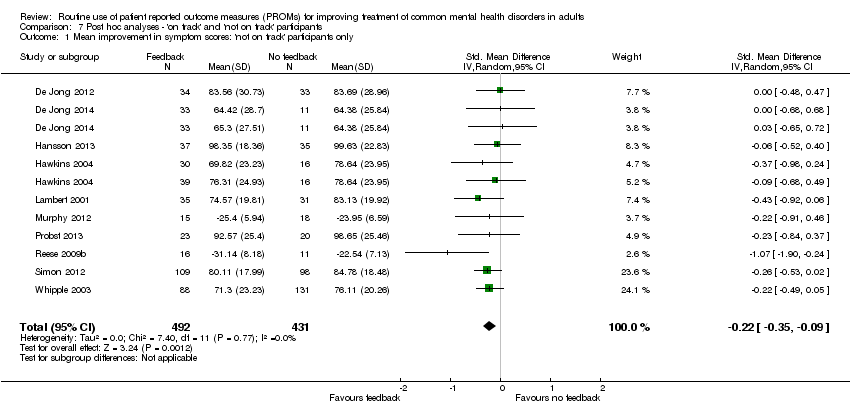
Comparison 7 Post hoc analyses ‐ 'on track' and 'not on track' participants, Outcome 1 Mean improvement in symptom scores: 'not on track' participants only.
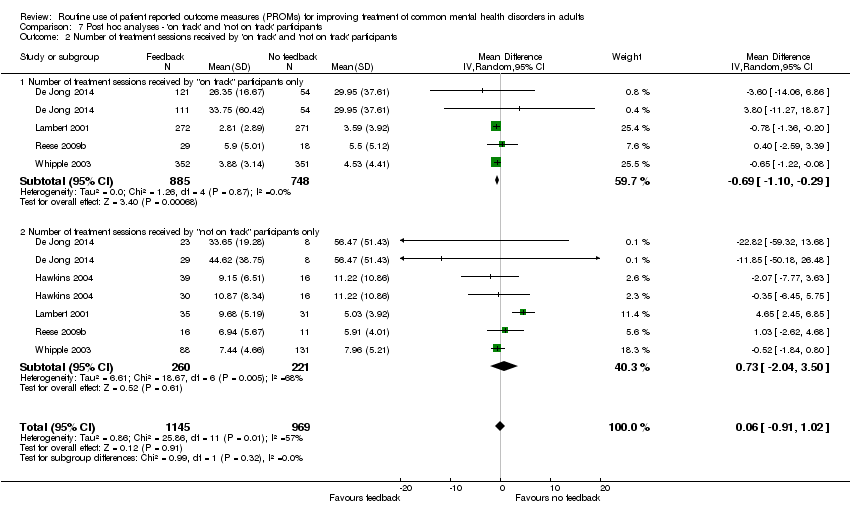
Comparison 7 Post hoc analyses ‐ 'on track' and 'not on track' participants, Outcome 2 Number of treatment sessions received by 'on track' and 'not on track' participants.
| Feedback of PROM scores for routine monitoring of common mental health disorders | |||||
| Patient or population: People with common mental health disorders1 Intervention: Feedback of PROM scores to clinician, or both clinician and patient Comparator: No feedback of PROM scores | |||||
| Outcomes and length of follow‐up | Illustrative risk | Number of participants | Quality of the evidence | Comments | |
| Assumed risk (range of means in no‐feedback groups) | Relative effect (95% CI) in feedback groups | ||||
| Mean improvement in symptom scores Follow‐up: 1‐6 months2 | Mean scores in no‐feedback groups ranged from 51.8 to 101.5 points for OQ‐45 and from 23.8 to 29.5 points for ORS. Standard deviations ranged from 17.8 to 28.6 points for OQ‐45 and from 7.1 to 9.6 points for ORS | Standard mean difference in symptom scores at end of study in feedback groups was 0.07 standard deviations lower | 3696 | ⊕⊕⊝⊝ | Neither study in the primary care setting used the OQ‐45 or ORS PROMs, and so could not be included in this meta‐analysis |
| Health‐related quality of life Follow‐up: 1‐5 months2 Medical Outcomes Study (SF‐12) physical and mental subscales). Scale from 0‐100 Follow‐up: 0‐1 year | Study results could not be combined in a meta‐analysis as data were not available in an appropriate format Mathias 1994 reported no significant differences between feedback and control groups on all nine domains of the SF‐36 Scheidt 2012 reported no significant differences between feedback and no‐feedback groups in physical or mental sub‐scale scores | 583 587 (1 study) | ⊕⊕⊕⊝ moderate7 | ||
| Adverse events Follow‐up: 6 months | Chang 2012 reported no immediate suicide risk across both feedback and no‐feedback groups combined. Number per group not given | 642 | ⊕⊕⊕⊝ moderate7 | ||
| Social functioning Follow‐up: 0‐1 year2 | Data for the social functioning subscale of the OQ‐45 were considered separately in Hansson 2013 and no difference was found | 262 (1 study) | ⊕⊕⊝⊝ low9 | ||
| Costs | Not estimable | 0 (0 studies) | No study assessed the impact of the intervention on direct or indirect costs | ||
| Changes in the management of CMHDs Changes in drug therapy and referrals for specialist care Follow‐up: 1‐6 months2 | Study results could not be combined in a meta‐analysis as data were not available in an appropriate format Chang 2012 and Mathias 1994 both reported no significant differences in changes in drug therapy between study arms Mathias 1994 reported mental health referrals were significantly more likely in the feedback group (OR 1.73, 95% CI 1.11 to 2.70) | 1215 | ⊕⊕⊕⊝ moderate7 | ||
| Changes in the management of CMHDs Follow‐up: 1‐6 months2 | Mean in no‐feedback groups ranged from 3.7 to 33.5 treatment sessions | Mean difference in number of treatment sessions in feedback groups was 0.02 lower | 2608 | ⊕⊕⊝⊝ | Post‐hoc analysis. Changes in medication and referrals for additional therapy were not assessed by any of these studies |
| CI: Confidence interval | |||||
| GRADE Working Group grades of evidence | |||||
| 1Studies were included if the majority of people diagnosed had CMHDs and no more than 10% had diagnoses of psychotic disorders, learning difficulties, dementia, substance misuse, or eating disorders 2Duration of therapy was variable in all studies and determined by the clinician or the patient, or both 6Downgraded two levels due to risk of bias (all included studies were judged at high risk of bias in at least two domains, in particular blinding of participants and outcome assessment, and attrition), and indirectness (although symptom scores were compared between feedback and non‐feedback groups, wider social functioning and quality‐of‐life measurements were not assessed in nearly all studies) 7Downgraded one level due to risk of bias (judged at high risk of bias in at least two domains, in particular blinding of participants and outcome assessment, and attrition) 8Number of PHQ‐9 questionnaires which contained reports of self‐harming thoughts 9Downgraded two levels due to risk of bias and imprecision, as total participant numbers were less than 400 10Downgraded two levels due to risk of bias and for imprecision: estimate of effect includes no effect and incurs very wide confidence intervals | |||||
| Outcome or subgroup title | No. of studies | No. of participants | Statistical method | Effect size |
| 1 Mean improvement in symptom scores: OQ‐45 PROMS Show forest plot | 9 | 3438 | Mean Difference (IV, Random, 95% CI) | ‐1.14 [‐3.15, 0.86] |
| 2 Mean improvement in symptom scores: OQ‐45 or ORS PROMs Show forest plot | 12 | 3696 | Std. Mean Difference (IV, Random, 95% CI) | ‐0.07 [‐0.16, 0.01] |
| 3 Number of treatment sessions received: all participants Show forest plot | 7 | 2608 | Mean Difference (IV, Random, 95% CI) | ‐0.02 [‐0.42, 0.39] |
| Outcome or subgroup title | No. of studies | No. of participants | Statistical method | Effect size |
| 1 Mean improvement in symptom scores by setting Show forest plot | 12 | 3696 | Std. Mean Difference (IV, Random, 95% CI) | ‐0.07 [‐0.16, 0.01] |
| 1.1 Multidisciplinary mental health care setting | 7 | 1848 | Std. Mean Difference (IV, Random, 95% CI) | ‐0.05 [‐0.18, 0.07] |
| 1.2 Psychological therapy setting | 5 | 1848 | Std. Mean Difference (IV, Random, 95% CI) | ‐0.10 [‐0.23, 0.03] |
| Outcome or subgroup title | No. of studies | No. of participants | Statistical method | Effect size |
| 1 Mean improvement in symptom scores by whether participants were given a formal diagnosis or not Show forest plot | 12 | 3696 | Std. Mean Difference (IV, Random, 95% CI) | ‐0.07 [‐0.16, 0.01] |
| 1.1 Mean improvement in symptom scores: participants given a formal diagnosis | 3 | 1144 | Std. Mean Difference (IV, Random, 95% CI) | ‐0.01 [‐0.23, 0.21] |
| 1.2 Mean difference in symptom scores: participants not given a formal diagnosis | 9 | 2552 | Std. Mean Difference (IV, Random, 95% CI) | ‐0.08 [‐0.15, 0.00] |
| Outcome or subgroup title | No. of studies | No. of participants | Statistical method | Effect size |
| 1 Mean improvement in symptom scores: feedback given to clinician, participant or both Show forest plot | 12 | 3696 | Std. Mean Difference (IV, Random, 95% CI) | ‐0.07 [‐0.16, 0.01] |
| 1.1 Mean improvement in symptom scores: feedback given only to the clinician | 2 | 140 | Std. Mean Difference (IV, Random, 95% CI) | ‐0.17 [‐0.63, 0.30] |
| 1.2 Mean improvement in symptom scores: feedback given explicitly to both clinician and participant | 6 | 862 | Std. Mean Difference (IV, Random, 95% CI) | ‐0.12 [‐0.30, 0.05] |
| 1.3 Mean improvement in symptom scores: clinicians permitted or encouraged to share feedback with participant | 6 | 2694 | Std. Mean Difference (IV, Random, 95% CI) | ‐0.05 [‐0.16, 0.06] |
| Outcome or subgroup title | No. of studies | No. of participants | Statistical method | Effect size |
| 1 Mean improvement in symptom scores by whether feedback included treatment instructions or an algorithm Show forest plot | 12 | 3696 | Std. Mean Difference (IV, Random, 95% CI) | ‐0.07 [‐0.16, 0.01] |
| 1.1 Mean improvement in symptom scores: treatment instructions or algorithm | 2 | 1184 | Std. Mean Difference (IV, Random, 95% CI) | ‐0.03 [‐0.14, 0.09] |
| 1.2 Mean improvement in symptom scores: no treatment instructions or algorithm | 10 | 2512 | Std. Mean Difference (IV, Random, 95% CI) | ‐0.09 [‐0.20, 0.02] |
| Outcome or subgroup title | No. of studies | No. of participants | Statistical method | Effect size |
| 1 Mean improvement in symptom scores by whether studies involved Michael Lambert Show forest plot | 9 | Std. Mean Difference (IV, Random, 95% CI) | Subtotals only | |
| 1.1 Mean improvement in symptom scores: studies involving Michael Lambert | 5 | 2032 | Std. Mean Difference (IV, Random, 95% CI) | ‐0.06 [‐0.15, 0.03] |
| 1.2 Mean improvement in symptom scores: studies not involving Michael Lambert | 4 | 1406 | Std. Mean Difference (IV, Random, 95% CI) | ‐0.02 [‐0.19, 0.15] |
| Outcome or subgroup title | No. of studies | No. of participants | Statistical method | Effect size |
| 1 Mean improvement in symptom scores: 'not on track' participants only Show forest plot | 10 | 923 | Std. Mean Difference (IV, Random, 95% CI) | ‐0.22 [‐0.35, ‐0.09] |
| 2 Number of treatment sessions received by 'on track' and 'not on track' participants Show forest plot | 5 | 2114 | Mean Difference (IV, Random, 95% CI) | 0.06 [‐0.91, 1.02] |
| 2.1 Number of treatment sessions received by "on track" participants only | 4 | 1633 | Mean Difference (IV, Random, 95% CI) | ‐0.69 [‐1.10, ‐0.29] |
| 2.2 Number of treatment sessions received by "not on track" participants only | 5 | 481 | Mean Difference (IV, Random, 95% CI) | 0.73 [‐2.04, 3.50] |
| Study ID | Response | Additional info | Outcome |
| No | Failed to respond | Email sent to [email protected] and [email protected] on 22 January 2015 regarding randomisation process, CGI‐S and PGI‐S outcomes and criteria for diagnosis | |
| Yes | Invited to become a co‐author | Replied immediately to an email sent on 17 June 2015. Provided details of data on OQ‐45 scores and further information on generation of random sequence and allocation concealment All data extraction was done by TK and MEG as KdJ became a co‐author of the review | |
| Yes | Reply on 28 January 2015 in response to email sent on 22 January: "We collected the data in a naturalistic setting at 2 clinics with clients who were already in treatment in some cases. We did collect outcome data over the course of the study period, but we do not have first and last measurements in all cases. I also do not have specific information regarding the clients (such as diagnoses). Therapists were aware which condition they were in as the independent variable was whether or not they received progress feedback. Clients did not know which condition they were in" | ||
| Yes | Emails sent to [email protected] on 22 January 2015, 29 July 2015 and 10 August 2015 enquiring about separate outcome data per diagnostic group. Reply on 30 August with requested information | ||
| No | Failed to contact | Study too old ‐ contact details of authors unobtainable | |
| No | Failed to respond | Email sent to [email protected]‐regensburg.de on 22 January 2015 regarding details of randomisation and blinding | |
| Yes | Reply on 3 February 2015 in response to email sent 22 January 2015: query about breakdown of outcome data per diagnostic group, with tabulated data provided | ||
| Yes | Reply on 3 February 2015 in response to email sent 22 January 2015: to query about randomisation, allocation concealment and outcome blinding: Randomisation: "When a client was assigned to a therapist, the first client was randomised using a random number generator to either the feedback or TAU condition. The second client was then assigned to the other condition." Allocation concealment: "This was done by the person who assigned clients at the respective centres. This was done after enrolment into the study. Investigators and client participants could not foresee which condition a participant would be placed into." Outcome blinding: "The researchers did not know which condition participants were in until the time of analysis." Query over discrepancy in data presented in main text and table: "The table is correct and it should be 4.69. That is what was used in the analyses as well." Further data regarding number of treatment sessions and standard deviations provided on request in December 2015 Further information provided on diagnoses of study participants on 3 May 2016, confirming that more than 90% of them would have had qualifying clinical diagnoses of anxiety or depressive disorders, or both | ||
| Yes | Reply on 26 March 2015 in response to email sent on 26 March 2015 enquiring about the details of managed care in place in some of the study participants, and about outcome data. "Managed care consisted of session limits and utilization review". Further email exchanges from 31 March to 2 April to enquire about blinding details. Reply on 13 May 2016 to email sent 13 May 2016, enquiring whether study participants would have met our review inclusion/exclusion characteristics, confirming that they would have met them | ||
| No | Failed to respond | Email sent to [email protected] on 22 January 2015 as listed as corresponding author on all four studies. Enquiries about randomisation procedure and allocation concealment. No reply regarding any of the studies was made. Further email sent to [email protected] and Michael Lambert on 17 July 2015, no reply received | |
| Yes | Email sent to [email protected] on 18 November 2015, reply received: further data provided on OQ‐45 outcomes and number of treatment sessions on 7 December 2015 |