| Feedback of PROM scores for routine monitoring of common mental health disorders |
| Patient or population: People with common mental health disorders1
Settings: Primary care, multidisciplinary mental health care, or psychological therapies Intervention: Feedback of PROM scores to clinician, or both clinician and patient Comparator: No feedback of PROM scores |
| Outcomes and length of follow‐up | Illustrative risk | Number of participants
(number of studies) | Quality of the evidence
(GRADE) | Comments |
| Assumed risk (range of means in no‐feedback groups) | Relative effect (95% CI) in feedback groups |
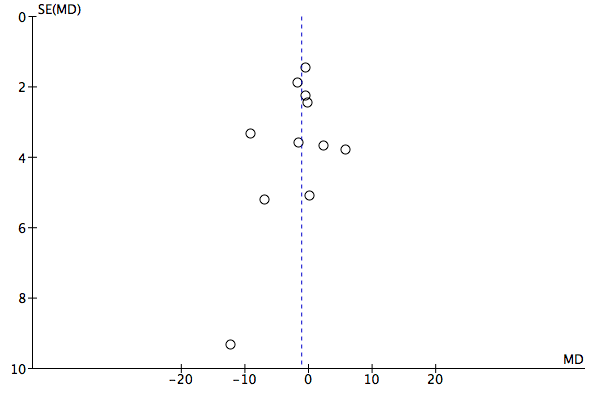
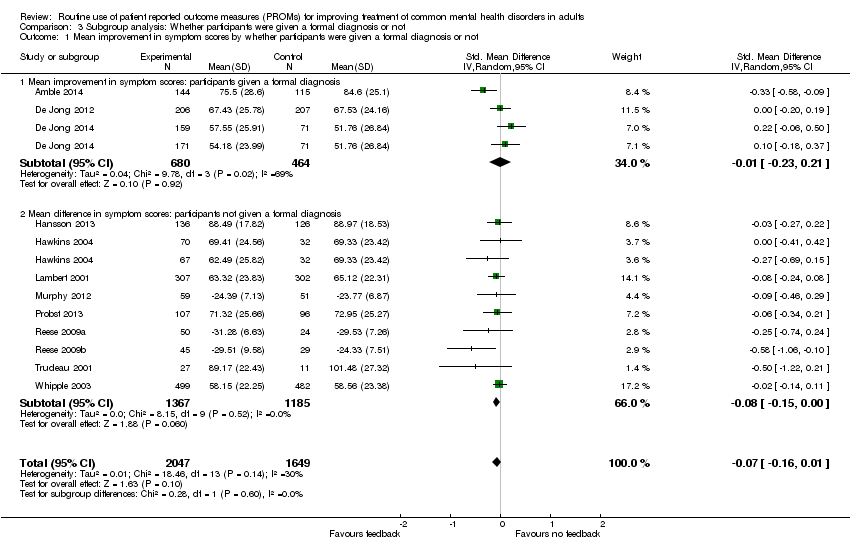
| Mean improvement in symptom scores
Outcome Questionnaire‐45 (OQ‐45) or Outcome Rating Scale (ORS) Follow‐up: 1‐6 months2 | Mean scores in no‐feedback groups ranged from 51.8 to 101.5 points for OQ‐45 and from 23.8 to 29.5 points for ORS. Standard deviations ranged from 17.8 to 28.6 points for OQ‐45 and from 7.1 to 9.6 points for ORS | Standard mean difference in symptom scores at end of study in feedback groups was 0.07 standard deviations lower
(0.16 lower to 0.01 higher)3,4 | 3696
(12 studies) | ⊕⊕⊝⊝
low5,6 | Neither study in the primary care setting used the OQ‐45 or ORS PROMs, and so could not be included in this meta‐analysis |
| Health‐related quality of life
Medical Outcomes Study Short Form (SF‐36) Follow‐up: 1‐5 months2 Medical Outcomes Study (SF‐12) physical and mental subscales). Scale from 0‐100 Follow‐up: 0‐1 year | Study results could not be combined in a meta‐analysis as data were not available in an appropriate format Mathias 1994 reported no significant differences between feedback and control groups on all nine domains of the SF‐36 Scheidt 2012 reported no significant differences between feedback and no‐feedback groups in physical or mental sub‐scale scores | 583
(1 study) 587 (1 study) | ⊕⊕⊕⊝ moderate7 | |
| Adverse events
PHQ‐9 questionnaire8 Follow‐up: 6 months | Chang 2012 reported no immediate suicide risk across both feedback and no‐feedback groups combined. Number per group not given | 642
(1 study) | ⊕⊕⊕⊝ moderate7 | |
| Social functioning Follow‐up: 0‐1 year2 | Data for the social functioning subscale of the OQ‐45 were considered separately in Hansson 2013 and no difference was found | 262 (1 study) | ⊕⊕⊝⊝ low9 | |
| Costs | Not estimable | 0 (0 studies) | | No study assessed the impact of the intervention on direct or indirect costs |
| Changes in the management of CMHDs Changes in drug therapy and referrals for specialist care Follow‐up: 1‐6 months2 | Study results could not be combined in a meta‐analysis as data were not available in an appropriate format Chang 2012 and Mathias 1994 both reported no significant differences in changes in drug therapy between study arms Mathias 1994 reported mental health referrals were significantly more likely in the feedback group (OR 1.73, 95% CI 1.11 to 2.70) | 1215
(2 studies) | ⊕⊕⊕⊝ moderate7 | |
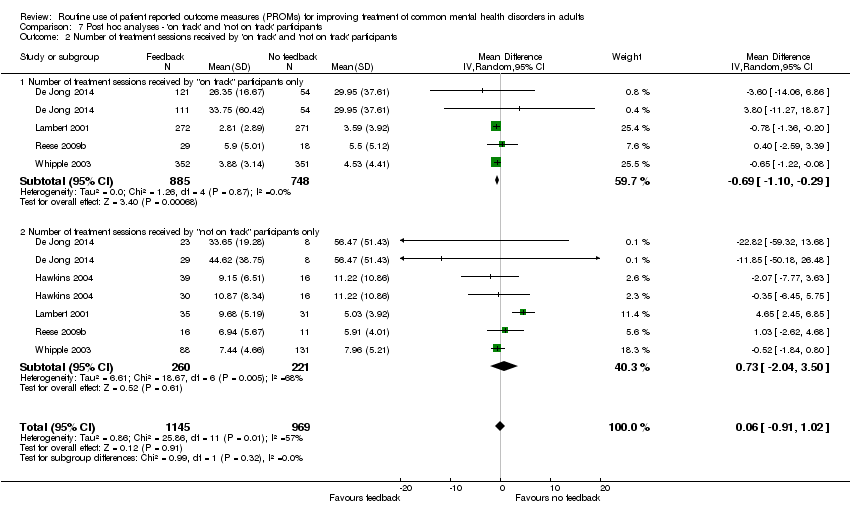
| Changes in the management of CMHDs
Number of treatment sessions received Follow‐up: 1‐6 months2 | Mean in no‐feedback groups ranged from 3.7 to 33.5 treatment sessions | Mean difference in number of treatment sessions in feedback groups was 0.02 lower
(0.42 lower to 0.39 higher) | 2608
(7 studies) | ⊕⊕⊝⊝
low10 | Post‐hoc analysis. Changes in medication and referrals for additional therapy were not assessed by any of these studies |
| CI: Confidence interval |
| GRADE Working Group grades of evidence
High quality: Further research is very unlikely to change our confidence in the estimate of effect.
Moderate quality: Further research is likely to have an important impact on our confidence in the estimate of effect and may change the estimate.
Low quality: Further research is very likely to have an important impact on our confidence in the estimate of effect and is likely to change the estimate.
Very low quality: We are very uncertain about the estimate. |